Báo cáo sinh học: "Haplotype diversity of the myostatin gene among beef cattle breeds" ppt
Bạn đang xem bản rút gọn của tài liệu. Xem và tải ngay bản đầy đủ của tài liệu tại đây (349.52 KB, 16 trang )
Genet. Sel. Evol. 35 (2003) 103–118 103
© INRA, EDP Sciences, 2003
DOI: 10.1051/gse:2002038
Original article
Haplotype diversity of the myostatin gene
among beef cattle breeds
Susana D
UNNER
a∗
, M. Eugenia M
IRANDA
a
, Yves A
MIGUES
b
,
Javier C
AÑÓN
a
, Michel G
EORGES
c
, Roger H
ANSET
d
,
John W
ILLIAMS
e
, François M
ÉNISSIER
f
a
Laboratorio de genética molecular, Facultad de Veterinaria,
Universidad Complutense de Madrid, 28040 Madrid, Spain
b
Labogena, 78352 Jouy-en-Josas Cedex, France
c
Department of genetics, Faculty of Veterinary Medicine,
University of Liège (B43), 20 Bd de Colonster, 4000 Liège, Belgium
d
Herdbook BBB, 4 rue Champs Elysées, 5590 Ciney, Belgium
e
Roslin Institute, EH25 9PS Midlothian, UK
f
Institut national de la recherche agronomique,
Station de génétique quantitative et appliquée, Domaine de Vilvert,
78352 Jouy-en-Josas Cedex, France
(Received 11 January 2002; accepted 2 August 2002)
Abstract – A total of 678 individuals from 28 European bovine breeds were both phenotyped
and analysed at the myostatin locus by the Single Strand Conformation Polymorphism (SSCP)
method. Seven new mutations were identified which contribute to the high polymorphism (1 SNP
every 100 bp) present in this small gene; twenty haplotypes were described and a genotyping
method was set up using the Oligonucleotide Ligation Assay (OLA) method. Some haplotypes
appeared to be exclusive to a particular breed; this was the case for 5 in the Charolaise (involving
mutation Q204X) and 7 in the Maine-Anjou (involving mutation E226X). The relationships
between the different haplotypes were studied, thus allowing to test the earlier hypothesis on the
origin of muscular hypertrophy in Europe: muscular hypertrophy (namely nt821(del11)) was
mainly spread in different waves from northern Europe milk purpose populations in most breeds;
however, other mutations (mostly disruptive) arose in a single breed, were highly selected and
have since scarcely evolved to other populations.
muscular hypertrophy / myostatin gene / haplotype diversity / beef cattle breeds
1. INTRODUCTION
The bovine muscular hypertrophy (mh) syndrome has been widely doc-
umented since it was first described [1,17,18,25]. It occurs at different
frequencies in many European cattle breeds. It was first believed that the
∗
Correspondence and reprints
E-mail:
104 S. Dunner et al.
syndrome had the same origin and mutation [8,11] until recently. When the
gene underlying the trait was identified as myostatin [14,21,24], it was found
to have a surprisingly high number of polymorphisms [15]. Some changes
at the nucleotide level truncate the protein product resulting in a lack of its
expression and in the known muscular hypertrophy phenotype.
In the many cattle breedsin which it appears, the mh phenotype shows differ-
ences in intensity probably due to differences in selection pressure maintained
during generations on related traits that vary depending on market necessities as
well as on management requirements. In particular, many breeders have tried
to limit the occurrence of dystocia, which decreases the economical value of
the mh phenotype. As a consequence, some breeds which are well adapted to
the binary local management and muscular hypertrophy (e.g. Asturiana de los
Valles, Parthenaise or Blanc Bleu Belge), show a high frequency of the mutated
gene in their population while others have a very low frequency of any mutation
(Pirenaica or Bazadaise). Since a large pleiotropic effect is observed, genotype
identification of the mh gene is important to avoid difficulties when selection on
this gene is practised, whether fixation, elimination or introgression is desired.
Six disruptive mutations were described earlier [4,15,21] in different breeds
and explain the most extreme phenotypes. However, some individuals in
different breeds do show a phenotype not corresponding to their genotype at
the known polymorphic sites.
To analyse all these cases and search all other possible mutations that
could explain the different phenotypes, we screened the entire coding region
and splice sites for mutations in the gene in a large number of breeds by
using the Single Strand Conformation Polymorphism (SSCP) technique. This
method makes the detection of previouslydescribed mutations easy and enables
unknown mutations to be identified in new individuals. All the mutations
identified were defined in haplotypes and were later grouped according to
their possible link with particular phenotypes. An easy and fast method of
genotyping based on an oligonucleotide ligation assay (OLA, [16]) which
describes the complete myostatin genotype was used to screen the samples,
allowing population analysis at the gene level. The greater the knowledge of
this gene, the better the management will be, allowing other genes with smaller
effects on muscular development to be identified. This study also used distance
information estimated from the nucleotide differences between haplotypes to
reconstruct the evolutionary history of the bovine populations, allowing the
earlier hypothesis on the origin of muscular hypertrophy in Europe to be tested.
2. MATERIALS AND METHODS
2.1. Animals
A total of 678 animals from 28 breeds were used in this study; 4 Spanish
breeds: Asturiana de los Valles (AV), Asturiana de la Montaña (AM), Rubia
Myostatin diversity in beef cattle 105
Gallega (RG) and Pirenaica (PI); 12 French breeds: Aubrac (AU), Baza-
daise (BZ), Blonde d’Aquitaine (BA), Bretonne Pie Noire (BR), Charolaise
(CH), Gasconne (GA), Inra95 sire line (IN95), Limousine (LI), Maine-Anjou
(MA), Normande (NO), Parthenaise (PA) and Salers (SA); 2 Belgian breeds
represented by the Blanc Bleu Belge Mixte (BBB mixte) and by the Blanc
Bleu Belge culard (BBB); 9 British breeds: Aberdeen Angus (AA), Ayrshire
(AY), British Shorthorn (BS), Devon (DE), Galloway (GL), Hereford (HE),
Traditional Hereford (HT), Longhorn (LH) and South Devon (SD) and 1
Italian: Marchigiana (MG). Amongst these individuals, a total of 505 indi-
viduals belonging to AV, AM, RG, PI, BZ, CH, GA, IN95, MA, and PA
were previously phenotyped according to the Euromh (BIO4-CT98–0421)
scoring system (Ménissier, unpublished results). Briefly, all animals were
scored for three phenotypic traits: (1) general body conformation (animal
general classification, muscling depth, back width); (2) muscle expression
(shoulder muscle depth, longissimus dorsi and great dorsal hypertrophy, thigh
circumference, croup slope, inter-muscular definition) and (3) hypertrophy
associated traits (bone size, tail position, posture and gait, abdomen shape,
skin type). Each class was scored from 0 (no hypertrophic signs) to 2 (high
double muscling) and a general mean note called the Phenotypic score (PS) was
produced. Although phenotypes often differ dramatically from one breed to
another, this phenotype scoring allowed different sets of animals that belonged
to four different categories (0–0.5; 0.5–1; 1–1.5; > 1.5) to be chosen for each
breed.
2.2. SSCP
All 678 individuals were analysed with the SSCP technique, aimed at detect-
ing all mutations present and not described, for posterior sequencing. DNA was
extracted according to standard methods [19,32]. The SSCP (single stranded
conformation polymorphism) [29,30] technique was used to allow sequence
variants to be detected from migration shifts in PCR amplified fragments of
the gene. PCR primers were designed to produce eight partially overlapping
fragments of different lengths (238 to 419 bp) (Fig. 1) based on previous
information ([12,13,15]; M. Georges unpublished information). The eight
fragments were generated from four different duplex PCR combinations of
primers (Tab. I) in a 50 µL total reaction volume containing 200 µM dNTPs,
2 mM Cl
2
Mg, 1 U Taq (Biotools), 5 to 20 pmol of each primer and 100 ng
DNA with the following PCR conditions: 94
◦
C 1
, 55
◦
C 1
and 72
◦
C 1
during
30 cycles initiated with 5
denaturing (94
◦
C) and 5
final extension at 72
◦
C.
Three microliters of each PCR sample were mixed with an equal volume of
denaturing loading buffer (0.05% xylene-cyanole, 0.05% bromophenol blue,
5.5 mM EDTA, pH 8.0, in deionised formamide), were heat-denatured at
95
◦
C for 5 min, and were snap-chilled on ice. The samples were then loaded
106 S. Dunner et al.
Table I. Primers used in multiplex for the amplification of the different fragments of the myostatin gene. Numbering of primers refer to
fragment number (shown in Fig. 1). Below, mutated primers used in the PASA technique to define the haplotypes.
Forward Primers Reverse Primers
Multiplex A 2.1for 5
-GATTGATATGGAGGTGTTCG-3
2.1rev 5
-CAACATTTGGGTTTTCCTTC-3
2.4for 5
-GAGCATTGATGTGAAGACAGTGTTG-3
2.4rev 5
-ATAAGCACAGGAAACTGGTAGTTATT-3
Multiplex B 2.2for 5
-ATTTATAGCTGATCTTCTAACG-3
2.2rev 5
-AGGATTTGCACAAACACTGT-3
2.3for 5
-CTAGTAAAGGCCCAACTGTG-3
2.3rev 5
-GCCATTCTCATCTAAAGCTT-3
Multiplex C 1.1for 5
-ATTCACTGGTGTGGCAAGTTGTCTCTCAGA-3
1.1rev 5
-TTGAGGATGTAGTGTTTTCC-3
3.1for 5
-GAAATGTGACATAAGCAAAATGATTAG-3
3.1rev 5
-AGCAGGGGCCGGCTGAACCTCTGGG-3
Multiplex D 1.2for 5
-GAACAGCGAGCAGAAGGAAAATGTGG-3
1.2rev 5
-CCCTCCTCCTTACATACAAGCCAGCAG-3
3.2for 5
-TTGTATTTTTGCAAAAGTATCCTCA-3
3.2rev 5
-ATACTCTAGGCTTATAGCCTGTGGT-3
Mutated Primers Common Primers
F94L.mut 5
-CTCCTGGAACTGATTGATCAGTTA-3
2.4rev
nt419.mutrev 5
-GTATTGTATCTTAGAGCTATTG-3
2.1for
nt821.mutrev 5
-GCATCGAGATTCTGTCACAA-3
2.1for
nt267.mut 5
-CCAAGGCTCCTCCACTCCTGGAG-3
2.4rev
nt324.mut 5
-GCAGTGACGGCTCCTTGGAAGAT-3
2.4rev
S105.mut 5
-AGAGATGCCAGCAGTGACGGCTG-3
2.4rev
Myostatin diversity in beef cattle 107
!
" #
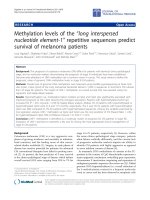
Figure 1. Myostatin gene. The top of the figure shows the three exons of the gene
with the different mutations (silent are green, missense but not disruptive are blue and
disruptive are red). The bottom of the figure shows the OLA image of an individual
obtained either in a ABI PRISM 310 or 3700 automatic sequencer. Green peaks refer to
wild type, and blue peaks refer to mutated alleles in the ligand. Red peaks belong to the
TAMRA size standard. In this example, the individual is wild type for all mutations
but also shows the mutated alleles for nt419(del7-ins10) and E226X, so it will be
considered as double heterozygote for these two mutations, but wild homozygote for
the rest. The numbers on the peaks refer to the mutation involved, indicated in the
squares.
onto non-denaturing polyacrylamide gels using the Penguin Dual-Gel Water
Cooled Electrophoresis System (OWL Scientific, Woburn, MA). A cooling
device (Cooling Plus 8–30e, Heto-Holten A/S, 3450 Allerød, Denmark) kept
the apparatus at the constant chosen temperature during the electrophoresis.
Several variables were tested in order to achieve an optimum separation of the
alleles: acrylamide concentrations (from 6 to 16%), acrylamide bis ratio (19:1,
29:1, 100:1), glycerol level (0%, 5% or 10%), electrophoresis temperature
108 S. Dunner et al.
(from 6 to 26
◦
C) and buffer conditions (0.5X or 0.6X). The bands were
visualised by silver-staining according to the method of Bassam et al. [2]
with minor modifications [3]. Silver-stained allele-specific SSCP bands were
excised from the gel, placed in 100 µL of distilled water and subjected to 95
◦
C
for 15 min, two freezing (−70
◦
C) and thawing cycles and then centrifuged
at 10 000 × g for 2 min. Five microliters of the resulting solution were PCR
re-amplified in 50 µL reactions using the corresponding primers of the excised
fragments. The PCR re-amplified allele-specific SSCP bands were purified and
sequenced in an ABI 310 DNA Sequencer using the ABI Prism Dye Terminator
Cycle Sequencing Ready Reaction kit (Perkin Elmer BioSystems) according to
the manufacturer’s instructions and were compared against known alleles for
the bovine myostatin gene (GenBank Accession n
◦
AF019620 and AF019761,
M. Georges, unpublished results).
2.3. OLA reactions
The nine mutations which were chosen in this study (Fig. 1) changed an
amino-acid and were previously screened or identified in this study [4,15,
21]. For this purpose, the primers were designed to allow strand ligation to
occur when the two probes matched exactly and thus producing a differentiated
result which was easy to interpret. The test was based on the simultaneous
amplification of the three myostatin exons using prior primers and conditions
detailed elsewhere [28].
2.4. Haplotype definition
PCR amplification of specific alleles (PASA, [36]) was performed to generate
fragments covering two exons (up to 2 kb). Six different allele specific
primers (Tab. I) were necessary to solve the combinations of variants on a
single chromosomal segment. Sequencing of the PCR fragments enabled the
different haplotypes, found among the European breeds studied, to be defined.
The evolutionary history between the different haplotypes was then analysed
using the Kimura distance [23] and their graphic representation through the
Neighbour Joining method.
3. RESULTS
Optimal SSCP electrophoresis conditions were obtained using a 12% 100:1
acrylamide-bis acrylamide ratio (in all cases but for multiplex D, where 16%
gave the best results), 10
◦
C constant temperature (24
◦
C for multiplex D), 5%
glycerol and 200 V constant voltage (4 W constant power for multiplex D).
Electrophoresis was performed on both multiplex A and B for 7 h and on mul-
tiplex C and D overnight (17 h). These conditions optimised the discrimination
Myostatin diversity in beef cattle 109
between the control alleles, allowing clear patterns corresponding to all but one
(nt748–78(del1)) polymorphism described to date (figures not shown) [26,27].
This method allowed the identification of seven new mutations (Fig. 1), five
being within the coding region. Amongst these mutations, two were missense
mutations: the first mutation referred to as S105C resulted from a C → G
transversion at coding nucleotide 314 in exon 1 and changed a Serine for a
Cysteine found in the PA breed; the second mutation found in the MA breed and
referred to as D182N resulted in a G → A transition at coding nucleotide 544
producing an amino acid change from Aspartic acid to Asparagine. Three other
mutations were silent, two were identified in Exon 1 and referred to as nt267
(A → G transition) and nt324 (C → T transition) respectively, and the third
(G → A) called nt387 was found in Exon 2. All were found in the different
French breeds: AU, BZ, SA for the first mutation, SA, AU, CH, IN95, MA for
the second; the third mutation was found in different French and British breeds
(AY, MA, SA, GL).
The other two new mutations located in the second intron and not affecting
any coding sequence, were named nt747 + 7(G-A) and nt747 + 11(A-G)
respectively, and were both found in British breeds. Most mutations described
were transitions, so the average transition to transversion in the whole coding
gene was 11:4. Transitions from G to A were more frequent (63%) than from
C to T (36%). The nucleotide differences rate along the 1764 nt of the coding
region including the splice sites was 10
−2
.
A total of twenty distinct haplotypes were unambiguously defined by using a
standard PASA technique and are shown in Table II. Figure 1 shows the typical
image of the simultaneous OLA screening for nine mutations involved in the
most frequent haplotypes and which have been classified as being important
to explain the different phenotypes. Since each primer used in this genotyping
method was specifically labelled, the interpretation of the haplotype was very
simple, each mutation being differentiated both by range and by colouras shown
in Figure 1. Once the animals were genotyped using the SSCP analysis, all
those with available phenotypic scores (a total of 505) were classified according
to the four categories shown in Table III. In some breeds, e.g., RG, CH, GA,
IN95 or MA, the phenotype was clearly explained by the myostatin genotype,
but for a large number of individuals of the AV and PA breeds the observed
phenotype was different from that expected from the genotype.
4. DISCUSSION
4.1. New mutations
The high level of polymorphism already described for the myostatin gene in
humans [12] and cattle [15] was confirmed when a large number of individuals
110 S. Dunner et al.
Table II. Haplotypes found in the myostatin gene when screening a total of 28
European bovine breeds.
nt267(A-G)
F94L
S105C
nt324(C-T)
nt374–51(T-C)
nt374–50(G-A)
nt374–16(del 1)
nt387(G-A)
nt414(C-T)
nt419(del7-ins10)
D182N
Q204X
E226X
nt747 + 7(G-A)
nt747 + 11(A-G)
nt748–78(del 11)
nt821(del11)
E291X
C313Y
1 + +
2 +
3 +
4 + + + + +
5 + + + + + +
6 + +
7 +
8 + +
9
10 + + + + + +
11 + + +
12 + +
13 + + + + + +
14 + +
15 + + + + + +
16 + +
17 + + + + + +
18 + +
19 + +
20 + +
randomly sampled from different European bovine breeds were screened. The
average number of SNP in human genes has been found to be 1 out of every 185
bases [37] and was larger here (1 out of every 100 bases) which suggests that
the high level of polymorphism shown in this gene is the result of the selection
of new occurring mutations thus increasing the variability at this locus.
All known mutations were identified and in addition seven new polymorph-
isms were described. Two of these were missense mutations in the first two
exons, which are spliced into the mature peptide. Since myostatin is a member
of the TGFβ family where nine cysteines are highly conserved across members
Myostatin diversity in beef cattle 111
Table III. Genotype and phenotype association in 13 different European bovine beef breeds. Genotype is represented both by haplotype
frequencies (only the most relevant are shown) and by presence or absence of any disruptive mutation. Phenotype is measured through
the Phenotypic Score (PS) ranging from 0 to 2 and classified in four categories.
Haplotype frequencies (%) Phenotype PS ≤ 0.5 0.5 < PS ≤ 1 1 < PS ≤ 1.5 1.5 < PS ≤ 2
1 2 3 4 5 6 7 10 Genotype
+/+
+/mh
mh/mh
+/+
+/mh
mh/mh
+/+
+/mh
mh/mh
+/+
+/mh
mh/mh
1 90 2 6 Asturiana Valles 1 5 10 2 12 2 12
10 40 46 Asturiana Montaña 20 5
2 69 16 12 Rubia Gallega 2 4 3 2 13 16
44 25 22 5 Pirenaica 18 13 2 2 3 2
100 Bazadaise 15 9 19 5
49 25 20 BBBelge mixte 1 26 16 9
5 2 89 3 Blonde d’Aquitaine 30 3
8 23 62 Charolaise 10 1 1 1 3 14
25 16 59 Gasconne 10 10 1 1 3 1 2 17
100 Limousine 9
8 7 31 50 1 1 Inra 95 8 12 8 9 6
27 52 16 Maine-Anjou 6 11 8 18
2 87 7 1 Parthenaise 3 22 1 15 12
112 S. Dunner et al.
of the gene family and among species, it would be interesting to study the
influence of the addition of a tenth cysteine residue in individuals carrying the
S105C mutation. The additional cysteine residue mayinfluence intra- and inter-
peptide binding and have an effect on function and hence on the phenotype of
the bearing individual (work currently in progress).
4.2. OLA
The OLA technique was set up according to the procedure of Grossman [16]
and Karim [22], with some modifications which allowed flexibility to screen
all different mutations as well as other polymorphisms which may be found in
the future. Nine mutations (seven already described, [4,15] and two mutations
detected using the SSCP technique), were selected for screening by the OLA
technique. From these mutations six were disruptive, and three produced an
amino acid change affecting Exon 1 and 2. The reason for including these
mutations was to confirm that when the protein adopts a particular structure, it
will have a different activity which will result in a different phenotype.
4.3. Haplotypes
Grobet et al. (1998) [15] described the wild type as the haplotype lacking any
mutation (haplotype 9 in this study) as found in the Holstein breed. However,
here we found that the Holstein breed shows a significant high frequency
of haplotype 4 (data not shown), in concordance with the results of Smith
et al. (2000a) [34]. Moreover, haplotype 3 exclusively bearing the nt374–
51(T-C) mutation was found in 34% of the total meiosis analysed (Fig. 2) and
should then be considered as the wild type allele, being much more frequent
than haplotype 2 (26% and the most frequent among disruptive haplotypes),
haplotype 4 (10.5%) and haplotype 9 (1.5%). Also, it should be noted that the
unique mutation present in haplotype 3 was found in nearly all breeds.
The disruptive haplotypes other than haplotype 2 were present in a much
lower frequency across several breeds and some were exclusive of one or a
few related breeds as is the case of haplotype 7 only found in the Maine-Anjou
or haplotype 5 in the Charolaise. Some of the disruptive haplotypes were
never associated with other mutations, for example nt821(del11) (haplotype 2)
and E226X (haplotype 7) and also among the breeds, some haplotypes never
combined (1 and 4 for example) or conversely were frequently found together
(2 and 9) also indicating the history of the breeds. Some breeds showed a
high polymorphism at the myostatin gene as for example PI probably due to
its condition as a frontier breed intensively crossed with BA individuals, or the
British LH breed [33] where a surprisingly high level of different haplotype
combinations can be found in such a small breed. In other breeds however,
Myostatin diversity in beef cattle 113
HAPLOTYPES
As t u r i a n a V a l l e s
As t u r i a n a M o n t .
Pi r e n a i c a
R u b i a g a l l e g a
Au b r a c
B a z a d a i s e
Blonde Aquitaine
Br etonne P ieN oir e
C h a r o l a i s e
G a s c o n n e
Li m o u s i n e
I n r a 9 5
M a i n e - An j o u
N o r m a n d e
Pa r t h e n a i s e
Sa l e r s
Ab er deen- Ang us
Ay r s h i r e
B e e f Sh o r t h o r n
D e v o n
G a l l o w a y
He r e f o r d
He r e f o r d t r a d .
Lo n g h o r n
So u t h D e v o n
B B B m i x t e
B B B c u l a r d
M a r c h i g i a n a
18
3
19
1
12
2
14
2
16
1
1
8
1
2
1
1
2
6
6 3
1
1
1
3 5
2
2 4
3
8
18
7
2
3
1
11
4
15
1
17
1
10
4
1
15
1
13
1
2
1
2
4
5
2 3
10
9
3
3
16
1
18
3
5
2
5
7
2
3
7
2 1
5
2
5 8
4 3
1
2
7 9
5
2 0
5 5
10
1
1
6
2
9 6
2
14
5 1
10
9
1
2
3
1
1
3
1
3
6
2 0
1
1
7
4 9
8
3
2
2 0
18
13
8
9 8
5 9
7
2 2
2 7
2 7
2 5
3 2
2 5
7
4
10
4
2
3
5
2
13
2 6
/ / H a p l o 10
50
H a p l o 15
H
a p l o 17
H a p l o 13
H a p l o 4
H a p l o 5
1
H a p l o 2
H a p l o 9
H a p l o 7
H a p l o 3
H a p l o 2 0
6 1
H a p l o 18
H a p l o 19
H a p l o 12
H a p l o 14
H a p l o 16
H a p l o 8
H a p l o 6
6 7
H a p l o 1
H a p l o 11
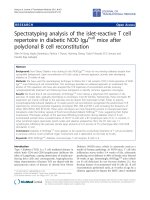
Figure 2. Frequencies of the 20 haplotypes in the 28 European bovine breeds considered and the relationships between the different
haplotypes deduced from the complete coding sequence using Kimura distance and the construction of a Neighbour Joining tree.
Bootstrap values higher then 50 are shown. Scale bar refers to the number of nucleotide substitutions per site.
114 S. Dunner et al.
there was a very low variability (e.g., CH or GA), reflecting a high selection on
this gene.
Rare haplotypes are more likely to be recently derived than those that are
frequent [39], and if we observe the haplotype pairs 15 and 16, 8 and 17, 19
and 20 we will see that they share rare but also more common mutations; this
can be the result of recombination events between existing haplotypes or show
that some sites have undergone repeated mutational events (Fig. 2).
When observing the non-disruptive haplotypes, haplotype 1 appeared in
the Aubrac, Limousine and Pirenaica breeds; the latter two breeds were sur-
prisingly those in which most individual phenotypes are not explained by a
disruptive mutation in the myostatin gene. This indicated a higher pheno-
typic influence than expected for a conservative mutation (work currently in
progress).
4.4. Introducing the phenotype
The pattern of haplotype sharing is an indicator of the history of the different
bovine populations, or breeds, so the distribution of shared haplotypes is very
useful to investigating population relationships. In the last century, different
explanations on the origin of the double-muscled phenotype in different contin-
ental beef breeds were proposed. One hypothesis is the extensive dissemination
of individuals of the Shorthorn breed used in the late 19th century to improve
most western European bovine breeds which would explain the presence of
the trait [10,25], and the other being the Friesian breed [9,20,31] or more
generally milk purpose black pied bovine populations from the Baltic plain
(Hanset, pers. comm.), being responsible for spreading the mutation all over
western Europe [25]. In order to test the hypothesis of the introduction of
the double muscling alleles from a single breed, we studied the relationships
between the different haplotypes deduced from the complete coding sequence,
using the Kimura distance (which allows to consider transitions as well as
transversions) and the construction of a Neighbour Joining tree (Fig. 2). The
examination of these relationships between the haplotypes showed haplotype
3 as the wild type from which all mutations have arisen in four defined groups:
the first cluster was missing intronic 374–51 (haplotypes 2, 9, 7 and 20); the
second cluster groups haplotypes 4, 5, 10, 13, 15 and 17 by sharing a set of
intronic mutations found together(nt374–51, nt374–50, nt374–16 and nt414), a
third group included haplotypes 1 and 11, and finally the fourth was integrated
by 19, 12, 18, 14, 6, 8 and 16. Among these four groups, one set of “old”
haplotypes appeared at equivalent times, that is those integrating the last group
and also 1, 2 and 9, while haplotypes 7, 20, 4 and 11 arose later and more
recently those haplotypes belonging to the second cluster, with 10 being the
most recent (Fig. 2).
Myostatin diversity in beef cattle 115
The consideration of these relationships between haplotypes should make
the evolution of the myostatin gene easier to understand. The existence of many
different haplotypes that are not rooted in a common mutated ancestor seems to
definitely refute a Shorthorn-Durham origin for the muscular hypertrophy phen-
otype. Although there was an important introduction of individuals belonging
to this breed across Europe at the end of the 19th century and at the beginning
of the 20th, especially in grassland (oceanic) territories, the analysis of the
myostatin gene of this breed at the present indicates the lack of any mutation.
However, the theory of a founder mutation (nt821(del11)) spreading from an
epicentre localised in the Friesian or Black Pied breed, much before its large
specialisation into milk production seems much more congruent. There is much
evidence of a hypertrophic phenotype in this population [20,38] before the
organisation of the breed and selection for high milk specialisation and before
the migration of this population into several milk breeds, (e.g., Normande or
Parthenaise) before 1950. It is important to note that during these years, most
breeds in Europe were dual purposes, and they have only recently been selected
specifically for beef or milk production. This can explain the introduction of
haplotype 2 from the Friesian breed to dairy (Normande), and beef breeds
(Aubrac, Blanc Bleu Belge, Parthenaise, Asturiana de Valles, and Rubia
Gallega), after a large diffusion of this breed before the nineteen-fifties and
later. In an attempt to improve the beef characters of some breeds, the selection
of individuals that were heterozygotes for the disruptive mutation may have
occurred through all northern and western Europe including Spain, France, the
Netherlands, Belgium, Germany and Austria. For instance, the Moyennne and
Haute Belgique breed, issued from this milk purpose population, became the
Blanc Bleu breed through fixation of mutation nt821(del11) and later selection
for mh expression [17,18]. This phenomenon has been performed through
different waves made evident when observing the large linkage disequilibrium
found in Asturiana de Valles showing a more recent introduction [11]. Other
breeds have been left apart from these migratory movements: this is the case
for the Maine-Anjou, Charolaise and Gasconne located geographically in the
French continental grasslands, in which particular mutations arose later with
no spreading to the surrounding populations, or even in some cases (e.g.,
Limousine) have never appeared. According to this hypothesis, the results
found for the British breeds were congruent since only individuals belonging
to the South Devon showed a disruptive mutation corresponding to haplotype
2 which could have been introduced from exchanges with the Friesian or Black
pied breed which have been highly documented in this country [20].
4.5. Phenotype-genotype comparison
When genotypes and phenotypic scores (Tab. III) are correlated, it seems
most likely that other loci might play a role in the development of the double
116 S. Dunner et al.
muscled phenotype. The high level of incomplete penetrance or variations in
modifier genes present in some breeds like PA (37 individuals of 53) or AV
(11 individuals of 44) showed that the expression of the muscular hypertrophy
phenotype does not arise from a single disruptive mutation in a major gene. The
high variability of phenotypic scores (ranging from 0 to 1.74 in the Charolais
culard strain for example) seems to confirm ([11,15]) the theory of a loci
heterogeneity.
Given the high influence of the myostatin gene in the good muscular con-
formation of most European bovine beef breeds, and although there have
been many efforts to identify other influencing genes and QTLs with smaller
effects [5–7,35], it seems necessary to systematically screen most individuals
in order to allow the management of this particular locus, and to possibly
evaluate the effect of this and other genes in the phenotype.
ACKNOWLEDGEMENTS
This work was supported by EU demonstration project BIO4-CT98–0421
and CICyT AGF98–1087. We thank the Spanish, French and Belgium breeders
associations for providing the samples.
REFERENCES
[1] Arthur P.F., Double muscling in cattle: a review, Aust. J. Agric. Res. 46 (1995)
1493–515.
[2] Bassam B.J., Caetano-Anollés G., Gresshoff P., Fast and sensitive silver staining
of DNA in polyacrylamide gels, Anal. Biochem. 196 (1991) 80–83.
[3] Barroso A., Dunner S., Cañón J., Technical note: Detection of bovine Kappa-
casein variants A, B, C and D by means of polymerase chain reaction -
single strand conformation polymorphism (PCR-SSCP), J. Anim. Sci. 76 (1998)
1535–1538.
[4] Cappucio I., Marchitelli C., Serracchioli A., Nardone A., Filippini F., Ajmone-
Marsan P., Valentini A., A G-T transversion introduces a stop codon at the
mh locus in hypertrophic Marchigiana beef subjects. Abstracts of the XXVIth
International Conference on Animal Genetics, 9–14 August 1998, Auckland,
New Zealand.
[5] Casas E., Keele J.W., Shackelford S.D., Koohmaraie M., Sonstegard T.S., Smith
T.P.L., Kappes S.M., Stone R.T., Association of the muscle hypertrophy locus
with carcass traits in beef cattle, J. Anim. Sci. 76 (1998) 468–473.
[6] Casas E., Shackelford S.D., Keele J.W., Stone R.T., Kappes S.M., Koohmaraie
M., Quantitative trait loci affecting growth and carcass composition of cattle
segregating alternate forms of myostatin, J. Anim. Sci. 78 (2000) 560–569.
[7] Casas E., Stone R.T., Keele J.W., Shackelford S.D., Kappes S.M., Koohmaraie
M., A comprehensive search for quantitative trait loci affecting growth and
Myostatin diversity in beef cattle 117
carcass composition of cattle segregating forms of the myostatin gene, J. Anim.
Sci. 79 (2001) 854–860.
[8] Charlier C., Coppieters W., Farnir F., Grobet L., Leroy P., Michaux C., Mni M.,
Schwers A., Vanmanshoven P., Hanset R., Georges M., The mh gene causing
double-muscling in cattle maps to bovine Chromosome 2, Mamm. Genome 6
(1995) 788–792.
[9] Dechambre, Les veaux à croupe de poulain, Rech. Méd. Vét., École Alfort, 88
(1911) 93–98.
[10] Denis B., Regards sur la «durhamisation » des bovins au XIX
e
siècle. Des leçons
pour aujourd’hui, Renc. Rech. Ruminants, 7 (2000) 8-18.
[11] Dunner S., Charlier C., Farnir F., Brouwers B., Cañón J., Georges M., Towards
interbreed IBD fine mapping of the mh locus: double-muscling in the Asturiana
de los Valles breed involves the same locus as in the Belgian Blue cattle breed,
Mamm. Genome 8 (1997) 430–435.
[12] Ferrel R.E., Conte V., Lawrence E.C., Roth S.M., Hagberg J.M., Hurley B.F.,
Frequent sequence variation in the human mysotatin (GDF8) gene as a marker
for analysis of muscle-related phenotypes, Genomics 62 (1999) 203–207.
[13] González-Cadavid N., Taylor W., Yarasheski K., Sinha-hikim I., Ma K., Ezzat S.,
Shen R., Lalani R., Asa S., Mamita M., Nair G., Arver S., Bhasin S., Organization
of the human myostatin gene and expression in healthy men and HIV-infected
men with muscle wasting, Proc. Natl. Acad. Sci. USA 95 (1998) 14938–14943.
[14] GrobetL., Royo L., Poncelet D., Pirottin D., Brouwers B., Riquet J., Schoeberlein
A., Dunner S., Ménissier F., Massabanda J., Fries R., Hanset R., Georges M., A
deletion in the myostatin gene causes double-muscling in cattle, Nat. Genet. 17
(1997) 71–74.
[15] Grobet L., Poncelet D., Royo L., Brouwers B., Pirottin D., Michaux C., Ménissier
F., Zanotti M., Dunner S., Georges M., Molecular definition of an allelic series
of mutations disrupting the myostatin function and causing double-muscling in
cattle, Mamm. Genome 9 (1998) 210–213.
[16] Grossman P.D., Bloch W., Brinson E., Chang C.C., Eggerding F.A., Fung S.,
Iovannisci D.M., Woo S., Winn-Deen E.S., High-density multiplex detection
of nucleic acid sequences: oligonucleotide ligation assay and sequence-coded
separation, Nucl. Acids Res. 22 (1998) 4527–4534.
[17] Hanset R., Michaux C., On the genetic determinism of muscular hypertrophy in
the Belgian White and Blue cattle breed. I - Experimental data, Génét. Sél. Évol.
17 (1985a) 359–368.
[18] Hanset R., Michaux C., On the genetic determinism of muscular hypertrophy II
Population data, Génét. Sél. Évol. 17 (1985b) 369–386.
[19] Jean-Pierre M., A rapid method for the purification of DNA from blood, Nucl.
Acids Res. 15 (1987) p. 9611.
[20] Kaiser, Uber die sogenannten doppellendigen Rinder, Ladw. Jbr. 17 (1888)
387–403.
[21] KambadurR., Sharma M., Smith T.P.L., Bass J.J., Mutations in myostatin (GDF8)
in double-muscled Belgian Blue Cattle, Genome Res. 7 (1997) 910–916.
[22] Karim L., Coppieters W., Grobet L., Valentini A., Georges M., Convenient
genotyping of six myostatin mutations causing double-muscling in cattle using a
multiplex oligonucleotide ligation assay, Anim. Genet. 31 (2000) 396–399.
118 S. Dunner et al.
[23] Kimura M., A simple method for estimating evolutionary rate of base substi-
tutions through comparative studies of nucleotide sequences, J. Mol. Evol. 16
(1980) 111–120.
[24] McPherron A.C., Lee S.J., Double muscling in cattle due to mutations in the
myostatin gene, Proc. Natl. Acad. Sci. USA 94 (1997) 12457–12461.
[25] Ménissier F., Present state of knowledge about the genetic determination of
muscular hypertrophy or the double muscled trait in cattle, in: King J.W.B.,
Ménissier F. (Eds.), Current Topics in Veterinary Medicine and Animal Science,
Vol. 16: Muscle hypertrophy of genetic origin and its use to improve beef
production, Martinus Nijhoff, 1982, pp. 387–428.
[26] Miranda M.E., Royo L., García-Atance P., Cañón J., Georges M., Ménissier F.,
Grobet L., Bosher M.Y., Dunner S., Análisis de la heterogeneidad alélica del
gen de la miostatina en diferentes razas bovinas europeas. VIII Jornadas sobre
Producción Animal. Zaragoza 11–13 de mayo, ITEA 20 (1999) 288–290.
[27] Miranda M.E., Cañón J., Ménissier F., Hanset R., Williams J., Dunner S.,
Identificación de los distintos haplotipos del gen de la miostatina en razas bovina
europeas. (ITEA)IX Jornadas sobre Producción Animal.Volumen Extra, Número
22-Tomo I, 2001, pp. 39–41.
[28] Miranda M.E., Amigues Y., Boscher M.Y., Ménissier F., Cortés O., Dunner S.,
Simultaneous genotyping to detect myostatin gene polymorphism in beef cattle
breeds, J. Anim. Breed. Genet. 119 (2002) 361–366.
[29] Orita M., Iwahana H., Kanazawa H., Hayashi K., Sekiya T., Detection of poly-
morphisms of human DNA by gel electrophoresis as single-strand conformation
polymorphisms, Proc. Natl. Acad. Sci. USA 86 (1998a) 2766–2770.
[30] Orita M., Suzuki Y., Sekiya T., Rapid and sensitive detection of point mutations
and DNA polymorphisms using the polymerase chain reaction, Genomics 5
(1998b) 874–879.
[31] Pyndt., Dobbeltlaarede Kalve. Maanedsskr. Dyrloeg. 19 (1907) 359–365.
[32] Sambrook J., Fritsch E.F., Maniatis T., Molecular cloning: a laboratory manual
(2nd edn.), Cold Spring Harbor Laboratory Press, Cold Spring Harbor, NY, 1989.
[33] Simon D.L., Buchenauer D., Genetics of cattle diversity, EAAP (1993) Publica-
tion number 66.
[34] Smith J.A., Lewis A.M., Wiener P., Williams J.L., Genetic variation in the bovine
myostatin gene in UK beef cattle: Allele frequencies and haplotype analysis in
the South Devon, Anim. Genet. 31 (2000a) 306–309.
[35] Smith T.P.L., Casas E., Rexroad III C.E., Kappes S.M., Keele J.W., Bovine
CAPN1 maps to a region of BTA29 containing a quantitative trait locus for meat
tenderness, J. Anim. Sci. 78 (2000b) 2589–2594.
[36] Sommer S.S., Cassady J.D., Sobell J.L., Bottema C.D.K., A novel method for
detecting point mutations or polymorphisms and its application to population
screening for carriers of phenylketonuria, Mayo Clin. Proc. 64 (1989) 1361–1372.
[37] Stephens J., Schneider J., Tanguay D., et al., Haplotype variation and linkage
disequilibrium in 313 genes, Science 293 (2001) 489–493.
[38] Thierry, Les veaux à cul de poulain, J. Agric. Prat., Paris 1 (1898) 182–184.
[39] Watterson G.A., Guess, H.A., Is the most frequent allele the oldest?, Theor.
Popul. Biol. 11 (1977) 141–160.