Báo cáo sinh học: " The efficiency of designs for fine-mapping of quantitative trait loci using combined linkage disequilibrium and linkage" doc
Bạn đang xem bản rút gọn của tài liệu. Xem và tải ngay bản đầy đủ của tài liệu tại đây (269.61 KB, 17 trang )
Genet. Sel. Evol. 36 (2004) 145–161 145
c
INRA, EDP Sciences, 2004
DOI: 10.1051/gse:2003056
Original article
The efficiency of designs
for fine-mapping of quantitative trait loci
using combined linkage disequilibrium
and linkage
Sang Hong L
∗
,JuliusH.J.vanderW
School of Rural Science and Agriculture, University of New England, Armidale, NSW 2351,
Australia
(Received 19 March 2003; accepted 1 October 2003)
Abstract – In a simulation study, different designs were compared for efficiency of fine-
mapping of QTL. The variance component method for fine-mapping of QTL was used to es-
timate QTL position and variance components. The design of many families with small size
gave a higher mapping resolution than a design with few families of large size. However, the
difference is small in half sib designs. The proportion of replicates with the QTL positioned
within 3 cM of the true position is 0.71 in the best design, and 0.68 in the worst design applied
to 128 animals with a phenotypic record and a QTL explaining 25% of the phenotypic variance.
The design of two half sib families each of size 64 was further investigated for a hypothetical
population with effective size of 1000 simulated for 6000 generations with a marker density of
0.25 cM and with marker mutation rate 4 × 10
−4
per generation. In mapping using bi-allelic
markers, 42∼55% of replicated simulations could position QTL within 0.75 cM of the true po-
sition whereas this was higher for multi allelic markers (48∼76%). The accuracy was lowest
(48%) when mutation age was 100 generations and increased to 68% and 76% for mutation
ages of 200 and 500 generations, respectively, after which it was about 70% for mutation ages
of 1000 generations and older. When effective size was linearly decreasing in the last 50 gener-
ations, the accuracy was decreased (56 to 70%). We show that half sib designs that have often
been used for linkage mapping can have sufficient information for fine-mapping of QTL. It is
suggested that the same design with the same animals for linkage mapping should be used for
fine-mapping so gene mapping can be cost effective in livestock populations.
quantitative trait loci / fine-mapping / restricted maximum likelihood / simulation / designs
1. INTRODUCTION
In the last decade, numerous QTL for economically important traits in do-
mestic species have been positioned within 30 centimorgan (cM) confidence
∗
Corresponding author:
146 S.H. Lee, J.H.J. van der Werf
intervals, using linkage analysis. However, the genomic region of 30 cM still
contains too many genes to find causal mutations; e.g. the bovine genome has
approximately 30 000∼40 000 genes and the length of the genome is approx-
imately 3000 cM [9]. The exact location and determination of the causal mu-
tation responsible for the observed effect have been reported for only a few
QTL; e.g. the double muscling gene [12], the booroola gene [20], the DGAT 1
gene [6].
In many mapping studies, it has now become pertinent to use fine-mapping
to decrease the potential genomic region containing QTL to a few cM. Re-
cently, several studies have proposed theory and methods to refine the map-
ping position of QTL [2, 13,14,17]. Among them, a variance component (VC)
method using combined LD and linkage [14] has been considered as a promis-
ing approach for fine-mapping.
VC methods which fit QTL as random effects can fully account for complex
relationships between individuals in outbred populations [5, 10]. LD mapping
can take into account the historical recombinations, the number of which is
far greater than that of pedigree-based linkage studies [21]. On the other hand,
linkage is also important because it can give extra information in addition to
the LD information especially when there are many relatives. The VC fine
mapping method combining LD and linkage has proven to result in a mapping
resolution accurate enough to narrow down the QTL confidence interval to a
few cM of the genomic region [15].
In mapping studies, design of family structure may be important for accurate
mapping resolutions. However, efficiency of different designs for fine-mapping
have hardly been reported. For coarse QTL mapping in outbred populations,
half sib designs are often used. Such designs contain also information for fine-
mapping as LD information can be used across maternal haplotypes. Besides
the design of the experiment, other properties of the population used in the
study may be important. For example, the effective size (Ne) has an important
effect on the degree of LD. Hayes et al. [7] have also shown that LD patterns
are affected by whether the population size has effectively increased (in hu-
mans) or effectively decreased (in most livestock) in recent times. Also, the
apparent age of the putative favourable QTL mutation may be relevant for the
efficiency of LD mapping as it will affect the LD pattern of marker haplotypes
surrounding the QTL.
The aim of this study is to investigate the efficiency of various experimental
designs for fine-mapping of QTL. Several hypothetical situations with varying
effective population size (Ne) and various mutation ages (MA) are used to
Efficiency of designs for fine-mapping of QTL 147
test the usefulness of existing and proposed designs in livestock for fine scale
mapping.
2. MATERIALS AND METHODS
2.1. Simulation study
There were two parts to the simulation model. The first part develops the
population in a historical sense beyond recorded pedigree. The second part
describes the population in the last generations with a family structure and
phenotypic data.
The first part of the simulation was designed to generate a variety of popu-
lations modeled by varying numbers of effective population size (Ne) and the
length of the population history. In each generation, the number of male and
female parents are equal, and their alleles were inherited to descendents based
on Mendelian segregation using the gene dropping method [11]. Unique num-
bers were assigned as mutant alleles to QTL in a given generation (depending
on mutation age). In the last generation, one of the surviving mutant alleles
was randomly chosen and treated as the favourable QTL allele. The marker
alleles were mutated at a rate of 4 × 10
−4
per generation as mutation rates have
been found in the order of 10
−3
∼10
−5
[1, 3, 19]. In the bi-allelic marker model
(e.g. single nucleotide polymorphisms), a mutated locus was substituted by the
other allele whereas in the multi-allelic marker model (e.g. microsatellites), a
new allele was added.
The second part of the simulation model was designed to enable compar-
ison of a variety of family structures with recorded data sets to be modeled
by a varying number of sires, dams and offspring. The sires and dams were
randomly selected in the last generation (t) of the first part of the simulation.
Descendents in generation t + 1 were given a phenotypic record and pedigree
was only known for these animals (i.e. animals from generations t were con-
sidered unrelated base animals).
Marker genotypes were available for animals from generation t and t+1and
phases were assumed known. When marker information is available for par-
ents and progeny, the correct linkage phase can often be assigned with a high
certainty, using closely linked multiple markers [13]. Pong Wong et al. [16]
reported that if more than 10 bi-allelic markers are used, the proportion of indi-
viduals having at least one informative marker locus to assign correct phase is
more than 90%. If multiple markers (>10) are used in a small region (<10 cM),
the assumption of known marker phase is quite reasonable. For a fair compar-
ison between experimental designs, phenotypic value was only available for
148 S.H. Lee, J.H.J. van der Werf
a fixed number of progeny in generation t + 1. Phenotypic values were simu-
lated as (1)
y = µ + q + u + e (1)
The population mean (µ) was 100, values for u were drawn from N(0, Aσ
2
u
)
with σ
2
u
= 25, and values for e were from N(0,σ
2
e
) with σ
2
e
= 50. For fixing
the variance of QTL effect (σ
2
q
= 25), the frequency of the favourable QTL
allele was estimated among the progeny. The QTL effect (α) was calculated
from V
q
= 2pqα
2
[4], and given to the animal that had a favorable QTL allele.
We only considered frequencies of the favourable QTL allele between
0.1∼0.9 because the QTL effect would become very large with more extreme
values. The QTL effect ranged from 7.07 to 11.8 in this situation. The fre-
quency between 0.1∼0.9 may be reasonable for a QTL that was previously
detected by linkage mapping [13]. The number of replicates studied was equal
to 400 for the family design part of the study, and 200 for studying population
properties.
2.1.1. Effect of family structure on efficiency of fine-mapping
Various experimental designs for fine-mapping of QTL were investigated.
Mutation occurred at generation 0. An effective population size of 100 was
applied for 100 generations in the first part of simulation. At generation 101,
full sib and half sib families were generated. The number of families was 64,
32, 16, 8 or 2 with in all cases a number of total progeny of 128 (i.e. 2, 4, 8, 16
and 64 progeny per family). Ten markers were positioned at 1 cM interval. The
proportion of replicates positioning the QTL within 3 cM of the true location
was determined in each design.
2.1.2. Properties of the population used for LD mapping
In a second part of this study, certain properties in the population used for
fine-mapping based on LD will determine the efficiency of the method. There-
fore, several populations were simulated varying in effective size and age of
the mutation. Initially, a population with effective size of 1000 was simulated
for 6000 generations (i.e. t = 6000) with various mutation ages. The mutation
occurred at the 2000th, 4000th, 5000th, 5500th, 5800th or the 5900th gener-
ation, respectively. The reason of the population history of 6000 generations
is because population properties such as haplotype homozygosity or homozy-
gosity of marker genotypes are stable after 2000 generations and a mutation
Efficiency of designs for fine-mapping of QTL 149
occurs from this time onwards (see discussion). At generation t + 1, two half
sib families of size 64 were generated. Ten bi-allelic or multi-allelic mark-
ers were positioned at 0.25 cM (or 1 cM) intervals. In each case of mutation
age, the proportion of replicated simulations positioning the QTL within three
markers (0.75 or 3 cM) of the true location was estimated. A population with
linearly decreasing Ne with the various mutation ages was tested. In the lin-
early decreasing model, Ne = 1000 decreased linearly to Ne = 100 over the
last 50 generations.
2.2. Analysis of simulated data sets
2.2.1. M ixed linear model
A vector of phenotypic observations simulated from (1) is written as,
y = Xβ + Z
1
u + Z
2
q + e (2)
where y is a vector of N observations on the trait of interest, β isavector
of fixed effects, u is a vector of n random polygenic effects for each animal,
q is a vector of n random effects due to QTL and e are residuals. The random
effects (u, q and e) are assumed to be normally distributed with mean zero and
variance σ
2
u
, σ
2
q
and σ
2
e
. X, Z
1
,andZ
2
are design matrices for the effects in β,
u,andq, respectively. From (2), the associated variance covariance matrix of
all observations (V) for a given pedigree and marker genotype set is modeled as
V = Z
1
AZ
1
σ
2
u
+ Z
2
GZ
2
σ
2
q
+ R (3)
where A is the numerator relationship matrix based on additive genetic rela-
tionships, G is the genotype relationship matrix whose elements are IBD prob-
abilities between individuals at a putative QTL, and R = Iσ
2
e
(I is an identity
matrix).
2.2.2. B uilding a genotype relationship matrix (GRM)
Meuwissen and Goddard [13] used the gene dropping method [11] to es-
timate IBD probabilities between unrelated animals based on similarity of
marker haplotypes. Using the IBD probabilities between the unrelated animals,
IBD probabilities between animals in the following generations can be recur-
sively estimated from pedigree and observed marker genotypes. Therefore,
IBD probabilities between all animals can be estimated based on combined
150 S.H. Lee, J.H.J. van der Werf
LD and linkage information. Meuwissen and Goddard [14] applied a deter-
ministic prediction method rather than genedropping to estimate IBD proba-
bilities. Although the deterministic prediction is accurate and computationally
efficient, it is not flexible for an ongoing marker mutation model (as is the case
in our study) because the change of marker allele due to mutation cannot be
accounted for in the method. Therefore, we used a genedropping method to
be able to accommodate this in the calculation of IBD probabilities. However,
there were only small differences in mapping accuracy compared and we used
the deterministic method further throughout this study.
2.2.3. GRM and the position of the QTL
There are a number of different GRMs for putative QTL positions across a
tested chromosome region. The maximum of the log likelihood and the vari-
ance components are estimated with the GRMs for the putative QTL positions.
Therefore, each putative QTL position has a maximum value for the log likeli-
hood for model parameters. Comparison of log likelihood values for all posi-
tions across the chromosome will give the most likely position.
2.2.4. Restricted maximum likelihood (REML) estimation using
an average information (AI) algorithm
By assuming multivariate normality of the data with vector Xb and variance
covariance matrix V, the resulting likelihood can be written and a numerical
procedure can be used to estimate the parameters (QTL position and variance
components). The log of the likelihood for the model in (2) can be written as,
log L(y|Xb,σ
2
q
,σ
2
u
,σ
2
e
) = −
N
2
ln(2π) −
1
2
ln |V|−
1
2
(y − Xb)
V
−1
(y − Xb)(4)
wherelnisanaturallogand|V| is the determinant of V.
An efficient algorithm to obtain REML estimates is one that uses the average
of the information (AI) from the observed derived Hessian coefficients and the
expected derived Fisher’s scoring coefficients [8]. The AI algorithm obtains
the REML estimate using the following equation:
Θ
(k+1)
= Θ
(k)
+ (AI
(k)
)
−1
∂L
∂Θ
Θ
(k)
(5)
where Θ is a column vector of variance components (σ
2
u
, σ
2
q
and σ
2
e
), k is kth
iteration,
∂L
∂Θ
is a column vector of the first derivatives of the log likelihood
Efficiency of designs for fine-mapping of QTL 151
function with respect to each variance component, and AI is the average in-
formation matrix which consists of the average of the Hessian matrix and the
Fisher information matrix.
3. RESULTS
3.1. Efficient designs for fine-mapping of QTL
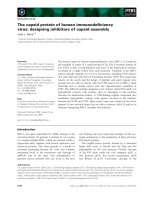
The effect of family structure on accuracy of QTL mapping is illustrated in
Figure 1. When the number of full sib families is 32 each with four individuals,
the accuracy reached a plateau. The proportion of replicated simulations with
the QTL positioned within 3 cM of the true location is 0.7. When the number
of families is 2 each with 64 individuals, this proportion is decreased to 0.55.
Hence, for combined LD and linkage mapping, many families of small size
provide more information than few families of big size. The same result was
found when mapping based on LD information only (IBD probabilities were
estimated treating all animals unrelated). However, the accuracy is slightly less
than with the combined method (Fig. 1), showing that linkage information can
help to improve the accuracy. When the results are compared with that based
on linkage information only (IBD probabilities between base animals were
assumed to be equal to zero), the accuracy and the best design are changed.
The accuracy of mapping resolution based on linkage information is highest
when the number of families is low and accuracy is much lower when the
number of families is high. This is because that if the number of progeny is
small, recombination events hardly occur in such a small region (10 cM). It
should be noted that the accuracy of 0.3 is no better than randomly positioning
the QTL within 3 cM out of 10 cM.
The results show that family structure is important as well as the information
(linkage or LD information) that is used. In mapping of QTL, when there are
few families each with large size, there is little advantage of LD mapping over
linkage mapping (the proportion of positioning QTL within 3 cM in combined
LD and linkage mapping is 7% higher than that based on linkage mapping).
However, with many families of small size, the advantage of LD mapping over
linkage mapping is large.
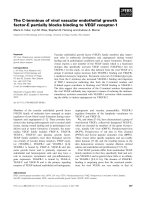
In the half sib design a large number of families each of small size also
give the higher mapping accuracy with combined LD and linkage mapping.
However, the difference between using many and using few families is much
smaller than in the full sib design. Figure 2 shows that 64 families each with
two individuals result in 70% and two families each with 64 individuals result
152 S.H. Lee, J.H.J. van der Werf
Figure 1. Accuracy of QTL mapping (as proportion of replicates with position esti-
mate within 3 cM of true value) depending on number of full sib families (total number
of individuals is 128) and using LD, linkage or a combined method for estimation.
Figure 2. Accuracy of QTL mapping (as proportion of replicates with position es-
timate within 3 cM of true value) depending on number of half sib families (total
number of individuals is 128) and using LD, linkage or a combined method for esti-
mation.
in 68% of replicates positioning the QTL within 3 cM of the true location. In
mapping based on LD information only, the accuracy is slightly reduced, but
the pattern of accuracy is the same as in combined mapping. In mapping based
on linkage information only, the accuracy is much reduced and the design with
few large families provides most information. Two families each with 64 in-
dividuals result in 34% of replicates with the QTL positioned within 3 cM
of the true location and 64 families each with two individuals result in 30%.
As noted in the full sib analysis, an accuracy of less than 0.3 does not have
any significant meaning. This lack of information from linkage is also demon-
strated by the two linkage curves reaching similar accuracies when the number
of families was more than 16.
Efficiency of designs for fine-mapping of QTL 153
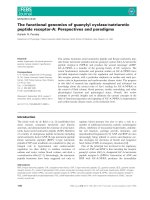
Figure 3. Proportion of replicates with QTL positioned within 0.75 cM of true posi-
tion when mutation age is varied and ten bi-allelic and multi-allelic markers are posi-
tioned every 0.25 cM. M
CONS: multi-allelic marker model with constant Ne = 1000.
M
LIND: multi-allelic marker model with linearly decreasing Ne = 1000 to 100 in
last 50 generations. B
CONS: bi-allelic model with constant Ne = 1000.
When comparing results between full and half sib designs, there is a differ-
ent pattern in the combined mapping. With few families of large size, the accu-
racy in half sib designs is much higher than that in full sib designs whereas the
difference is small for many families (e.g. with two families each with 64 indi-
viduals, the difference between full sib and half sib designs is 12.8% and with
64 families each with two individuals, the difference is 1.3%). Apparently,
with half sib mapping, few families with big size can also give a reasonable
mapping accuracy. This is likely due to the fact that in half sib designs, there
is substantial LD information in the dam population which can be used. Note
that the number of base dams is constant in the different half sib structures.
3.2. Effective population size and mutation age
In an analyses based on two half sib families of size 64, and with bi-allelic
markers positioned every 0.25 cM, the overall proportion of replicates with the
QTL positioned within 0.75 cM of the true location is 42∼55% with constant
Ne = 1000 (Fig. 3). When mutation age (MA) is less than 100 generations,
the accuracy is lowest (42%). The accuracies are higher when MA is 200 gen-
erations and 500 generations (53 and 55%, respectively) and it decreases until
MA = 1000 (49%). Beyond a mutation age of 1000 generations, the accuracy
is not significantly changed.
With low MA, the chance of common haplotypes carrying different alleles at
the QTL is larger, affecting the power of QL detection, and therefore accuracy
154 S.H. Lee, J.H.J. van der Werf
of positioning. Furthermore, with small MA the time to sufficiently break up
chromosomal segments around the QTL is smaller and IBD segments will be
longer. The relationship between Ne and the length of a chromosomal region
that is IBD can be described as [7, 18]
LD = 1/(4 ∗ Ne ∗ c + 1), (6)
where c is length of the region (Morgan) and Ne is effective population size
at the time of mutation. The length of the haplotype that is not broken up by
recombination depends on mutation age: c = 1/(2∗MA). LD is defined here as
the probability of a region of length c being IBD when two random haplotypes
are taken from the population. For example, for Ne = 1000, LD = 0.05 in
case of MA = 100, and the length of the IBD region (c) is 0.5 cM while
in case of MA = 200, LD is 0.09 and c is 0.25 cM. When mutation age is
higher, the degree of LD is higher, and the length of the IBD region is smaller.
Therefore, the haplotype having the mutation can be distinguished by smaller
chromosome segments as MA increases. However, ongoing marker mutation
will disturb haplotype similarity of animals that are IBD. This may explain the
lower accuracy for larger values of MA (>1000 generations) (Fig. 3).
When multi-allelic markers are positioned every 0.25 cM, overall accu-
racy is improved compared with using bi-allelic markers (Fig. 3). When only
100 generations passed since the mutation, the accuracy is low (48%). After
200 generations since the mutation, the accuracy is improved (68%) and high-
est at a mutation age of 500 generations (76%). For the same reason as in the
bi-allelic case, the accuracy is slightly lower for higher values of MA (e.g.
72% for MA = 1000; 72% for MA = 2000; 69% for MA = 4000). Compared
with mapping using bi-allelic markers, the pattern of accuracy is similar, how-
ever, the accuracy under the multi-allelic marker model is much higher. This is
likely due to the fact that a high polymorphism under the multi-allelic model
can help to distinguish the original haplotypes where mutation occurred from
other haplotypes.
When Ne was linearly decreased over the last 50 generations (from 1000
to 100), overall accuracy was lower than with constant Ne (Fig. 3). With de-
creasing Ne more haplotypes come from recent ancestors and the population
has lost more haplotypes that come from more distant ancestors. This situa-
tion is improved when MA is older because the degree of LD is higher and
the IBD region is smaller. It is noted that the accuracy increases linearly which
is different from CONS. This is likely due to the fact that the accuracy was
not interrupted by marker mutation because most haplotypes come from re-
cent ancestors. In the case of MA = 100, the accuracy of M
LIND somehow
Efficiency of designs for fine-mapping of QTL 155
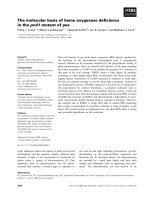
Figure 4. SD of positioning QTL when mutation age is varied and ten multi-allelic
markers are positioned every 1 cM and 0.25 cM.
increases compared with that in M CONS. With lower MA, a smaller effec-
tive size is more advantageous, as the chance of having different alleles at the
QTL for the same haplotypes is decreased. However, the accuracy in the case
of MA = 100 is lower compared with older mutations (Fig. 3, M
LIND).
Figure 4 shows standard deviation (SD) of positioning the QTL when multi-
allelic markers are positioned at 1 cM intervals and 0.25 cM intervals, respec-
tively. Because different marker spacing made it difficult to directly compare
the proportion of positioning within three brackets, we calculated SD of posi-
tioning the QTL assuming that position error is normally distributed. As shown
in Figure 4 the SD of QTL position is much higher with a marker spacing of
1 cM compared with a marker spacing of 0.25 cM across all values of MA.
In the case of Ne = 1000, the degree of LD for an IBD region of more than
1 cM is 2.5% (6). This probability is too low to correctly position QTL with
a marker spacing of 1 cM. However, the degree of LD for the IBD region of
more than 0.25 cM is higher (9%), hence the IBD region is more informative
as there will be more phenotypic data available for each haplotype.
4. DISCUSSION
The present study proposed a design of family structure that is common in
livestock populations and could give a reasonable mapping resolution in the
joint fine-mapping method using LD and linkage. In general, the accuracy of
fine-mapping of QTL depends on sampling haplotypes from a population that
has a certain degree of LD between the trait mutation and flanking markers.
The sampling error can be reduced by using a large number of base animals
(unrelated animals). Because the number of independent base dams is larger
156 S.H. Lee, J.H.J. van der Werf
Figure 5. Haplotype homozygosity and homozygosity in marker genotypes during pe-
riod of population history. Bi-allelic and multi-allelic markers are used and the length
of haplotype is 0.25 cM. B
MH: homozygosity in bi-allelic markers. B HH: haplotype
homozygosity in bi-allelic markers. M
MH: homozygosity in multi-allelic markers.
M
HH: haplotype homozygosity in multi-allelic markers.
in half sib designs, the accuracy in half sib designs is higher than that in full
sib designs, especially when the number of families is low. Half sib designs
are frequently used for linkage mapping in livestock, and the present study
shows that such designs can also have sufficient information for fine-mapping.
It is cost effective when the same design used in linkage mapping can also be
used for fine-mapping. Of course a further requirement is that the QTL alleles
segregate in the dam population used in the half sib design.
We simulated a population with effective size of 1000 for 6000 generations.
The reason for 6000 generations of population history is to stabilize the ho-
mozygosity in markers and haplotype homozygosity. Figure 5 shows that in
the first 2000 generations, homozygosity changes significantly in both cases
(bi-allelic and multi-allelic markers). However, after 2000 generations, the
homozygosity is stable. Favourable mutations were implemented in this study
at generation 2000 or later. After 6000 generations, the average homozygosity
was 0.6 in bi-allelic markers and 0.4 in multi-allelic markers, with in the latter
case the number of alleles being 5∼15 with constant Ne and 3∼7 with linearly
decreasing Ne. These results agree with those of Hayes et al. [7].
When different effective sizes are compared, the accuracy of mapping is
not very much affected (Fig. 6). The effective size determines the LD val-
ues as described in (6), i.e. the likelihood of finding identical haplotypes in
the population. For example, when considering haplotypes of 0.25 cM length,
LD = 0.09 when Ne = 1000, meaning that 9% is IBD when two random hap-
lotypes are taken from the population. Similarly, LD = 0.05 when Ne = 2000,
Efficiency of designs for fine-mapping of QTL 157
Figure 6. Proportion of replicates with QTL positioned within 0.75 cM of true position
when Ne = 500, Ne = 1000 and Ne = 2000. Ten multi-allelic markers are positioned
every 0.25 cM.
and LD = 0.17 when Ne = 500. With a marker spacing of 0.25 cM, the map-
ping accuracy across MA is more accurate with Ne = 1000 than with when
Ne = 2000 (Fig. 6). For Ne = 1000, LD is higher and for a given haplotypes
there will be more identical IBD haplotypes, giving more information about
each of them. Hence power and accuracy of detecting a QTL are increased.
However, in the case of Ne = 500, higher LD (0.17) did not give a better result
than with Ne = 1000 until MA is around 1500 generations. This is probably
because there are fewer different haplotypes with small Ne (and high LD), and
similar haplotypes have more chance of carrying different QTL alleles, both
causing a decreased accuracy of QTL mapping. With small Ne where haplo-
types come from recent ancestors, the accuracy was less interrupted by marker
mutation (this situation is similar to M
LIND). Therefore, the accuracy is lin-
early increased, and when MA is more than 1500 generations, the accuracy is
higher when Ne = 500 than that with Ne = 1000.
With higher effective size, sampling error of haplotypes increases with the
same number of animals in generation t+1 used for fine-mapping, which partly
explains the lower accuracy for Ne = 2000. The other reason is the lower LD
values for larger Ne. A higher LD (e.g. 0.09) can be obtained with a marker
spacing of 0.125 cM from (6). This implies that if marker spacing becomes
more dense, the accuracy can be improved for higher effective sizes. However,
the relationship between the degree of LD and accuracy has not been empiri-
cally shown. Further study is required to determine optimal marker spacing and
the number of base animals for a better mapping resolution, given the effective
size.
158 S.H. Lee, J.H.J. van der Werf
Figure 7. IBD probability for a number of identical flanking markers pairs when
Ne = 1000 with MA = 200 in multi-allelic and bi-allelic marker model (using
100 replications of genedropping method).
In the bi-allelic marker model, the accuracy was lower compared with that
in the multi-allelic marker model (Fig. 3). This is probably caused by the fact
that in the bi-allelic case, there were relatively many more non-informative
markers. This can also be explained by a QTL IBD probability curve. Figure 7
shows a plot of IBD probability against the length of the marker haplotypes.
QTL IBD probability for a number of identical flanking marker pairs was esti-
mated by the genedropping method (Ne = 1000 and MA = 200). The slope of
the QTL IBD curve in the multi-allelic marker model is steeper than that in the
bi-allelic marker model, meaning that there is more information in the multi-
allelic marker model. The accuracy of mapping was 0.68 for multi-allelic and
0.53 for bi-allelic markers when MA = 200 (Fig. 3).
The QTL allele substitution effect considered in this study was relatively
high (0.7–1.2 phenotypic SD) and a high mapping accuracy was achieved with
relatively few animals genotyped and phenotyped. Table I shows mapping ac-
curacy for alternative sizes of QTL effect and different data set sizes. When the
number of animals with phenotypic values in generation t + 1 is increased, the
accuracy also increases significantly. Table I shows that the accuracy is 0.72,
0.85 and 0.94 for CONS; and 0.64, 0.78 and 0.86 for LIND when the size
of the data set is 128, 256 and 384, respectively. These results are different
from those of Meuwissen and Goddard [13] who reported that with a maker
spacing of 0.25 cM, the change of the number of animals did not affect the
accuracy. These authors used an effective size of 100 and bi-allelic markers
without mutation. In our study we used a bigger effective size and multi-allelic
Efficiency of designs for fine-mapping of QTL 159
Tab le I . Proportion of replicates with the QTL positioned within 0.75 cM when the
number of animals changes and the size of QTL effect changes, respectively (MA =
1000 and 10 multi-allelic markers are positioned at every 0.25 cM).
CONS
b
LIND
c
QTL effect (σ
P
)QTLeffect (σ
P
)
No. animals
a
0.7∼1.20.450.7∼1.20.45
128 0.72 0.34 0.64 0.40
256 0.85 0.48 0.78 0.52
384 0.94 0.76 0.86 0.66
a
One progeny / dam and 64 progeny / sire;
b
constant Ne = 1000;
c
linearly decreasing from
Ne = 1000 to Ne = 100 in the last 50 generations.
markers, which gives more chance to detect recombination between the QTL
and flanking markers. In addition, we used an ongoing marker mutation model
with Ne = 1000 for 6000 generations, therefore, the population properties such
as haplotype homozygosity or homozygosity in markers can be different from
their model. Table I also shows that accuracy is lower for smaller QTL ef-
fects, although mapping accuracy is still reasonably high with phenotypic and
genotypic data on as few as 384 animals.
Ne and MA will generally be unknown in real life situations. For all cases,
we used Ne = 100 and MA = 100 to estimate GRM. When comparing the
mapping results obtained with this assumption with the mapping resolution
using a GRM based on true population parameters for Ne and MA, the accu-
racy was not changed. This result agrees with Meuwissen and Goddard [13]
who reported that the VC fine-mapping method is robust to assumptions about
Ne and MA.
In our simulation, we did not consider artificial selection. In real livestock
populations, selection has been carried out for the last several generations
(50∼100 generations). The selection effect can influence population LD in-
formation and a further study is required to investigate the relationship.
5. CONCLUSION
In the present study, we showed that the half sib design of few sires mated
to a large number of dams could be efficiently used for fine-mapping of QTL.
After the population has a certain degree of LD between the trait mutation
and flanking markers (around 200 generations since the mutation), QTL can
be positioned within 0.75 cM of the true location with 70∼75% of certainty
with constant Ne = 1000, and 60∼70% of certainty with decreasing Ne. Under
160 S.H. Lee, J.H.J. van der Werf
a bi-allelic marker model, mapping resolution was poorer (40∼55%). When
the number of animals used for fine-mapping increases, the accuracy will be
increased.
It can be suggested that the same design with the same animals used in
linkage mapping can be used for fine-mapping of the QTL. This would make
the mapping of QTL to narrow genomic regions cost effective.
ACKNOWLEDGEMENTS
The authors would like to thank Prof. Mike Goddard and Dr. Ben Hayes
for useful discussion about ongoing marker mutation model. S.H. Lee thanks
UNE research assistantship (UNERA). Useful comments from reviewers are
much appreciated.
REFERENCES
[1] Dallas J.F., Estimation of microsatellite mutation rates in recombinant inbred
strains of mouse, Mamm. Genome. 3 (1992) 452–456.
[2] Darvasi A., Experimental strategies for the genetic dissection of complex traits
in animal models, Nat. Genet. 18 (1998) 19–24.
[3] Ellegren H., Mutation rates at porcine microsatellite loci, Mamm. Genome. 6
(1995) 376–377.
[4] Falconer D.S., Mackay T.F.C., Introduction to quantitative genetics, 4th edn.,
Longman, 1996.
[5] George A.W., Visscher P.M., Haley C.S., Mapping quantitative trait loci in com-
plex pedigrees: a two-step variance component approach, Genetics 156 (2000)
2081–2092.
[6] Grisart B., Coppieters W., Fanir F., Karim L., Ford C., Berzi P., Cambisano N.,
Mni M., Reid S., Simon P., Spelman R., Georges M., Snell R., Positional candi-
date cloning of a QTL in dairy cattle: Identification of a missense mutation in the
bovine DGAT1 gene with major effect on milk yield and composition, Genome
Res. 12 (2001) 222–231.
[7] Hayes B.J., Visscher P.M., McPartlan H., Goddard M.E., A novel multi-locus
measure of linkage disequilibrium to estimate past effective population size,
Genome Res. 13 (2003) 635-643.
[8] Johnson D.L., Thompson R., Restricted Maximum Likelihood Estimation of
variance components for univariate animal models using sparse matrix tech-
niques and average information, J. Dairy. Sci. 78 (1995) 449–456.
[9] Kappes S.M., Corrales N.L.L., Heaton M.P., Beattie C.W., Estimation of ge-
nomic coverage and genetic length of the bovine genome, in: Plant & Animal
Genome VI Conference, January 18–22, San Diego, CA, USA, 1998, p. 298.
Efficiency of designs for fine-mapping of QTL 161
[10] Lynch M., Walsh B., Genetics and analysis of quantitative traits, 1st edn., Sinauer
Associates, Sunderland, 1998.
[11] MacCluer J.W., VanderBerg J.L., Read B., Ryder O.A., Pedigree analysis by
computer simulation, Zoo Biol. 5 (1986) 147–160.
[12] McPherron A.C., Lee S.J., Double muscling in cattle due to mutations in the
myostatin gene, Proc. Natl. Acad. Sci. 94 (1997) 12457–12461.
[13] Meuwissen T.H.E., Goddard M.E., Fine scale mapping of quantitative trait loci
using linkage disequilibria with closely linked marker loci, Genetics 155 (2000)
421–430.
[14] Meuwissen T.H.E., Goddard M.E., Prediction of identity by descent probabilities
from marker haplotypes, Genet. Sel. Evol. 33 (2001) 605–634.
[15] Meuwissen T.H.E., Karlsen A., Lien S., Olsaker I., Goddard M.E., Fine mapping
of a quantitative trait locus for twinning rate using combined linkage and linkage
disequilibrium mapping, Genetics 161 (2002) 373–379.
[16] Pong-Wong R., George A.W., Woolliams J.A., Haley C.S., A simple and rapid
method for calculating identity-by-descent matrices using multiple markers,
Genet. Sel. Evol. 33 (2001) 453–471.
[17] Riquet J., Coppieters W., Cambisano N., Arranz J J., Berzi P., Davis S.K.,
Grisart B., Fanir F., Karim L., Mni M., Simon P., Taylor J.F., Vanmanshoven
P., Wagenaar D., Womack J.E., Georges M., Fine mapping of quantitative trait
loci by identity by descent in outbred populations: application to milk production
in dairy cattle, Proc. Natl. Acad. Sci. 96 (1999) 9252–9257.
[18] Sved J.A., Linkage disequilibrium and homozygosity of chromosome segments
in finite population, Theor. Popul. Biol. 2 (1971) 125–141.
[19] Weber J.L., Wong C., Mutation of human short tandem repeats, Hum. Mol.
Genet. 2 (1993) 1123–1128.
[20] Wilson T., Wu X.Y., Juengel J.L., Ross I.K., Lumsden J.M., Lord E.A., Dodds
K.G., Walling G.A., McEwan J.C., O’Connell A.R., McNatty K.P., Montgomery
G.W., Highly prolific booroola sheep have a mutation in the intracellular kinase
domain of bone morphogenetic protein IB receptor (ALK-6) that is expressed in
both oocytes and granulose cells, Biol. Reprod. 64 (2001) 1225–1235.
[21] Xiong M., Guo S.W., Fine-scale genetic mapping based on linkage disequilib-
rium: theory and applications, Am. J. Hum. Genet. 60 (1997) 1513–1531.