Báo cáo sinh học: " A genetic and spatial Bayesian analysis of mastitis resistance" pdf
Bạn đang xem bản rút gọn của tài liệu. Xem và tải ngay bản đầy đủ của tài liệu tại đây (823.39 KB, 16 trang )
Genet. Sel. Evol. 36 (2004) 527–542 527
c
INRA, EDP Sciences, 2004
DOI: 10.1051/gse:2004015
Original article
A genetic and spatial Bayesian analysis
of mastitis resistance
Solve S
a∗
, Arnoldo F
b
a
IKBM, Agricultural University of Norway, PO Box 5003, 1432 Ås, Norway
b
Section of Medical Statistics, University of Oslo, and Norwegian Computing Center,
Oslo, Norway
(Received 3 December 2003; accepted 26 April 2004)
Abstract – A nationwide health card recording system for dairy cattle was introduced in Nor-
way in 1975 (the Norwegian Cattle Health Services). The data base holds information on mas-
titis occurrences on an individual cow basis. A reduction in mastitis frequency across the pop-
ulation is desired, and for this purpose risk factors are investigated. In this paper a Bayesian
proportional hazards model is used for modelling the time to first veterinary treatment of clin-
ical mastitis, including both genetic and environmental covariates. Sire effects were modelled
as shared random components, and veterinary district was included as an environmental effect
with prior spatial smoothing. A non-informative smoothing prior was assumed for the baseline
hazard, and Markov chain Monte Carlo methods (MCMC) were used for inference. We pro-
pose a new measure of quality for sires, in terms of their posterior probability of being among
the, say 10% best sires. The probability is an easily interpretable measure that can be directly
used to rank sires. Estimating these complex probabilities is straightforward in an MCMC set-
ting. The results indicate considerable differences between sires with regards to their daughters
disease resistance. A regional effect was also discovered with the lowest risk of disease in the
south-eastern parts of Norway.
disease resistance / genetic effect / Markov chain Monte Carlo / spatial smoothing / survival
analysis
1. INTRODUCTION
Mastitis is an infectious disease causing an inflammation in the mammary
glands of dairy cattle. The typical consequence is reduced milk quality and
yield. Since mastitis is a frequent disease, the economic loss due to the reduced
production can be substantial. Increasing the disease resistance among dairy
cattle is therefore desirable.
The pathogens causing mastitis are various species of bacteria, but a cow’s
susceptibility to the disease also depends on many other factors. It is known
∗
Corresponding author:
528 S. Sæbø, A. Frigessi
that environmental factors like hygienic conditions, climate and stock size,
among others, are influential [1, 17, 18]. In addition the disease susceptibil-
ity may be genetically dependent, in which case disease resistance could be
improved by animal selection through breeding programmes.
Mastitis in first lactation cows has been studied by several authors, and usu-
ally mastitis is treated as a binary occurrence variable [4, 9, 10]. However, due
to cows leaving the study for various reasons (random censoring) the data are
incomplete, which may lead to biased results if such observations are left out
or treated as non-occurrences. This strongly motivates using survival analy-
sis methodology, as we do here, where mastitis resistance is considered as a
survival trait. Survival models elegantly handle censored observations.
The effects of both environmental and genetic factors on mastitis resistance
were analysed by means of a proportional hazards model. The purpose of this
study was twofold: (1) construct an informative criterion for ranking of breed-
ing animals which reflect their genetic potential with respect to mastitis resis-
tance and (2) conduct a geographical analysis of mastitis (within Norway) in
order to investigate any spatial patterns of the disease.
The genetic evaluation of breeding animals related to continuous phenotypic
values has become routine using linear mixed models, and prediction of animal
specific genetic values by means of the best linear unbiased predictor (BLUP)
is straight forward [8]. The prediction of random effects using classical meth-
ods is, however, more complicated when the response is a binary variable or
a censored survival time variable. For such problems adopting a Bayesian ap-
proach has proven to be a fruitful strategy [15,19]. Not only does the Bayesian
approach in conjunction with Markov chain Monte Carlo (MCMC) methods
make the analysis feasible, but as we show in this paper, posterior probabilities
on the ranking of animals can easily be derived from the MCMC output. We
found these probabilities more informative than the mere ranking of animals
based on their genetic values which is usually presented.
The environmental variation due to herd effects is not explicitly considered,
only at an aggregated veterinary districts level. In the spatial analysis it was as-
sumed that geographically adjacent veterinary districts have similarities with
respect to environmental conditions, and aprioridependencies between dis-
tricts were included. The presented methodology can easily be extended to
further hierarchical levels, such as herds, but a full analysis is left to a future
study and the results should thus be regarded as “first results”.
In Section 2 we suggest a proportional hazards model, with a smooth prior
on a piecewise constant baseline hazard. The regression includes a genetic
and a spatial effect. The sire effect is modelled with the help of the known
Bayesian analysis of mastitis resistance 529
pedigree. The spatial effect is based on veterinary districts and captures cli-
matic, environmental, herd and veterinary practice factors. Bayesian inference
is performed by means of MCMC, as explained in Section 3. In Section 4 we
suggest to study posterior rankings of sires, in terms of their effects on mastitis
resistance and to individuate the posterior probability of being among the top
10% sires as a guideline for cattle management. The results are reported in Sec-
tion 5. We close the paper with a short discussion of the limits and potentials
of our approach.
2. DATA AND MODEL
The data were extracted from the data set analysed by Heringstad,
Klemetsdal and Ruane [9] and included records on n = 36 178 first lactation
cows of Norwegian Cattle (NRF). These were daughters of n
s
= 245 sires, and
the number of daughters per sire ranged from 22 to 205. On average, the sires
had daughters in 66 veterinary districts. For each cow the mastitis resistance
was measured as the number of days from day 31 before first calving to first
veterinary treatment of clinical mastitis. The cows were dried off (milking was
stopped) about 60 days before an upcoming calving, and the risk of mastitis is
expected to drop in the dry-period. As the mammary glands prepare for a new
lactation, the cows may have mastitis even prepartum, and it was therefore de-
cided to regard any mastitis occurrences within 31 days before the next calving
as connected to the upcoming lactation period. Hence, cows entering their sec-
ond lactation before the first occurrence of the disease were censored at day 31
before the second calving. In addition there were random right censored cows
due to culling. Some cows, most likely without a second calf, were held in
lactation for a long time yielding very large observed resistance or censoring
times. A pedigree file of the 245 sires along with 57 of their male ancestors
was available.
The mastitis resistance can be considered as a failure time variable and is
hereby denoted T. The associated hazard function h(t|x) expresses the instan-
taneous risk of failure at T = t given that no failure has occurred prior to t.
For an individual i we let t
i
represent the failure time, whereas c
i
represents
the censoring time if all we know is that t
i
> c
i
. It is convenient to express the
observed data on individual i by (y
i
,δ
i
), where
y
i
=
t
i
,ift
i
is observed
c
i
,ifc
i
< t
i
and where δ
i
is the censoring indicator taking the value 1 if the observation
is uncensored and 0 otherwise. A common approach for modelling univariate
530 S. Sæbø, A. Frigessi
survival data is the proportional hazards model [5]:
h(t|x) = h
0
(t)exp(xβ)(1)
where h
0
(t) is a baseline hazard function and β is a vector of regression coeffi-
cients. The probability of no failure by time t is given by the survival function
S (t|x). For continuous t this is given as
S (t|x) = exp
−H
0
(t)exp(xβ)
(2)
where H
0
(t) =
t
0
h
0
(u)du is the cumulative baseline hazard function.
In many situations, it is reasonable to assume apriorisome level of smooth-
ness of the baseline hazard function. There are several suggestions on how
to perform Bayesian non-parametric modelling of the baseline hazard func-
tion. These are mostly based on the assumption of a random prior process
such as the gamma process [13] or the beta process [11]. We will just as-
sume a non-informative first order smoothing prior for the log baseline hazard
of the mastitis data. More precisely, the time axis is partitioned into intervals
I
l
= (t
(l−1)
, t
(l)
] defined by the L distinct time points with observed failures t
(l)
(l = 1, ,L), where 0 < t
(1)
< t
(2)
< ··· < t
(L)
< ∞. The log baseline hazard
function is assumed piecewise constant. Let log(λ
l
) = log(h
0
(t)) for all t ∈ I
l
.
The prior density for λ = [λ
1
, ,λ
L
] is, up to normalisation, assumed to be
equal to
p(λ) ∝ exp
−
1
τ
2
λ
L
l=2
(log(λ
l
) − log(λ
l−1
))
2
. (3)
This prior is improper, has no mean and induces smoothing of the posterior
log-hazards where the degree of smoothing depends on the magnitude of the
smoothing parameter τ
2
λ
. Every level λ
l
tends to be similar to its predecessor
λ
l−1
and its successor λ
l+1
. Gustafson, Aeschliman and Levy [7] discuss a sim-
ilar model, with a smoothing performed at the level of curvature, i.e. of order
two. These authors also perform inference on τ
2
λ
, while we shall fix a value
(τ
2
λ
= 0.01) satisfactorily giving smoothing and perform sensitivity analysis
with respect to this choice.
A phenotypic value (e.g. milk yield, weight or disease resistance) of an ani-
mal is assumed to be the result of a genetic and an environmental component.
Variation across animals with regards to the phenotypic value thus reflects both
the genetic variation in the population and the excess variation due to varying
environmental conditions. Both genetic and environmental variables are there-
fore included in the regression part of the hazard (1).
Bayesian analysis of mastitis resistance 531
The additive genetic effects of the 245 sires, being the fathers of the
36 178 cows with records, were to be predicted in this study. The vector
s = [s
1
, ,s
245
] of genetic values was assumed to be distributed as s ∼
N
245
(0,σ
2
s
A) = p(s|σ
2
s
), where σ
2
s
is the additive genetic variance and A is
the additive genetic relationship matrix.
The number of heifers from each herd is limited in our data (on average
6.8). At the herd level, we expect, as is well known, a high variability due to
the small number of cows per herd. Such variability is due to the small sam-
ple size and to highly variable actual herd effects. Much of such herd effects
do vary significantly, but we assume that the effects of climate, environment,
veterinary follow-up, herd sizes and management vary smoothly over the ge-
ography of Norway, though differences between, say, north and south Norway
may be large. Herds belonging to the same district experience the same veteri-
nary treatment policy, since they are all under supervision of the same district
veterinarian. The average number of herds per district in our data was 27. It
is reasonable to assume some smoothing at the herd level. We model such
smoothing by means of aggregating herd effects within veterinary district ef-
fects and spatially smoothing at the latter level. This is similar to smoothing
at the herd level, but it incorporates explicitly the “hard” information about
boundaries between veterinary districts. It would be interesting, though, to in-
clude both smoothed veterinary district and herd effects, but this is left to a
future study.
In Norway there are 200 veterinary districts each consisting of 1−10 munici-
palities. A spatial prior is assumed for the district effects on mastitis resistance.
Because these effects include smooth climatic and environmental factors and
similar veterinary habits, a smooth surface can be assumed apriori. Regional
meetings between district veterinarians are held, which may be a source to
regional similarities, hence adjacent veterinary districts can be assumed to ex-
perience a similar district effect. Let ν
j
represent the effect of district j (for
j = 1, 200) and let ν be the (200× 1)-vector of these. The prior assumed for
ν in the analysis was
p(ν) ∝ exp
−
1
τ
2
ν
200
j=1
j
adj j
(ν
j
− ν
j
)
2
(4)
where the summing index j
adj j indicates all districts j
sharing a border
with district j. This is again a standard improper smoothing prior, the strength
of which depends on the parameter τ
2
ν
, which we fixed as τ
2
ν
= 0.1. This value
gives a balanced level of a posteriori smoothing and again sensitivity analysis
532 S. Sæbø, A. Frigessi
is performed. As mentioned before, the estimation of such smoothing param-
eters is a difficult task. Bayesian cross-validation or direct estimation are pos-
sible but computationally demanding. We performed sensitivity analysis and
found that the interpretation of our results was robust with respect to the level
of smoothing within a reasonable range.
In addition to the sire and district effects, the effect of year of first calving
(1990, 1991 or 1992), the effect of calving season (winter, spring, summer or
autumn) and the effect of the age of the cow (in months) at first calving, were
included in the regression model. This introduces eight additional parameters,
denoted by γ
k
(k = 1, 2, 3), η
m
(m = 1, 2, 3, 4) and α, respectively.
3. ESTIMATION
In the following paragraph we assume that censored observations tied with
observed failures occur immediately after these, and a censoring in the interval
(t
(l−1)
, t
(l)
] occurs at t
(l−1)
(as in Breslow [3]). Let β comprise the age effect α,
the year effects γ, the season effects η and the district effects ν. Related cows
are conditionally independent given s. The likelihood given the data y = {y
i
}
and δ = {δ
i
} (for i = 1, ,n) conditional on s is
p(y, δ|β, λ, s) =
L
l=1
λ
f
l
l
n
i=1
exp(x
i
β + s
(i)
)
δ
i
×
n
i=1
exp
− exp(x
i
β + s
(i)
)
l:t(l)≤y
i
Λ
l
(5)
where f
l
is the number of failures at time t
(l)
, x
i
is the covariate vector of
individual i and Λ
l
= λ
l
(t
(l)
− t
(l−1)
).
Let p(α), p(γ), p(η)and p(σ
2
s
) denote hyperprior distributions for α, γ, η
and for the sire variance, respectively. The joint posterior distribution for β, λ,
s and σ
2
s
is up to proportionality given by
p(β, λ, s,σ
2
s
|y, δ) ∝ p(y, δ|β, λ, s)p(s|σ
2
s
)p(σ
2
s
)p(β)p(λ)(6)
where p(β) = p(α)p(γ)p(η). Inference from (6) is performed by means of
Markov chain Monte Carlo. Specifically for our analysis, we assumed rather
non-informative hyperpriors: for the inverse of σ
2
s
a gamma prior distribution
with shape and scale parameters equal to 0.001 was chosen. For all other pa-
rameters, normal priors with mean zero and variance 1000 were assumed.
Bayesian analysis of mastitis resistance 533
4. SIRE RANKING
A first way to rank sires is by comparing posterior means of the sire effects.
Such posterior means are the Bayesian counterpart to the BLUP estimates [8]
in a non-Bayesian linear setting. Posterior means are optimal in the sense that
they minimise the posterior Bayesian risk for a quadratic loss function. How-
ever, it is difficult to say whether there really is a difference between the sires
based on the posterior means. We suggest a further criterion: we computed the
probability P
a
that each sire in turn is among the a% best ones and then use this
probability to rank sires. We believe that comparing such probabilities, that a
sire is (say) among the 10% best ones, is intuitive and easier to interpret cor-
rectly than a more abstract posterior mean effect. From P
a
one might observe
that a group of sires are more or less equal, yet superior to the rest. There is
also a second important argument: while means are computed from univariate
marginal densities, the probability P
a
is based on the full 245-dimensional
joint distribution of all sire effects and hence reveals known and unknown
dependencies.
One advantage of the MCMC based Bayesian approach is that these prob-
abilities, which cannot be expressed analytically, can easily be derived from
the MCMC-iterates of s [2]. Say we want to estimate the requested probability
for sire number 1. Let s
1,b
be the value of s
1
at iteration b (b = 1, B)and
rank(s
1,b
) the ranking of this genetic value among the corresponding values of
all sires. The estimated probability is given by
P
a
1
=
1
B
B
b=1
I
rank(s
1,b
) ≤
a
100
· n
s
(7)
where I(·) is the indicator function taking the value one if its argument is true
and zero otherwise, and n
s
is the number of sires. The posterior probability
is approximated simply with the fraction of the iterates for which the genetic
value of the sire is among the a% best.
5. RESULTS
A random walk Metropolis-Hastings (MH) algorithm was implemented.
Normal or uniform proposal distributions were used in the MH-algorithm, and
these were tuned to give an acceptance probability between 0.2 and 0.5. A to-
tal of 100 000 iterations were run after burn-in from which every 10th iterate
was saved yielding chains of length 10 000 as the basis for statistical inference.
534 S. Sæbø, A. Frigessi
0 200 400 600 800
0.000 0.010 0.020 0.030
time
(
da
y
s
)
h
azar
d
0 200 400 600 800
0.000 0.010 0.020 0.030
time
(
da
y
s
)
h
azar
d
0 200 400 600 800
0.000 0.010 0.020 0.030
time
(
da
y
s
)
h
azar
d
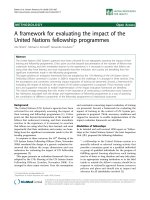
Figure 1. A non-parametric estimate of the hazard function (top) and the posterior
estimates of the baseline hazard for τ
2
λ
= 100 (center) and for τ
2
λ
= 0.01 (bottom).
Two independent chains were run with starting values equal to the state at it-
eration 30 000 of the main chain, and convergence was stated on the basis of
negligible divergence between the chains.
The lower panel of Figure 1 shows the posterior mean estimate of the base-
line hazard function for τ
2
λ
= 0.01. The autoregressive structure of the prior for
the baseline gave a smooth function compared to the non-parametric estimate
(upper panel). The effect of smoothing is especially apparent for large values
of T where the small amount of data gives highly uncertain estimates without
smoothing. The baseline hazard is fairly constant throughout the entire period
except in the days of calving where the risk of mastitis seems highly elevated.
This sudden increase in risk can be explained by physiological changes in the
Bayesian analysis of mastitis resistance 535
Table I. Posterior mean estimates of the regression parameter for the age effect, the
year effects, the season effects and the sire variance component. In addition estimates
of the standard deviation and the 2.5%- and 97.5%-percentiles of the posterior distri-
bution are given.
Parameter Mean St. dev 2.5% 97.5%
α (age) 1.6 × 10
−4
1.4 × 10
−4
−1.1 × 10
−4
4.3 × 10
−4
γ
1
(1990) –0.040 0.024 –0.086 0.0057
γ
2
(1991) 8.1 × 10
−4
0.015 –0.028 0.030
γ
3
(1992) 0.040 0.025 0.0097 0.089
η
1
(winter) –0.0093 0.020 –0.049 0.030
η
2
(spring) 0.036 0.024 –0.012 0.083
η
3
(summer) 0.0074 0.018 –0.028 0.043
η
4
(autumn) –0.035 0.019 –0.072 0.0026
σ
2
s
(sire variance) 0.057 0.0095 0.041 0.078
immune system as well as in the mammary glands of the cow [14]. Figure 1
also shows the degree of smoothing for τ
2
λ
= 100. The posterior estimate of
the baseline did not seem to be very sensitive to the prior choice of τ
2
λ
.Forthe
posterior estimates of the other variables included in the model the choice of
this smoothing parameter had only minor effects.
Some summary results from the regression analysis are given in Table I.
The analysis revealed no clear effect of the age of the cow at calving, but there
seemed to be an increased risk of mastitis over the years 1990–1992. This
increase was in accordance with the observed increase in mastitis frequency
over these years [9]. Although not as clear, there seemed to be some effect of
calving season. The risk of disease was higher for spring calving cows than for
cows calving in the autumn months.
The results showed a clear difference between the sires with the highest and
smallest genetic value. The estimated relative risk for the sire with the smallest
genetic value was 0.61 (symmetric 95% credible interval [0.45, 0.82]), while
the sire with the largest value had a relative risk of 1.41 ([1.12, 1.75]). This
indicates a 40% decrease in hazard for daughters of the most favourable sire
compared to an average sire, and an equal 40% increase in hazard for daughters
of the least favourable sire.
Table II contains the 10 top-ranked sires in measure of estimated posterior
means. For each, the estimated probabilities of being the best sire and of being
among the 10% and 20% best sires are also given. There is a substantial drop
536 S. Sæbø, A. Frigessi
Table II. The ten best sires in measure of estimated posterior means, and for each the
probabilities of being the best, among the 10% best and among the 20% best.
Sire Rank
ˆ
E(s|y, δ) Pr(best) Pr(∈ 10% best) Pr(∈ 20% best)
149 1 –0.502 0.15 0.86 0.95
79 2 –0.478 0.14 0.80 0.94
77 3 –0.453 0.07 0.78 0.91
104 4 –0.426 0.06 0.69 0.88
182 5 –0.418 0.08 0.65 0.82
102 6 –0.393 0.04 0.60 0.83
178 7 –0.363 0.05 0.50 0.73
236 8 –0.363 0.04 0.52 0.75
212 9 –0.358 0.02 0.50 0.76
238 10 –0.351 0.02 0.47 0.71
in the computed probabilities of being among the 10% or 20% best sires as we
move down Table II, and for the least favorable sire (sire 125) the probability
of being among the 20% best was found to be zero.
Sire 149 had an estimated probability of 0.15 of being the best sire. Further-
more, for sire 79 the corresponding probability was 0.14, while for the next
sire (sire 182) the probability was 0.08. Hence, sires 149 and 79 stand out as
more or less equally superior sires. Such information of subgroups of prefer-
able sires cannot be read out of the posterior means.
As can be seen from Table II the choice of a has some influence on the
sire ranks, but we observe that re-ranking occurred mainly between sires with
small differences in probabilities. For these sires, selecting one above the other
should not be very critical. The choice of a should therefore not be very cru-
cial, but a value similar to the planned fraction of sires to be selected seems
reasonable.
As expected there seemed to be a large environmental effect to the risk of
mastitis. The mean relative risks for the two most extreme veterinary districts
were 0.64 and 1.54 with symmetric 95% credible intervals [0.53, 0.75] and
[1.08, 2.18] respectively. Recall that the time variable was time to first treat-
ment of mastitis. These differences between veterinary districts could there-
fore be explained by varying treatment schemes. A low risk could reflect a
higher reluctance among veterinarians against treatment initiation, or lower
eager among farmers to report light infections, whereas it may be tradition
for more immediate actions whenever the disease is discovered and reported
Bayesian analysis of mastitis resistance 537
in other regions. This may partly be true, but is probably not the full expla-
nation. A geographical factor also seemed to be highly influential, as can be
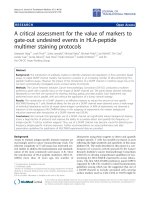
seen below. The probability of each veterinary district to be among the a%
with the lowest risk of mastitis can be computed using the analogue to equa-
tion (7). Figure 2 shows these probabilities for a = 10 plotted according to
geographic location for four different values of the spatial smoothing param-
eter τ
2
ν
.Forτ
2
ν
= 0.01 there is a strong smoothing across veterinary districts,
whereas for τ
2
ν
= 10 there is almost no smoothing effect at all. It is quite ap-
parent from these plots that geographic location is important. Even for a low
level of smoothing, the south-eastern parts of Norway seem to stand out as
regions with a low relative risk of mastitis, and this impression becomes in-
creasingly apparent as the level of smoothing goes up. Environmental factors
common to the south-eastern districts appear to lower the risk of mastitis. One
such factor may be that the dairy cattle managements in this region are few
in number, since the south-eastern parts of Norway are among the best arable
areas in the country. However, the few managements are probably large with
long traditions in milk production.
Although the value of τ
2
ν
seems to be important for the spatial smoothing, the
posterior estimates of the other parameters were not very sensitive to the prior
choice of this smoothing parameter. Only small fluctuations were detected for
the posterior means for the regression parameters and the sire variance. Fortu-
nately, the ranking of sires based on predicted effects was not very affected by
the level of spatial smoothing, as well. This can be seen from Figure 3 (lower
triangular), where pairwise comparisons of the predicted sire-effects for the
various values of τ
2
ν
are shown. Also the probabilities of being among the 10%
best were not very affected by the smoothing as shown in the upper triangle of
the same figure. More or less the same set of sires would be selected regard-
less of the value of τ
2
ν
. For instance, by comparing the groups of the 25 most
favorable sires for τ
2
ν
= 10 and τ
2
ν
= 0.01 respectively, we found an overlap of
23 sires (Fig. 4).
6. DISCUSSION
The Bayesian approach to survival analysis has in recent years become more
feasible due to the advances in computer intensive statistical methods. A good
presentation of Bayesian survival analysis theory and applications can be found
in Ibrahim et al. [12]. The use of this methodology in conjunction with animal
breeding has also gained increased attention lately. Important contributions in
that respect are Ducrocq and Casella [6] and Korsgaard et al. [15]. However,
538 S. Sæbø, A. Frigessi
Figure 2. Geographical distribution of the probabilities of being among the 10% best
districts with regards to risk of mastitis for different values of τ
2
ν
: a) 0.01, b) 0.1, c) 1
and d) 10. The borders of the map correspond to municipalities, but all municipali-
ties belonging to the same veterinary district share the same value. White regions are
municipalities without data in the analysis.
Bayesian analysis of mastitis resistance 539
0.0 0.2 0.4 0.6 0.8
0.0 0.2 0.4 0.6 0.8
0.1
0
.
01
corr=0.962
0.0 0.2 0.4 0.6 0.8
0.0 0.2 0.4 0.6 0.8
1
0
.
01
corr=0.945
0.0 0.2 0.4 0.6 0.8
0.0 0.2 0.4 0.6 0.8
10
0
.
01
corr=0.953
0.0 0.2 0.4 0.6 0.8
0.0 0.2 0.4 0.6 0.8
1
0
.
1
corr=0.962
0.0 0.2 0.4 0.6 0.8
0.0 0.2 0.4 0.6 0.8
10
0
.
1
corr=0.961
0.0 0.2 0.4 0.6 0.8
0.0 0.2 0.4 0.6 0.8
10
1
corr=0.958
−0.4 0.0 0.2
−0.4 0.0 0.2
0.01
0
.
1
corr=0.986
−0.4 0.0 0.2
−0.4 0.0 0.2
0.01
1
corr=0.978
−0.4 0.0 0.2
−0.4 0.0 0.2
0.1
1
corr=0.982
−0.4 0.0 0.2
−0.6 −0.2 0.2
0.01
10
corr=0.978
−0.4 0.0 0.2
−0.6 −0.2 0.2
0.1
10
corr=0.984
−0.4 0.0 0.2
−0.6 −0.2 0.2
1
10
corr=0.98
Figure 3. Upper triangle: Pairwise comparisons of the sire specific probabilities of
being among the 10% best sires for different values of τ
2
ν
(the values are printed on the
axes). Lower triangle: Pairwise comparisons of the predicted sire effects for different
values of τ
2
ν
.
with regards to the analysis of mastitis, the binary response approach using
threshold models has sofar been dominating [4, 9, 10].
Mastitis is a disease whose occurrence is highly correlated with milk yield.
Cows with high milk production are likely to have more infections and mastitis
than low-yield cows. In order to identify those sires who have daughters which
show high mastitis resistance in addition to being good producers, milk yield
should probably be included as a covariate in the model, as well. Most likely,
there are also other variables which should be included in the analysis.
We did not address the question of heritability in this paper, nor did we
discuss the sire variance component. The latter is not very informative unless
related to the total variability. Defining a measure for heritability for survival
540 S. Sæbø, A. Frigessi
0.0 0.2 0.4 0.6 0.8
0.0 0.2 0.4 0.6 0.
8
10
0
.
01
Figure 4. Comparisons of the sire specific probabilities of being among the 10% best
sires for two values of τ
2
ν
. The 25 most favourable sires are marked with + for τ
2
ν
=
0.01 and with for τ
2
ν
= 10, and 23 sires belong to the top group in both cases.
traits is not straight forward, although some suggestions have been given on
the log-time scale for proportional hazards models [16, 20]. However, it was
not the scope of this paper to contribute in that direction.
The Bayesian approach with MCMC facilitates the computation of posterior
probabilities of complex events, as illustrated in this paper by sire specific
probabilities of being among the best sires. We believe that the potential of
this deserves more attention in many areas of applied statistical research.
ACKNOWLEDGEMENTS
This work has partly been financed by the Norwegian Research Council
through the project Healthy Cow – Dairy Cattle Records – A Tool for Improved
Animal Health. The Norwegian Dairy Herd Recording (Husdyrkontrollen) is
acknowledged for providing data, and GENO Breeding and A.I. Association
for sire pedigree information. We would also like to give credit to project
SIP 154079-420. Finally we want to thank the editors and the reviewers for
their valuable comments on our manuscript.
Bayesian analysis of mastitis resistance 541
REFERENCES
[1] Barkema H.W., Schukken Y.H., Lam T.J., Beiboer M.L., Benedictus G., Brand
A., Management practices associated with the incidence rate of clinical mastitis,
J. Dairy Sci. 82 (1999) 1643–1654.
[2] Besag J., Higdon D., Bayesian analysis of agricultural field experiments, J. R.
Statist. Soc. B 61 (1999) 691–746.
[3] Breslow N.E., Covariance analysis of censored survival data, Biometrics 30
(1974) 89–99.
[4] Chang Y.M., Gianola D., Heringstad B., Klemetsdal G., Correlations between
clinical mastitis in different periods of first-lactation Norwegian Cattle using a
multivariate threshold model, in: Gatsonis C., Carriquiry A., Gelman A., Higdon
D., Kass R., Pauler D., Verdinelli I. (Eds.), Case studies in Bayesian statistics,
volume VI, Springer-Verlag, New York, 2002.
[5] Cox D.R., Regression models and life-tables (with discussion), J. R. Statist. Soc.
B 34 (1972) 187–220.
[6] Ducrocq V., Casella G., A Bayesian analysis of mixed survival models, Genet.
Sel. Evol. 28 (1996) 505–529.
[7] Gustafson P., Aeschliman D., Levy A.R., A simple approach to fitting Bayesian
survival models, Lifetime Data Anal. 9 (2003) 5–19.
[8] Henderson C.R., Prediction of future records, in: Pollack E., Kempthorne O.,
Bailey T.B. (Eds.), Proc. Int. Conf. Quantitative Genetics, Iowa State Univ.,
Ames, Iowa, USA, 1977, pp. 615–638.
[9] Heringstad B., Klemetsdal G., Ruane J., Clinical mastitis in Norwegian cat-
tle: frequency, variance components, and genetic correlation with protein yield,
J. Dairy Sci. 82 (1999) 1325–1330.
[10] Heringstad B., Chang Y.M., Gianola D., Klemetsdal G., Genetic analysis of
longitudinal trajectory of clinical mastitis in first lactation Norwegian Cattle,
J. Dairy Sci. 86 (2003) 2676–2683.
[11] Hjort N.L., Nonparametric Bayes estimators based on beta processes in models
for life history data, Ann. Statist. 18 (1990) 1259–1294.
[12] Ibrahim J.G., Chen M.H., Sinha D., Bayesian Survival Analysis, Springer-
Verlag, New York, 2001.
[13] Kalbfleisch J.D., Nonparametric Bayesian analysis of survival time data, J. R.
Statist. Soc. B 40 (1978) 214–221.
[14] Kehrli M.E., Nonnecke B.J., Roth J.A., Immunosuppression in dairy cows at
calving, Am. J. Vet. Res. 50 (1989) 207–214.
[15] Korsgaard I.R., Madsen P., Jensen J., Bayesian inference in the semiparamet-
ric log normal frailty model using Gibbs sampling, Genet. Sel. Evol. 30 (1998)
241–256.
[16] Korsgaard I.R., Andersen A.H., Jensen J., Discussion of heritability of survival
traits, in: Proc. GIFT, Jouy-en-Josas, France, Interbull Bulletin No. 21 (1999)
31–35.
[17] Morse D., Lorenzo M.A., Wilcox C.J., Collier R.J., Natzko R.P., Bray D.R.,
Climatic effects on occurrence of clinical mastitis, J. Dairy Sci. 71 (1988)
848–853.
542 S. Sæbø, A. Frigessi
[18] Schreiner D.A, Ruegg P.L., Relationship between udder and leg hygiene scores
and subclinical mastitis, J. Dairy Sci. 86 (2003) 3460-3465.
[19] Sorensen D.A., Andersen D., Gianola D., Korsgaard I.R., Bayesian infer-
ence in threshold models using Gibbs sampling, Genet. Sel. Evol. 27 (1995)
229–249.
[20] Yazdi M.H., Visscher P.M., Ducrocq V., Thompson R., Genetic parameters and
response to selection in proportional hazards models, in: Book of Abstracts of
the 51st Annual Meeting of the European Association for Animal Production,
The Netherlands, Wageningen Pers, Book of Abstracts No. 6 (2000) 81.
To access this journal online:
www.edpsciences.org