Báo cáo sinh học: "Genetic diversity, introgression and relationships among West/Central African cattle breeds" docx
Bạn đang xem bản rút gọn của tài liệu. Xem và tải ngay bản đầy đủ của tài liệu tại đây (396.27 KB, 18 trang )
Genet. Sel. Evol. 36 (2004) 673–690 673
c
INRA, EDP Sciences, 2004
DOI: 10.1051/gse:2004024
Original article
Genetic diversity, introgression
and relationships among West/Central
African cattle breeds
Eveline Mengwi I-A,OliverCarlJ,
Christina
W,GeorgE
∗
Institute of Animal Breeding and Genetics, Justus-Liebig University, Giessen,
Ludwigstrasse 21b, 35390 Giessen, Germany
(Received 12 January 2004; accepted 17 June 2004)
Abstract – Genetic diversity, introgression and relationships were studied in 521 individuals
from 9 African Bos indicus and 3 Bos taurus cattle breeds in Cameroon and Nigeria using
genotype information on 28 markers (16 microsatellite, 7 milk protein and 5 blood protein mark-
ers). The genotypes of 13 of the 16 microsatellite markers studied on three European (German
Angus, German Simmental and German Yellow) and two Indian (Nelore and Ongole) breeds
were used to assess the relationships between them and the African breeds. Diversity levels at
microsatellite loci were higher in the zebu than in the taurine breeds and were generally similar
for protein loci in the breeds in each group. Microsatellite allelic distribution displayed groups
of alleles specific to the Indian zebu, African taurine and European taurine. The level of the
Indian zebu genetic admixture proportions in the African zebus was higher than the African
taurine and European taurine admixture proportions, and ranged from 58.1% to 74.0%. The
African taurine breed, Muturu was free of Indian zebu genes while its counter Namchi was
highly introgressed (30.2%). Phylogenic reconstruction and principal component analysis indi-
cate close relationships among the zebu breeds in Cameroon and Nigeria and a large genetic
divergence between the main cattle groups – African taurine, European taurine and Indian zebu,
and a central position for the African zebus. The study presents the first comprehensive informa-
tion on the hybrid composition of the individual cattle breeds of Cameroon and Nigeria and the
genetic relationships existing among them and other breeds outside of Africa. Strong evidence
supporting separate domestication events for the Bos species is also provided.
genetic diversity / introgression / relationship / cattle
∗
Corresponding author:
674 E.M. Ibeagha-Awemu et al.
1. INTRODUCTION
The need to increase, maintain and conserve genetic diversity in animal and
plant species has been recognized [36]. Attention has consequently been turned
to this direction with every tool including phenotypic parameters, biochemical
and molecular genetic techniques being utilized to assess animal and plant
genetic diversity. The job is far from being done especially with regards to
African cattle breeds and their unique history of origin. MacHugh et al. [25] in
a study on cattle breeds from Africa, Europe and India reported the highest di-
versity levels in African Bos indicus breeds, which are comparable to diversity
levels at a center of origin [22]. The admixed nature of African Bos indicus
breeds is thought to be responsible for its increased level of diversity [26]. It
is therefore necessary to assess diversity levels in more breeds in the region
in order to determine improvement and conservation priorities. This is espe-
cially necessary owing to the husbandry systems practiced by local livestock
farmers, which may affect diversity levels through the breeding of relatives and
high gene flow between breeds.
The issues surrounding the origin and domestication of today’s African cat-
tle breeds [9, 10, 14, 28], especially the theory of an African center of domes-
tication for the African taurine [4, 6,15,23,25] needs further clarification. The
results of several investigations have also indicated that African zebu cattle are
an admixture of Bos indicus and Bos taurus [4, 15, 25]. The levels of Asian
zebu genes in the African breeds are different and need to be determined for
each breed. Some studies have estimated zebu admixture levels at about 50.0%
to 83.0% in African zebus [15, 25] and levels up to 45.0% in African tau-
rines [15]. In a recent study Achukwi et al. [1] demonstrated that the Namchi
(taurine) with a lower level of zebu genes showed a higher level of resistance to
trypanosomiasis as compared to another taurine, Kapsiki, which has a higher
level of zebu genes. The high levels of zebu genes reported in some African
taurine breeds by Hanotte et al. [15] is particularly alarming and the African
taurines stand to lose their identity should this trend continue. It is therefore
necessary to assess the levels of Asian zebu genes in African cattle breeds,
particularly the taurines to enable their continued survival through effective
management decisions.
The aim of the study was to assess genetic diversity and introgression levels
in Bos indicus and Bos taurus cattle breeds in Cameroon and Nigeria neces-
sary for sustainable management and conservation decisions, and to assess the
phylogenetic relationships existing between them and cattle breeds in Europe
and Asia with the hope of providing further information on the history of their
origins.
Genetic diversity and relationships of African cattle breeds 675
2. MATERIALS AND METHODS
2.1. Studied breeds
Blood samples were obtained from 9 Bos indicus (zebu) breeds in Cameroon
(Red Bororo, n = 52; White Fulani, n = 44; Banyo Gudali, n = 77;
Ngaoundere Gudali, n = 55) and Nigeria (Red Bororo, n = 52; White Fulani,
n = 53; Sokoto Gudali, n = 65; Adamawa Gudali, n = 11; Wadara, n = 36)
and 3 Bos taurus breeds (Namchi, n = 30 in Cameroon, and Muturu, n = 20
and N’Dama, n = 26, both in Nigeria). The individuals sampled were at distant
locations and unrelated. DNA was isolated from white blood cells according
to a modified protocol of Montgomery and Sise [31]. In addition, the data of
3 European Bos taurus breeds (German Angus, n = 54; German Simmental,
n = 50 and German Yellow, n = 50) and 2 Indian Bos indicus breeds (Nelore,
n = 54 and Ongole, n = 60) were included for comparative purposes.
2.2. Studied markers
A total of 28 markers including 5 blood protein markers (albumin-ALB,
carbonic anhydrase-CA II, vitamin D-binding protein-GC, heamoglobin-HBB
and transferrin-TF), 7 milk protein markers (α
S 1
-casein 5’ promoter region-
CSN1S1Prom, α
S 1
-casein-CSN1S1, α
S 2
-casein-CSN1S2, β-casein-CSN2,
κ-casein-CSN3, α-lactalbumin-LAA and β-lactoglobulin-LGB) and 16 mi-
crosatellite markers (BM1818, BM1824, BM2113, CSSM66, ETH10, ETH152,
ETH185, HEL1, HEL5, HEL13, ILSTS6, INRA23, INRA37, SPS115, TGLA122
and TGLA126) were studied. The microsatellites are from a list recom-
mended by the FAO and the International Society for Animal Genetics
( for use in cattle biodiversity studies.
2.3. Genotyping of blood and milk protein markers
Information on genotyping and allele frequencies of the protein markers
(blood and milk) except for the three European taurine breeds and the two
Indian zebu breeds are found respectively in Ibeagha-Awemu et al. [18,19].
2.4. Genotyping of microsatellite markers
Microsatellites were PCR amplified using their respective primer pairs as
detailed in Amplified PCR products were
676 E.M. Ibeagha-Awemu et al.
analyzed under denaturing conditions in 0.5 mm thick polyacrylamide gels
(5.5% w/v acrylamide, 6 M urea) using the half automatic sequencing system
A.L.F. express (Amersham Pharmacia, Freiburg, Germany). Allele sizes stan-
dardized (with Giessen 2000) to the agreed size of international DNA refer-
ence samples ( were analyzed with the com-
puter program Allelinks (version 1.00) (Amersham Pharmacia Biotech Europe
GmbH, Freiburg, Germany).
Microsatellite data for the European breeds were analyzed within RESGEN
Project No CT98-118 while data for the Indian breeds were obtained from
CaDBase (Cattle diversity data base, ) and
previously reported by Loftus et al. [22].
2.5. Statistical analysis
Allele frequencies: Frequencies of alleles at the analyzed loci were esti-
mated using the GENEPOP program (version 3.3) [39].
Heterozygosity and gene diversity: Estimates of observed heterozygosity
(H
ob
) and unbiased gene diversity (expected unbiased heterozygosity, H
exp
)
for each breed were obtained with the POPGENE program (version 1.31) [44].
H
exp
was estimated using the algorithm of Levene [21], which is the same as
Nei’s [34] unbiased heterozygosity.
Estimation of genetic admixture proportions: Genetic admixture pro-
portions of the studied breeds were estimated using a coalescent approach
(mY) [3], which takes into account allele frequencies and the molecular dis-
tances between alleles. Alleles at Indian zebu, African taurine and European
taurine diagnostic loci and the program Admix 2.0 [8] were used to estimate
mY. The parental populations used were the following: P1 = a pool of genes
from two Indian zebu breeds, Nelore and Ongole; P2 = a pool of genes from
two African taurine breeds, Muturu and N’Dama; and P3 = a pool of genes
from two European taurine breeds, German Angus and German Yellow.
Genetic distances and relationships:Nei’sD
A
genetic distances [35] were
estimated between the African breed pairs on the basis of all markers, and
between all breed pairs on the basis of 13 microsatellite markers using the
DISPAN program [37]. The Neighbor-joining (N-J) method of Saitou and
Nei [40] was applied in phylogeny construction using the NEIGHBOR and
DRAWTREE programs of PHYLIP version 3.6b [12].
Principal component (PC) analysis: Principal components were was cal-
culated for all breeds using allele frequencies of 13 microsatellite markers.
Genetic diversity and relationships of African cattle breeds 677
The procedures described by Cavalli-Sforza et al. [5] and the SPSS 10.0 Soft-
ware (SPSS Inc., Chicago, USA) were used in PC estimates.
3. RESULTS
3.1. Genetic diversity
In total, 225 alleles were detected at all loci (28). Out of this number,
184 were detected at microsatellite loci, 21 at blood protein loci and 20 at milk
protein loci. Estimates of H
ob
and H
exp
for all loci and breeds are presented in
Table I. In general, heterozygosity estimates were the highest for microsatellite
markers followed by blood protein and lastly milk protein markers. These esti-
mates were also higher in the African zebus than the taurine breeds. Mean H
ob
and H
exp
values at microsatellite loci were similar for breeds in the African
zebu group – H
ob
values ranged from 0.652 to 0.697 and H
exp
from 0.703
to 0.744. In the African taurine group, the lowest and highest H
ob
values oc-
curred respectively in Muturu and N’Dama and H
exp
in Muturu and Namchi.
At blood protein loci Adamawa Gudali had the highest H
ob
and H
exp
values
(0.473, 0.482) and Muturu the lowest values (0.210, 0.139). Estimates at milk
protein loci were different for breeds in the taurine group but generally simi-
lar in the zebu group. Overall H
exp
estimates within breeds ranged from 0.385
(Muturu) to 0.600 (Cameroonian White Fulani).
3.2. Microsatellite allelic distribution
A high disparity in microsatellite allelic distribution between the African
zebu and taurine breeds was observed. A total of 184 alleles at different fre-
quencies were identified at the 16 microsatellite loci (data not shown). The
most polymorphic locus was ETH185 with 18 alleles and the least polymorphic
was ETH152 with 8 alleles. An average of 11.5 alleles occurred per microsatel-
lite locus. 16.9% (31) of the identified alleles were common to all breeds while
16.3% (30) were specific to certain breeds. At least one breed specific allele
occurred at all loci with the highest number at the BM1824 locus (5) and Nige-
rian White Fulani breed (7). The Namchi in the taurine group had more alleles
in common with the indicine breeds than did the N’Dama and Muturu.
For 10 of the loci (BM1824, BM2113, CSSM66, ETH10, ETH152, HEL1,
HEL13, INRA23, ILSTS6 and TGLA122), scored alleles were identified that
were present at higher frequencies in breeds in each bio-geographical grouping
678 E.M. Ibeagha-Awemu et al.
Table I. Mean observed heterozygosities (H
ob
) and unbiased gene diversities (H
exp
)
per marker set and breed.
Microsatellites Blood proteins Milk proteins Overall mean
Breed H
ob
H
exp
H
ob
H
exp
H
ob
H
exp
H
ob
H
exp
Bos indicus
White Fulani
0.657 0.730 0.460 0.456 0.337 0.377 0.542 0.593
(Nigeria)
White Fulani
0.682 0.744 0.409 0.453 0.375 0.376 0.557 0.600
(Cameroon)
Red Bororo
0.697 0.717 0.392 0.417 0.376 0.370 0.562 0.577
(Nigeria)
Red Bororo
0.693 0.718 0.420 0.442 0.386 0.416 0.568 0.593
(Cameroon)
Sokoto
0.697 0.731 0.419 0.429 0.343 0.386 0.559 0.591
Gudali
Banyo
0.654 0.724 0.445 0.452 0.342 0.377 0.539 0.589
Gudali
Ngaoundere
0.692 0.703 0.418 0.449 0.286 0.316 0.541 0.561
Gudali
Wadara 0.652 0.705 0.363 0.386 0.368 0.377 0.529 0.566
Adamawa
0.665 0.711 0.473 0.482 0.375 0.419 0.558 0.597
Gudali
Bos taurus
Namchi 0.549 0.656 0.373 0.361 0.365 0.424 0.472 0.545
Muturu 0.506 0.512 0.210 0.139 0.218 0.269 0.381 0.385
N’Dama 0.605 0.612 0.285 0.272 0.229 0.234 0.454 0.457
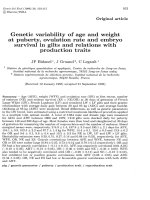
(Africa, Europe and India), and absent or present at relatively lower frequen-
cies in breeds in the other bio-geographical groups (Fig. 1). All the breeds were
clearly separated by alleles at three of these loci (ETH10, HEL1 and HEL13).
Following the definition of MacHugh et al. [25], these alleles were consid-
ered diagnostic or specific for breeds in the bio-geographical groupings. Zebu
alleles were identified at seven of the ten loci and their mean frequency dis-
tribution was the highest in Indian zebus (63.1%) followed by African zebus
(45.2%) while being less than 10.0% in both African and European taurines.
For the taurine breeds, German Yellow had the lowest proportion of zebu alle-
les (0.1%) followed by Muturu (0.4%) while Namchi had the highest (20.4%).
Due to the higher frequencies of these alleles in the Indian than African zebu,
they will henceforth be denoted “Indian zebu specific alleles”.
Genetic diversity and relationships of African cattle breeds 679
Figure 1. Distribution of group diagnostic/specific alleles across bio-geographical
groupings. Indian zebu diagnostic alleles: BM2113-130 and 142 bp; CSSM66-181
bp; ETH10-207, 209 and 211 bp; ETH152-191 bp; HEL1-101, 107 and 117 bp;
HEL13-182 and 186 bp; TGLA122-144 bp. African taurine diagnostic alleles:
BM1824-181 bp; BM2113-122 bp; ETH10-219 bp; ETH152-195 bp; HEL1-109 bp;
HEL13-190; INRA 23-199 bp. European taurine diagnostic alleles: BM1824-189 bp;
CSSM66-183 bp; ETH10-215 bp; HEL1-113 bp; HEL13-188 bp; ILSTS6-289 bp;
TGLA122-150 bp.
African taurine specific alleles were present at seven loci and their distri-
bution in the African taurines was 56.4% in Muturu, 53.8% in N’Dama and
39.0% in Namchi. Their mean value was higher in the African zebu than the
European taurine while the Indian zebu had the lowest value. In fact, only two
of the seven African taurine specific alleles were identified in the Indian zebus.
Identified European taurine specific alleles were seven at seven loci. Their dis-
tribution was the highest as expected in the European taurines (32.5%) while
being less than 4.0% in breeds in the other bio-geographical groups.
3.3. Genetic admixture
The coefficients of admixture per breed and bio-geographical grouping are
presented in Table II. The Indian zebu genetic proportions in the African ze-
bus ranged from 58.1% (Ngaoundere Gudali) to 74.0% (Nigerian Red Bororo).
The African Namchi in the taurine group received the highest level of Indian
zebu genes (30.2%) while the Muturu and German Angus were very less influ-
enced (negative coefficients). The African taurine influence was above 8.0% in
the African zebus, 11.9% in the Ongole and 12.9% in German Angus. Nelore
and two European taurines had little or no genes of African taurine origin.
680 E.M. Ibeagha-Awemu et al.
Table II. Admixture proportions of breeds belonging to the African zebu, Indian zebu,
African taurine and European taurine.
Breed mY1 ± SD mY2 ± SD mY3 ± SD
African zebu
White Fulani (Nigeria) 0.705 ± 0.043 0.075 ± 0.098 0.220 ± 0.077
White Fulani (Cameroon) 0.664 ± 0.041 0.230 ± 0.091 0.106 ± 0.077
Red Bororo (Nigeria) 0.740 ± 0.042 0.155 ± 0.089 0.105 ± 0.073
Red Bororo (Cameroon) 0.626 ± 0.041 0.242 ± 0.079 0.132 ± 0.072
Sokoto Gudali 0.672 ± 0.040 0.081 ± 0.089 0.247 ± 0.075
Banyo Gudali 0.657 ± 0.040 0.083 ± 0.090 0.260 ± 0.068
Ngaoundere Gudali 0.581 ± 0.037 0.292 ± 0.078 0.127 ± 0.066
Wadara 0.642 ± 0.049 0.085 ± 0.113 0.372 ± 0.093
Adamawa Gudali 0.612 ± 0.076 0.382 ± 0.106 0.015 ± 0.098
Indian zebu
Nelore 0.907 ± 0.049 –0.051 ± 0.106 0.143 ± 0.089
Ongole 1.070 ± 0.045 0.119 ± 0.108 –0.189 ± 0.099
African taurine
Namchi 0.302 ± 0.064 0.197 ± 0.133 0.501 ± 0.089
Muturu –0.129 ± 0.040 1.084 ± 0.086 0.045 ± 0.081
N’Dama 0.082 ± 0.048 0.803 ± 0.123 0.115 ± 0.105
European taurine
German Angus –0.039 ± 0.034 0.129 ± 0.085 0.910 ± 0.062
German Simmental 0.039 ± 0.053 –0.015 ± 0.115 0.976 ± 0.075
German Yellow 0.033 ± 0.032 –0.097 ± 0.081 1.064 ± 0.061
mY1 = genetic contributions from the Indian zebu; mY2 = genetic contributions from the
African taurine; mY3 = genetic contributions from the European taurine.
European taurine influence was very evident in the African breeds (1.5 to
37.5% in the zebus and 4.5 to 50.1% in the taurines) and the Indian Nelore
(14.3%). Only one breed, Ongole was not influenced by the genes of the Euro-
pean taurine origin.
3.4. Genetic distances and phylogeny
Low D
A
estimates (Tab. III) were observed between the African zebu breed
pairs and higher estimates between the zebu and taurine pairs. The lowest D
A
distance was between the Nigerian White Fulani and Sokoto Gudali (0.028)
and the highest between the Cameroonian White Fulani and Muturu (0.299).
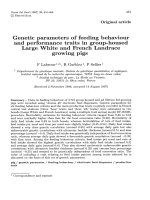
The unrooted tree of phylogeny shows a clear separation between the African
zebus and taurine breeds (Fig. 2). Eight of the zebu breeds are to be found in a
tight cluster at one end and two taurine breeds, the Muturu and N’Dama at the
Genetic diversity and relationships of African cattle breeds 681
Table III. Matrix of D
A
genetic distances between 12 African cattle breeds on the basis of 28 markers (16 microsatellite markers and
12 protein markers) (below diagonal) and between 17 cattle breeds on the basis of 13 microsatellite markers (above diagonal).
Bos indicus African taurine Indian zebu European taurine
WFn WFc RBn RBc SG BG NG WD AG NA MT ND NEL ONG GEA GES GEY
WFn – 0.079 0.050 0.045 0.042 0.040 0.065 0.068 0.116 0.126 0.347 0.236 0.230 0.206 0.375 0.347 0.419
WFc 0.052 – 0.098 0.085 0.070 0.095 0.110 0.116 0.154 0.184 0.394 0.299 0.273 0.251 0.399 0.372 0.429
RBn 0.032 0.058 – 0.056 0.058 0.063 0.074 0.092 0.142 0.134 0.362 0.245 0.244 0.219 0.412 0.375 0.445
RBc 0.034 0.052 0.034 – 0.052 0.043 0.070 0.082 0.115 0.123 0.357 0.261 0.254 0.210 0.375 0.339 0.412
SG 0.027 0.046 0.033 0.033 – 0.052 0.061 0.070 0.119 0.120 0.332 0.237 0.241 0.226 0.374 0.345 0.414
BG 0.037 0.056 0.039 0.031 0.033 – 0.064 0.080 0.120 0.135 0.350 0.252 0.238 0.289 0.355 0.314 0.395
NG 0.055 0.074 0.051 0.052 0.046 0.046 – 0.097 0.120 0.113 0.335 0.237 0.273 0.248 0.384 0.317 0.411
WD 0.051 0.078 0.058 0.054 0.047 0.058 0.065 – 0.157 0.132 0.345 0.246 0.267 0.227 0.397 0.373 0.427
AG 0.090 0.106 0.095 0.077 0.084 0.089 0.094 0.096 – 0.167 0.293 0.234 0.352 0.316 0.455 0.391 0.461
NA 0.100 0.124 0.101 0.090 0.091 0.104 0.105 0.110 0.123 – 0.222 0.137 0.390 0.353 0.359 0.309 0.378
MT 0.284 0.299 0.286 0.271 0.266 0.277 0.290 0.293 0.231 0.171 – 0.192 0.620 0.627 0.361 0.329 0.431
ND 0.207 0.227 0.204 0.200 0.193 0.205 0.213 0.216 0.183 0.121 0.124 – 0.480 0.466 0.351 0.323 0.392
NEL – 0.087 0.544 0.491 0.561
ONG – 0.552 0.528 0.587
GEA – 0.167 0.190
GES – 0.125
GEY —
WFn: Nigerian White Fulani, WFc: Cameroonian White Fulani, RBn: Nigerian Red Bororo, RBc: Cameroonian Red Bororo, SG: Sokoto Gudali,
BG: Banyo Gudali, NG: Ngaoundere Gudali, WD: Wadara, AG: Adamawa Gudali, NA: Namchi, MT: Muturu, ND: N’Dama, NEL: Nelore,
ONG: Ongole, GEA: German Angus, GES: German Simmental, GEY: German Yellow.
682 E.M. Ibeagha-Awemu et al.
Figure 2. Unrooted neighbor-joining tree constructed from D
A
distances showing the
relationships among 12 African cattle breeds (9 zebus and 3 taurines). Genetic dis-
tances are based on 28 markers (16 microsatellite, 5 blood protein and 7 milk protein
markers).
other end. The Adamawa Gudali and Namchi occupied the central region but
with each closer to its own breed group.
As expected, large D
A
estimates (Tab. III) on the basis of 13 markers con-
sidering all 17 breeds were observed between breed pairs of one breed group
and another while lower distances occurred between members within the same
group.
Genetic diversity and relationships of African cattle breeds 683
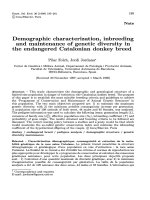
3.5. Principal components of allele frequency distributions
The result of PC on the allele frequencies of 13 microsatellite markers on all
breeds is presented in Figure 3, and further explains the relationships existing
among these breeds. Three groups were each evident on the basis of the 1st
(40.1%) and 2nd (24.3%) PC values and clearly portray the magnitude of di-
vergence between them. The three groups under the 1st PC were the Indian
zebus, African zebus and African/European taurines and under the 2nd PC,
European taurines/Indian zebus, African zebus and African taurines. The sep-
aration between the African taurines and European taurines was clear under
the 2nd PC and between European taurines and Indian zebus under the 1st PC.
The African zebus on the basis of both PC values occupied a position midway
between the two extremes – African taurines and Indian zebus.
4. DISCUSSION
A high number of unique microsatellite alleles in the African zebu breeds
are suggestive of a large effective population size and thus the retention of these
alleles. The general absence of unique alleles in the taurine breeds is supported
by their low population size. Encroaching zebu breeds into the humid zone
with the help of veterinary prophylaxes have forced the few remaining taurine
populations into limited locations in the zone. All the African taurine breeds
in this study are at risk of endangerment [11,29].
Microsatellite allelic distribution in the breeds is a further proof of the heavy
influence of Indian zebu cattle and taurine (African and European) breeds on
the zebu breeds in Africa. This is evident by the distribution of group specific
microsatellite alleles, especially Indian zebu specific and African taurine spe-
cific alleles in these breeds. Some of the Indian zebu diagnostic loci/alleles
observed in this study have been previously described [22, 25, 30]. Alleles at
the diagnostic loci ETH152 and HEL1 described by MacHugh et al. [25] are
the same observed here except ETH152
193
and HEL1
111
. Zebu specific alle-
les have also been reported at blood and milk protein loci [18, 19]. The ob-
servation of African taurine diagnostic loci/alleles in this study is supported
by MacHugh [24], who, however, did not report European taurine diagnostic
alleles. European taurine diagnostic allele 113 bp of HEL1, a locus also con-
sidered by MacHugh [24], was completely absent in all the African taurines
and Indian zebus in this study, and only present in one African zebu breed at a
low frequency of 0.021. African taurine specific allele INRA37
114
described by
Moazami-Goudarzi et al. [30] was absent in the Namchi and N’Dama breeds
684 E.M. Ibeagha-Awemu et al.
Figure 3. Scatter plot of principal component analysis of allele frequencies at 13 microsatellite markers of 9 African zebu breeds,
3 African taurines, 2 Indian zebus and 3 European taurines. The African zebu cluster is further magnified and shown in a box at the top
of the scatter plot. 1st PC = 40.1% and 2nd PC = 24.3%.
Genetic diversity and relationships of African cattle breeds 685
and occurred at a low frequency (3.1%) in the Muturu breed. This allele was
consequently not considered African taurine specific in this study. The distri-
bution of European taurine specific alleles was even more surprising, from a
mean frequency of 0.325 in the European taurines to 0.013 in the Indian ze-
bus. Even in the African taurines, a mean frequency of 0.022 for these alleles
was far from expectation and was therefore indicative of a large evolutionary
divergence between African and European taurines.
The general distribution of group specific alleles concurred with distance
and history of breed development. The trend for Indian zebu diagnostic alleles
(Indian zebu>African zebu>African taurine>European taurine) is supported
by the history of introduction of zebu genes into Africa and Europe [10, 15]
and by investigations with other markers, which show a higher number of al-
lele sharing between Indian and African zebu breeds [27, 33, 38]. In a recent
study, Loftus et al. [22] also recorded the presence of Indian zebu diagnostic
alleles in some European cattle breeds, Hungarian Grey (2.2%) and Turkish
Grey (10.4%). The distribution of group specific alleles could be interpreted as
the retention of a higher number of alleles at these locations (Africa, Europe,
India), here regarded centers of origin, and a large evolutionary divergence
between them.
The estimator mY [3] was adopted in assessing the admixture proportions
of the breeds in this study because it is particularly suited for the assessment
of admixed populations with distant parental lines and has been shown to per-
form well in most situations [7]. The admixture coefficients and the proportion
of group specific alleles have indicated the extent of their influence on the
zebu breeds in Cameroon and Nigeria, with a heavier influence coming from
the Indian zebus. The fact that no microsatellite alleles were specific to the
African zebus is a confirmation of their composite nature. The Indian zebus
less influenced some of the African and European taurines. The proportion of
zebu alleles at microsatellite loci in the Namchi and N’Dama breeds and the
observations of a heavy zebu influence at milk and blood protein loci [18, 19]
could be recent and probably not a primary influence from Indian breeds,
but secondary through the established admixed African zebus. Similar high
levels of introgression of Indian zebu genes into African zebu breeds have
been reported by MacHugh et al. [25] (59.8−83.2%) and Hanotte et al. [15]
(54.8−83.2%). The admixed compositions of African zebu breeds are also ev-
ident through the analysis of other autosomal markers, sex chromosomes and
mitochondria DNA [2,4,13,16,25]. The hybrids also predominate over the tau-
rines in today’s Cameroon and Nigeria and may be explained by the migratory
and war history of the people of Africa. The main Arab invasion of 700 AD,
686 E.M. Ibeagha-Awemu et al.
the outbreak of diseases [9], many Muslim holy wars in the West African re-
gion during the 19th century [32] and encroaching arid conditions could have
contributed to the distribution of zebu genes in African cattle breeds. Encroach-
ing zebu breeds continue to be a threat to the few remaining taurine popula-
tions through secondary introgressions, with the examples being the Namchi
and N’Dama breeds in this study, N’Dama populations in MacHugh et al. [25]
and several taurine breeds in Hanotte et al. [15]. The estimated zebu influence
at microsatellite loci (30.2%) on the Namchi breed is lower than at blood pro-
tein loci (61.5%) [18], and on the basis of trypanotolerance, indicates a greater
danger of dilution from candidate genes than from neutral markers. A study by
Achukwi et al. [1] indicated that the taurine breed Kapsiki with a higher level
of zebu genes than Namchi was more prone to trypanosomal infection.
It is clear from this study that Bos taurus (European and African) and Bos
indicus cattle possess very distinct allelic distributions and that zebu breeds in
Cameroon and Nigeria have a mixture of both African/European Bos taurus
and Indian zebu alleles, thus substantiating their high diversity status. Genetic
diversity of African zebu breeds is higher than the values reported for most
European taurine breeds [17,22,25] and Indian zebu breeds [22,25], and com-
pares to reports on other African Bos indicus breeds [25,30], breeds in Turkey,
and the Near East [22] and Korean and Chinese cattle [20]. Loftus et al. [22]
interpreted high gene diversity in the Near Eastern breeds as having resulted
from a retention of a high number of alleles by populations in a center of origin
and also an influence from Indian zebu breeds. A higher diversity level in the
Namchi breed as compared to the Muturu and N’Dama could be seen as an
influence from the zebu breeds. This was justified by the observed higher level
of zebu genes in Namchi than in the Muturu and N’Dama.
The observed D
A
genetic distances measured among the cattle breeds in
Cameroon and Nigeria, and among cattle breeds in the different continents
are supported by the long divergence period reported between Bos taurus and
Bos indicus cattle breeds [23, 25]. The very close relationship for the zebu
breeds in Cameroon and Nigeria was surprising. The breeds are quite distinct
phenotypically and one would have expected this to be reflected in the dendro-
gram and PC of relationships. Even though it is considered that the Gudalis
are among the true shorthorn zebus of West Africa [42], an examination of the
mY1 admixed coefficients gave this credit rather to the Nigerian Red Bororo.
Adamawa Gudali was the zebu that diverged the most from the others. Its low
sample size and the high genetic contribution (mY2 = 38.2%) from the African
taurine could be responsible for this behavior. Close relationships for the ze-
bus may be the consequence of management practices that promote high gene
Genetic diversity and relationships of African cattle breeds 687
flow between them while slight differences could be attributed to genetic drift,
which is in line with the migratory histories of the Fulani people. Clustering
in the African tree also agreed with the origins of the breeds. The status of
the two main species (Bos indicus and Bos taurus) was clearly defined, indi-
cating therefore a large divergence between them. Namchi, however, clustered
closer to the zebus owing to the relatively high level (mY1 = 30.2%) of Bos
indicus genes in them. This observation on the Namchi is similar to an earlier
observation on another African taurine breed, the Kuri [41]. The Namchi is
traditionally found at the Northwestern foothills of the Poli Mountains in the
North Province of Cameroon about 400 km south of Lake Chad, the habitat
of the Kuri cattle. The two breeds by virtue of their location could have been
more exposed to crossbreeding with the zebu breeds, thus substantiating their
high levels of zebu genes.
The groupings (African zebu, African taurine, Indian zebu and European
taurine) observed after multivariate variations between all 17 breeds have
thrown more light on their origin and domestication histories. The transitional
position of the African zebu between the other breed groups has been clarified
by their admixed coefficients while positioning of the other groups is evidence
of a high genetic divergence between them. The African taurine influence on
the African zebus was higher than the European taurine influence. Based on
these findings, a high influence of European Bos taurus genes of up to 74.0%
on other cattle breeds in the continent as indicated by Hanotte et al. [15] is
probably a joint influence from African and European taurines. Recent efforts
by the Governments of Cameroon and Nigeria in the colonial and immedi-
ate postcolonial era to further introduce European taurine genes in the region
through upgrading programs did not succeed. This is understandable because
grade animals could not survive the harsh environments of the tropics.
In light of the large divergence between the Bos species in this study, sug-
gestions of separate domestication events in the different continents, especially
an African center of domestication for African taurine [4, 15, 23, 25, 43] are
supported.
It is concluded from this study that cattle breeds in Cameroon and Nigeria
are a unique part of the global animal genetic resource. Their hybridized status
and high diversity levels present ingredients necessary for breed improvement,
development and conservation. High levels of zebu gene introgression in the
Namchi African taurine breed stand to threaten its special characteristic of try-
panotolerance. Sustainable management decisions must be aimed at limiting
zebu genetic exchanges with the taurines, while maintaining diversity for fu-
ture exploitation. The nine zebu breeds in Cameroon and Nigeria are closely
688 E.M. Ibeagha-Awemu et al.
related and are stabilized hybrids of Indian Bos indicus and African/European
Bos taurus. They are also highly diverged from their counterpart taurines. High
genetic divergence between the Bos species in Africa, Europe and India is sup-
portive evidence that they could have been domesticated independently.
ACKNOWLEDGEMENTS
The German Academic Exchange Service (DAAD) provided financial sup-
port towards the realization of the project. We thank the RESGEN consortium
(RESGEN-CT98-118) for providing the microsatellite data for the three Euro-
pean breeds.
REFERENCES
[1] Achukwi M.D., Tanya V.N., Hill E.W., Bradley D.G., Meghen C., Sauveroche
B., Banser J.T., Ndoki J.N., Susceptibility of the Namchi and Kapsiki cattle
of Cameroon to trypanosome infection, Trop. Anim. Health Prod. 4 (1997)
219–226.
[2] Baker C.M.A., Manwell C., Chemical classification of cattle. 1. Breed groups,
Anim. Blood Groups Biochem. Genet. 11 (1980) 127–150.
[3] Bertorelle G., Excoffier L., Inferring admixture proportions from molecular data,
Mol. Biol. Evol. 15 (1998) 1298–1311.
[4] Bradley D.G., MacHugh D.E., Cunningham P., Loftus R.T., Mitochondria diver-
sity and the origins of African and European cattle, Proc. Natl. Acad. Sci. USA
93 (1996) 5131–5135.
[5] Cavalli-Sforza L.L., Menozzi P., Piazza A., The History and Geography of
Human Genes, N.J. Princeton University Press, Princeton, 1994.
[6] Ceriotti G., Caroli A., Rizzi R., Crimella C., Genetic relationships among taurine
(Bos taurus) and zebu (Bos indicus) populations as revealed by blood groups and
blood proteins, J. Anim. Breed. Genet. 120 (2003) 57–67.
[7] Choisy M., Franck P., Cornuet M., Estimating admixture proportions with mi-
crosatellites: comparison of methods based on simulated data, Mol. Ecol. 13
(2004) 955–968.
[8] Dupanloup I., Bertorelle G., Computing admixture coefficients from molecular
data, (2000).
[9] Epstein E., The Origin of the Domestic Animals of Africa, Vol. I, Africana
Publishing Corporation, New York, 1971.
[10] Epstein E., Mason I.L., Cattle, in: Mason I.L. (Ed.), Evolution of Domestic
Animals, Longman, London, UK, 1984, pp. 6–27.
[11] FAO, World Watch List for Domestic Animal Diversity, 3rd edn., Food and
Agricultural Organization, Rome, 2000.
[12] Felsenstein J., PHYLIP: Phylogeny Inference Package, version 3.6b,
(2004).
Genetic diversity and relationships of African cattle breeds 689
[13] Frisch J.E., Drinkwater D., Harrison B., Johnson S., Classification of the south-
ern African sanga and east African shorthorned zebu, Anim. Genet. 28 (1997)
77–83.
[14] Grigson C., The craniology and relationships of four species of Bos. 5. Bos in-
dicus L., J. Arch. Sci. 7 (1980) 3–32.
[15] Hanotte O., Bradley D.G., Ochieng J.W., Verjee Y., Hill E.W., Rege J.E.O.,
African pastoralism: genetic imprints of origins and migrations, Science 296
(2002) 336–339.
[16] Hanotte O., Tawah C.L., Bradley D.G., Okomo M., Verjee Y., Ochieng J., Rege
J.E.O., Geographic distribution and frequency of a taurine Bos taurus and an
indicine Bos indicus Y specific allele amongst sub-saharan African cattle breeds,
Mol. Ecol. 9 (2000) 387–396.
[17] Hanslik S., Harr B., Brem G., Schlötterer C., Microsatellite analysis reveals sub-
stantial genetic differentiation between contemporaryNew World and Old World
Holstein Friesian populations, Anim. Genet. 31 (2000) 31–38.
[18] Ibeagha-Awemu E.M., Jäger S., Erhardt G., Polymorphisms in blood proteins of
Bos indicus and Bos taurus cattle breeds of Cameroon and Nigeria, and descrip-
tion of new albumin variants, Biochem. Genet. 42 (2004) 181–197.
[19] Ibeagha-Awemu E.M., Prinzenberg E M., Erhardt G., High variability of milk
protein genes in Bos indicus cattle breeds of Cameroon and Nigeria, J. Dairy
Res. (2004) (in press).
[20] Kim K.S., Yeo J.S., Choi C.B., Genetic diversity of north-east Asian cattle based
on microsatellite data, Anim. Genet. 33 (2002) 201–204.
[21] Levene H., On a matching problem in genetics, Ann. Math. Stat. 20 (1949)
91–94.
[22] Loftus R.T., Ertugrul O., Harba A.H., El-Barody M.A.A., MacHugh D.E., A
microsatellite survey of cattle from a center of origin: the near east, Mol. Ecol. 8
(1999) 2015–2022.
[23] Loftus R.T., MacHugh D.E., Bradley D.G., Sharp P.M., Cunningham E.P.,
Evidence for two independent domestication of cattle, Proc. Natl. Acad. Sci.
USA 91 (1994) 2757–2761.
[24] MacHugh D.E., Molecular Biogeography and Genetic Structure of Domesticated
Cattle, Ph.D. Thesis, Department of Genetics, Trinity College, University of
Dublin, 1996.
[25] MacHugh D.E., Shriver M.D., Loftus R.T., Cunningham P., Bradley D.G.,
Microsatellite DNA variation and the evolution, domestication and phylogeogra-
phy of taurine and zebu cattle (Bos taurus and Bos indicus), Genetics 146 (1997)
1071–1086.
[26] Mahé M.F., Miranda G., Queval R., Bado A., Souvenir Zafindrajaona P.,
Grosclaude F., Genetic polymorphism of milk proteins in African Bos taurus
and Bos indicus populations. Characterization of variants α
S1
-Cn H and κ–Cn,
Genet. Sel. Evol. 31 (1999) 239–253.
[27] Malik S., Kumar S., Rani R., κ-casein and β-casein alleles in crossbred and zebu
cattle from India using polymerase chain reaction and sequence-specific oligonu-
cleotide probes, J. Dairy Res. 67 (2000) 295–300.
690 E.M. Ibeagha-Awemu et al.
[28] Marshall F., Rethinking the role of Bos indicus in sub-saharan Africa, Curr.
Anthrop. 30 (1989) 235–240.
[29] Mason I.L., A World Dictionary of Livestock Breeds, Types and Varieties,
4th edn., CAB International, Wallingford, UK, 1996.
[30] Moazami-Goudarzi K., Belemsaga D.M.A., Ceriotti G., Laloë D., Fagbohoun F.,
Kouagou N’T., Sidibé I., Codjia V., Crimella M.C., Grosclaude F., Touré S.M.,
Caractérisation de la race bovine Somba à l’aide de marqueurs moléculaires,
Rev. Élev. Méd. Vét. Pays Trop. 54 (2001) 129–138.
[31] Montgomery G.W., Sise J.A., Extraction of DNA from sheep white blood cells,
New Zealand J. Agric. Res. 33 (1990) 437–441.
[32] Murray L., The Jihad movements of the nineteenth century, in: Ajayi J.F.A.,
Crowder M. (Eds.), History of West Africa, Vol. 2, Longman Group Ltd,
London, 1974, pp. 1–29.
[33] Naik S.N., Sukumaran P.K., Sanghvi L.D., Haemoglobin polymorphism in
Indian Zebu cattle, Heredity 24 (1969) 239–247.
[34] Nei M., Molecular Evolutionary Genetics, Columbia University Press, New
York, 1987.
[35] Nei M., Tajima F., Tateno Y., Accuracy of estimated phylogenetic trees from
molecular data, J. Mol. Evol. 19 (1983) 153–170.
[36] Oldenbrock J.K., Introduction, in: Oldenbrock J.K. (Ed.), Genebanks and
the Conservation of Farm Animal Genetic Resources, ID-Lelystad, The
Netherlands, 2002, pp. 1–31.
[37] Ota T., DISPAN. Genetic Distance and Phylogenetic Analysis, Institute of
Molecular Evolutionary Genetics, Pennsylvania State University, University
Park, PA, USA, 1993.
[38] Penedo M.C.T., Mortari N., Magalhaes L.E., Carbonic anhydrase polymorphism
in Indian Zebu cattle, Anim. Blood Groups Biochem. Genet. 13 (1982) 141–143.
[39] Raymond M., Rousset F., GENEPOP. Population genetics software and ecu-
menicism, J. Hered. 86 (2001) 248–249, http:/wbiomed.curtin.edu.au/genepop/.
[40] Saitou N., Nei M., The neighbour-joiningmethod: a new method for reconstruct-
ing phylogenetic trees, Mol. Biol. Evol. 4 (1987) 406–425.
[41] Souvenir Zafindrajaona P., Zeuh V., Moazami-Goudarzi K., Idriss A.,
Grosclaude F., Étude de statut phylogénétique du bovin Kouri du lac Tchad à
l’aide de marqueurs moléculaires, Rev. Élev. Méd. Vét. Pays Trop. 52 (1999)
152–162.
[42] Tawah C.L., Rege J.E.O., Gudali cattle of West and Central Africa, Anim. Genet.
Res. Inf. 17 (1996) 159–178.
[43] Troy C.S., MacHugh D.E., Bailey J.F., Magee D.A., Loftus R.T., Cunningham P.,
Chamberlain A.T., Sykes B.C., Bradley D.G., Genetic evidence for Near-Eastern
origins of European cattle, Nature 410 (2001) 1088–1091.
[44] Yeh F.C., Yang R C., Boyle T., POPGENE Version 1.31.
Microsoft Windows-based freeware for population genetics analysis,
or
(1999).