Báo cáo sinh học: "Selection for uniformity in livestock by exploiting genetic heterogeneity of residual variance" pot
Bạn đang xem bản rút gọn của tài liệu. Xem và tải ngay bản đầy đủ của tài liệu tại đây (282.79 KB, 23 trang )
“g07011” — 2007/12/12 — 11:46 — page 37 — #1
✐
✐
✐
✐
✐
✐
✐
✐
Genet. Sel. Evol. 40 (2008) 37–59 Available online at:
c
INRA, EDP Sciences, 2008 www.gse-journal.org
DOI: 10.1051/gse:2007034
Original article
Selection for uniformity in livestock
by exploiting genetic heterogeneity
of residual variance
Han A. Mulder
1∗
, Piter Bijma
1
, William G. Hill
2
1
Animal Breeding and Genomics Centre, Wageningen University, 6700 AH Wageningen,
The Netherlands
2
Institute of Evolutionary Biology, School of Biological Sciences, University of Edinburgh,
Edinburgh, EH9 3JT, UK
(Received 30 January 2007; accepted 23 August 2007)
Abstract – In some situations, it is worthwhile to change not only the mean, but also the vari-
ability of traits by selection. Genetic variation in residual variance may be utilised to improve
uniformity in livestock populations by selection. The objective was to investigate the effects of
genetic parameters, breeding goal, number of progeny per sire and breeding scheme on selec-
tion responses in mean and variance when applying index selection. Genetic parameters were
obtained from the literature. Economic values for the mean and variance were derived for some
standard non-linear profit equations, e.g. for traits with an intermediate optimum. The economic
value of variance was in most situations negative, indicating that selection for reduced variance
increases profit. Predicted responses in residual variance after one generation of selection were
large, in some cases when the number of progeny per sire was at least 50, by more than 10%
of the current residual variance. Progeny testing schemes were more efficient than sib-testing
schemes in decreasing residual variance. With optimum traits, selection pressure shifts gradu-
ally from the mean to the variance when approaching the optimum. Genetic improvement of
uniformity is particularly interesting for traits where the current population mean is near an
intermediate optimum.
heterogeneity of variance / index selection / uniformity / economic value / optimum trait
1. INTRODUCTION
Uniformity of livestock is of economic interest in many cases. For example,
the preference for some meat quality traits, such as pH, is to be in a narrow
range [19]. Farmers get premiums when they deliver animals in the preferred
range and penalties for animals outside it [20]. Uniformity of animals and ani-
mal products is also of interest for traits with an intermediate optimum value,
∗
Corresponding author:
Article published by EDP Sciences and available at
or />“g07011” — 2007/12/12 — 11:46 — page 38 — #2
✐
✐
✐
✐
✐
✐
✐
✐
38 H.A. Mulder et al.
such as litter size in sheep [37], egg weight in laying hens [10], carcass weight
and carcass quality traits in pigs and broilers [11, 14, 19], marbling in beef [1].
Different strategies can be used to reduce variability, e.g. management, mating
systems and genetic selection [18], but selection can be effective only when
genetic differences in phenotypic variability exist among animals.
There is some empirical evidence for the presence of genetic heterogeneity
of residual variance, meaning that genotypes differ genetically in phenotypic
variance. San Cristobal-Gaudy et al. [37], in the analysis of litter size in sheep,
and Sorensen and Waagepetersen [38], in the analysis of litter size in pigs,
found substantial genetic heterogeneity of residual variance. Van Vleck [39]
and Clay et al. [7], in the analysis of milk yield in dairy cattle, and Rowe
et al. [35], in the analysis of body weight in broiler chickens, found large dif-
ferences between sires in phenotypic variance within progeny groups. In these
studies, heritabilities of residual variance were low (0.02–0.05), but the ge-
netic standard deviations were high relative to the population average residual
variance (25–60%) (reviewed by Mulder et al. [30]).
When the aim is to change the mean and the variance of a trait simultane-
ously, e.g. by applying index selection, not only the genetic parameters but also
the economic values for mean and variance of the trait need to be known. For
most traits, economic values have been derived for their means, but not for their
variances. Because the variance of a trait is a quadratic function of trait value,
it will have a non-zero economic value if the profit equation is non-linear.
The effects of selection strategies on responses in mean and variance have
been investigated for mass selection [17, 30], canalising selection using a
quadratic index with phenotypic information of progeny [36, 37], index selec-
tion using arbitrary weights to increase the mean and to decrease the variance
with repeated measurements on the same animal [38], and for selection either
on progeny mean or on within-family variance [30]. None of these studies,
however, investigated prospects for changing simultaneously the mean and the
variance by using a selection index with optimal weights. The framework de-
veloped by Mulder et al. [30] allows extension to a selection index to optimise
responses in the mean and the variance.
The objective of this study was to investigate the effects of genetic param-
eters, breeding goals, the number of progeny per sire and breeding schemes,
e.g. progeny and sib testing, when changing the mean and the variance of a
trait by exploiting genetic heterogeneity of residual variance. Economic values
for the mean and the variance are derived for situations with non-linear profit
and these economic values are applied in index selection to study response to
selection.
“g07011” — 2007/12/12 — 11:46 — page 39 — #3
✐
✐
✐
✐
✐
✐
✐
✐
Selection for uniformity in livestock 39
2. MATERIAL AND METHODS
2.1. Genetic model
In this study, it is assumed that selection is for a single trait in the presence
of genetic heterogeneity of residual variance. Both the mean and the residual
variance are partly under genetic control according to the model [17]:
P = μ + A
m
+ E (1)
with E ∼ N(0,σ
2
E
+ A
v
), where P is the phenotype, μ and σ
2
E
are, respectively,
the mean trait value and the mean residual variance of the population, A
m
and
A
v
are, respectively, the breeding value for the level and the residual variance
of the trait. It is assumed that A
m
and A
v
follow a multivariate normal distri-
bution N
0
0
, C ⊗ A
,whereA is the additive genetic relationship matrix,
C =
σ
2
A
m
cov
A
mv
cov
A
mv
σ
2
A
v
, σ
2
A
m
and σ
2
A
v
are the additive genetic variances in A
v
and A
m
, respectively, cov
A
mv
= cov(A
m
, A
v
) = r
A
σ
A
m
σ
A
v
,andr
A
is the additive
genetic correlation between A
m
and A
v
. The mean phenotypic variance of the
population (σ
2
P
)isthesumofσ
2
A
m
and σ
2
E
. The mean phenotypic variance is
independent of A
v
because E
(
A
v
)
= 0. In contrast, the variance of a particular
genotype, say k, depends on A
v
k
and is equal to σ
2
P
k
= σ
2
E
+ A
v
k
. In this study,
the residual variance is equal to the environmental variance, assuming no other
genetic or environmental complexities and using an animal model in genetic
evaluation. The distribution of P is approximately normal, but is slightly lep-
tokurtic (coefficient of kurtosis = 3σ
2
A
v
/σ
4
P
) and, when r
A
0, also slightly
skewed (coefficient of skewness = 3cov
A
mv
/σ
3
P
).
2.2. Breeding schemes
Breeding schemes are based on either sib testing or progeny testing. Sib
testing is considered as the basis because it is most commonly applied in pig
and poultry improvement, in which uniformity of animals is likely to be of
most interest [11, 14]. Progeny testing is considered as an alternative with the
advantage of a higher accuracy of selection, which is (partly) offset by a longer
generation interval.
Selection is for one trait and the breeding goal comprises both its mean and
variance:
H = v
A
m
A
m
+ v
A
v
A
v
= v
a (2)
“g07011” — 2007/12/12 — 11:46 — page 40 — #4
✐
✐
✐
✐
✐
✐
✐
✐
40 H.A. Mulder et al.
where H is the aggregate genotype, v
A
m
and v
A
v
are respectively the economic
values for A
m
and A
v
, v
=
v
A
m
v
A
v
and a
=
A
m
A
v
. The trait is measured
in both sexes before selection (e.g. body weight). The available phenotypic
information is the following: own phenotype P, own phenotype squared P
2
,
mean phenotype of half-sibs
P, the square of the mean phenotype of half-
sibs (
P)
2
and the within-family variance of half-sibs varW. It is assumed that
half-sib groups consist of 50 individuals with one progeny per dam to keep
the selection index relatively simple, although in pigs and poultry dams have
multiple progeny. The half-sib groups consist of males and females, assuming
correction has been made for any sex effect on the mean and sexes do not
differ in residual variance. Sires are either sib tested or progeny tested; dams
are always sib tested. Generations are discrete. In each generation, 20% of the
dams and 5% of the sires are selected by truncation on an index I:
I = b
x (3)
where b = P
−1
Gv, x is the vector with phenotypic information, expressed as
deviations from the expectations, P = cov(x, x)andG = cov(x, a). Details of
the P and G matrices are in Appendix A.
2.3. Economic values for common cases with non-linear profit
In this section, economic values for the mean and variance are derived
for some standardised situations with non-linear profit. A non-zero economic
value for variance implies that profit is non-linear in phenotype, because the
variance of a trait is a quadratic function of its value. The clearest example of
non-linear profit is for traits with an intermediate optimum e.g. [10, 19].
2.3.1. Quadratic profit
Traits may have a quadratic profit equation with the maximum profit at an
intermediate optimum value. An example is days open in dairy cattle [13].
A quadratic profit equation for an individual animal with phenotype P is the
following:
M = r
1
(P − O)
2
+ r
2
(4)
where M is the profit of an animal, r
1
and r
2
are the coefficients of the profit
equation with r
1
describing the curvature (r
1
< 0) and r
2
the profit at the
“g07011” — 2007/12/12 — 11:46 — page 41 — #5
✐
✐
✐
✐
✐
✐
✐
✐
Selection for uniformity in livestock 41
optimum value, O of the trait. The average profit (
M) of the population is the
following:
M =
∞
−∞
Mf(P)dP = r
1
μ
2
− 2r
1
μO + r
1
O
2
+ r
2
+ r
1
σ
2
P
(5)
where f (P) is the probability density function of a normal distribution. The
economic values are given by the first derivatives of equation (5):
v
A
m
=
dM
dμ
= 2r
1
(μ − O), (6a)
v
A
v
=
dM
dσ
2
P
= r
1
. (6b)
The ratio of v
A
m
to v
A
v
depends solely on the location of the population mean
relative to the optimum trait value (see App. B). The relative weight on A
m
decreases as the population mean approaches the optimum.
2.3.2. Differential profit based on thresholds
In some practical cases, profit is not a continuous function of phenotype, but
is discontinuous with differential revenues according to thresholds. Examples
are pH in pork [19] or egg weight in poultry [34]. Assume that animals with a
phenotype between the lower threshold (T
l
) and higher threshold (T
u
)havea
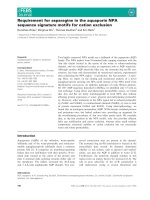
profit M = 1 and those outside these thresholds have a profit M = 0 (see Fig. 1
for a schematic representation). The average profit of the population is:
M = M
P<T
l
T
l
−∞
f (P)dP + M
T
l
<P<T
u
T
u
T
l
f (P)dP + M
P>T
u
∞
T
u
f (P)dP =
T
u
T
l
f (P)dP.
(7)
The economic values are:
v
A
m
=
dM
dμ
=
d
M
dt
dt
dμ
=
z
l
− z
u
σ
P
, (8a)
v
A
v
=
dM
dσ
2
P
=
dM
dt
dt
dσ
2
P
=
1
2
(z
l
t
l
− z
u
t
u
)
σ
2
P
, (8b)
where z
l
and z
u
are, respectively, the ordinate of the standard normal distri-
bution at the standardised lower and upper thresholds t
l
= (T
l
− μ)/σ
P
and
“g07011” — 2007/12/12 — 11:46 — page 42 — #6
✐
✐
✐
✐
✐
✐
✐
✐
42 H.A. Mulder et al.
-3 -2 -1 0 1 2 3
P
profit = 0
profit = 1
profit = 0
Optimum
range
Figure 1. Schematic representation when profit is based on two thresholds (T
l
= −1,
T
u
= 1) with optimum profit between both thresholds when the trait is normally dis-
tributed (N(0, 1); population mean = optimum = 0).
t
u
= (T
u
− μ)/σ
P
. Equation (8a) is in agreement with previous research on
economic values for optimum traits [19, 40], whereas (8b) is new. When the
population mean is at the optimum (μ = O ), v
A
m
= 0andv
A
v
< 0. The ratio
of the absolute economic values v
A
m
and v
A
v
is determined mainly by the lo-
cation of the population mean relative to both thresholds, but is also affected
by σ
2
P
. For determining the effect of economic values on genetic gain, how-
ever, the relative emphasis on the traits (e.g.
v
A
v
σ
A
v
v
A
v
σ
A
v
+v
A
m
σ
A
m
), is more relevant.
Appendix B shows that the relative emphases on A
m
and A
v
are solely deter-
mined by the standardised deviation of the population mean from the optimum.
This is also the case when economic values for optimum traits are based on
quadratic profit.
Derivation of economic values can easily be extended to situations with
several thresholds, as is shown for economic values for the mean of traits,
e.g. calving ease in dairy cattle and meat quality in pigs [2, 9, 40]. A special
case is one threshold, in which the terms relating to the second threshold in
equations (8a) and (8b) can be omitted. An example is the avoidance of poor
animal performance that may reduce consumer acceptance of the production
system, so an objective may be to reduce the proportion of animals below a
certain threshold [22].
2.4. Prediction of genetic gain
Genetic gain after one generation of selection was calculated deterministi-
cally using the classical selection index theory [15]. Most elements in the P
“g07011” — 2007/12/12 — 11:46 — page 43 — #7
✐
✐
✐
✐
✐
✐
✐
✐
Selection for uniformity in livestock 43
and G matrices were derived by Mulder et al. [30]; the others are derived in
Appendix A. Genetic gain was calculated per unit of time to account for the
longer generation interval of sires with progeny testing, where one unit of time
was equal to the generation interval of sib testing [29]. Genetic gain per unit
of time for trait j (A
m
, A
v
, H)wasΔG
j
=
R
S, j
+R
D, j
L
S
+L
D
,whereR
S, j
and R
D, j
are
the genetic selection differentials and L
S
and L
D
are the relative generation in-
tervals for sires and dams, respectively. Genetic selection differentials for A
m
and A
v
were calculated as R
j
=
ib
g
j
σ
I
,wherei is the selection intensity, g
j
is the
column of G corresponding to A
m
or A
v
,andσ
I
=
√
b
Pb is the standard de-
viation of the index. Genetic selection differentials of the aggregate genotype
were calculated as R
H
= v
A
m
R
A
m
+ v
A
v
R
A
v
.
Gametic phase disequilibrium due to selection [5] was ignored. Although
Hill and Zhang [17] developed prediction equations to account for gametic
phase disequilibrium with mass selection, such equations have not yet been de-
veloped for index selection in the presence of genetic heterogeneity of residual
variance. Selection intensities were calculated assuming an infinite population
of selection candidates without correction for correlated index values among
relatives [16, 27, 31], because these corrections would have less effect on ge-
netic gain than gametic phase disequilibrium, which was already ignored.
To check the quality of the predictions of the selection index equations
for one generation of selection, predicted selection responses were compared
with realised selection responses obtained from Monte Carlo simulation (see
App. C). Prediction errors (Tab. A.I) were small to moderate, but sufficiently
small to justify using selection index equations in this exploratory study.
2.5. Parameter values and common cases with non-linear profit
Parameter values are listed in Table I. The heritability of the mean (h
2
m
=
σ
2
A
m
/σ
2
P
) was assumed to be 0.3; the phenotypic variance was assumed to be
1.0. The genetic variance in residual variance σ
2
A
v
was varied between 0.01
and 0.10, corresponding to the range of heritabilities of residual variance
(h
2
v
= σ
2
A
v
(2σ
4
P
+ 3σ
2
A
v
)) observed in the literature (see [30] for derivation and
review). The additive genetic correlation (r
A
) between A
m
and A
v
was var-
ied between –0.5 and 0.5, corresponding to the range in the literature for the
analysis of body weight of snails, body weight of broilers and litter size of
pigs [33, 35, 38]. Economic values v
A
m
and v
A
v
were varied and arbitrary val-
ues were initially used. In most species, the generation interval for progeny
testing is at least 1.6 times that for sib testing e.g. [25, 26]. Therefore, the rela-
tive generation interval of sib testing was set to 1.0 and that of progeny tested
“g07011” — 2007/12/12 — 11:46 — page 44 — #8
✐
✐
✐
✐
✐
✐
✐
✐
44 H.A. Mulder et al.
Tab le I. Parameter values used in the basic situation and in alternative situations.
Parameter Parameter values
Basic Alternative
σ
2
A
m
0.3 0.1, 0.6
σ
2
P
1.0 –
σ
2
A
v
0.05 0.01, 0.10
r
A
0 –0.5, 0.5
v
A
m
1variable
v
A
v
–1 variable
Number of half-sib progeny 50 20, 50, 100, 200
Selected proportion sires 0.05 –
Selected proportion dams 0.20 –
sires was varied between 1.4 and 2 [29]. Responses to selection were predicted
after one generation of selection, except for the cases with non-linear profit
(see Sect. 2.5.1).
2.5.1. Non-linear profit
Sib testing schemes were simulated with three types of non-linear profit:
quadratic profit (r
1
= −1, r
2
= 2andO = 0), and differential profit based
on one threshold (T
l
= −1) or two thresholds (T
l
= −1, T
u
= 1, O = 0).
The initial population mean was –2 (= −2σ
P
). Five generations of selection
were simulated with updating of economic values (Eqs. 6 and 8) and index
weights to changes in mean and phenotypic variance. The elements of P were
not, however, updated for changes in σ
2
E
, i.e. ignoring changes in h
2
m
and h
2
v
.
To avoid oscillations around the optimum when the mean of the trait was close
to it for models of quadratic profit or differential profit based on two thresholds
(< ΔA
m
in previous generation), the economic value v
A
m
was derived iteratively
to obtain the desired gain in A
m
to reach and stay in the optimum, similar to a
desired gains approach e.g. [3].
3. RESULTS
3.1. Effects of parameters and breeding scheme
3.1.1. Genetic variances σ
2
A
m
and σ
2
A
u
Table II shows genetic gain in A
m
, A
v
and the effect on the residual variance
after one generation of selection in a sib testing scheme (σ
2
E,1
) for different
“g07011” — 2007/12/12 — 11:46 — page 45 — #9
✐
✐
✐
✐
✐
✐
✐
✐
Selection for uniformity in livestock 45
Table II. Genetic gain
a
after one generation of index selection in sib testing schemes
for different values of σ
2
A
m
and σ
2
A
v
for an arbitrary breeding goal (v
A
m
= 1, v
A
v
= −1)
b
.
Genetic parameters Genetic gain Residual variance
c
σ
2
A
m
σ
2
A
v
ΔA
m
ΔA
v
σ
2
E,0
σ
2
E,1
0.10 0.01 0.253 –0.002 0.900 0.898
0.05 0.234 –0.043 0.900 0.857
0.10 0.202 –0.118 0.900 0.782
0.30 0.01 0.603 –0.001 0.700 0.699
0.05 0.593 –0.020 0.700 0.680
0.10 0.573 –0.062 0.700 0.638
0.60 0.01 1.074 –0.001 0.400 0.399
0.05 1.068 –0.013 0.400 0.387
0.10 1.055 –0.038 0.400 0.362
a
Equals genetic gain per time unit.
b
Parameters values: σ
2
P
= 1, r
A
= 0, number of progeny per sire = 50, selected proportion sires
= 0.05, selected proportion dams = 0.20.
c
Residual variance in generation 0 (σ
2
E,0
) and in generation 1 (σ
2
E,1
) after selection.
values of σ
2
A
m
and σ
2
A
v
. Because the relative generation interval of sib testing
was set to 1, genetic gain per time unit was equal to genetic gain per generation.
When σ
2
A
m
increases, ΔA
m
increases substantially and ΔA
v
decreases, whereas
when σ
2
A
v
increases the opposite occurs but to a lesser extent. Both trends agree
with the behaviour of a selection index, which puts most emphasis on the trait
with the highest heritability and/or with the largest contribution to the genetic
variance in the breeding goal. The decrease in residual variance is 0.25%–13%
of the current residual variance. Simultaneous improvement of the mean and
the variance of a trait with index selection in sib testing schemes thus requires a
heritability of residual variance of at least 0.02, and the reduction of phenotypic
variance by selecting for reduced residual variance is the largest for traits with
a low heritability of the mean.
3.1.2. Genetic correlation r
A
and breeding goal
Table III shows the effect of r
A
and breeding goals with arbitrary economic
values on genetic gain after one generation of selection in a sib testing scheme.
With a relatively low emphasis on A
v
(v
=
1 −1
), ΔA
v
is mostly a corre-
lated response to selection on the mean, as indicated by the similar ΔA
v
with
v
=
10
. When increasing the emphasis on A
v
, ΔA
v
is in the direction of
the economic value and ΔA
m
is now more affected by r
A
. With a breeding
“g07011” — 2007/12/12 — 11:46 — page 46 — #10
✐
✐
✐
✐
✐
✐
✐
✐
46 H.A. Mulder et al.
Table III. Genetic gain
a
after one generation of index selection in sib testing schemes
for different breeding goals with arbitrary sets of economic values and r
A
b
.
Breeding goal Genetic gain
Description v
A
m
v
A
v
r
A
ΔA
m
ΔA
v
σ
2
E,1
c
Only A
m
1 0 –0.50 0.603 –0.123 0.577
0.00 0.603 0.000 0.700
0.50 0.603 0.123 0.823
Both A
m
and A
v
1 –1 –0.50 0.599 –0.133 0.567
0.00 0.593 –0.020 0.680
0.50 0.594 0.107 0.807
1 –5 –0.50 0.569 –0.146 0.554
0.00 0.443 –0.076 0.624
0.50 –0.025 –0.091 0.609
Only A
v
0 –1 –0.50 0.495 –0.151 0.549
0.00 0.000 –0.111 0.589
0.50 –0.495 –0.151 0.549
a
Equals genetic gain per time unit.
b
Parameter values: σ
2
P
= 1, σ
2
A
m
= 0.3, σ
2
E,0
= 0.7, σ
2
A
v
= 0.05, number of progeny per sire =
50, selected proportion sires = 0.05, selected proportion dams = 0.20.
c
Residual variance in generation 1 (σ
2
E,1
) after selection.
goal v
=
1 −5
, the current σ
2
E
decreases by 11–21% after one generation of
selection at the expense of a lower genetic gain in the mean (ΔA
m
). Thus rela-
tively large changes in residual variance in the desired direction are possible if
substantial emphasis is put on A
v
in the breeding goal.
3.1.3. Number of half-sibs
Table IV shows genetic gain after one generation of index selection as a
function of the number of half-sibs per sire family for sib testing schemes
for two breeding goals with arbitrary sets of economic values, v
=
1 −5
and v
=
1 −1
. For both goals, ΔA
v
decreases when the number of half-
sibs increases, especially for the former, while for the latter, ΔA
m
is almost
constant and the increase in ΔH is small. For the breeding goal v
=
1 −5
,
ΔA
m
decreases when the number of half-sibs increases, because more emphasis
is given to A
v
by the index. The increase in ΔH is large when the number of
half-sibs increases. To achieve a substantial reduction of residual variance, the
size of half-sibs groups should be at least 50.
“g07011” — 2007/12/12 — 11:46 — page 47 — #11
✐
✐
✐
✐
✐
✐
✐
✐
Selection for uniformity in livestock 47
Tab le IV. Genetic gain
a
in A
m
and A
v
and in the aggregate genotype after one genera-
tion of index selection as a function of the number of half-sib progeny per sire for sib
testing schemes for two breeding goals with arbitrary sets of economic values
b
.
Breeding goal Genetic gain
v
A
m
v
A
v
Number of progeny ΔA
m
ΔA
v
ΔH
1 –1 20 0.578 –0.013 0.591
50 0.593 –0.020 0.613
100 0.598 –0.029 0.627
200 0.599 –0.038 0.637
1 –5 20 0.468 –0.052 0.728
50 0.443 –0.076 0.821
100 0.414 –0.099 0.906
200 0.385 –0.121 0.992
a
Equals genetic gain per time unit.
b
Parameter values: σ
2
P
= 1, σ
2
A
m
= 0.3, σ
2
A
v
= 0.05, r
A
= 0, selected proportion sires = 0.05,
selected proportion dams = 0.20.
3.1.4. Progeny testing versus sib testing
Table V shows genetic gain per time unit for progeny testing schemes in
comparison to sib testing schemes after one generation of selection for two
arbitrary breeding goals as a function of the relative generation interval of
progeny tested sires. In these situations, progeny testing schemes are supe-
rior for decreasing the residual variance (ΔA
v
), but are inferior for ΔA
m
unless
the relative generation interval of progeny tested sires is short (= 1.4). Progeny
testing schemes give higher ΔH than sib testing schemes with v
A
v
= −1 only
when the relative generation interval of progeny tested sires is short (= 1.4),
whereas with v
A
v
= −5, they do so unless the relative generation interval
exceeds 1.6. Progeny testing schemes are, therefore, superior to sib testing
schemes for decreasing residual variance, but provide lower genetic gain in
the aggregate genotype when the relative generation interval of progeny test-
ing is larger than 1.6 and when the breeding goal is mainly to change A
m
.
3.2. Common cases with non-linear profit
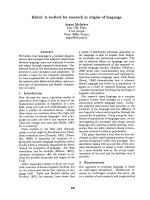
3.2.1. Quadratic profit
Figures 2A, 2B, 2C and 2D show respectively the economic values for A
m
and A
v
, mean, phenotypic variance and the weighted profit of the population as
a function of generation number for different values of r
A
with index selection
“g07011” — 2007/12/12 — 11:46 — page 48 — #12
✐
✐
✐
✐
✐
✐
✐
✐
48 H.A. Mulder et al.
Tab le V. Genetic gain after one generation of index selection, expressed as gain per
time unit, in A
m
and A
v
and in the aggregate genotype for progeny testing schemes
in comparison to sib testing schemes for two breeding goals with arbitrary sets of
economic values as a function of the relative generation interval of progeny tested
sires (L
S
)
a
.
Breeding goal Genetic gain
Breeding scheme v
A
m
v
A
v
L
S
ΔA
m
ΔA
v
ΔH
rel
b
Sib 1 –1 1.0 0.593 –0.020 100.0
Progeny 1.4 0.611 –0.028 104.2
1.6 0.564 –0.026 96.2
1.8 0.524 –0.024 89.3
2.0 0.489 –0.022 83.4
Sib 1 –5 1.0 0.443 –0.076 100.0
Progeny 1.4 0.428 –0.098 111.5
1.6 0.395 –0.090 102.9
1.8 0.367 –0.084 95.6
2.0 0.342 –0.078 89.2
a
Parameter values: σ
2
P
= 1, σ
2
A
m
= 0.3, σ
2
A
v
= 0.05, r
A
= 0, number of progeny per sire = 50,
selected proportion sires = 0.05, selected proportion dams = 0.20.
b
Genetic gain in the aggregate genotype as a percentage relative to a sib testing scheme
(ΔH/ΔH
sib
) ∗100%.
for five generations in sib testing schemes for a quadratic profit equation. In the
first three generations v
A
m
is much larger than v
A
v
in absolute terms (Fig. 2A).
The population mean reaches the optimum in four generations and remains
there in the fifth (Fig. 2B), as a consequence of a desired gains approach. Ge-
netic gain in mean depends little on r
A
in the first three generations and the
phenotypic variance changes mostly as a correlated response to selection on
the mean (Fig. 2C). In generations 4 and 5, the phenotypic variance decreases
for all values of r
A
. Profit increases curvilinearly, as expected. The increase
in profit is initially due mainly to increasing the mean to the optimum value
(Fig. 2D), and the subsequent increase in profit due to decreasing phenotypic
variance after generation 4 is relatively small. Therefore, for optimum traits
with quadratic profit, it is most important to bring the mean to the optimum
value and then to reduce the variance of the population when at the optimum.
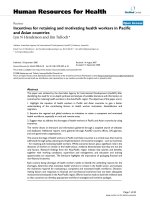
3.2.2. Differential profit based on one threshold
Figure 3A shows the general behaviour of equations (8a) and (8b) as
a function of the population mean when profit is based on one threshold.
“g07011” — 2007/12/12 — 11:46 — page 49 — #13
✐
✐
✐
✐
✐
✐
✐
✐
Selection for uniformity in livestock 49
-2
-1
0
1
2
3
4
012345
Generation
Economic value
A
v
Am
; r
A
= -0.5
v
Am
; r
A
= 0.0
v
Am
; r
A
= 0.5
v
Av
-2.0
-1.5
-1.0
-0.5
0.0
012345
Generation
Mean
B
r
A
= -0.5
r
A
= 0.0
r
A
= 0.5
0.2
0.4
0.6
0.8
1.0
1.2
1.4
012345
Generation
Phenotypic variance
C
r
A
= -0.5 r
A
= 0.0 r
A
= 0.5
-3
-2
-1
0
1
2
012345
Generation
Profit
D
r
A
= -0.5
r
A
= 0.0
r
A
= 0.5
r
A
= -0.5; v
Av
= 0
r
A
= 0.0; v
Av
=0
r
A
= 0.5; v
Av
=0
Figure 2. Economic values for A
m
(v
A
m
)andA
v
(v
A
v
) (panel A), mean (panel B), pheno-
typic variance (panel C) and profit (panel D) as a function of generation number with a
quadratic profit equation (M = −(P −0)
2
+ 2) for different values of the genetic corre-
lation (r
A
) with index selection for five generations of selection in sib testing schemes;
panel D also shows the profit as a function of generation number when ignoring A
v
(lines without markers, v
A
v
= 0). Input parameters: σ
2
P
= 1, σ
2
A
m
= 0.3, σ
2
A
v
= 0.05,
number of progeny per sire = 50, selected proportion sires = 0.05, selected proportion
dams = 0.20.
The economic value v
A
m
is maximum and v
A
v
is zero at the threshold, and an-
imals below and above the threshold are equally frequent, such that the profit
would increase substantially when the mean increases, but not when the vari-
ance changes. While v
A
m
is always positive, v
A
v
is positive (negative) when
the population mean is lower (higher) than the threshold, because increasing
(decreasing) the variance would increase the frequency of animals above the
threshold.
Figures 4A and 4B show the population mean and the phenotypic variance
as a function of generation number with index selection for five generations
in sib testing schemes. When profit is based on one threshold, the population
“g07011” — 2007/12/12 — 11:46 — page 50 — #14
✐
✐
✐
✐
✐
✐
✐
✐
50 H.A. Mulder et al.
-0.2
-0.1
0
0.1
0.2
0.3
0.4
0.5
-4 -2 0 2 4
Population M ean Phe notype
Economic value
threshold
A
A
m
A
v
-0.5
-0.3
-0.1
0.1
0.3
0.5
-4 -2 0 2 4
Population M ean Phe notype
Economic value
threshold
B
A
m
A
v
Figure 3. Economic values for A
m
and A
v
in the base generation as a function of the
population mean for a normally distributed trait when profit is based on one threshold
(T
l
= −1) (panel A) or two thresholds (T
l
= −1, T
u
= 1, O = 0) (panel B) (σ
2
P
= 1).
-2.0
-1.5
-1.0
-0.5
0.0
0.5
1.0
012345
Generation
Mean
quadratic
one threshold
two thresholds
A
0.6
0.7
0.8
0.9
1.0
1.1
012345
Generation
Phenotypic varianc
e
quadratic
one threshold
two thresholds
B
Figure 4. The mean (panel A) and phenotypic variance (panel B) as a function of
generation number with index selection on non-linear profit for five generations of
selection in sib testing schemes (quadratic (r
1
= −1, r
2
= 2andO = 0), one threshold
(T
l
= −1) or two thresholds (T
l
= −1, T
u
= 1, O = 0)). Input parameters: σ
2
P
= 1,
σ
2
A
m
= 0.3, σ
2
A
v
= 0.05, r
A
= 0, number of progeny per sire = 50, selected proportion
sires = 0.05, selected proportion dams = 0.20.
mean increases almost constantly with each generation. The phenotypic vari-
ance increases slightly in the first two generations and decreases slightly af-
terwards, because v
A
v
changes from positive to negative but is small relative
to v
A
m
. Thus with one threshold, most emphasis is on changing the mean and
changing the variance is of minor importance.
“g07011” — 2007/12/12 — 11:46 — page 51 — #15
✐
✐
✐
✐
✐
✐
✐
✐
Selection for uniformity in livestock 51
3.2.3. Differential profit based on two thresholds
When profit is based on two thresholds, the economic value of A
m
(v
A
m
)isat
a maximum or minimum close to both thresholds, is zero in the optimum P = 0
and is positive (negative) when the population mean is lower (higher) than the
optimum (Fig. 3B). When the population mean is outside both thresholds, v
A
v
is
slightly positive because increasing the variance will increase the frequency of
animals within the thresholds. When the population mean is within the thresh-
olds, v
A
v
is negative because decreasing variance will increase the frequency
of animals within the optimum range. The pattern of v
A
m
is similar to that ob-
served by Hovenier et al. [19].
With continuous index selection, the mean increases up to the optimum
(Fig. 4A) and the phenotypic variance increases for the first two generations
and decreases afterwards at a substantial rate after generation 3 when the
mean is (almost) in the optimum (Fig. 4B). Due to the decreased phenotypic
variance, 74% of the animals in generation 5 are within the optimum range,
whereas only 68% of the animals would have been so without selection for re-
duced phenotypic variance. The changes in the mean and phenotypic variance
are similar to those for quadratic profit and, furthermore, also very similar for
other threshold values (results not shown). As a generalisation, changes in the
mean and variance of optimum traits do not seem to be very sensitive to the
shape of the profit equation, and the selection index first drives the mean to
reach the optimum and then targets a reduction in the phenotypic variance.
4. DISCUSSION
4.1. Methodology and results
In this study, possibilities for exploiting genetic heterogeneity of residual
variance to change both the mean and the variance of a trait by index selection
were explored. In general, for most traits the heritability of residual variance is
low [30], in the range 0.02–0.05 [33, 35–38], and also lower than the heritabil-
ity of the mean. Consequently, breeding to change the mean and the variance
simultaneously is similar to breeding for two traits, one with a moderate heri-
tability and the other with a low heritability.
Inclusion of residual variance in the breeding goal is important only when
the profit equation is non-linear; but, even so, in most situations the optimal in-
dex puts more selection pressure on the mean so that changes in residual vari-
ance are small. If the population mean is near an optimum, however, changes
“g07011” — 2007/12/12 — 11:46 — page 52 — #16
✐
✐
✐
✐
✐
✐
✐
✐
52 H.A. Mulder et al.
in residual variance can be large, over 10% of the current level, because it has
a high genetic coefficient of variation σ
A
v
σ
2
E
[30].
In this study, gametic phase disequilibrium due to selection (the “Bulmer
effect”) [5] was ignored, because prediction equations have not yet been de-
veloped to accommodate this with index selection in the presence of genetic
heterogeneity of residual variance. In general, accounting for the Bulmer effect
would decrease selection responses as a consequence of a lower genetic vari-
ance at equilibrium, but the influence on ranking of breeding schemes is typ-
ically small [42]. More important perhaps, the Bulmer effect leads to changes
in the genetic variance of the mean and as such obscures the responses in phe-
notypic variance obtained from changing the residual variance. Its effect is at
most about 6–8% of the phenotypic variance for an initial h
2
m
= 0.3 (based
on formulae of Dekkers [8] comparing the equilibrium genetic variance with
the genetic variance in the base generation). However, if the breeding goal has
been to select on the mean for more than two or three generations, the ge-
netic variance of the mean becomes rather stable and responses in phenotypic
variance would be due almost entirely to responses in residual variance.
In this study, selection responses were predicted using a selection index
framework in which, in principle, fixed effects are assumed to be known with-
out error. In practice, fixed and random effects are simultaneously estimated
using a mixed model BLUP analysis. There may be fixed effects both for the
mean (e.g. herd effect) and the variance (e.g. heterogeneity of variance between
herds). Heterogeneity of variance between herds is commonly found for milk
production of dairy cattle [4], for example, and can be accounted for in stan-
dard breeding value estimation e.g. [28]. A model with genetically structured
residual variance can be used to estimate simultaneously breeding values and
fixed effects for mean and residual variance [36,38]. Disentangling heterogene-
ity of residual variance due to genotype from that due to the herd environment
is, however, challenging and may require larger half-sib groups rather than
those used in this study. The results presented here should therefore be inter-
preted as using an effective number of half-sibs that is lower than the actual
number.
There is some evidence that heterozygotes tend to have a smaller residual
variance than homozygotes [23, 24, 32], while a few studies have reported the
opposite (Lynch and Walsh [23]). If heterozygotes have a smaller residual vari-
ance, then selection for reduced variance would favour heterozygotes. Further-
more, inbreeding reduces the Mendelian sampling variance among progeny,
such that selection for reduced variance among progeny would favour more
inbred parents. Both aspects reduce genetic variance of the mean amongst
“g07011” — 2007/12/12 — 11:46 — page 53 — #17
✐
✐
✐
✐
✐
✐
✐
✐
Selection for uniformity in livestock 53
selected individuals, which would be an unfavourable consequence while ge-
netic improvement of the mean is still important. The effect of inbreeding level
of a parent on Mendelian sampling variance in its progeny can be eliminated,
however, by adjusting the within-family variance for the inbreeding level of
the parents. Furthermore, the effect of a selective advantage of heterozygotes
on genotype frequencies is negligible for the infinitesimal model. Although
selection experiments in Drosophila and Tribolium have indeed shown that se-
lection for reduced phenotypic variance decreases both the residual and the
genetic variances [6, 21], it is not known whether the latter is due to a build up
of gametic phase disequilibrium or breakdown of infinitesimal model assump-
tions.
4.2. Exploiting genetic heterogeneity of residual variance in breeding
programmes
When there is genetic variation in residual variance and the economic value
of variance (per unit
2
) is at least of the same magnitude as the economic value
of the mean (per unit), it can be worthwhile to exploit this genetic hetero-
geneity in breeding programmes. We consider in turn steps needed for imple-
mentation in practice: (1) estimation of breeding values for residual variance,
(2) construction of a selection criterion, and (3) optimisation of the breeding
programme.
As a first step, breeding values for mean and residual variance could be es-
timated by extending the mixed model framework [36, 38] and implementing
this in software for routine genetic evaluation, which might be a challenge
in itself. Since the heritability of residual variance is low, estimated breeding
values (EBV) for residual variance would heavily rely on family information.
Large family group sizes (e.g. 50–100 half-sib progeny) are necessary to esti-
mate EBV
v
with sufficient accuracy [30].
Secondly, when EBV are based on a multivariate approach [36, 38], a lin-
ear selection index, I = v
A
m
EBV
m
+ v
A
v
EBV
v
, could be used as the selection
criterion. A linear index with economic values derived as first derivatives is,
however, not optimal with non-linear profit equations [12]. Assuming no ge-
netic heterogeneity of residual variance, Goddard [12] concluded that the best
linear index is better than a non-linear index. Formally, the proposed index is
not linear, because the EBV
v
is based upon quadratic terms of phenotype (P
2
and varW), and consequently his conclusion does not hold with genetic hetero-
geneity of residual variance. San Cristobal-Gaudy et al. [36] used a quadratic
index as proposed by Wilton et al. [41] to breed for an optimum trait with
“g07011” — 2007/12/12 — 11:46 — page 54 — #18
✐
✐
✐
✐
✐
✐
✐
✐
54 H.A. Mulder et al.
genetic heterogeneity of residual variance. Their quadratic index consisted of
the squared difference of the progeny mean from the optimum and the within-
family variance with equal weights. These weights are not optimal and there-
fore too much emphasis is placed on
P
2
, which contains very little information
about A
v
and none about A
m
. Hence, it is worse than a linearized selection
index with updated economic values in each generation as used in this study
(results not shown). Such a linearised index is therefore recommended for prac-
tical implementation.
Finally, the breeding programme may need to be optimised when including
residual variance in the breeding goal and in the index. For example, our results
show that progeny testing schemes are more efficient in reducing residual vari-
ance than sib testing schemes (Tab. V). Therefore, when reducing variance is
a major goal, progeny testing schemes may be better than sib testing schemes
even at the cost of a longer generation interval.
5. CONCLUSIONS
This study shows that it is possible to change the mean and the variance
of traits simultaneously in livestock breeding programmes if there is genetic
heterogeneity of residual variance. Economic values for mean and variance
were derived for some standard non-linear profit equations, e.g. for traits with
an intermediate optimum. Inclusion of residual variance in the breeding goal is
of importance only when the profit equation is non-linear. Thus for a trait with
an intermediate optimum, most economic gain is initially due to change in the
mean, but selection pressure shifts gradually from the mean to the variance
as the optimum is approached. Near the optimum, uniformity becomes the
main goal, and so reduction of variance could further improve economic merit.
Progeny testing schemes are predicted to give more rapid change in the residual
variance than sib testing schemes, but at the cost of a lower genetic gain in the
mean, mainly due to prolonged generation intervals. Predicted responses in
residual variance after one generation of selection were large, in some cases
when the number of progeny per sire was at least 50, by more than 10% of the
current residual variance.
ACKNOWLEDGEMENTS
H.M. thanks Johan van Arendonk, Bart Ducro and Roel Veerkamp for
helpful comments on earlier versions of this article and Egbert Knol and
Addie Vereijken for valuable discussions about the practical relevance of this
“g07011” — 2007/12/12 — 11:46 — page 55 — #19
✐
✐
✐
✐
✐
✐
✐
✐
Selection for uniformity in livestock 55
research. We thank two anonymous reviewers and the editor, Erling Strand-
berg, for helpful comments on an earlier version of this article. W.G.H. thanks
the Biotechnology and Biological Sciences Research Council for research sup-
port.
REFERENCES
[1] Barwick S.A., Henzell A.L., Assessing the value of improved marbling in beef
breeding objectives and selection, Austr. J. Agric. Res. 50 (1999) 503–512.
[2] Bekman H., van Arendonk J.A.M., Derivation of economic values for veal, beef
and milk production traits using profit equations, Livest. Prod. Sci. 34 (1993)
35–56.
[3] Brascamp E.W., Selection indices with constraints, Anim. Breed. Abstr. 52
(1984) 645–654.
[4] Brotherstone S., Hill W.G., Heterogeneity of variance amongst herds for milk
production, Anim. Prod. 42 (1986) 297–303.
[5] Bulmer M.G., The effect of selection on genetic variability, Am. Nat. 105 (1971)
201–211.
[6] Cardin S., Minvielle F., Selection on phenotypic variation of pupa weight in
Tribolium castaneum, Can. J. Genet. Cytol. 28 (1986) 856–861.
[7] Clay J.S., Vinson W.E., White J.M., Heterogeneity of daughter variances of sires
for milk yield, J. Dairy Sci. 62 (1979) 985–989.
[8] Dekkers J.C.M., Asymptotic response to selection on best linear unbiased pre-
dictors of breeding values, Anim. Prod. 54 (1992) 351–360.
[9] Dekkers J.C.M., Optimal breeding strategies for calving ease, J. Dairy Sci. 77
(1994) 3441–3453.
[10] Dekkers J.C.M., Birke P.V., Gibson J.P., Optimum linear selection indexes for
multiple generation objectives with non-linear profit functions, Anim. Sci. 61
(1995) 165–175.
[11] Garnier J.P., Klont R., Plastow G., The potential impact of current animal re-
search on the meat industry and consumer attitudes towards meat, Meat Sci. 63
(2003) 79–88.
[12] Goddard M.E., Selection indices for non-linear profit functions, Theor. Appl.
Genet. 64 (1983) 339–344.
[13] Groen A.F., Meuwissen T.H.E., Vollema A.R., Brascamp E.W., A comparison
of alternative index procedures for multiple generation selection on non-linear
profit, Anim. Prod. 59 (1994) 1–9.
[14] Hammerstedt R.H., Symposium summary and challenges for the future, Poultry
Sci. 78 (1999) 459–466.
[15] Hazel L.N., The genetic basis for constructing selection indexes, Genetics 28
(1943) 476–490.
[16] Hill W.G., Order statistics of correlated variables and implications in genetic
selection programmes, Biometrics 32 (1976) 889–902.
“g07011” — 2007/12/12 — 11:46 — page 56 — #20
✐
✐
✐
✐
✐
✐
✐
✐
56 H.A. Mulder et al.
[17] Hill W.G., Zhang X S., Effects of phenotypic variability of directional selection
arising through genetic differences in residual variability, Genet. Res. Camb. 83
(2004) 121–132.
[18] Hohenboken W.D., The manipulation of variation in quantitative traits: a review
of possible genetic strategies, J. Anim. Sci. 60 (1985) 101–110.
[19] Hovenier R., Brascamp E.W., Kanis E., van der Werf J.H.J., Wassenberg
A.P.A.M., Economic values of optimum traits: the example of meat quality in
pigs, J. Anim. Sci. 71 (1993) 1429–1433.
[20] Kanis E., van Pelt M.L., Bonekamp P.R.T., Knol E.F., Is within-family varia-
tion in carcass weight of pigs heritable? Proc. 8th World Congress Genet. Appl.
Livest. Prod., Belo Horizonte, Brazil, 2006, Communication 06-23.
[21] Kaufman P.K., Enfield F.D., Comstock R.E., Stabilizing selection for pupa
weight in Tribolium castaneum, Genetics 87 (1977) 327–341.
[22] Kolmodin R., Bijma P., Response to mass selection when genotype by envi-
ronment interaction is modelled as a linear reaction norm, Genet. Sel. Evol. 36
(2004) 435–454.
[23] Lynch M., Walsh B., Genetics and analysis of quantitative traits, Sinauer
Associates, Inc. Publishers, Sunderland, Massachusetts, US, 1998.
[24] Mackay T.F.C., Lyman R.F., Drosophila bristles and the nature of quantitative
genetic variation, Philo. Trans. R. Soc. B. 360 (2005) 1513–1527.
[25] Merks J.W.M., Genotype × environment interactions in pig breeding pro-
grammes, Ph.D. thesis, Landbouwuniversiteit Wageningen, Wageningen,
The Netherlands, 1988.
[26] Meuwissen T.H.E., A deterministic model for the optimization of dairy cattle
breeding based on BLUP breeding value estimates, Anim. Prod. 49 (1989) 193–
202.
[27] Meuwissen T.H.E., Reduction of selection differentials in finite populations with
a nested full-half sib family structure, Biometrics 47 (1991) 195–203.
[28] Meuwissen T.H.E., De Jong G., Engel B., Joint estimation of breeding values
and heterogeneous variances of large data files, J. Dairy Sci. 79 (1996) 310–316.
[29] Mulder H.A., Bijma P., Effects of genotype × environment interaction on genetic
gain in breeding programs, J. Anim. Sci. 83 (2005) 49–61.
[30] Mulder H.A., Bijma P., Hill W.G., Prediction of breeding values and selection
responses with genetic heterogeneity of environmental variance, Genetics 175
(2007) 1895–1910.
[31] Rawlings J.O., Order statistics for a special class of unequally correlated multi-
normal variates, Biometrics 32 (1976) 875–887.
[32] Robertson F.W., Reeve E.C.R., Heterozygosity, environmental variation and het-
erosis, Nature 170 (1952) 286.
[33] Ros M., Sorensen D., Waagepetersen R., Dupont-Nivet M., San Cristobal M.,
Bonnett J.C., Mallard J., Evidence for genetic control of adult weight plasticity
in the snail Helix aspersa, Genetics 168 (2004) 2089–2097.
[34] Rose S.P., Principles of poultry science, CAB International, Wallingford, UK,
1996.
[35] Rowe S.J., White I.M.S., Avendano S., Hill W.G., Genetic heterogeneity of
residual variance in broiler chickens, Genet. Sel. Evol. 38 (2006) 617–635.
“g07011” — 2007/12/12 — 11:46 — page 57 — #21
✐
✐
✐
✐
✐
✐
✐
✐
Selection for uniformity in livestock 57
[36] San Cristobal-Gaudy M., Elsen J.M., Bodin L., Chevalet C., Prediction of the
response to a selection for canalisation of a continuous trait in animal breeding,
Genet. Sel. Evol. 30 (1998) 423–451.
[37] San Cristobal-Gaudy M., Bodin L., Elsen J.M., Chevalet C., Genetic components
of litter size variability in sheep, Genet. Sel. Evol. 33 (2001) 249–271.
[38] Sorensen D., Waagepetersen R., Normal linear models with genetically struc-
tured residual variance heterogeneity: a case study, Genet. Res. Camb. 82 (2003)
207–222.
[39] van Vleck L.D., Variation of milk records within paternal-sib groups, J. Dairy
Sci. 51 (1968) 1465–1470.
[40] Von Rohr P., Hofer A., Künzi N., Economic values for meat quality traits in pigs,
J. Anim. Sci. 77 (1999) 2633–2640.
[41] Wilton J.W., Anthony Evans D., van Vleck L.D., Selection indices for quadratic
models of total merit, Biometrics 24 (1968) 937–949.
[42] Wray N.R., Hill W.G., Asymptotic rates of response from index selection, Anim.
Prod. 49 (1989) 217–227.
APPENDIX A: THE P AND G MATRIX OF THE SELECTION
INDEX
The P and G matrices used in setting up the selection index are given here
for one generation of selection. Derivations of most elements were given by
Mulder et al. [30] and those for others follow.
P =
⎡
⎢
⎢
⎢
⎢
⎢
⎢
⎢
⎢
⎢
⎢
⎢
⎢
⎢
⎢
⎢
⎢
⎢
⎢
⎢
⎢
⎣
var(P
k
)cov(P
k
, P
2
k
)cov(P
k
, P)cov(P
k
, (P)
2
)cov(P
k
, varW)
var(P
2
k
)cov(P
2
k
, P)cov(P
2
k
, (P)
2
)cov(P
2
k
, varW)
var(
P)cov(P, (P)
2
)cov(P, varW)
var((
P)
2
)cov((P)
2
, varW)
symmetric var(varW)
⎤
⎥
⎥
⎥
⎥
⎥
⎥
⎥
⎥
⎥
⎥
⎥
⎥
⎥
⎥
⎥
⎥
⎥
⎥
⎥
⎥
⎦
cov(P
k
, P) = n cov(P
k
, P
l
)/n = a
k
σ
2
A
m
cov(P
2
k
, P) = n cov(P
2
k
, P
l
)/n = a
k
cov
A
mv
cov(P
k
, (P)
2
) = [n cov(P
k
, P
2
l
) + n(n − 1)cov(P
k
, P
l
P
m
)]/n
2
= a
k
cov
A
mv
/n
cov(P
2
k
, (P)
2
) = [n cov(P
2
k
, P
2
l
) + n(n − 1)cov(P
2
k
, P
l
P
m
)]/n
2
= 2a
2
k
σ
4
A
m
+ a
k
σ
2
A
v
/n
cov(P
k
, varW) = [n/n − 1] × [cov(P
k
, P
2
) − cov(P
k
, (P)
2
)] = a
k
cov
A
mv
cov(P
2
k
, varW) = [n/n − 1] × [cov(P
2
k
, P
2
) −cov(P
2
k
, (P)
2
)] = a
k
σ
2
A
v
“g07011” — 2007/12/12 — 11:46 — page 58 — #22
✐
✐
✐
✐
✐
✐
✐
✐
58 H.A. Mulder et al.
and
G =
⎡
⎢
⎢
⎢
⎢
⎢
⎢
⎢
⎢
⎢
⎢
⎢
⎢
⎢
⎢
⎢
⎢
⎢
⎢
⎢
⎢
⎢
⎣
σ
2
A
m
cov
A
mv
cov
A
mv
σ
2
A
v
a
k
σ
2
A
m
a
k
cov
A
mv
a
k
cov
A
mv
na
k
σ
2
A
v
n
a
k
cov
A
mv
a
k
σ
2
A
v
⎤
⎥
⎥
⎥
⎥
⎥
⎥
⎥
⎥
⎥
⎥
⎥
⎥
⎥
⎥
⎥
⎥
⎥
⎥
⎥
⎥
⎥
⎦
,
where a
k
is the additive genetic relationship between animal k and the group
of half-sibs (a
k
= 0.25 for sib testing; a
k
= 0.5 for progeny testing), a
w
is the
additive genetic relationship among relatives within the group (a
w
= 0.25 for
half-sibs), and l and m are different half-sibs within the family.
APPENDIX B: THE RELATIVE EMPHASIS ON VARIANCE
FOR OPTIMUM TRAITS WITH QUADRATIC PROFIT AND
DIFFERENTIAL PROFIT WITH TWO THRESHOLDS
Quadratic profit:
The relative emphasis of A
v
in the breeding goal (Rel
A
v
=
v
A
v
σ
A
v
v
A
v
σ
A
v
+v
A
m
σ
A
m
)
with quadratic profit is Rel
A
v
=
GCV
E
(1−h
2
m
)
GCV
E
(1−h
2
m
)+2xh
m
,wherex =
|μ−O|
σ
P
and GCV
E
=
σ
A
v
/σ
2
E
. Rel
A
v
is therefore independent of σ
2
P
and completely determined by
the distance of μ − O expressed in terms of σ
P
.
Differential profit with two thresholds:
With differential profit based on two thresholds, Rel
A
v
can be expressed as
Rel
A
v
=
GCV
E
(1−h
2
m
)
GCV
E
(1−h
2
m
)+2yh
m
,wherey =
z
l
−z
u
z
l
t
l
−z
u
t
u
, and is therefore independent of
σ
2
P
and completely determined by the standardized distances of μ from T
l
and
T
u
. A first order Taylor series approximation of y when μ = O is equal to x,
showing the similarity between the quadratic model and the differential profit
model with two thresholds when the population mean is close to the optimum.
APPENDIX C: COMPARISON OF PREDICTED RESPONSES
FROM SELECTION INDEX THEORY WITH REALISED
RESPONSES FROM MONTE CARLO SIMULATION
Monte Carlo simulation was used to evaluate the quality of the predic-
tions as outlined in 2.4 for sib testing and progeny testing schemes after one
generation of index selection with different breeding goals. Fifty replicates
with 500 000 sires each with 50 half-sib progeny were generated to mimic
an infinite population. Dams were randomly mated to sires and each dam had
“g07011” — 2007/12/12 — 11:46 — page 59 — #23
✐
✐
✐
✐
✐
✐
✐
✐
Selection for uniformity in livestock 59
Tab le A. 1. Predicted genetic gain per time unit and prediction errors
a
for A
m
, A
v
and
the aggregate genotype (ΔA
m
, ΔA
v
and ΔH) after one generation of selection with sib
testing and progeny testing schemes for different breeding goals with arbitrary sets of
economic values (v
A
m
= 1; v
A
v
is varied)
b
.
Genetic gain (prediction error
a
)
Breeding scheme v
A
v
ΔA
m
ΔA
v
ΔH
Sib testing 0 0.603 (0.003) 0.000 (–0.031) 0.603 (0.003)
–1 0.593 (–0.001) –0.020 (–0.027) 0.613 (0.026)
–5 0.444 (0.079) –0.076 (0.004) 0.822 (0.058)
Progeny testing 0 0.581 (0.000) 0.000 (–0.010) 0.581 (0.000)
–1 0.566 (–0.002) –0.027 (–0.008) 0.593 (0.006)
–5 0.395 (0.036) –0.092 (0.005) 0.855 (0.011)
a
Prediction errors between brackets: the deviation predicted – observed in
Monte Carlo simulation averaged over all replicates.
b
Parameter values: σ
2
P
= 1, σ
2
A
m
= 0.3, σ
2
A
v
= 0.05, r
A
= 0, number of progeny per
sire = 50, selected proportion sires = 0.05, selected proportion dams = 0.20, relative
generation interval of progeny tested sires L
S
= 1.6.
one progeny. Input parameters were as the basic situation in Table I. The breed-
ing values of sires and dams were randomly sampled normal variates with
variances σ
2
A
m
and σ
2
A
v
, respectively, assuming r
A
= 0. For each progeny, the
Mendelian sampling terms were randomly sampled with variance
1
2
σ
2
A
m
and
1
2
σ
2
A
v
, respectively, and then residuals were randomly sampled with variance
σ
2
E
+ A
v
. Sires and dams were selected by truncation on an index (Eq. 3). Sires
were either sib tested or progeny tested; dams were always sib tested. Genetic
selection differentials were calculated as the mean A
m
and A
v
of all selected
sires and dams and averaged over replicates. Genetic gain per time unit was
calculated, assuming a relative generation interval of progeny tested sires of
1.6. Prediction errors were small for ΔA
m
when v
A
v
= 0orv
A
v
= −1, but larger
when v
A
v
= −5 (see Tab. A.I). For ΔA
v
the opposite was observed: prediction
errors were small when v
A
v
= −5. Prediction errors were larger for sib testing
schemes than for progeny testing schemes.