Báo cáo sinh học: " Genetic differentiation between the Old and New types of Serbian Tsigai sheep" pps
Bạn đang xem bản rút gọn của tài liệu. Xem và tải ngay bản đầy đủ của tài liệu tại đây (538.59 KB, 11 trang )
Genet. Sel. Evol. 40 (2008) 321–331 Available online at:
c
INRA, EDP Sciences, 2008 www.gse-journal.org
DOI: 10.1051/gse:2008006
Original article
Genetic differentiation between the Old
and New types of Serbian Tsigai sheep
Mirjana
´
Cinkulov
1
, Miika Tapio
2
, Mikhail Ozerov
2
,
Tatyana K
iselyova
3
, Nurbiy Marzanov
4
,IvanPihler
1
,
Ingrid O
lsaker
5
,MensurVegara
6
, Juha Kantanen
2∗
1
Department of Animal Science, Faculty of Agriculture, University of Novi Sad,
21000 Novi Sad, Serbia
2
Biotechnology and Food Research, MTT Agrifood Research Finland,
31600 Jokioinen, Finland
3
All-Russian Research Institute of Animal Genetics and Breeding, Russian Academy
of Agricultural Science, 189620 St Petersburg-Pushkin, Russia
4
All-Russian Research Institute of Animal Husbandry, Russian Academy
of Agricultural Science, 142132 Dubrovitsy, Russia
5
Department of Basic Sciences and Aquatic Medicine, Norwegian School
of Veterinary Science, PO Box 8146 Dep., 0033 Oslo, Norway
6
Noragric, Department of International Environment and Development Studies,
Norwegian University of Life Sciences (UMB), P.O. Box 5003, 1432 Ås, Norway
(Received 23 July 2007; accepted 13 November 2007)
Abstract – Two Tsigai sheep populations exist in Serbia: the Old type, called
ˇ
Cokan,andthe
New type. It is assumed that the New type results from upgrading Tsigai sheep with exotic ge-
netic material. We investigated genetic diversity and differentiation of these types by analysing
23 autosomal microsatellites. Tests for Hardy-Weinberg proportions, linkage equilibrium be-
tween genotypes across loci and the calculation of inbreeding coefficients were performed and
the deficiency in the number of alleles within the Tsigai types was examined using a Wilcoxon
sign-rank test. The New type displayed a higher level of genetic variability than the
ˇ
Cokan in
terms of allele numbers, but the New Tsigai showed a pattern of heterozygosity deficiency. The
positive f value for the
ˇ
Cokan suggests the occurrence of inbreeding in this type. The proportion
of linkage disequilibrium was below that expected by chance. Exclusion of two loci in Hardy-
Weinberg disequilibrium did not alter our conclusions based on the entire data set i.e. the two
Tsigai types are clearly differentiated and the New Tsigai type has been influenced by cross-
breeding. Therefore, the
ˇ
Cokan Tsigai should be considered as a distinct endangered breed in
the FAO classification.
microsatellite / sheep / Tsigai
∗
Corresponding author: juha.kantanen@mtt.fi
Article published by EDP Sciences and available at
or />322 M.
´
Cinkulov et al.
1. INTRODUCTION
The Tsigai sheep is one of the oldest Southeast European sheep breeds,
used for milk, meat and wool production and is associated with local tradi-
tions and food culture. The breed might have originated from Turkey [18] and
subsequently spread to the Balkan region, Hungary, Slovakia, Czech Republic,
Moldavia and Russia. Tsigai sheep arrived in the former Yugoslavia in the 18
th
century [11]. During the 20
th
century, both officially recorded governmental
and poorly documented private sheep sectors existed in the former Yugoslavia.
In Serbia, the governmental farms raised purebred Tsigai sheep, which form
the core of the current Old Tsigai type, also called the
ˇ
Cokan. During the same
period, the private sector developed a New Tsigai sheep type, which based on
phenotypic similarities, could result from undocumented crossbreeding with
Bergamo sheep from Italy. The Old Tsigai type has relatively homogeneous
phenotypic characters while the New type shows greater variation among in-
dividuals [3]. Because of its larger body size, the New Tsigai type has become
popular among farmers and increased in number while the population size of
the Old Tsigai type is decreasing, with currently less than 500 breeding fe-
males [22].
In the present study, we analysed the genetic diversity and differentiation
of the two Tsigai types in Serbia using 23 microsatellites. In addition, we ex-
amined their genetic differentiation in a wider context by including Finnish,
Russian and Ukrainian sheep breeds in the analysis. The choice of the breeds
selected for the analysis was based on demographic and geographic character-
istics: Russian Tsigai is assumed to share ancestry with the Serbian Tsigai,the
Carpathian Mountain Sheep and Sok olsk originate from geographically prox-
imate regions and F innsheep and Romanov are examples of breeds that have
been bred pure and kept isolated from other breeds. If the
ˇ
Cokan sheep shows
clear differentiation from the New Tsigai type and other sheep breeds, it should
be given an FAO status of an endangered-maintained breed [21]. Previously,
the genetic divergence between closely related populations belonging to the
same breed, was studied in Merino, Sarda Sheep and Finnsheep [6, 14, 23],
in Holstein-Friesian cattle [8] and in the Lipizzan Horse [1]. These molecular
studies showed that genetic profiles of farm animal breeds do not necessar-
ily reflect the assumed demographic history and that breeds can show a strong
fragmented within-breed structure as a result of genetic differentiation between
the subpopulations of the breed.
Genetic diversity in Serbian Tsigai sheep 323
2. MATERIALS AND METHODS
2.1. Animals, DNA extraction and microsatellite analysis
Blood samples were randomly collected from 50 Tsigai sheep of each type.
Two sheep breeds from Ukraine (Carpathian Mountain and Sok olsk), two from
Russia (Russian Tsigai and Romanov) and one from Finland (Finnsheep),
described by Tapio et al. [25, 26], were included in the analysis of breed
relationships.
DNA was extracted from the whole blood using a standard phe-
nol/chloroform extraction protocol [20]. In total 100 Serbian Tsigai sheep
were genotyped for 23 microsatellite markers (BM0757, BM1314, BM1818,
BM4621, BM6506, BM6526, BM8125, CSSM31, MAF214, MAF36, MAF48,
MAF65, McM527, OarCP20, OarCP34, OarCP38, OarFCB11, OarFCB128,
OarFCB304, OarFCB48, OarHH47, OarHH64 and OarVH72). Individual mi-
crosatellites were genotyped by PCR amplification in a total volume of 10 µL
containing 10 ng DNA template, 1 X PCR buffer with 5% DMSO, 1.5 mM
MgCl
2
or 3.25 mM MgCl
2
(for BM1818 and CSSM31), 1 unit of Taq DNA
polymerase, 0.2 mM of each dNTP and 2 pmol of each primer, one of which
was labelled with fluorescent dye. Amplification was performed using a touch-
down protocol: initial denaturation at 94
◦
C, 5 min, 4 rounds of 3 cycles at
94
◦
C, 45 s and 63
◦
C, 60
◦
C, 57
◦
C and 54
◦
C respectively for 1 min, followed
by 23 to 30 cycles of 94
◦
C, 45 s, 52
◦
C, 1 min and a final extension at 72
◦
Cfor
4 min. The allele sizes were scored according to the TAMRA 500 size standard
on an ABI prism 377 sequencer (Applied Biosystems, Foster City, CA, USA).
Samples from Nordic standard animals were included in all gel-runs allowing
adjustment of all allele sizes to the agreed sizes of the North-SheD reference
samples ([25], NorthSheD project www.lbhi.is/northshed).
2.2. Statistical an alysis
Within-population genetic variation was quantified by calculating the mean
number of alleles per locus, mean observed and mean expected heterozygosi-
ties using POPGENE v1.21 [27].
Deviations from Hardy-Weinberg equilibrium (HWE) were tested us-
ing the exact test implemented in GENEPOP v.3.1 [17]. In HWE tests, a
MCMC method was applied to compute unbiased estimates of the exact
probabilities. The length of the chain was set at 100 000 iterations. Weir
and Cockerham’s [28] within population fixation index f (F
IS
) was calcu-
lated using FSTAT v2.9.1 [7]. The significance of f was determined by
324 M.
´
Cinkulov et al.
1000 permutations. Linkage disequilibrium between pairs of microsatellite loci
was tested using the exact test in GENEPOP v3.1.
The occurrence of recent genetic bottlenecks was tested using
BOTTLENECK [16]. In the testing, the ratio of allele numbers and expected
heterozygosities was compared to the ratio expected under the mutation-drift
equilibrium [9]. The equilibrium heterozygosities were obtained from 1000 it-
erations, assuming that the allelic states of microsatellites change according
to the Stepwise Mutation Model (SMM) and Two-phased model of mutations
(TPM) [4]. The default settings for the proportion of stepwise and larger
mutations and variance of allele size change were used [16]. After simulation,
the significances of deviations were tested with the Wilcoxon sign-rank test.
The magnitude of genetic differentiation between the two Tsigai sheep
types was calculated with Weir and Cockerham’s theta (θ) [28] using FSTAT
v.2.9.1 [7].
In order to estimate the likelihood of an individual’s multilocus genotype
occurring in a given population, we computed the statistical certainty of as-
signment for each individual by using the Bayesian based assignment test in
the GENECLASS v.1.0 program [5]. The simulation options (1000 simulated
individuals per population and threshold value to reject population was 1%)
and the direct assignment with the ‘leave one out’ procedure were applied.
The breed relationship analysis of the two Serbian Tsigai types, Russian
Tsigai, Carpathian Mountain sheep, Sokolsk, Romanov and Finnsheep was
based on the D
A
distance [10]
D
A
= 1 − 1/r
r
j
m
j
i
√
X
ij
Y
ij
(1)
where X
ij
and Y
ij
refer to the frequencies of the i
th
allele at the j
th
locus in
populations X and Y, respectively, m
j
is the number of alleles at the j
th
locus,
and r is the number of analysed loci. A set of 15 microsatellites available for
all breeds (refer to [25]) was used for the calculation. The analysis was done
using DISPAN [12]. The robustness of the Neighbour-joining tree [19] was
tested by bootstrapping (5000 replicates over loci) and presented graphically
using TREEVIEW v1.6 6. [13].
3. RESULTS
3.1. Genetic variation and population structure
Genotype data are available upon request from M.
´
C. All microsatellite loci
were polymorphic in both Tsigai sheep types. A total of 205 alleles were found.
Genetic diversity in Serbian Tsigai sheep 325
Table I. Within-population genetic diversity and inbreeding estimates in the Old and
New Serbian Tsigai types. In addition, probabilities obtained from the Wilcoxon sign-
rank test in the BOTTLENECK analysis are presented.
Tsigai type n MNA H
OBS
H
EXP
Old 50 6.7 0.64 0.69 Genetic diversity
New 50 7.5 0.66 0.70
f [95% CI for f ]
Old 50 0.086 [0.033, 0.148] Inbreeding
New 50 0.072 [0.007, 0.150] all 23 markers
Old 50 0.073 [0.02, 0.136] Inbreeding
New 50 0.040 [–0.11, 0.094] 21 markers*
Wilcoxon’s sign-rank test
P-value
SMM
P-value
TPM
Old 50 0.1234 0.6001 Bottleneck testing
New 50 0.0002 0.0022 all 23 markers
Old 50 0.2367 0.8855 Bottleneck testing
New 50 0.0007 0.0057 21 markers*
n = Number of individuals included in the analysis.
MNA = Mean number of alleles per microsatellite locus.
H
OBS
= Mean observed heterozygosity.
H
EXP
= Mean expected heterozygosity.
f = Within-population inbreeding estimate.
95% CI for f = 95% confidence intervals for the estimate of f .
P-value
SMM
= A probability value obtained assuming that microsatellites evolve according to
the stepwise mutation model.
P-value
TPM
= A probability value obtained assuming that microsatellites evolve according to
the two-phased mutation model.
* Estimates are based on 21 markers, the MAF214 and OarHH64 were excluded from the
analysis.
The mean allele number per locus was 8.7, ranging from 5 (BM0757,
BM6506 and OarCP34)to12(B M1314 and BM1818). Two loci (MAF214
and OarHH64) showed significant deviations (P < 0.001, Bonferroni cor-
rection applied) from HWE in both Tsigai populations due to the excess of
homozygotes.
Within the Tsigai sheep the mean allelic number per locus was higher in the
New type (7.5) than in the Old type (6.7) (Tab. I). Forty-one percent (85/205) of
the alleles were not shared between the two Tsigai types. Thirty-three alleles
were specific for the Old Tsigai, while 52 alleles were observed only in the
New Tsigai. The mean observed and expected heterozygosities in the Old and
New Tsigai types are given in Table I.
326 M.
´
Cinkulov et al.
The exact test for non-random association of genotypes across loci gave
23 significant values (P < 0.05) from 506 comparisons (10 in the New
and13intheOldTsigai type). The total number of significantly small P-values
was therefore less than would be expected by chance alone for 506 independent
tests.
Within-population inbreeding estimates ( f ) in both Tsigai types were pos-
itive and significantly different from zero (P < 0.001), indicating that parents
were more related than expected under random mating (Tab. I). Excluding the
markers MAF214 and OarHH64, that displayed a statistically significant ex-
cess of homozygotes, both Tsigai types still showed positive f -estimates, but
only the estimate for the Old type deviated significantly from zero (Tab. I).
Performing the Wilcoxon sign-rank BOTTLENECK test [4] assuming that
the microsatellite alleles evolved according to SMM or TPM models did not
indicate loss of alleles in the Old Tsigai (Tab. I). However, the New Tsigai dis-
played a pattern of heterozygosity deficiency, i.e. there were too many alleles
compared to the level of gene diversity. Excluding the two anomalous markers
did not alter the test conclusions.
3.2. Genetic differentiation
The between-population inbreeding index, theta (θ), was 0.110 (P < 0.05,
significantly different from zero), indicating that 11% of the total genetic vari-
ation was explained by differences between the Tsigai types, while the remain-
ing 89% was due to differences among individuals.
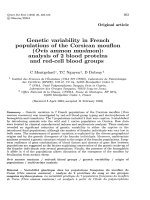
Genetic differentiation at the individual level was investigated with a
Bayesian approach implemented in the GENECLASS v.1.0 program. Ani-
mals were assigned to the correct Old or New Tsigai populations with success
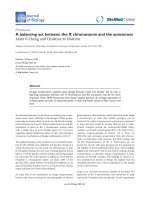
rates of 90% and 88%, respectively. The output of the calculation is presented
graphically in Figure 1. The plotting of log-likelihood values obtained for all
samples clearly indicates distinct grouping of animals into the Old Tsigai and
New Tsigai types. In addition, greater uniformity among the sampled geno-
types of the Old Tsigai was suggested by the average log-likelihood value
(25.43), while for the New type the corresponding mean suggested greater
heterogeneity (43.72).
We calculated D
A
genetic distances among the two Serbian Tsigai types and
five European sheep breeds (Finnsheep, Romanov, Russian Tsigai, Carpathian
Mountain and Sokolsk). The genetic distance between the two Tsigai types
(D
A
= 0.2234) was greater than the average distances among the five other
sheep breeds (D
A
= 0.1730) studied here (Tab. II). However, one of the three
Genetic diversity in Serbian Tsigai sheep 327
Figure 1. A plot of log-likelihood values obtained in the assignment test for all in-
dividuals. Two clearly distinct groups (the Old Tsigai and the New Tsigai) can be
identified indicating their genetic differentiation.
Table II. Matrix of D
A
distances among the seven sheep breed and populations.
1234567
1. Old Tsigai –
2. New Tsigai 0.2234 –
3. Romanov 0.2922 0.3192 –
4. Carpathian Mountain 0.1713 0.2006 0.2328 –
5. Sokolsk 0.1928 0.2039 0.2409 0.1058 –
6. Russian Tsigai 0.1848 0.1894 0.1955 0.0881 0.0996 –
7. Finnsheep 0.2411 0.2672 0.2079 0.1937 0.1951 0.1709 –
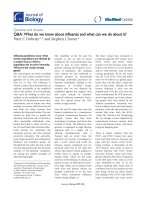
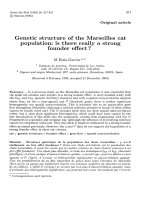
well-supported clusters in the phylogenetic tree (Fig. 2) consisted of the two
Tsigai types. The other two were a northern short-tailed group, consisting of
the Finnsheep and Romanov, and interestingly a southern Russian/Ukrainian
cluster, containing the Russian Tsigai and the two studied Ukrainian breeds,
the Carpathian Mountain sheep and Sokolsk.
4. DISCUSSION
The Tsigai sheep occurs in many southeast European countries and also in
southern Russia, and consists of phenotypically and geographically different
328 M.
´
Cinkulov et al.
Romanov
Finnsheep
Old Tsigai
Russian Tsigai
Sokolsk
Carpathian Mountain
New Tsigai
Figure 2. Unrooted neighbour-joining tree constructed from D
A
distances showing
the relationships between seven sheep breeds and populations. Numbers at the nodes
represent the percentage of group occurrence in 1000 bootstrap replicates.
varieties used for meat, milk and wool production. Two different types of
Tsigai sheep exist in Serbia: the Old type, called
ˇ
Cokan, and the New type.
Our microsatellite data revealed a substantial genetic differentiation between
these Serbian Tsigai types. According to the results of F-statistics [28], 11%
of the total genetic variation in the Serbian Tsigai sheep can be explained by
type differences. This significant differentiation exceeds that detected among
six Spanish sheep breeds (6%, eight markers in common with our study) [2],
among seven Baltic breeds (8.8%, 21 common markers) [24] and even that pre-
sented for 57 European and Middle Eastern sheep breeds (approximately on
average 6%, eight common markers) [15]. Moreover, the Bayesian assignment
of animals to the source populations supported the clear-cut differentiation be-
tween the two Tsigai types (Fig. 1). The degree of differentiation between the
two Tsigai types was further quantified using D
A
genetic distance and a set of
reference breeds. The analysis indicated that the two types are as different, if
not more different, as an average breed pair. In previous microsatellite-based
studies, a similar kind of high genetic divergence among populations within the
same breed from different geographical locations has been recorded [6, 8, 14],
reflecting the important contribution of genetic drift to the differentiation of
domestic animal populations.
Genetic diversity in Serbian Tsigai sheep 329
In the New type, 19 of the 23 microsatellite loci showed too many alleles
compared to the level of gene diversity, which is significantly more frequent
than that supposed by stochastic effects alone. The most obvious explanation
for this observation and the higher within-population diversity found in the
New type is that the population has been influenced by gene flow from an
exotic breed (or breeds), introducing foreign rare alleles, or in the extreme case
making the original Tsigai alleles rare [9]. The crossbreeding may also explain
the greater phenotypic diversity of the New type than that displayed by the Old
type [3]. The census size of the Old Tsigai type has decreased dramatically,
but the present bottleneck test did not indicate loss of alleles in the population
due to a severe reduction of effective population size [9]. However, the positive
f value indicates the occurrence of inbreeding in the Old type.
The genetic divergence of the two Serbian Tsigai populations was also in-
vestigated in a wider context by performing an analysis of breed relationships
including Russian Tsigai, two Ukrainian long-tailed sheep breeds and two
northern European short-tailed breeds (Fig. 2). The branching pattern of the
tree was robust as indicated by high bootstrap values and suggests that the
Old and the New Serbian Tsigai types constitute a group of their own. The
clear genetic divergence between the Serbian Tsigai types is apparent and is
evidenced by the length of the branches. The Russian Tsigai tends to group
with the Ukrainian breeds with short branch lengths, indicating that the gene
pool of the Russian Tsigai may have been influenced by crossbreeding. Our
microsatellite data indicate that the
ˇ
Cokan has not been upgraded with exotic
genetic material, making the population an important genetic reservoir in the
conservation of genetic resources of native southeast European Tsigai sheep.
We recommend that an FAO status of endangered sheep breed be given to the
ˇ
Cokan Tsigai sheep.
ACKNOWLEDGEMENTS
The authors wish to express their gratitude to owners of Tsigai sheep for
their help and collaboration in the sampling of the present research mate-
rial. We acknowledge the financial support from the Norwegian Royal Min-
istry of Foreign Affairs and the Research Council of Norway. We are thankful
for Ole Albert Gutterstud on technical assistance in microsatellite typing and
Dr. Meng-Hua Li for valuable comments on an earlier draft of this manuscript.
Mr Jovo Kosanovic from the Centre for Feed Technology, Norway, is acknowl-
edged for collaboration and support.
330 M.
´
Cinkulov et al.
REFERENCES
[1] Achmann R., Curik I., Dovc P., Kavar T., Bodo I., Habe F., Marti E., Sölkner J.,
Brem G., Microsatellite diversity, population subdivision and gene flow in the
Lipizzan horse, Anim. Genet. 35 (2004) 285–292.
[2] Álvarez I., Royo L.J., Fernández I., Gutiérrez J.P., Gómez E., Goyache F.,
Genetic relationships and admixture among sheep breeds from Northern Spain
assessed using microsatellites, J. Anim. Sci. 82 (2004) 2246–2252.
[3]
´
Cinkulov M., Krajinovi
´
c M., Pihler I., Phenotypic differences between two
types of Tsigai breed of sheep, Lucrai stiintifice Zootehnie si Biotehnologii,
vol. XXXVI, Romenia, 2003.
[4] Cornuet J.M., Luikart G., Description and power analysis of two tests for de-
tecting recent population bottlenecks from allele frequency data, Genetics 144
(1996) 2001–2014.
[5] Cornuet J M., Piry S., Luikart G., Estoup A., Solignac M., New methods em-
ploying multilocus genotypes to select or exclude populations as origins of indi-
viduals, Genetics 153 (1999) 1989–2000.
[6] Diez-Tasc´on C., Littlejohn R.P., Almeida P.A.R., Crawford A.M., Genetic varia-
tion within the Merino sheep breed: analysis of closely related populations using
microsatellites, Anim. Genet. 31 (2000) 243–251.
[7] Goudet J., FSTAT version 1.2: a computer program to calculate F-statistics, J.
Heredity 86 (1995) 485–486.
[8] Hanslik S., Harr B., Brem G., Schlötterer C., Microsatellite analysis reveals sub-
stantial genetic differentiation between contemporary New World and Old World
Holstein Friesian populations, Anim. Genet. 31 (2000) 31–38.
[9] Luikart G., Cornuet J.M., Empirical evaluation of test for identifying recently
bottlenecked populations from allele frequency data, Conserv. Biol. 12 (1998)
228–237.
[10] Nei M., Tajima F., Tateno Y., Accuracy of estimated phylogenetic trees from
molecular data, J. Mol. Evol. 19 (1983) 153–170.
[11] Ogrizek A., Ov
ˇ
carstvo, Poljoprivredni nakladni zavod, Zagreb, Croatia, 1948.
[12] Ota T., DISPAN: Genetic distance and phylogenic analysis, The Pensylvannia
State University, PA, USA, 1993.
[13] Page R.D.M., TREEVIEW: An application to display phylogenetic trees on per-
sonal computers, Comput. Appl. Biosci. 12 (1996) 357–358.
[14] Pariset L., Savarese M.C., Cappuccio I., Valentini A., Use of microsatellites for
genetic variation and inbreeding analysis in Sarda sheep flocks of central Italy,
J. Anim. Breed. Genet. 120 (2003) 425–432.
[15] Peter C., Bruford M., Perez T., Dalamitra S., Hewitt G., Erhardt G.,
ECONOGENE Consortium, Genetic diversity and subdivision of 57 European
and Middle-Eastern sheep breeds, Anim. Genet. 38 (2007) 37–44.
[16] Piry S., Luikart G., Cornuet J.M., Bottleneck: A computer program for detecting
recent reduction in the effective population size using allele frequency data, J.
Hered. 90 (1999) 502–503.
[17] Raymond M., Rousset F., GENEPOP version 1.2: population genetics software
for exact tests and ecumeniscism, J. Hered. 86 (1995) 248–249.
Genetic diversity in Serbian Tsigai sheep 331
[18] Ryder M.L., Sheep and man, London: Duckworth, 1983.
[19] Saitou N., Nei M., The neighbour-joining method: a new method for reconstruct-
ing phylogenetic trees, Mol. Biol. Evol. 4 (1987) 406–425.
[20] Sambrook J., Fritsch E.F., Maniatis T., Molecular cloning: A laboratory manual,
2nd edn., Cold Spring Harbor Laboratory Press, New York, USA, 1989.
[21] Scherf B.D., World watch list of domestic animal diversity, 3rd edn., U.N. Food
and Agriculture Organization, Rome, 2000.
[22] Stojanovi
´
cS.,Ðor
¯
devi
´
c-Miloševi
´
c S., Autochtonous breeds of domestic animals
in Serbia and Montenegro, Belgrade, 2003.
[23] Tapio M., Miceikiene I., Vilkki J., Kantanen J., Comparison of microsatellite
and blood protein diversity in sheep: inconsistencies in fragmented breeds, Mol.
Ecol. 12 (2003) 2045–2056.
[24] Tapio I., Tapio M., Grislis Z., Holm L E., Jeppsson S., Kantanen J., Miceikiene
I., Olsaker I., Viinalass H., Eythorsdottir E., Unfolding of population structure
in Baltic sheep breeds using microsatellite analysis, Hered. 94 (2005a) 448–457.
[25] Tapio M., Tapio I., Grislis Z., Holm L.E., Jeppsson S., Kantanen J., Miceikiene
I., Olsaker I., Viinalass H., Eythorsdottir E., Native breeds demonstrate high
contributions to the molecular variation in the northern European sheep, Mol.
Ecol. 14 (2005b) 3951–3963.
[26] Tapio M., Marzanov N., Ozerov M.,
´
Cinkulov M., Gonzarenko G., Kiselyova T.,
Murawski M., Viinalass H., Kantanen J., Sheep mitochondrial DNA variations
in European, Caucasian and Central Asian areas, Mol. Biol. Evol. 23 (2006)
1776–1783.
[27] Yeah F.C., Yang R., Boyle T., Popgene version 1.01. Quick User Guide, available
at />[28] Weir B.C., Cockerham C.C., Estimating F-statistics for the analysis of popula-
tion structure, Evolution 38 (1984) 1358–1370.