Wireless Networks dor Dummies phần 10 pot
Bạn đang xem bản rút gọn của tài liệu. Xem và tải ngay bản đầy đủ của tài liệu tại đây (698.46 KB, 41 trang )
802.11
802.11 is the granddaddy of wireless networking standards. The IEEE 802.11
specifications specify an “over-the-air” interface between a wireless client
and a base station or access point, as well as at the peer-to-peer level among
wireless clients. These standards can be compared to the IEEE 802.3 standard
for Ethernet for wired LANs. They address two of the OSI layers, the Physical
(PHY) layer and Media Access Control (MAC) sub-layer of the Data Link layer.
The wireless standard is designed to resolve compatibility issues between
manufacturers of Wireless LAN equipment.
This standard provides 1 or 2 Mbps transmission in the 2.4 GHz band using
either frequency hopping spread spectrum (FHSS), direct sequence spread
spectrum (DSSS), or infrared.
802.11a
After the finalization of the 802.11 standard, it became apparent that the 2
Mbps bit rate wouldn’t cut it, especially compared to 10 Mbps Ethernet. Soon
after, the IEEE started two taskgroups to work on this problem: 802.11a and
802.11b. The goal of the two groups was to define higher bit rate refinements
to the 802.11 standard. Hence, 802.11a is an extension to 802.11 that provides
up to 54 Mbps speed in the 5GHz band.
At the Physical layer, 802.11a uses an orthogonal frequency division multi-
plexing encoding scheme rather than FHSS or DSSS. It offers less potential for
radio frequency (RF) interference because it operates in the 5GHz band. This
standard is quickly gaining ground on 802.11b.
Even though approval for the 802.11a and 802.11b standards came at roughly
the same time, it took a year longer for 802.11a equipment to hit the market
due to the complexity of the standard. In fact, it took until late 2002 before
802.11a equipment hit critical mass.
802.11b
This extension provides 11 Mbps transmission (with a fallback to 5.5, 2, and
1 Mbps) in the 2.4 GHz band. You may hear people refer to 802.11b as Wi-Fi
348
Part VI: Appendixes
29_575252 appb.qxd 9/2/04 4:15 PM Page 348
or Wireless-Fidelity: a throwback to Hi-Fi. One of the original wireless specifi-
cations in use, 802.11b uses only DSSS. It was first implemented in a 1999 rati-
fication to the original 802.11 standard. 802.11b equipment is backward
compatible to 802.11 equipment using DSSS. It was at the time considered a
stopgap until the adoption of the 802.11a standard, but it soon became the
dominant standard with the largest installed base. Most wireless solutions
today either use or support this standard. It is also probably the least expen-
sive to implement, although 802.11a is quickly catching up.
802.11c
You don’t see or hear about this one much. 802.11c provides required infor-
mation to ensure proper bridge operations. Product developers use this stan-
dard when developing access points, so most users will not notice it.
802.11d
802.11d is a little-known standard. The intent of 802.11d was to harmonize fre-
quency and bandwidth around the world so that wireless equipment can
interoperate. Enough said.
802.11e
802.11e is being defined to provide support for Quality of Service (QoS) traf-
fic and thereby improve support of audio and video (such as MPEG-2) appli-
cations. Because 802.11e falls within the MAC layer, it will be common to all
802.11 PHYs and be backward-compatible with existing 802.11 wireless LANs.
802.11f
You don’t see or hear much about 802.11f. 802.11f provides the necessary
information that access points need to exchange in order to support the dis-
tribution system functions, like roaming. Without this standard, the IEEE rec-
ommends using similar vendors to support interoperability.
349
Appendix B: Wireless Standards
29_575252 appb.qxd 9/2/04 4:15 PM Page 349
802.11g
The 802.11g standard defines the way wireless communicates at higher bit
rates of up to 54 megabits per second while remaining backward-compatible
with the 11 Mbps 802.11b standard. This bit rate enables streaming media,
video downloads, and more users. 802.11g is gaining ground on the earlier
802.11a/b standards in industry and quickly becoming the more prevalent
standard for wireless access.
802.11h
802.11h is a new specification that addresses the requirements of the
European regulatory bodies. It provides for dynamic channel selection (DCS)
as well as transmit power control (TPC) for devices operating in the 5GHz
band, like the 802.11a specification does. In Europe, there is a greater need to
avoid interference with satellite communications, which have “primary use”
designations and can be interfered with by the 5 GHz band. This standard
helps eliminate any potential for that interference.
802.11i
802.11i is the security panacea for wireless LANs. 802.11i incorporates
stronger encryption techniques, such as AES (Advanced Encryption
Standard). It is designed to improve on the weaknesses found in the existing
WEP standards used by the other wireless standards. 802.11i includes strong
encryption and a robust key management scheme. On the flipside, 802.11i
will require new hardware chipsets, so it will not be compatible with existing
hardware.
802.11j
The 802.11j task group has the mandate to refine some physical and data
link issues for 5 GHz wireless networking with the view to the coexistence
and eventual convergence of the IEEE 802.11a and European/Japanese
HIPERLAN/2 standards.
350
Part VI: Appendixes
29_575252 appb.qxd 9/2/04 4:15 PM Page 350
802.11k
802.11k is another Quality of Service standard, but this one is for the Radio
layer (physical). The mandate is to ensure the quality of service over an
802.11 link.
802.11n
802.11n is an effort to provide user throughput speeds of 100M bits/sec or
more, with vendors like Agere pushing for 500M bits/sec. Current speeds in
802.11g for example, have data rates of 54M bits/sec which usually results in
user throughput of considerably less, arguably around only 18 to 22M
bits/sec. Originally anticipated January of 2004 it is still waiting approval.
802.15
In March 1998, the IEEE formed the WPAN Study Group. The study group’s
goal was to investigate the need for a wireless network standard for devices
within a personal operating space (POS). In May of 1998, the Bluetooth
Special Interest Group (SIG) formed. In March of 1999, the WPAN study group
became IEEE 802.15, the WPAN Working Group. The 802.15 WPAN (Wireless
Personal Area Network) is an effort to develop standards for Personal Area
Networks or short distance wireless networks. These WPANs address wire-
less networking of portable and mobile computing devices, such as PCs,
Personal Digital Assistants (PDAs), peripherals, cell phones, and pagers, let-
ting these devices easily communicate with one another.
Since the formation of 802.15, three projects have started. The first (TG1)
was the Bluetooth project that released the Bluetooth 1.0 Specification in
July of 1999. The project will produce an approved IEEE standard derived
from the Bluetooth standard. The second, or TG2, will address the issue of
co-existence of 802.11 and 802.15 networks. Currently, Bluetooth networks
create havoc with 802.11 networks. And the third, or TG3, will work on deliv-
ering a standard for high bit rate (20 Mbps or higher) WPANs.
351
Appendix B: Wireless Standards
29_575252 appb.qxd 9/2/04 4:15 PM Page 351
802.16
The 802.16 standard is a broadband wireless standard for Wireless
Metropolitan Area Networks (WirelessMAN or WMAN). This standard, also
known as Broadband Wireless Access (BBWA), addresses the “first-mile/l
ast-mile” connection in wireless metropolitan area networks, focusing on the
efficient use of bandwidth between 10 and 66 GHz. Unless you are a large
business, it is unlikely you’ll deal with this standard.
352
Part VI: Appendixes
29_575252 appb.qxd 9/2/04 4:15 PM Page 352
Appendix C
The Fundamentals of
Radio Frequency
In This Chapter
ᮣ Radio frequency (RF)
ᮣ Behavior of radio waves
ᮣ RF units of measure
ᮣ RF mathematics
W
e cannot do justice to the discussion of radio frequency in one
Appendix. It is the stuff of many books. Having said that, you must
understand some concepts in order to set up and administer your WLAN.
This Appendix provides a glimpse into the fascinating world of radio frequen-
cies. You may want to peruse this appendix before calculating your link
budget in Chapter 2.
Radio Frequency
When teaching networking, we often use the example of throwing a rock into
a river to teach the concept of attenuation. Think of going down to the water
and throwing in a rock. You see an epicenter where the rock went in and
waves rippling out from that epicenter. The farther you get from the center,
the weaker the waves get. The concentric circles that you see are similar to
the radio waves as they propagate away from the antenna.
Radio frequencies are high-frequency (and in our, case ultra- and super-high
frequency, as shown in Table C-1) alternating current (AC) signals passed
along copper wire or some other conductor until an antenna radiates them
into the air. The antenna transforms the wireless signal into a wired signal
and vice versa. When the antenna propagates the high-frequency AC signal
into the air, it forms radio waves. These radio waves propagate, or move
away, from the source in a straight line in all directions. Just imagine the rock
going into the water.
30_575252 appc.qxd 9/3/04 8:40 AM Page 353
354
Part VI: Appendixes
Table C-1 Radio Frequency Spectrum
Frequency Description
Up to 300 Hz Extremely Low Frequency (ELF)
300 Hz–3 kHz Voice frequency
3 kHz–30 kHz Very Low Frequency (VLF)
30 kHz–300 kHz Low Frequency (LF)
300 kHz–3 MHz Medium Frequency (MF)
3 MHz–30 MHz High Frequency (HF)
30 MHz–300 MHz Very High Frequency (VHF)
300 MHz–3 GHz Ultra-High Frequency (UHF)
3 GHz–30 GHz Super High Frequency (SHF)
30 GHz–300 GHz Extremely High Frequency (EHF)
In the table, Hz denotes hertz. We use the term hertz to represent the unit for
frequency. One hertz simply means one cycle (event) per second; 10 Hz
means ten cycles (events) per second; and so on. You can apply hertz to any
periodic event. For example, the clock speed of your Pentium might be said
to tick at 2.2 GHz. The reciprocal of frequency is time (period): a frequency of
1 Hz is equivalent to a period of 1 second, and a frequency of 1 MHz is equal
to a period of 1 microsecond. You should know some multiples, as follows:
Term Symbol Equivalence
1 kilohertz kHz 10
3
Hz or 1,000 Hz
1 megahertz MHz 10
6
Hz or 1,000,000 Hz
1 gigahertz GHz 10
9
Hz or 1,000,000,000 Hz
This may or may not make sense, but either way, some examples cannot hurt.
For example, standard domestic AC electric power (220v [volt] or 110v volt-
age) is 50–60 Hz. If you play music on the side, middle C is 261.625 Hz. If you
don’t play music but listen to it, FM radio broadcasts are 88–108 MHz. The
clock speed of the Intel 4004, the world’s first commercial microprocessor,
was 104 kHz. Today’s Pentium 4 has a clock speed of around 3 GHz.
The Federal Communications Commission (FCC) in the United States as well
as other government agencies around the world have made parts of the
spectrum available for unlicensed radio networks as long as they meet
local regulations. Currently, these bands are the Industrial, Scientific, and
Medical (ISM) band (operating at 2.4 GHz) and the U-NII (Unlicensed National
Information Infrastructure) band (operating at 5.8 GHz).
30_575252 appc.qxd 9/3/04 8:40 AM Page 354
355
Appendix C: The Fundamentals of Radio Frequency
In Appendix B, you can read about the various wireless standards. The
802.11b standard supports data rates of up to 11 Mbps, whereas 802.11a and
802.11g support data rates of up to 54 Mbps. The difference in data rates is
caused by one of two things: more bandwidth or better encoding. The
802.11g standard works in the same 2.4 GHz band used by 802.11b but uses
OFDM rather than DSSS and uses 64QAM rather than DQPSK. The 802.11a
standard has more bandwidth.
64QAM and DQPSK? That’s got to be Greek! No, it’s Geek for modulation tech-
nology. Because we have digital bits to transmit over the air, our radio trans-
ceiver must convert the digital data to an analog signal. Converting digital
data to analog signals is modulation. You can modulate data by using the
amplitude, the frequency, or the phase of the signal (all three components
of the signal). The term shift keying is sometimes substituted for the term
modulation, and we use that term interchangeably here. Tables C-2 and C-3
provide the modulation techniques for 802.11, 802.11a, 802.11b, and 802.11g.
Table C-2 Modulation Techniques: 802.11, 802.11b, and 802.11g
Spreading Code Modulation Technology Data Rate
2.4 GHz DSSS Barker Code DBPSK 1 Mbps
DQPSK 2 Mbps
CCK DQPSK 5.5 Mbps
DQPSK 11 Mbps
2.4 GHz FHSS Barker Code 2GFSK 1 Mbps
4GFSK 2 Mbps
CCK: Complimentary Code Keying
DBPSK: Differential Binary Phase Shifting Key
DQPSK: Differential Quadrature Phase Shifting Key
GFSK: Gaussian Phase Shifting Key
Table C-3 Modulation Techniques: 802.11a
Modulation Technology Data Rate
BPSK 6 Mbps
9 Mbps
QPSK 12 Mbps
18 Mbps
(continued)
30_575252 appc.qxd 9/3/04 8:40 AM Page 355
356
Part VI: Appendixes
Table C-3 (continued)
Modulation Technology Data Rate
16QAM 24 Mbps
36 Mbps
64QAM 48 Mbps
54 Mbps
BPSK: Binary Phase Shifting Key
QPSK: Quadrature Phase Shifting Key
QAM: Quadrature Amplitude Modulation
The 802.11g standard achieves its high data rates through the use of the
Quadrature Amplitude Modulation (QAM) technique. With QAM, there are
12 phase angles with 2 different amplitudes. Eight phase angles have a single
amplitude, and four have two amplitudes, resulting in 16 different combina-
tions. QAM uses each signal change to represent 4 bits. Consequently, the
data rate is four times the baud rate.
You may find vendors who support 802.11a, b, and g in a single device. We
cover that in Chapter 3.
Early in this Appendix, we talk about the pebble creating a splash in the
water and waves rippling out until they dissipate. We call this phenomenon
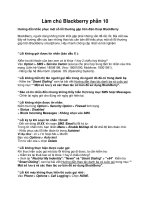
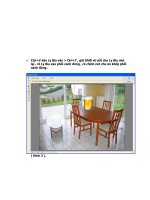
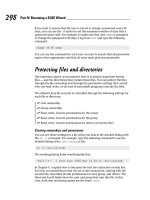
attenuation. Figures C-1 and C-2 demonstrate attenuation for outdoors and
indoors by using the 802.11b standard as an example. You can see that the
signal travels farther outdoors because no walls, floors, or any other obstruc-
tions absorb, reflect, refract, or diffract the signal.
Figure C-1 shows what you would expect in theory. The access point does not
radiate perfect circles at precisely these distances in the real world. In reality,
the radiation patterns are more oblong and flatter than a circle. Popular
wisdom holds that 802.11b technology, which is generally held to be effec-
tive up to about 300 feet, offers better coverage than 802.11a equipment.
Theoretical calculations put 802.11a coverage at roughly one-fourth of that
range. However, tests show that 802.11a operates with acceptable reliability
to well over 200 feet. Moreover, throughout most of its range, including the
maximum, it offers a throughput advantage over 802.11b at the same dis-
tances. Products based on 802.11a use the 5.8 GHz band.
Physics dictate that higher frequencies have a larger path loss (greater spa-
tial attenuation) — and therefore, shorter range than lower frequencies —
when all other variables are the same. Thus, the 802.11g products have a
greater range than 5 GHz products for the same data rate. But the current
higher susceptibility to interference in the 2.4 GHz band might affect the
range of 802.11g products more in noisy and congested environments than
products in the 5 GHz band.
30_575252 appc.qxd 9/3/04 8:40 AM Page 356
357
Appendix C: The Fundamentals of Radio Frequency
Currently the 5 GHz band is cleaner from interference than the 2.4 GHz band.
However, both bands are unlicensed. With the emergence of products creat-
ing interference in the 5 GHz band (at least three cordless telephone prod-
ucts workin the 5.8 GHz band, representing the top four 802.11a channels),
interference may eventually affect 802.11a products much like 802.11b and g
products. At the same time, the 5 GHz band has more bandwidth than the
2.4 GHz band for unlicensed devices, and thus there is more room to avoid
such interference.
Specific implementation details of different vendors, such as power output,
receiver sensitivity, antenna design, and other factors will also affect the
range.
Another consideration is the number of usable channels. 802.11b (or Wi-Fi) is
limited to three clear channels. When you deploy more than three contiguous
cells, you likely will find some performance degradation (up to as much as 50
percent) because of co-channel interference (CCI) between cells operating on
a given channel. With Wi-Fi, there’s no way to avoid duplication of channel
usage more than one cell diameter away. And the closer together the cells,
the more interference. Table C-4 shows the various channels in use for
802.11b and g and their frequencies. Channels 1, 6, and 11 are the non-
overlapping channels.
1 Mbps: 1800 ft.
2 Mbps: 1476 ft.
5.5 Mbps: 984 ft.
11 Mbps: 590 ft.
Note: typical coverage.
Your mileage may vary.
Figure C-1:
Attenu-
ation —
802.11b
outdoors.
30_575252 appc.qxd 9/3/04 8:40 AM Page 357
358
Part VI: Appendixes
Table C-4 Frequency and Channels
Channel Frequency Channel Frequency
1 2.412 GHz 8 2.447 GHz
2 2.417 GHz 9 2.452 GHz
3 2.422 GHz 10 2.457 GHz
4 2.427 GHz 11
1
2.462 GHz
5 2.432 GHz 12 2.467 GHz
6 2.437 GHz 13
2,3
2.472 GHz
7 2.442 GHz 14
4
2.477 GHz
1
North America uses channels 1–11
2
Europe (except France) uses channels 1–13
3
France uses channels 10–13
4
Japan uses channels 1–14
1 Mbps: 200 ft.
2 Mbps: 150 ft.
5.5 Mbps: 125 ft.
11 Mbps: 50 ft.
Note: typical coverage.
Your mileage may vary.
Figure C-2:
Attenu-
ation —
802.11b
indoors.
30_575252 appc.qxd 9/3/04 8:40 AM Page 358
359
Appendix C: The Fundamentals of Radio Frequency
Table C-5 lists the 802.11a channels. With 802.11a’s eight channels, however,
you can easily arrange a cell grid so that access points using the same chan-
nel are at least twice as far apart — and the overall density of cells using any
given channel is roughly one-fourth as great. This should greatly reduce the
effect of CCI, if not eliminate it altogether.
Table C-5 802.11a Usable Channels
Frequency Band Channel Number Center Frequencies (GHz)
U-NII Lower Band (5.15–5.25 GHz) 36 5.180
40 5.200
44 5.220
48 5.240
U-NII Middle Band (5.25–5.35 GHz) 52 5.260
56 5.280
60 5.300
64 5.320
U-NII Upper Band (5.725–5.825 GHz) 149 5.745
153 5.765
157 5.785
161 5.805
An access point can support all standards because ultimately they are com-
plementary. As previously mentioned, the 802.11b and 802.11g standards
operate in the Industrial, Scientific, and Medical (ISM) band, and 802.11a
operates in the Unlicensed National Information Infrastructure (U-NII) band.
So, 802.11g can complement 802.11a by adding three additional channels in
the 2.4 GHz band to existing 802.11a channels. This creates more network
capacity to allow for additional users. Both technologies have advantages
that when used in combination, offer an even stronger product. Another
advantage of 802.11a is that the 5 GHz base has more capacity around the
world. Currently, there are 13 channels in North America (including U-NII and
ISM bands), 8–19 channels in Europe, and 5–12 channels in Asia. The more
channels you have, the more aggregate throughput you can have.
However, although there are up to 14 allocated channels for the 802.11b and
g standards, there are only 3 non-overlapping channels. (That is, only three
APs could work in one area without interfering with each other.) In the
802.11a standard, all the channels are non-overlapping. (That is, channels
don’t interfere with each other at all.) 802.11a has 12 non-overlapping chan-
nels: 8 dedicated to indoor and 4 to point-to-point. Remember, this helps
ensure less interference.
30_575252 appc.qxd 9/3/04 8:40 AM Page 359
360
Part VI: Appendixes
That’s a lot of numbers and standards to remember. We summarize the trans-
fer method, frequency, and data rates for the various standards for you in
Table C-6.
Table C-6 Standards and Values
Standard PHY Transfer Method Frequency Band Data Rates (Mbps)
802.11 legacy FHSS, DSSS, IR 2.4 GHz, IR
802.11b DSSS, HR-DSSS 2.4 GHz
“802.11b+” DSSS, HR-DSSS (PBCC) 2.4 GHz 1, 2, 5.5, 11, 22, 33, 44
non-standard
802.11a OFDM 5.2, 5.5 GHz
802.11g DSSS, HR-DSSS, OFDM 2.4 GHz
Behavior of Radio Waves
Here are some simple concepts that are necessary to your understanding of
RF and hence your ability to design, install, and administer your wireless net-
work. You need to understand the concept of gain, loss, reflection, refraction,
diffraction, scattering, absorption, and free space loss.
Gain
Gain describes an increase in a radio frequency signal’s amplitude. Usually,
gain is an active process. This means that you can use an external power
source (such as an antenna) to amplify a signal, or you can use a high-gain
antenna to focus the beam width of a signal to increase its amplitude.
But passive processes can also cause gain. For example, reflected signals
(see the upcoming section, “Reflection”) can combine with the main signal to
increase the signal’s strength. You must know how to measure gain in your
system to find the signal strength at your client or to know whether you’re
violating any laws regarding signal strength or power levels.
Loss
Conversely, loss is a decrease in signal strength. Many factors can cause
signal loss. For instance, resistance in connectors and friction in a cable can
cause signal loss (attenuation), hence the reason for maximum cable runs.
30_575252 appc.qxd 9/3/04 8:40 AM Page 360
361
Appendix C: The Fundamentals of Radio Frequency
Mismatching impedance in cables and connectors can cause loss by reflect-
ing signal back toward the source. Objects directly in the path of the radio
waves can absorb, reflect, or disrupt RF signals, thus causing degradation.
Also, free space loss results from sending a RF signal over the air: The further
you go, the weaker the signal gets. Like with gains, you must know how to
quantify losses. You need to know when you are approaching the sensitivity
threshold for your receiver. The sensitivity threshold is the point where the
receiver can clearly distinguish the signal from background noise. To find out
how to calculate gains and losses, keep reading.
Reflection
Reflection is the phenomenon of a propagating wave being thrown back from
a surface. Reflections result from the surface of the Earth, buildings, walls,
and other large objects. When the surface is smooth, the reflected signal may
remain intact, but some absorption and scattering of the signal is likely. The
reflection of the signal from many objects at once causes multipath, which we
deal with in Chapter 13. Multipath can cause signal degradation or cancellation.
Refraction
Refraction occurs when sound wave changes mediums. (The wave bends as it
passes through a medium of different density.) As a RF wave passes into a
denser medium (such as a trough of cold air lying in a valley), the wave bends,
so its direction changes. Some of the wave reflects away from the intended
signal path, and some bends in another direction altogether. Refraction is
mostly a concern when dealing with longer links. Atmospheric conditions
might bend the signal away from the intended receiver.
Diffraction
Diffraction is the apparent bending of light waves around obstacles in its
path. It occurs when an object with a rough or irregular surface obstructs the
radio path. Diffraction is the effect of waves bending or turning around the
obstruction. We can explain diffraction by looking at our pebble in the pond
example again. Suppose when you threw a pebble into water, a small stick
was stuck in the muck. (Say that real fast five times.) The waves rippling out
hit the stick. The stick blocks some waves, but most bend around the stick.
Scattering
Scattering occurs when the wave passes through a medium consisting of
many small objects compared with the wave itself. Rough surfaces, small
30_575252 appc.qxd 9/3/04 8:40 AM Page 361
362
Part VI: Appendixes
objects, or other irregularities such as foliage, street signs, or streetlights can
cause the signal to scatter. Scattering can destroy the main signal.
Absorption
Absorption occurs when a RF signal strikes an object and does not pass
through, reflect, or diffract around the object. The object absorbs the incom-
ing signal. The curtains on your windows or the padded cubicle dividers can
absorb your signals.
Free space loss
As the wave propagates away from the source, it loses steam and eventually
peters out. This phenomenon is free space loss and is similar to attenuation in a
copper cable. Later in this Appendix, you can see how to calculate how much
you lose as you move the receiver farther and farther away from the source.
Fresnel zone
Before looking at RF units of measure, you need to understand one more con-
cept about waves: the Fresnel zone. The Fresnel zone occupies a series of
concentric, ellipsoidal areas around the line-of-sight (LOS) path. This area is
important because it defines an area about the LOS that you should ensure is
not blocked. Trees, towers, buildings, and other solid objects in the Fresnel
zone can absorb, scatter, reflect, or diffract a signal and cause degradation.
Typically, 20–40 percent blockage in the Fresnel zone introduces little or no
interference of the signal. Err on the conservative side, and aim for no more
than 20-percent blockage of the zone.
If you think free space loss and Fresnel zones are fun, you might get your
kicks from the paper, “VHF/UHF/Microwave Radio Propagation: A Primer for
Digital Experimenters,” at
www.tapr.org/tapr/html/ve3jf.dcc97/ve3jf.
dcc97.html
.
RF Units of Measure
When you build a simple home network, chances are that you’ll just buy the
equipment, plug it in, configure it, and use it. You’re like a kid on his birthday:
You can’t wait to play with your new toys. On the other hand, when you
choose to implement a network for an SMB or an enterprise where you need
to fool with external antennas, cables, bridges, and repeaters, you need some
basic knowledge about power and signal levels. This section serves as your
introduction.
30_575252 appc.qxd 9/3/04 8:40 AM Page 362
363
Appendix C: The Fundamentals of Radio Frequency
Watt’s that, you say?
The basic unit of power is the watt. The watt (W) is defined as one ampere
(A) of current at one volt (v). In other words, one watt is equal to one ampere
multiplied by one volt. Thinking of a garden hose can help you understand
these concepts: The water flow is the amperes (or current), and the pressure
in the hose is the voltage (or electrical circuit). The FCC allows only 4 watts
of radiated power from an antenna in a point-to-multipoint wireless LAN con-
nection using unlicensed 2.4 GHz spread spectrum equipment. This is likely
your configuration: one access point and many clients.
Now, 4 watts might not seem like a lot, but consider the typical night light.
(You know the one, the light that helps you find your way to the john in the
night.) It is about 7 watts. On a clear night with no light pollution, you can
spot a 7-watt light from 50 miles (or approximately 83 kilometers) away in all
directions. Now imagine that you could encode this light to send data. You
would have a wireless network. So, 4 watts allows you to create an effective
and efficient wireless local area network.
Generally, when working with WLANs and WPANs, you can use power levels
as low as 1 milliwatt (mW, 1/1000 of a watt). Power levels on a WLAN segment
are rarely above 100 mW, which is sufficient to transmit up to half of a mile
(0.83 km) under ideal conditions. Access points generally radiate between 30
and 100 mW of power, depending on the particular manufacturer. When you
look at wireless equipment, you’ll see power levels specified as either mW or
dBm (covered next). Both measurements represent an absolute amount of
power.
I hear ’bels
Sensitive receivers can pick up signals as small as 0.000000001 watts. This is
a very small number that most likely means very little to you. Instead of
using very small absolute numbers, you can use another measure that makes
the numbers more meaningful. This measure is the decibel, based on a loga-
rithmic relationship to the watt. The decibel (dB) is a measure of relative
power or signal strength. However, it is not an absolute measure, like a watt
for power or a volt for signal.
The reference point between the logarithmic dB scale and the linear watt is
1 mW = 0 dBm
The lowercase m in dBm refers to the reference point of 1 milliwatt (mW)
rather than one watt. dBm is a measure of absolute power and ir not relative.
It measures the power relative to one milliwatt. You calculate dBm as follows:
dBm = 10 log(mW/1)
30_575252 appc.qxd 9/3/04 8:40 AM Page 363
364
Part VI: Appendixes
or
dBm = 10 log(W/.001)
where mW is the signal in milliwatts.
Table C-7 provides a conversion chart for you, so you don’t have to do the
math. The first entry shows that 0 dBm is equal to 1 mW. You can calculate
these values by popping the formula into Google. Google likes logs, and not
just the kind that tells them what you did on that site. For those of you who
don’t want to use Google to try logs, you can use
www.bessernet.com/
jobAids/dBmCalc/dBmCalc.html
to do the conversion for you.
Table C-7 dBm to Power Conversion Chart
dBm Power dBm Power
0 1 mW 20 100 mW
1 1.25 mW 21 125 mW
2 1.6 mW 22 160 mW
3 2 mW 23 200 mW
4 2.5 mW 24 250 mW
5 3.2 mW 25 320 mW
6 4 mW 26 400 mW
7 5 mW 27 500 mW
8 6.4 mW 28 640 mW
9 8 mW 29 800 mW
10 10 mW 30 1 W
11 12.5 mW 31 1.25 W
12 16 mW 32 1.6 W
13 20 mW 33 2 W
14 25 mW 34 2.5 W
15 32 mW 35 3.2 W
16 40 mW 36 4 W
17 50 mW 37 5 W
18 64 mW 38 6.4 W
19 80 mW 39 8 W
30_575252 appc.qxd 9/3/04 8:40 AM Page 364
365
Appendix C: The Fundamentals of Radio Frequency
We measure power gains and losses in decibels, not in watts. This should
make sense to you because gains and losses are relative concepts, and deci-
bels are relative measures.
For measuring gains and losses, you use dB except when measuring the gain
of an antenna, when you use the term dBi. The i in dBi stands for dB gain
over an isotropic antenna. This means that you compare the change in power
with the mythical isotropic antenna. An isotropic antenna is an ideal one that
sprays useful radio waves in all directions, including up and down, with equal
intensity, at 100-percent efficiency. Our Sun is an isotropic radiator. (Tell
that to someone who lives north of the 49th parallel.) Therefore, dBi is a
decibel gain realized by a gain antenna, compared with what the theoretical
isotropic antenna would do with the same power level. Thus, dBi is a relative
measurement.
RF Mathematics
In Chapter 2, we show you how to do a site survey. To complete the site
survey, you need to do a link budget. This section provides all the formulas
that you need to do your link budget. If you want to really dive into radio
waves, you should understand the theory behind the formulas. For the rest of
us, just know they are here and that you need only substitute the correct
values.
Calculating decibels
So, when a signal loses 3 dB, is that a lot? A 3 dB loss indicates that the signal
lost half of its power. As they say in math, QED (quod erat demonstrandum:
that is, that which was to be proved):
dB = 10 log
10
(P2 / P1)
–3 dB = 10 log
10
(P2 / 100)
–0.3 = log
10
(P2 / 100)
10 – 0.3 = P2 / 100
0.50 = P2 / 100
P2 = 50%
Now, you may not feel like using a slide rule (or Google) to calculate dB, but
you can use the handy following rules. We have the 10s and 3s of RF math as
follows:
30_575252 appc.qxd 9/3/04 8:40 AM Page 365
366
Part VI: Appendixes
1. –3 dB =
1
⁄2 the power in mW
2. +3 dB = 2 times the power in mW
3. –10 dB =
1
⁄10 the power in mW
4. +10 dB = 10 times the power in mW
When calculating gains or losses, factor the numbers by 3 or 10 or both to get
a quick value for loss or gain.
Decibel losses (and gains) are additive. If you have an access point con-
nected to a cable with a –2 dB loss and a connector with a –1 dB loss, you
have a –3 dB loss, or half the power radiated by the access point. You need to
remember this additive rule when calculating link budgets.
Suppose you have a 33 dBm gain (+33 dBm). You can break 33 down into 10 +
10 + 10 + 3. Remember the handy rules that state that +10 is equivalent to 10
times and that +3 is equivalent to 2 times. You know that 1 mW is equal to 0
dBm, so this is where you start. You can calculate that +33 dBm equals 2
watts, as follows:
1 mW × 10 = 10 mW
10 mW × 10 = 100 mW
100 mW × 10 = 1000 mW
1000 mW × 2 = 2000 mW or 2 watts
Consider a negative example. Suppose that you have –23 dBm. You can break
23 down into –10 + –10 + –3. You know that 1 mW is equal to 0 dBm, so this
is where you start. You can calculate that –23 dBm equals 5 microwatts as
follows:
1 mW/10 = 100 µW
100 µW/10 = 10 µW
10 µW/2 = 5 µW
We both bought +16 dBi antennas from Hugh Pepper (
http://mywebpages.
comcast.net/hughpep
). If you apply 1 watt of power, the output power at
the antenna is as follows:
1 W + 16 dBi = 40 W
This calculation works exactly like dB calculations. This means that a 16 dBi
gain is +10 + 3 + 3 or 10 times, and 2 times, and 2 more times. Logically, anten-
nae do not degrade the signal (assuming they’re working right), so dBi is
always a gain.
30_575252 appc.qxd 9/3/04 8:40 AM Page 366
367
Appendix C: The Fundamentals of Radio Frequency
Calculating path loss
You can calculate the path loss by using one of the following formulas:
= 32.4 + 20 log + 20 log
= 36.6 + 20 log + 20 log
where L
p
is the path loss given for either kilometers or miles, f is the fre-
quency in MHz, and d is the distance in kilometers in the first formula and
miles in the second. The path loss for a one-mile path is figured as follows:
L
p
= 36.6 + 20 log2437 + 20 log1 (kilometers)
L
p
= 36.6 + (20 × 3.39) + (20 × 0) = 104.4 (miles)
Using Channel 6 across a one-mile path, the loss is 104.4 dB. That’s quite a lot!
That formula is pretty intimidating, so we provide Table C-8 as an estimate of
path loss for 2.4 GHz networks.
Table C-8 Free Space Loss
Distance (In Meters) Distance (In Feet) Loss (In dB)
100 328.08 80.23
200 656.17 86.25
500 1,640.42 94.21
1,000 3,280.84 100.23
2,000 6,561.68 106.25
5,000 16,404.20 114.21
10,000 32,808.40 120.23
Calculating antenna length
You can calculate the length of the antenna by using the following formula:
= 984 /
30_575252 appc.qxd 9/3/04 8:40 AM Page 367
368
Part VI: Appendixes
where f is the frequency in MHz, and the result L (length) is in feet.
L = 984 / 2412
L = 0.4079 feet or 4.895 inches
For the 2.4 GHz ISM band, the ideal antenna length is 4.89 inches.
Calculating coaxial cable losses
Coaxial cable eats signal strength for breakfast. One very common coax
cable (the Times Microwave LMR 240) has a 12.7 dB loss for 100 feet. Think of
that — a –3 dB loss means the that power is halved! A –6 dB loss means that
the power is halved again, or one-fourth of the power. At –9 dB, you have but
one-eighth left; at –12 dB, you have only one-sixteenth of the power remaining.
Cable losses increase linearly. Or in other words, when you lose 12 dB per
100 feet, you lose 6 dB per 50 feet, and so on. Using the LMR 240 coaxial cable
as an example, to calculate the loss over 10 feet, the calculation is
10/100 × 12.7 = 1.27 dB
Over 15 feet, it is
15/100 × 12.7 = 1.91 dB
You can calculate the power ratio associated with the dB value by dividing
the dB value by 10 and raising
1
⁄10 to that power. For example
1/10
0.127
= 0.746
This means that you’ll have only 75 percent of your input power at the end of
the 10-foot run of cable. It goes without saying that you should keep your
cable runs to the bare minimum.
Calculating the Fresnel zone
You can calculate the radius of the Fresnel zone at the widest point by using
the formula:
= 43.3 × √ / 4
where d is the distance of the link in miles, f is the frequency in GHz, and the
result R is in feet.
R = 43.3 ×√2/4 * 2.4
R = 19.76 feet
30_575252 appc.qxd 9/3/04 8:40 AM Page 368
369
Appendix C: The Fundamentals of Radio Frequency
In the preceding solution, you have an 802.11b or g link that is 2 miles long.
So take the visual line of site and measure about a 20 foot radius around the
line: That is your Fresnel zone. Keep it clear!
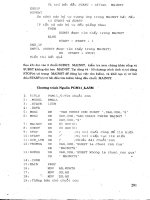
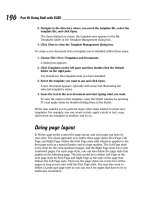
Throw all this together. Figure C-3 shows an RF circuit with an access point,
connectors, cables, and an antenna. The access point radiates 100 mW of
power. Each connector adds 3 dB of loss. Each cable run loses 3 dB as well.
Finally, the antenna is a 16 dBi gain antenna. Table C-8 shows the results of
this circuit.
Table C-8 RF Circuit Power Calculation
Power Value Factor Result
Access point 100 mW
Connectors –9 dB ÷ 2 ÷ 2 ÷ 2 12.5 mW
Cables –6 dB ÷ 2 ÷ 2 3.125 mW
Antenna +16 dBi × 10 × 2 × 2 125 mW
With an access point of100 mW
Connectors: –9 dB / 2 / 2 / 2 = 12.5 mW
Cables: –6 dB / 2 / 2 = 3.125 mW
Antenna: +16 dBi × 10 × 2 × 2 =125 mW
Access
point
Connector 1
Cable 1
Cable 2
Antenna
Connector 2
Connector 3
Figure C-3:
RF Circuit.
30_575252 appc.qxd 9/3/04 8:40 AM Page 369
370
Part VI: Appendixes
The result is 125 mW radiated power at the antenna. If these calculations
make you dizzy, do not despair. The nice Community Wireless Project:
Norfolk people have generously provided online calculators at
www.retro-
city.co.uk/bovistech/wireless/calcs.htm
. They give you calculators
for milliwatts to dBm (and vice versa), transmit power, operating system
margin, and Fresnel zone.
Calculating the measurements
for a home-grown antenna
Gotcha. We could give you all the mathematics to build your own antenna,
but we won’t. We prefer to point you toward the excellent sites that already
do this. Try the following:
ߜ
www.oreillynet.com/cs/weblog/view/wlg/448
ߜ www.freeantennas.com
ߜ www.turnpoint.net/wireless/cantennahowto.html
ߜ www.netscum.com/~clapp/wireless.html
ߜ www.ashtec.dyndns.org/ashtec/mods/index.html
If you want a more comprehensive list, try www.wirelessanarchy.com/
#Antenna
.
That’s it. You now have a basic understanding of the fundamentals of radio
frequency. If you are interested in getting more information, check out the
following sites:
ߜ
www.sss-mag.com/ss.html
ߜ />ߜ />emspectrum.html
ߜ www.alvarion.com/RunTime/Materials/PDFFiles/FHvsDS-ver7.pdf
ߜ www.glenbrook.k12.il.us/gbssci/phys/Class/waves/u10l3b.html
ߜ
ߜ www.5ivenetworks.com/index2.asp?act=tool
Who knows, may be you’ll go on to become a Certified Wireless Network
Administrator (
www.cwne.com).
30_575252 appc.qxd 9/3/04 8:40 AM Page 370
• Numbers & Symbols •
@stake (at stake) Web site, 75, 151
3Com Network Director software, 287
3G Americas (organization), 342
3GPP (3rd Generation Partnership
Project), 343
5ivenetworks Web site, 370
802.1d IEEE standard, 258
802.1x IEEE standard, 58, 205–206, 347
802.3 IEEE standard, 13
802.3af IEEE standard, 244
802.11 IEEE standard, 15, 49, 186, 348, 360
802.11a IEEE standard
channel capacity, 30, 31, 359
encoding, 348
equipment cost, 27, 31
frequency, 53, 348, 355, 359, 360
hardware support, verifying, 49
interference, 30, 31
introduced, 16
security features, 186, 193–194
throughput, 29, 30, 348
USB support, 107
802.11b IEEE standard
AES support, 31
Bluetooth device, using alongside, 68
channel capacity, 30, 357, 359
compatibility, backward, 349
EAP support, 31
encryption, 31
equipment cost, 27, 31
frequency, 53, 348, 355, 359, 360
hardware support, verifying, 49
interference, 30, 63, 177
introduced, 16
range, 29
throughput, 29, 348
WEP support, 31
WPA support, 31
802.11c IEEE standard, 349
802.11d IEEE standard, 349
802.11e IEEE standard, 349
802.11f IEEE standard, 349
802.11g IEEE standard
Bluetooth device, using alongside, 68
channel capacity, 30
equipment cost, 27
frequency, 53, 355, 356, 359, 360
hardware support, verifying, 49
interference, 30, 63, 177
introduced, 16
range, 30, 31
throughput, 29, 30, 44
USB support, 107
802.11h IEEE standard, 342, 350
802.11i IEEE standard, 164, 178, 202,
204, 350
802.11j IEEE standard, 350
802.11k IEEE standard, 351
802.11n IEEE standard, 351
802.15 IEEE standard, 16, 69, 351
802.15.4 IEEE standard, 13
802.15.1 IEEE standard, 13
802.15.3 IEEE standard, 13
802.16 IEEE standard, 13, 15, 24, 352
802.20 IEEE standard, 16
1100 AP, Aironet, 85
1200 AP, Aironet, 27, 30, 43, 85, 99–102
1394 IEEE standard, 13
1400 Series Wireless Bridge, Aironet, 251
• A •
AbsoluteValue Systems Web site, 119
access point. See AP
ACK (acknowledge) transmission
frame, 241
ACO (Authentication Ciphering Offset), 79
ad hoc network, 51–52, 67, 133–134,
250, 317
AdRem Software NetCrunch, 287
AeroLAN AL1511 PCMCIA adapter
card, 105
AES (Advanced Encryption Standard),
31, 203, 314
Index
31_575252 bindex.qxd 9/2/04 4:19 PM Page 371
372
Wireless Networks For Dummies
AES-CCMP (Advanced Encryption
Standard-Counter Mode-Cipher Block
Chaining MAC Protocol), 204, 314–315
Affix software, 71
Agere Systems, 164
AGN100 chipset, 238
Air Premier product line, 131, 222
AirBeam software, 288
AirDefense software, 158, 181, 298, 308
Airespace
P802 Handoff Study Group
participation, 123
site survey product line, 36
switch product line, 262
WIDS software, 298
Airgo Networks AGN100 chipset, 238
AirMagnet
Distributed product line, 158
Handheld software, 267
vulnerability scanning software, 289
war driving software, 285
WIDS software, 298
Aironet product line
1100 AP, 85
1400 Series Wireless Bridge, 251
1200 AP, 27, 30, 43, 85, 99–102
AiroPeek software, 267, 287, 294–298,
301, 312
airport connectivity, 24, 135–136, 331–332
Airsnarf software, 316
AirSnort software, 285, 309
AirTouch Network Security System War
Driving Kit, 285
Alcatel signal testing solution, 36
Alert Guru Web site, 338
AL1511 PCMCIA adapter card, 105
Allstream Web site, 144
Alvarion
PC cards, 105
Web site, 370
antenna
amplifier, 131
AP, 85
bridge, 252–253, 259, 260
building, 370
Centrino chipset, 17
choosing appropriate, 54–56
container, plastic, 259
cost, 27
directional, 253, 320–321
dish, 54, 56
diversity, 237, 253
eavesdropping, for, 166
gain, 43, 360
installing, 35, 85
isotropic, 365
length, 367–368
LOS, 42, 62, 66, 125, 236
omni-directional, 54
parabolic, 54, 56
patch, 54
permit, 35
placement, physical, 35
power, maximum, 243
radome housing, 34
receiver, 43, 105
RF, 353, 360, 365, 366, 367–368
rod, 54, 56
sectorized, 54, 56
security, physical, 35
semi-directional, 253
Tecom Omni, 27, 43
transmitter, 43
upgrading, 17
USB port, connecting to, 71, 106
war driving, for, 152
Yagi, 54, 55, 56
AP (access point). See also specific brand
antenna, 85
authentication, 89, 178–179, 187–188
bridge AP functionality, 253, 255
channel setup, 93
clients per AP, maximum, 30
connection, 84–86, 87–88, 100
cost, 26–27
encryption, 27, 96–98
Ethernet, 85
firmware, 94
frequency, 53
hardening, 326
idle time, maximum, 91
IP address, 87, 91–92, 100–101
LAN, maximum number of APs per, 129
logging in, 88–89
MAC address, 50, 100
management, remote, 90
31_575252 bindex.qxd 9/2/04 4:19 PM Page 372