Báo cáo y học: "Computational identification of developmental enhancers: conservation and function of transcription factor binding-site clusters in Drosophila melanogaster and Drosophila pseudoobscura" ppsx
Bạn đang xem bản rút gọn của tài liệu. Xem và tải ngay bản đầy đủ của tài liệu tại đây (1.25 MB, 24 trang )
Open Access
Volume
et al.
Berman
2004 5, Issue 9, Article R61
Research
comment
Computational identification of developmental enhancers:
conservation and function of transcription factor binding-site
clusters in Drosophila melanogaster and Drosophila pseudoobscura
Benjamin P BermanÔ*, Barret D PfeifferÔ, Todd R Laverty,
Steven L SalzbergĐ, Gerald M Rubin*, Michael B EisenÔ*ảƠ and
Susan E CelnikerÔ
reviews
Addresses: *Department of Molecular and Cell Biology, University of California, Berkeley, CA 94720, USA. †Berkeley Drosophila Genome
Project, Genome Sciences Department, Life Sciences Division, Lawrence Orlando Berkeley National Laboratory, Berkeley, CA 94720, USA.
‡Howard Hughes Medical Institute, Department of Molecular and Cell Biology, University of California, Berkeley, CA 94720, USA. §The
Institute for Genomic Research, 9712 Medical Center Drive, Rockville, MD 20878, USA. ¶Genome Sciences Department, Genomics Division,
Lawrence Orlando Berkeley National Laboratory, Berkeley, CA 94720, USA. ¥Center for Integrative Genomics, University of California,
Berkeley, CA 94720, USA.
Ô These authors contributed equally to this work.
reports
Correspondence: Michael B Eisen. E-mail:
Published: 20 August 2004
Received: 14 July 2004
Revised: 4 August 2004
Accepted: 6 August 2004
Genome Biology 2004, 5:R61
© 2004 Berman et al.; licensee BioMed Central Ltd.
This is an Open Access article distributed under the terms of the Creative Commons Attribution License ( which
permits unrestricted use, distribution, and reproduction in any medium, provided the original work is properly cited.
ative sequence identification of developmental enhancers: conservation and function of transcription factor makes better use of in Dro
Measuring conservation of sequence methods that
sophila melanogaster and Drosophila pseudoobscura examine only sequence identity.
Computational data than commonly used features closely linked to function - such as binding-site clustering -binding-site clusters compar-
Background: The identification of sequences that control transcription in metazoans is a major goal of genome
analysis. In a previous study, we demonstrated that searching for clusters of predicted transcription factor binding
sites could discover active regulatory sequences, and identified 37 regions of the Drosophila melanogaster genome
with high densities of predicted binding sites for five transcription factors involved in anterior-posterior
embryonic patterning. Nine of these clusters overlapped known enhancers. Here, we report the results of in vivo
functional analysis of 27 remaining clusters.
Genome Biology 2004, 5:R61
information
Conclusions: Measuring conservation of sequence features closely linked to function - such as binding-site
clustering - makes better use of comparative sequence data than commonly used methods that examine only
sequence identity.
interactions
Results: We generated transgenic flies carrying each cluster attached to a basal promoter and reporter gene,
and assayed embryos for reporter gene expression. Six clusters are enhancers of adjacent genes: giant, fushi tarazu,
odd-skipped, nubbin, squeeze and pdm2; three drive expression in patterns unrelated to those of neighboring genes;
the remaining 18 do not appear to have enhancer activity. We used the Drosophila pseudoobscura genome to
compare patterns of evolution in and around the 15 positive and 18 false-positive predictions. Although
conservation of primary sequence cannot distinguish true from false positives, conservation of binding-site
clustering accurately discriminates functional binding-site clusters from those with no function. We incorporated
conservation of binding-site clustering into a new genome-wide enhancer screen, and predict several hundred
new regulatory sequences, including 85 adjacent to genes with embryonic patterns.
refereed research
Abstract
deposited research
The electronic version of this article is the complete one and can be
found online at />
R61.2 Genome Biology 2004,
Volume 5, Issue 9, Article R61
Berman et al.
Background
The transcription of protein-coding genes in distinct temporal and spatial patterns plays a central role in the differentiation and development of animal embryos. Decoding how the
unique expression pattern of every transcript is encoded in
DNA is essential to understanding how genome sequences
specify organismal form and function.
Understanding gene regulation requires discovering the cisacting sequences that control transcription, identifying which
trans-acting factors act on each regulatory sequence, and
determining how these interactions affect the timing and
organization of transcription. The first step in this process is
by no means straightforward. Regulatory regions are often
large and complex. Functional cis-acting sequences are found
5' and 3' of transcripts and in introns, and can act over short
or long distances. Most of the described animal regulatory
sequences were identified by experimental dissection of a
locus, and astonishingly few of these are well characterized.
Despite the paucity of good examples, as multiple regulatory
sequences from different organisms were identified and characterized, some common features became apparent [1,2].
Most animal regulatory sequences act as compact modular
units, with regions of roughly a kilobase (kb) in size controlling specific aspects of a gene's transcription. These regulatory units - referred to here as cis-regulatory modules (CRMs)
- tend to contain functional binding sites for several different
transcription factors, often with multiple sites for each factor.
As the first animal genome sequences were completed [3-6],
researchers began to tackle the challenge of identifying regulatory sequences on a genomic scale. We and several other
groups began to ask whether common characteristics of regulatory sequences - modularity and high binding-site density might be distinguishing characteristics that would permit the
computational identification of new regulatory sequences. A
number of in silico methods to identify regulatory sequences
on the basis of binding-site clustering have been developed
and applied to animal genomes [7-10]. Some of the predictions have the expected in vivo regulatory activity [11-17], yet
few of these predictions have been systematically evaluated.
The transcriptional regulatory network governing early Drosophila development is perhaps the best system in which to
apply and evaluate these methods. Development of the Drosophila embryo is arguably better understood than that of any
other animal. Sophisticated genetic screens [18,19] have identified most of the key regulators of early development, and the
molecular biology and biochemistry of these factors and their
target sequences have received a great deal of attention. The
spatial and temporal embryonic expression patterns of a large
number of genes are known from microarray [20] and in situ
expression studies [21]. Transcriptional regulation plays a
uniquely important role in pre-gastrula patterning, as most of
the key events occur in the absence of cell membranes and the
/>
cell-cell signaling systems that play a crucial role later in fly
development and throughout the development of most other
animals.
In a previous study [11], we identified 37 regions of the Drosophila melanogaster genome with unusually high densities
of predicted binding sites for the early-acting transcription
factors Bicoid (BCD), Hunchback (HB), Krüppel (KR), Knirps
(KNI) and Caudal (CAD). As nine of these regions overlapped
previously known CRMs, we proposed the remaining 28 as
predicted CRMs (pCRMs). We tested one of the previously
untested pCRMs for enhancer activity in a standard reporter
gene assay [22,23] and showed that it is responsible for
directing a portion of the embryonic expression pattern of the
gap transcription factor gene giant (gt) in a posterior stripe.
Here, we report the systematic testing of the remaining 27
untested pCRMs for enhancer activity, resulting in collections
of both bona fide positive and false-positive predictions,
allowing us to develop and evaluate methods to improve the
accuracy of methods for identifying functional cis-regulatory
sequences.
We were particularly interested in methods based on the
comparison of genome sequences of related species. The
genome sequence of D. pseudoobscura (which diverged from
D. melanogaster approximately 46 million years ago [24])
was recently completed by the Baylor Human Genome
Sequencing Center, and several other Drosophila species are
currently being sequenced. The morphological and molecular
events in early embryonic development are highly conserved
among drosophilids, and we expect the activity of the transcriptional regulators and the architecture of regulatory networks to be highly conserved as well. Most D. melanogaster
regulatory sequences should have functional orthologs in
other Drosophila species [25,26], and a major rationale for
sequencing other Drosophila species is the expectation that
regulatory sequences have characteristic patterns of evolution that can be used to identify them and to better understand their function.
Most methods used to identify regulatory sequences from
interspecies sequence comparison are fairly simple. They
identify 'conserved' non-coding sequences (CNSs), operationally defined as islands of non-coding sequence with
relatively high conservation flanked by regions of low conservation, and assume that this conservation reflects regulatory
function. Although crude, these methods have been remarkably effective in identifying mammalian regulatory sequences
[27,28], and preliminary studies in Drosophila suggest that
similar methods will be valuable in insects as well [29]. However, despite such successes, the extent of the efficacy of comparative sequence analysis in regulatory sequence discovery
remains unclear. A systematic comparison of human-mouse
sequence conservation in known regulatory regions and
ancestral repeats (which provide a model for neutral evolution) suggests that regulatory regions cannot generally be
Genome Biology 2004, 5:R61
Genome Biology 2004,
distinguished on the basis of simple sequence conservation
measures alone [30,31]. Similarly, a recent analysis of D. melanogaster and D. pseudoobscura showed that known regulatory regions are only slightly more conserved than the rest of
the non-coding genome [32], highlighting the need for further study and the development of comparative methods that
go beyond measures of sequence identity.
containing the pCRM. Four of these new enhancers act in the
blastoderm and two during germ-band elongation.
Results
CE8012 is in the third intron of POU domain protein 2
(pdm2) and appears to completely recapitulate its stage-12
expression pattern, which is limited to a subset of the developing neuroblasts and ganglion mother cells of the developing central nervous system. A similar pattern of expression
was previously described for the protein product of pdm2
[36]. It is worth noting that we do not detect expression of
CE8012 in the blastoderm stage, whereas the endogenous
gene exhibits a blastoderm expression pattern similar to nub.
CE8027 is 3' of the gene for the Zn-finger transcription factor
squeeze (sqz) and recapitulates the wild-type expression pattern of sqz RNA in a subset of cells in the neuroectoderm at
stage 12. The wild-type sqz expression pattern was previously
described [37].
The remaining three active pCRMs cannot be easily associated with a specific gene. CE8005 drives expression in the
ventral region of the embryo. It is 3' of a gene encoding a
ubiquitously expressed Zn-finger containing protein
(CG9650) that is maternally expressed and deposited in the
embryo. This strong maternal expression potentially
obscures a zygotic expression pattern. Two additional adja-
Genome Biology 2004, 5:R61
information
Six of the active pCRMs drive lacZ expression in patterns that
recapitulate portions of the expression of a gene adjacent to or
CE8024 is 3' of the pair-rule gene fushi-tarazu (ftz) and
drives expression of two of its stripes: stripe 1 at 35% and
stripe 5 at 65% egg length. Using a similar CRM reporter
assay, this pattern of expression was also detected by [35].
interactions
To identify the genes regulated by the nine pCRMs with
embryonic expression, we examined the expression patterns
of genes containing the pCRM in an intron and genes with
promoters within 20 kb of the CRM (see Figure 1). We used
the embryonic microrarray and whole-mount in situ expression data available in the Berkeley Gene Expression Database
[21], supplemented with additional whole-mount in situ
experiments where necessary (data not shown; these new in
situ's will be included in the public expression database [33]
at its next release).
CE8010 is 5' of the pair-rule gene odd-skipped (odd) and
drives expression of two of its seven stripes: stripe 3 at 55%
and stripe 6 at 75% egg length. This CRM also has the ability
to drive later, more complex, patterns of expression. During
stages 6 and 7, expression is detected in the procephalic ectoderm anlage and in the primordium of the posterior midgut.
By stage 13, expression is also detected in the anterior cells of
the midgut which will give rise to the proventriulus, the first
midgut constriction, the posterior midgut and microtubule
primordial as well as cells in the hindgut, all similar to portions of the pattern of wildtype odd protein expression previously described [34].
refereed research
We examined the expression of these constructs by in situ
RNA hybridization to the lacZ transcript in embryos at different stages in at least three independent transformant lines.
Nine of the 27 transgenes showed mRNA expression during
embryogenesis (Figure 1), while the remaining 18 assayed
transgenes showed no detectable expression at any stage during embryogenesis.
CE8011 is 5' of the gene for the POU-homeobox transcription
factor nubbin (nub). The CRM recapitulates the endogenous
blastoderm expression pattern of nub, first detected as a
broad band extending from 50 to 75% egg length. Although
nub expression continues in later embryonic stages, CE8011
expression is limited to the blastoderm stage.
deposited research
We successfully generated multiple independent transgenic
fly lines for 27 of the 28 pCRMs. We repeatedly failed to generate transgenes containing CE8007. This sequence contains
five copies of an approximately 358 base-pair (bp) degenerate
repeat. One additional pCRM (CE8002) also contains tandem repeats. While we were able to generate transgenes for
CE8002 and assay its expression, these two tandem repeatcontaining pCRMs (CE8007 and CE8002) were excluded
from subsequent analyses.
CE8001 is 5' of the gene for the gap transcription factor giant
and recapitulates the posterior domain (65-85% egg length
measuring from the anterior end of the embryo) of gt expression in the blastoderm as previously described [11].
reports
The 37 pCRMs are shown in Table 1. Each has been assigned
an identifier (of the form PCEXXXX). The first nine overlap
previously known enhancers of runt (run), even-skipped
(eve), hairy (h), knirps (kni) and hunchback (hb). To determine whether any of the remaining 28 pCRMs also function
as enhancers, we generated P-element constructs containing
the pCRM sequence with minimal flanking sequence on both
sides fused to the eve basal promoter and a lacZ reporter gene
(see Materials and methods). As the margins of the tested
sequences do not precisely correspond to the margins of the
clusters, we assigned a unique identifier (of the form
CEXXXX) to each tested fragment (identical CE and PCE
numbers correspond to the same pCRM).
Berman et al. R61.3
reviews
Expression patterns of pCRM containing transgenes
Volume 5, Issue 9, Article R61
comment
/>
R61.4 Genome Biology 2004,
Volume 5, Issue 9, Article R61
Berman et al.
/>
Table 1
Genomic location of pCRMs and neighboring genes
pCRM
ID
*
Name
CRM
activity
Arm
pCRM
start
pCRM end
pCRM
length
5' gene
pCRM
relative
position
3' gene
pCRM
relative
position
1
PCE7001
runt stripe 3
+
X
20,357,206
20,358,294
1,089
CG1338
-9,550
run
-8,561
2
PCE7002
eve stripes 3/7
+
2R
5,035,494
5,036,771
1,278
CG12134
3,713
eve
-2,952
3
PCE7003
eve stripe 2
+
2R
5,038,454
5,039,040
587
CG12134
6,673
eve
-683
4
PCE7004
eve stripes 4/6
+
2R
5,044,597
5,045,395
799
eve
4,874
TER94
-4,398
5
PCE7005
hairy stripe 7
+
3L
8,624,351
8,625,245
895
CG6486
16,118
h
-9,423
6
PCE7006
hairy stripe 6
+
3L
8,625,452
8,626,319
868
CG6486
17,219
h
-8,349
7
PCE7007
hairy stripes 1,5
+
3L
8,629,180
8,629,966
787
CG6486
20,947
h
-4,702
8
PCE7008
kni upstream
+
3L
20,615,070
20,616,425
1,356
kni
-1,169
CG13253
21,311
9
PCE7009
hb HZ1.4
+
3R
4,526,315
4,527,521
1,207
hb
-2,760
CG8112
403
10
PCE8001
1
gt posterior domain
+
X
2,187,439
2,188,382
944
gt
-1,704
tko
12,366
11
PCE8010
2
odd stripes 3/6
+
2L
3,601,750
3,602,509
760
odd
-2,433
Dot
-9,351
12
PCE8011
3
nub blastoderm
+
2L
12,605,345
12,606,039
695
CG15488
2,687
nub
-1,178
13
PCE8024
4
ftz stripes 1/5
+
3R
2,693,713
2,694,405
693
ftz
3,667
Antp
131,873
14
PCE8012
5
pdm2 neurogenic
+
2L
12,663,878
12,664,600
723
pdm2
2,875
pdm2
2,875
15
PCE8027
6
sqz neurogenic
+
3R
15,000,096
15,000,905
810
sqz
10,137
CG14282
-1,833
16
PCE8005
7
cluster_at_7A
amb.
X
6,996,209
6,996,756
548
CG32725
-17,671
CG1958
-10,524
17
PCE8016
8
cluster_at_55C
amb.
2R
13,354,407
13,355,109
703
CG14502
957
CG14502
957
18
PCE8020
9
cluster_at_70F
amb.
3L
14,665,967
14,666,676
710
ome
10,334
ome
10,334
19
PCE8006
13
cluster_at_7B
-
X
7,239,486
7,240,124
639
CG11368
46,902
CG32719
13,096
20
PCE8008
15
cluster_at_8F
-
X
9,457,631
9,458,375
745
btd
24,460
Sp1
-33,567
21
PCE8013
17
cluster_at_34E
-
2L
13,989,283
13,990,132
850
rk
-5,879
bgm
-5,767
22
PCE8014
18
cluster_at_36F
-
2L
18,400,758
18,401,458
701
CG31749
36,362
RpS26
19,862
23
PCE8015
19
cluster_at_47A
-
2R
5,664,440
5,665,094
655
psq
45,904
psq
45,904
24,156
24
PCE8017
20
cluster_at_56B
-
2R
14,266,629
14,267,261
633
CG7097
24,156
CG7097
25
PCE8018
21
cluster_at_59B
-
2R
17,995,894
17,996,609
716
CG32835
759
CG32835
759
26
PCE8019
22
cluster_at_67B
-
3L
9,529,913
9,530,579
667
CG32048
10,499
CG32048
10,499
6,617
27
PCE8021
23
cluster_at_75C
-
3L
18,339,914
18,340,665
752
grim
-86,621
rpr
28
PCE8022
24
cluster_at_76C
-
3L
19,594,180
19,594,883
704
CG8786
-1,409
CG8782
4,923
29
PCE8023
25
cluster_at_84A
-
3R
2,595,162
2,595,926
765
Ama
6,847
Dfd
-21,632
30
PCE8025
26
cluster_at_85C
-
3R
4,944,607
4,945,444
838
pum
117,315
pum
117,315
31
PCE8026
27
cluster_at_88F
-
3R
11,424,315
11,424,996
682
CG18516
-45,803
CG5302
-33,626
32
PCE8028
28
cluster_at_95C
-
3R
19,757,908
19,758,531
624
Gdh
950
Gdh
950
33
PCE8003
11
cluster_at_5C.1
-
X
5,658,504
5,659,131
628
CG3726
952
CG3726
952
34
PCE8004
12
cluster_at_5C.2
-
X
5,674,913
5,675,606
694
CG3726
17,361
CG3726
17,361
35
PCE8009
16
cluster_at_12E
-
X
14,146,556
14,147,218
663
CG32600
93,317
CG32600
93,317
36
PCE8002
10
cluster_at_4B
-
X
4,124,119
4,125,459
1,341
CG12688
2,032
CG32773
3,408
37
PCE8007
14
cluster_at_7F
Unknown
X
8,350,658
8,351,315
658
Caf1-180
-5,486
oc
38,281
*IDs in this column are taken from [11]. Genomic locations of the 37 pCRMs identified in our previous genome search. All coordinates are from D.
melanogaster Release 3 [68]. pCRMs 1-9 were reported prior to our original search, and we attempted to characterize 10-37 in the current study
(we reported PCE8001 in our previous publication). pCRMs10-15 recapitulate endogenous expression patterns of embryonic genes, and 16-18 drive
ambiguous (amb.) expression patterns, as described in the text. pCRMs 19-36 drove no detectable expression in the embryo, and pCRM 37 was not
tested. Orthologous regions were identified in D. pseudoobscura for all but pCRMs 33-37. The 5' and 3' gene columns correspond to the closest
transcription (or annotation) start 5' and 3' of the pCRM. If a pCRM is within an intron, only the intron-containing gene is reported and its name is
given in italics. The names of genes with early anterior-posterior patterns are in bold.
Genome Biology 2004, 5:R61
/>
Wild type
gt
CE8001
Volume 5, Issue 9, Article R61
Wild type / lacZ
gt / CE8001
Berman et al. R61.5
Genomic region
3A
z
CE8001
1kb
gt
CG32797
nub
CE8011
nub / CE8011
EG:BACH59J11.2
33E
nub
CG31859
CG15488
CE8011
ref2
odd
CE8010
odd / CE8010
tko
24A
Dot
odd
CE8024
ftz / CE8024
84B
ftz
CE8024
Scr
(b) pdm2
CE8012
pdm2 / CE8012
pdm2
33F
CG6153
CG6167
CE8027
sqz / CE8027
91F
CE8005
CG14282
CE8027
CG5558
CG11779
7A
CG5555
CE8005
CG32725
55C
CG33198
sbb
Ote
CE8020
70F
CG14502
CG13476
abcde
CE8016
CG14505
a) CG18536
b) CG18537
c) CG18539
d) CG18538
e) CG18540
ome
CG13471
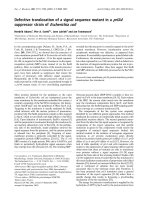
Figure 1
Expression patterns of active pCRMs
Expression patterns of active pCRMs. Embryonic whole-mount in situ RNA hybridizations using lacZ probe of transgenes with positive expression in
independent lines (see Materials and methods). The first column (wild type) shows the endogenous gene expression; the second column (lacZ) shows
transgene expression patterns; the third column shows double-labeled embryos with the endogenous (red) and transgene (blue) expression patterns. To
the right of the images are maps of the gene regions centered on each pCRM.
CE8020 drives an atypical four-stripe pattern in the blastoderm - two stripes at 7% and 26% that are anterior to the first
ftz stripe and two stripes at 39% and 87%. It is in the first
intron of ome (CG32145), which is not expressed maternally
and has no blastoderm expression, but is expressed late in
salivary gland, trachea, hindgut and a subset of the epidermis.
Genome Biology 2004, 5:R61
information
CE8016 drives a seven-stripe expression pattern in the blastoderm. It is in the first intron of CG14502 which shows very
low level expression by microarrays in the blastoderm, and
has no obvious detectable pattern of expression in wholemount in situ hybridization of embryos. This pCRM is
approximately 2 kb 5' of scribbler (sbb), which is expressed
maternally, possibly obscuring an early zygotic expression
pattern (a few in situ images show a hint of striping). sbb is
also expressed later in development in the ventral nervous
system. An additional potential target, Otefin (Ote), is also
expressed maternally and relatively ubiquitously through
germ-band extension. All other nearby genes displayed in
Figure 1 showed no embryonic expression in whole-mount in
situ hybridization or by microarray.
interactions
cent genes, CG32725 and CG1958, showed no expression in
whole-mount in situ hybridization of embryos.
refereed research
CG13473
CE8020
CG17177
deposited research
CG1958
CG9650
CE8016
CG5780
CG31475
nos
(c)
CG5525
sqz
reports
CE8012
CG15485
sqz
for
CG15418
reviews
CE8010
ftz
comment
(a)
lacZ
Genome Biology 2004,
R61.6 Genome Biology 2004,
Volume 5, Issue 9, Article R61
Berman et al.
All other nearby genes displayed in Figure 1 showed no
embryonic expression in whole-mount in situ hybridization
or by microarray.
With these results, and the nine previously known enhancers,
at least 15 of the 37 highest density clusters of the five transcription factors used in our initial screen have early-embryonic enhancer activity. The remainder of this paper examines
35 of the original 37 clusters, with the two tandem repeatcontaining clusters excluded. We divide these 35 into three
categories - 15 positives (the nine overlapping previously
known enhancers plus the six new enhancers identified here),
three ambiguous (the three positives without a clear regulated gene), and 17 negatives (see Table 2). We largely focus
on differences between the positives and negatives.
Distinguishing active and inactive clusters
All 15 positives are within 20 kb of the transcription start site
(or, where the transcription start site is unknown, the start of
the gene annotation) of transcripts expressed in spatiotemporal patterns consistent with regulation by the maternal and
gap transcription factors used in our screen (that is, in anterior-posterior patterns in the blastoderm or in the developing
neuroblasts of the central nervous system). Only one of the 17
negatives was located within 20 kb of a plausible target
(PCE8021 is 7 kb upstream of reaper), so out of 16 pCRMs
located within 20 kb of a gene with appropriate expression, 15
(94%) are active enhancers.
The positives are, on average, larger than the negatives (average cluster size of positive = 900 bp, while average cluster size
of negatives was 711 bp), a difference that is significant by the
Komogorov-Smirnov (KS) test (p = 0.017). The positives have
a slightly higher density of binding sites, but this difference
was not significant. The binding site composition of the positives and negatives are similar (the positives contain more
KR, and fewer BCD binding sites, but again these differences
are not highly significant). Although others have reported
that some factors have characteristic spacings with respect to
themselves and other factors [38], we could not find evidence
for such spacing or identify other differences that could distinguish positive pCRMs from negative (Figure 2).
Use of D. pseudoobscura
We assembled the D. pseudoobscura genome from traces
deposited in the NCBI's TraceDB using the Celera assembler
[39,40]. These assemblies were used to examine the conservation of our pCRMs and to assess whether conservation
could be used instead of or in addition to binding site clustering as a way to identify CRMs.
We first assessed whether positive pCRMs could be distinguished from their flanking sequences based on degree of
conservation. In vertebrate comparative genomics, relatively
simple methods (such as VISTA [41]) are commonly used to
identify CNSs that are a surprisingly rich source of new
/>
cis-regulatory sequences. We evaluated the potential of using
such methods with D. melanogaster and D. pseudoobscura
in two ways. First, we constructed percent-identity plots for
the regions containing all of the 37 pCRMs (Figure 3; similar
plots for all pCRMs are available in the online supplement at
[42]) with the location of pCRMs and other known regulatory
sequences clearly indicated. Although it appears that some
CRMs (that is, eve stripe 3/7) would have been successfully
identified by such simple comparative methods, positive
pCRMs do not collectively appear distinguishable from flanking sequence on the basis of conservation alone. Although
positive pCRMs are almost all in highly conserved blocks,
there is a surprisingly high amount of non-coding sequence
conservation throughout these regions, and most negative
pCRMs are also contained in highly conserved blocks. It
remains to be seen whether this difference in the conservation
landscape of Drosophila non-coding sequences compared to
vertebrates reflects a significant difference in the functional
organization of non-coding sequences, or simply indicates
that there is too little divergence between D. melanogaster
and D. pseudoobscura to detect useful differences in the rates
of evolution (see Discussion).
We next assessed whether positive pCRMs can be distinguished from negative pCRMs on the basis of their degree of
similarity between D. melanogaster and D. pseudoobscura.
For each pCRM-containing region, we identified orthologous
contigs from the D. pseudoobscura assembly and aligned
them using the alignment program LAGAN [43]. We were
able to find orthologous regions for 32 pCRMs (see Table 2).
Using the simple measure of percent identity, we find that
positive pCRMs are, on average, more highly conserved than
negative pCRMs (see Table 2). Although this difference is significant (p = 0.002 by KS test), the distribution of conservation scores for positive and negative pCRMs overlap
considerably, and thus conservation alone is not a useful way
of distinguishing positive and negative pCRMs (see Figure
4b).
To get a genome-wide perspective on the degree of conservation in positive pCRMs, we analyzed the conservation of
CRM-sized (1 kb) regions in randomly chosen sections of the
genome (Figure 4b). Positive pCRMs are, generally, more
conserved than average CRM-sized sequences, and some positive pCRMs are among the most highly conserved non-coding sequences in the genome. However, a conservation cut-off
necessary to select the majority of positive pCRMs would
select roughly one third of the non-coding regions of the
genome, and thus is not a practical method for prioritizing
sequences for functional analysis.
Conservation of binding sites and conservation of
clustering
We expect that most genes will have similar expression patterns in D. melanogaster and D. pseudoobscura, and that
most D. melanogaster enhancers should have functional
Genome Biology 2004, 5:R61
/>
Genome Biology 2004,
Volume 5, Issue 9, Article R61
Berman et al. R61.7
Table 2
Sequence and binding-site conservation in pCRMs between D. melanogaster and D. pseudoobscura
Name
CRM activity
pCRM length
(D. melanogaster)
pCRM length
(D. pseudoobscura)
Percent
identity
D. melanogaster
sites
D. pseudoobscura
sites
Conserved
sites
Fraction
conserved
A
A
A+P
comment
pCRM
A+P
71%
27
20
11
20
41%
74%
1,114
61%
28
25
21
25
75%
89%
3
PCE7003
eve stripe 2
+
587
771
67%
14
10
9
10
64%
71%
4
PCE7004
eve stripes 4/6
+
799
1,003
70%
20
18
13
17
65%
85%
5
PCE7005
hairy stripe 7
+
895
869
66%
20
16
12
16
60%
80%
6
PCE7006
hairy stripe 6
+
868
952
62%
23
19
11
19
48%
83%
7
PCE7007
hairy stripes 1,5
+
787
723
56%
16
15
9
13
56%
81%
8
PCE7008
kni upstream
+
1,356
1,654
68%
33
31
24
30
73%
91%
9
PCE7009
hb HZ1.4
+
1,207
1,383
69%
24
23
17
21
71%
88%
10
PCE8001
gt posterior domain
+
944
1,092
64%
23
19
15
18
65%
78%
11
PCE8010
odd stripes 3/6
+
760
825
70%
17
19
12
16
71%
94%
12
PCE8011
nub blastoderm
+
695
894
70%
18
13
10
12
56%
67%
13
PCE8024
ftz stripes 1/5
+
693
744
77%
14
10
10
10
71%
71%
14
PCE8012
pdm2 neurogenic
+
723
723
72%
14
8
4
8
29%
57%
15
PCE8027
sqz neurogenic
+
810
818
69%
16
17
11
14
69%
88%
16
PCE8005
cluster_at_7A
amb.
548
819
54%
13
4
2
2
15%
15%
17
PCE8016
cluster_at_55C
amb.
703
1,617
55%
16
6
3
6
19%
38%
18
PCE8020
cluster_at_70F
amb.
710
538
47%
14
2
2
2
14%
14%
19
PCE8006
cluster_at_7B
-
639
663
69%
15
9
8
8
53%
53%
20
PCE8008
cluster_at_8F
-
745
716
58%
14
2
1
2
7%
14%
21
PCE8013
cluster_at_34E
-
850
919
61%
17
8
6
8
35%
47%
22
PCE8014
cluster_at_36F
-
701
596
53%
15
6
5
6
33%
40%
23
PCE8015
cluster_at_47A
-
655
652
66%
16
3
3
3
19%
19%
24
PCE8017
cluster_at_56B
-
633
331
33%
15
9
4
8
27%
53%
25
PCE8018
cluster_at_59B
-
716
960
59%
16
4
3
4
19%
25%
26
PCE8019
cluster_at_67B
-
667
675
62%
15
7
5
6
33%
40%
27
PCE8021
cluster_at_75C
-
752
640
59%
19
13
10
12
53%
63%
28
PCE8022
cluster_at_76C
-
704
725
67%
15
9
7
9
47%
60%
29
PCE8023
cluster_at_84A
-
765
1,001
55%
16
7
5
7
31%
44%
30
PCE8025
cluster_at_85C
-
838
827
54%
16
6
1
5
6%
31%
31
PCE8026
cluster_at_88F
-
682
1,096
62%
16
6
5
5
31%
31%
32
PCE8028
cluster_at_95C
-
624
723
60%
15
6
4
6
27%
40%
33
PCE8003
cluster_at_5C.1
-
628
None
34
PCE8004
cluster_at_5C.2
-
694
None
15
35
PCE8009
cluster_at_12E
-
663
None
15
36
PCE8002
cluster_at_4B
-
1,341
None
28
37
PCE8007
cluster_at_7F
Unknown
658
None
15
Mean (pCRMs 1-15)
899
1,005
67%
20
18
13
17
61%
80%
Mean (pCRMs 19-32)
712
752
58%
16
7
5
6
30%
40%
15
Conservation properties are listed for the pCRMs described in Table 1. The number and fraction of conserved sites are shown under two conditions
- aligned sites only (A), or aligned + preserved sites (A+P) (see Materials and methods). D. pseudoobscura sequences used to determine these
properties are available as supplemental material at [42].
Genome Biology 2004, 5:R61
information
1,504
1,278
interactions
1,089
+
refereed research
+
eve stripes 3/7
deposited research
runt stripe 3
PCE7002
reports
PCE7001
2
reviews
1
R61.8 Genome Biology 2004,
Volume 5, Issue 9, Article R61
Berman et al.
/>
Positive
Ambiguous
Aligned sites
PCE7001
PCE7002
PCE7003
PCE7004
PCE7005
PCE7006
PCE7007
PCE7008
PCE7009
PCE8001
PCE8010
PCE8011
PCE8012
PCE8024
PCE8027
PCE8005
PCE8016
PCE8020
Negative
All sites
PCE8006
PCE8008
PCE8013
PCE8014
PCE8015
PCE8017
PCE8018
PCE8019
PCE8021
PCE8022
PCE8023
PCE8025
PCE8026
PCE8028
hb
bcd
cad
Kr
kni
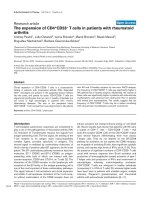
Figure 2
Predicted and aligned binding sites in pCRMs
Predicted and aligned binding sites in pCRMs. Predicted binding sites and aligned binding sites (see Materials and methods) in positive, ambiguous and
negative pCRMs (the positions of overlapping sites were adjusted slightly so that all sites could be seen).
orthologs in D. pseudoobscura. For those enhancers we seek
to identify here - namely those where binding site clustering
reflects their function - we expect clustering to be found in
both D. melanogaster and D. pseudoobscura. Conversely,
clusters that simply occur by chance in either genome but do
not reflect the function of the sequence (as, we believe, is the
case for many of our false-positive predictions) should not be
conserved. Thus, looking for conservation of binding-site
Genome Biology 2004, 5:R61
Genome Biology 2004,
clustering should provide a valuable way of distinguishing
functional and non-functional binding-site clusters in the D.
melanogaster genome.
explained by the positional conservation of sites found in D.
melanogaster or the random occurrence of sites in the
genome. Several of the 15 positive CRMs have high densities
of these preserved but unaligned sites, but two in particular,
runt stripe 3 and hairy stripe 6, stand out from the rest. These
two have almost as many preserved sites as strictly aligned
sites.
As the conservation of binding sites and binding-site clusters
between D. melanogaster and D. pseudoobscura successfully
distinguishes positive and negative predictions made using
the D. melanogaster sequence alone, we incorporated comparative sequence data into our enhancer-prediction algorithm CIS-ANALYST [11]. Instead of searching for clusters of
predicted binding sites in a single genome, eCIS-ANALYST
(the 'e' is for evolutionary) searches for conserved clusters of
sites between the two genomes (see Materials and methods).
eCIS-ANALYST is available at [45].
Using 17 negative pCRMs and an expanded set of 25 positive
pCRMs (which included the 15 positive predictions discussed
above and 10 functional enhancers known to respond to the
five factors; these 10 additional enhancers were discussed and
analyzed in [11] but had binding-site densities below the
threshold used there), we compared the ability of CIS-ANALYST and eCIS-ANALYST to identify positive pCRMs and to
distinguish positive and negative pCRMs at different bindingsite density cutoffs (Figure 5). The incorporation of the conservation criteria greatly improves the algorithm's apparent
performance. The expected fraction of false positives is markedly reduced, and it is possible to lower the binding site
threshold to recover six of the ten previously missed positive
enhancers without increasing the number of expected falsepositive predictions.
Genome Biology 2004, 5:R61
information
As eCIS-ANALYST has markedly better specificity than CISANALYST, we sought to identify BCD, HB, KR, KNI and CAD
targets that were missed with the relatively stringent criteria
used in our previous analysis. Rather than use a stringent cutoff (15 binding sites per 700 bp) as we did in [11], we performed three separate runs with lower cutoffs (for example,
10 sites per 700 bp in one run) and applied a conservation
threshold (see Materials and methods and Additional data file
3) to select 929 conserved binding-site clusters. There were
842 new pCRMs within 20 kb or in an intron of an annotated
transcript (Additional data file 7) and 87 more than 20 kb
(Additional data file 8). We ranked these new pCRMs by a
interactions
New predictions
refereed research
The density of preserved but not aligned sites in positive
pCRMs (4.3/kb) is considerably higher than in negative
pCRMs (2.2/kb) or random sequences (1.8/kb). Thus, in the
D. pseudoobscura orthologs of active D. melanogaster CRMs
we observe an increase in binding-site density that cannot be
eCIS-ANALYST: a comparative enhancer finder
deposited research
To characterize the extent of binding site conservation independent of positional conservation, we computed a second
measure of binding-site conservation. We consider an unaligned binding site in D. melanogaster to be 'preserved' if it
can be matched to a corresponding site in the D. pseudoobscura pCRM (allowing each D. pseudoobscura site to match
only one D. melanogaster site). If we consider both aligned
and preserved sites to be conserved, then roughly 80% of the
sites in positive pCRMs are conserved compared with 40% in
negative pCRMs.
Aligned plus preserved (conserved) site density (Figure 4d)
almost perfectly separates positive from negative pCRMs.
Only one of the positive pCRMs (PCE8012) has a conserved
site density below 14 sites/kb, while only one of the negative
pCRMs (PCE8021) has a conserved site density above 14
sites/kb.
reports
Sixty-one percent of the predicted binding sites in positive
pCRMs are aligned, while only 30% of the sites in negative
pCRMs are aligned. Across the genome, 22.3% of predicted
binding sites are aligned meaning that there is a roughly fourfold increase over background in the probability that a binding site in a positive pCRM is conserved in place compared to
a binding site in a negative pCRM. Sixty-one percent is almost
certainly an underestimate of the fraction of pCRM sites that
are functionally conserved. The D. melanogaster-D. pseudoobscura alignments were not always unambiguous (using
simulations we have assessed the role of alignment algorithms in identifying conserved transcription factor binding
sites, see [44]), and some orthologous binding sites may not
have been properly aligned. More important, studies of the
evolution of various Drosophila enhancers suggest that the
positions of binding sites within an enhancer are somewhat
plastic, and the functional conservation of a binding site does
not necessarily require positional conservation [25,26].
Berman et al. R61.9
reviews
We used the alignments described above to examine the conservation of individual predicted binding sites in all of the
pCRMs (Table 2). We refer to a predicted D. melanogaster
binding site that overlaps a predicted D. pseudoobscura binding site for the same factor in an alignment as an 'aligned' site.
We require overlap and not perfect alignment to compensate
for alignment ambiguity; the overwhelming majority (85%) of
aligned sites are perfectly aligned. Although there is only a
subtle difference in the binding-site density in the positive
and negative pCRMs in D. melanogaster (22.7 sites/kb compared to 22.2), the density of aligned binding sites in positive
pCRMs (13.8 sites/kb) is nearly twice that in negative pCRMs
(6.8 sites/kb). This is a highly significant difference (p <
0.001 by KS test) and aligned site density better discriminates
positive and negative pCRMs than sequence conservation
(compare Figure 4c and 4b).
Volume 5, Issue 9, Article R61
comment
/>
R61.10 Genome Biology 2004,
Volume 5, Issue 9, Article R61
Berman et al.
/>
(a)
46C
0 kb
10 kb
Adam
CG12134
eve3/7
20 kb
eve2
eve
PCE8100 *
eve4/6
25 kb
eve1 eve5
100%
0%
Percent identity
Insertion/deletions
D. melanogaster
binding sites
18
0
D. pseudoobscura
binding sites
18
0
Aligned
binding
sites
12
0
(b)
24A
0 kb
10 kb
odd
20 kb
28 kb
CE8010
100%
0%
Percent identity
Insertion/deletions
D. melanogaster
binding sites
18
0
D. pseudoobscura
binding sites
18
0
Aligned
binding
sites
12
0
(c)
47A
0 kb
10 kb
20 kb
CE8015
25 kb
psq
100%
0%
Percent identity
Insertion/deletions
D. melanogaster
binding sites
18
0
D. pseudoobscura
binding sites
18
0
Aligned
binding
sites
12
0
Insertion in D. melanogaster
Deletion in D. melanogaster
Figure 3 (see legend on following page)
Genome Biology 2004, 5:R61
BCD
CAD
HB
KR
KNI
/>
Genome Biology 2004,
Volume 5, Issue 9, Article R61
Berman et al. R61.11
It is possible that some of these negative pCRMs may be functional enhancers that respond to the factors used in our
screen, perhaps requiring a different promoter or other flanking sequences not used in the transgene. While further experiments could address this possibility, we felt these were a low
priority, as few of the D. pseudoobscura orthologs of these
negative pCRMs have binding-site clusters, and few are near
genes with appropriate expression patterns. Thus it is
unlikely that many function in their endogenous locations in
vivo.
Genome Biology 2004, 5:R61
information
It is intriguing that three of the clusters we tested direct
expression patterns that bear no obvious relationship to the
expression of a neighboring gene despite our extensive efforts
to identify such genes. We cannot yet exclude the possibility
that these pCRMs have an in vivo function related to their
observed expression patterns. However, the poor conservation of these elements in D. pseudoobscura suggest that they
do not have a regulatory function, and raises the possibility
that some 'random' clusters of binding sites (that occur by
chance or perhaps through selection on some functionally
unrelated sequence feature) have the necessary
interactions
Both the general activity and, more important, the specific
regulatory output of a CRM are a complex, and still poorly
understood, function of the specific architecture of its sites.
The emerging picture of the ordered multiprotein complexes
that mediate enhancer activity suggests constraints on
enhancer composition and architecture [1,2,47] whose elucidation will form a critical part of the future dissection of the
function of cis-regulatory sequences.
refereed research
We performed a large and comprehensive evaluation of the
efficacy of computational methods for the identification of
functional cis-regulatory modules in Drosophila. Analysis of
the in vivo activity of 36 high-density clusters of predicted
BCD, HB, KR, KNI and CAD binding sites identified in our
previous study [11] offers compelling support for the use of
transcription factor binding-site clustering as a method to
identify regulatory sequences, as at least 15 of these
sequences function as early developmental enhancers in vivo.
An evolutionary analysis of these sequences - based on comparisons of the D. melanogaster and D. pseudoobscura
genomes - shows that sequence conservation alone can not
reliably discriminate cluster-containing regions that function
in vivo from those that do not. However, a new method that
combines binding-site clustering and comparative sequence
analysis to search for binding-site clusters that are present in
multiple species does reliably discriminate active and inactive
The success of relatively simple binding-site clustering methods here and in other work is remarkable given the crudeness
of these methods. As our negative predictions demonstrate,
the mere presence of a cluster of binding sites is not sufficient
to make an active embryonically expressed CRM. Although
these 17 sequences have binding-site densities and compositions indistinguishable from their functional cousins, they do
not function as enhancers in a simple transgene assay.
deposited research
Discussion
Binding-site clustering
reports
To focus our search for new enhancers on genes likely to be
regulated by BCD, HB, KR, KNI and/or CAD, we searched
FlyBase [46] and a database of Drosophila embryonic expression patterns [21] and identified 278 genes with anterior-posterior patterns in the blastoderm (AP genes; Figure 6 and see
also Additional data files 2 and 9). Thirty-one of the 75 highest-scoring new predictions are adjacent to or within 20 kb of
one or more of these genes, including 11 pCRMs that do not
overlap previously described enhancers. The 75 highest-scoring predictions within 20 kb of an AP gene but not in Table 3,
are shown in Table 4. In Tables 3 and 4 together, there are 106
high-scoring conserved binding-site clusters near AP genes,
90 of which do not overlap known enhancers.
clusters. Using this method, we make several hundred predictions of new CRMs, a large number of which are located near
likely target genes.
reviews
simple scoring scheme that measures both the density and
the total number of sites conserved (we evaluated several different scoring schemes, and selected one that optimally identified regions near genes with blastoderm expression
patterns; see Materials and methods). The 75 highest-scoring
pCRMs within 20 kb of an annotated transcript are shown in
Table 3. Thirteen of the 15 positive pCRMs described above
are in the top 75 (ftz stripe 1/5 is number 107 and the pdm2
neurogenic enhancer is number 418) as are five other known
enhancers. One of our negative pCRMs, CE8021, is ranked
number 12.
comment
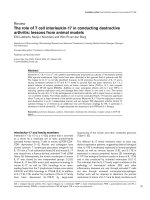
Figure 3 (see previous page)
Binding-site conservation, but not sequence conservation, correlates with pCRM activity
Binding-site conservation, but not sequence conservation, correlates with pCRM activity. Three 25-kb regions were chosen to illustrate patterns of
sequence conservation and binding-site conservation. (a) even-skipped (eve) contains five previously known segmentation enhancers (labeled eve3/7, eve2,
eve4/6, eve1, and eve5); (b) odd-skipped (odd) contains a single functional (positive) pCRM (CE8010); and (c) pipsqueak (psq) contains a non-functional
(negative) pCRM (CE8015). Annotated genes are shown in blue, and the direction of transcription is indicated by the arrow. Gray ovals indicate
experimentally tested fragments, and shaded gray boxes show the extent of pCRMs as defined by CIS-ANALYST (minimum of 13 sites within a 700 bp
window). The green graphs show average percent identity (in 100-bp windows). Below the percent identity plots are shown insertions (gray boxes) and
deletions (orange boxes) of 80 or more bp in the D. melanogaster sequence relative to their D. pseudoobscura ortholog. The location of binding sites in D.
melanogaster, binding sites in D. pseudoobscura and aligned binding sites along with the average density of sites (700-bp windows) are shown in the bottom
three panels for each region. * in (a) indicates a new prediction (PCE8100).
R61.12 Genome Biology 2004,
Volume 5, Issue 9, Article R61
Berman et al.
/>
True CRMs
Non-functional pCRMs
Ambiguous expression pCRMs
(a)
All
non-coding
100%
80%
60%
40%
20%
0%
Site density
(D. melanogaster)
pCRMs
pCRM regions
0
(b)
All
non-coding
5
10
15
20
Binding sites per kb
25
30
100%
80%
60%
40%
20%
0%
Percent identity
pCRMs
pCRM regions
0%
(c)
All
non-coding
20%
40%
60%
80%
Percent conservation
100%
100%
80%
60%
40%
20%
0%
Aligned
site density
pCRMs
pCRM regions
0
(d)
All
non-coding
5
10
15
20
Binding sites per kb
25
30
100%
80%
60%
40%
20%
0%
Aligned and
preserved
site density
pCRMs
pCRM regions
0
5
10
15
20
Binding sites per kb
25
30
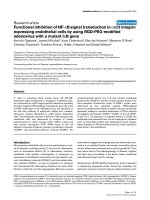
Figure 4
Conservation of clustering distinguishes positive and negative pCRMs
Conservation of clustering distinguishes positive and negative pCRMs. Each panel compares positive, negative and ambiguous pCRMs and random 1,000-bp
non-coding regions based on (a) binding site density in D. melanogaster, (b) percent identity, (c) density of aligned sites, and (d) density of aligned plus
preserved sites. The top portion of each panel contains a histogram of the values for randomly chosen 1,000-bp regions of the D. melanogaster genome.
The blue line plots the cumulative distribution. The colored asterisks show the average values for each class of pCRM. The unshaded panel below the
histogram shows the values for each pCRM (each dot represents one pCRM, with positives in blue, negatives in red, ambiguous in green). The shaded
panel at the bottom shows the average value for 1,000-bp non-coding sequences within 20 kb of each pCRM.
characteristics to be active enhancers in the proper genomic
environment (that is, near a promoter and not silenced by
trans-acting chromatin mechanisms). That any such
sequences exist suggests that the compositional and architectural constraints on binding sites in enhancers may be fairly
weak.
Genome Biology 2004, 5:R61
/>
Genome Biology 2004,
(a)
25
True
positive
pcrms
15
10
5
14
(b)
10
False
positive
pcrms
8
6
4
2
Novel
pcrms
D. melanogaster alone
Aligned site constraint
It has been suggested that the ftz enhancer is an evolutionary
relic of the homeotic role played by ftz in primitive insects
[51], a view supported by the apparently normal expression
and activity of ftz when this element is missing. However,
given our observation that non-functional binding sites clusters are not conserved, even over the relatively short evolutionary distance separating D. melanogaster and D.
pseudoobscura, it seems unlikely that this element is purely
vestigial. In fact, Yu and Pick [52] examined the expression
pattern of the endogenous ftz gene and show that stripes 1
and 5 appear before other ftz stripes and they postulate the
existence of stripe-specific regulatory elements that may exist
outside of the characterized zebra and upstream elements
such as the one identified and characterized in this study. The
conservation of binding sites in both the ftz and odd enhancers suggest that they play an important role in development,
and further call into question the distinction between primary
and secondary pair-rule genes.
information
Genome Biology 2004, 5:R61
interactions
Two of the new enhancers (CE8011 and CE8012) are adjacent
to and apparently regulate two linked genes with very similar
patterns of embryonic expression. Both nub (also known as
pdm1) and pdm2 are expressed in the anterior and posterior
midgut primordium and in neuroblasts. CE8011, found
immediately upstream of nub, regulates its early expression,
and not its later neuroblast expression. In contrast, CE8012,
found in an intron of pdm2 regulates its expression only in
neuroblasts and not earlier. While we did not detect a neuroblast enhancer for nub or a blastoderm enhancer for pdm2 in
our single-species binding-site cluster search, a number of
interesting pdm2 regions were discovered in our eCIS-ANALYST search (two are listed in Table 4).
refereed research
Figure 5 of CRM searches based on binding-site clustering
selectivityof evolutionary information greatly increases the specificity and
Inclusion
Inclusion of evolutionary information greatly increases the specificity and
selectivity of CRM searches based on binding-site clustering. The effects of
integrating comparative data into searches for binding site clusters were
assessed by counting the number of (a) true positive, (b) negative and (c)
novel CRMs recovered at the different site density cutoffs plotted on the
x-axis. The positives used here include the 15 positive pCRMs from Table
2 and 10 additional positive CRMs from the literature (see text), all of
which have identifiably orthologous sequence in D. pseudoobscura, while
the negatives included only the 14 non-functional pCRMs for which
orthologous sequence in D. pseudoobscura could be found. The solid line in
each panel shows the results without the use of D. pseudoobscura; the
dashed line shows the results with D. pseudoobscura. Searches displayed
were performed using the aligned sites constraint (see Materials and
methods). Comparable results were obtained for the aligned + preserved
sites constraint. The number of false positives is not strictly monotonically
decreasing with an increasing binding site cutoff. This stems from the
cluster merging behavior of CIS-ANALYST - sometimes a decrease in the
minimum number of sites leads CIS-ANALYST to tack on a lower-density
cluster that is adjacent to a higher-density one, resulting in a single cluster
with more sites but lower site density. This can actually increase the
number of conserved sites necessary to reach the conservation threshold
(see Materials and methods).
We identified double-stripe enhancers for ftz and odd. ftz and
odd are generally classified as 'secondary' pair-rule genes
whose expression is governed by other pair-rule genes rather
than by the maternal and gap transcription factors that govern the so-called 'primary' pair-rule genes (eve, h and runt)
([49]; also reviewed in [50]). However, the ftz and odd
enhancers described here were identified on the basis of binding sites for maternal and gap transcription factors, and
function like the enhancers of primary pair-rule genes in
directing expression in specific stripes.
deposited research
11 12 13 14 15 16 17 18 19 20
New enhancers
reports
2,000
1,750
1,500
1,250
1,000
750
500
250
(c)
Whatever the nature of these constraints, it is clear that binding-site density is not the sole defining characteristic of functional enhancers. However, it is a surprisingly effective
distinguishing one, and the usefulness of this and related
methods [48] suggests that the broader application of such
methods to different collections of transcription factors will
be extremely valuable in annotating the regulatory content of
animal genomes.
reviews
12
Berman et al. R61.13
comment
20
Volume 5, Issue 9, Article R61
R61.14 Genome Biology 2004,
Volume 5, Issue 9, Article R61
Berman et al.
/>
Table 3
New pCRMs from genome-wide eCIS-ANALYST (75 highest scoring predictions)
CRM
Known element
overlap
Arm
pCRM
start
pCRM
end
pCRM
length
5' gene
pCRM
relative position
3' gene
pCRM
relative position
Conserved
sites
Conserved
site density
A
A
A+P
z score
Additional
gap/pair-rule gene
within 20 kb
pCRM
relative position
Adam
+5901
Adam
+15005
nos
+16485
Adam
+8862
CG14889
-13735
Adam
+12582
Adam
+16967
A+P
1
PCE8050
h stripes 3/4,6,7 [73]
3L
8,622,879
8,626,839
3,961
CG6486
+14646
h
-7829
36
62
9
16
20.1
2
PCE8051
kni upstream [74]
3L
20,614,714
20,617,020
2,307
kni
-813
CG13253
+20716
25
31
11
13
13.2
3
PCE8052
nub blastoderm
2L
12,604,311
12,606,913
2,603
CG15488
+1653
nub
-304
20
33
8
13
11.6
4
PCE8053
eve stripes 3/7 [75]
2R
5,035,493
5,037,290
1,798
CG12134
+3712
eve
-2433
21
24
12
13
11.5
5
PCE8054
hairy stripes 1,5 [73]
3L
8,628,846
8,631,011
2,166
CG6486
+20613
h
-3657
17
29
8
13
10.5
6
PCE8055
runt stripe 3 [76]
10.3
7
PCE8056
8
PCE8057
X
20,356,848
20,360,054
3,207
CG1338
-9192
run
-6801
17
34
5
11
X
20,323,964
20,326,397
2,434
CG11692
-12536
Cyp6v1
-4186
16
28
7
12
9.6
hb HZ1.4 [77]
3R
4,526,225
4,527,991
1,767
hb
-2670
CG8112
+1273
17
21
10
12
9.5
9
PCE8059
eve stripes 4/6 [78]
2R
5,044,597
5,046,030
1,434
eve
+4874
TER94
-3763
15
18
10
13
9.0
10
PCE8060
gt posterior [11]
X
2,186,709
2,189,069
2,361
gt
-974
tko
+11679
18
21
8
9
8.9
11
PCE8061
X
3,169,806
3,172,348
2,543
CG12535
-17954
CG14269
+21857
13
29
5
11
8.8
12
PCE8063
CE8021
3L
18,339,914
18,341,941
2,028
grim
-86621
rpr
+5341
16
20
8
10
8.5
8.4
13
PCE8064
3R
6,255,663
6,256,945
1,283
CG6345
-13879
Cyp12e1
-3594
13
17
10
13
14
PCE8065
3R
4,026,032
4,027,816
1,785
grn
-18853
CG7800
-15898
15
19
8
11
8.4
15
PCE8066
X
20,348,460
20,352,624
4,165
CG1338
-804
run
-14231
16
28
4
7
8.3
16
PCE8067
3R
2,682,314
2,684,591
2,278
Scr
-7972
ftz
-5455
15
22
7
10
8.3
17
PCE8068
X
18,701,007
18,702,700
1,694
CG32541
+39691
CG32541
+39691
12
22
7
13
8.2
18
PCE8069
2R
17,274,311
17,276,017
1,707
CG3380
-2521
dve
-11496
14
19
8
11
8.2
19
PCE8070
2L
7,616,050
7,618,366
2,317
CG6739
+15430
CG13792
+19862
14
23
6
10
8.1
20
PCE8071
3R
14,999,463
15,001,552
2,090
sqz
+9504
CG14282
-1186
12
24
6
11
8.0
21
PCE8072
X
5,674,422
5,676,386
1,965
CG3726
+16870
CG12728
-6597
11
24
6
12
7.8
22
PCE8073
2R
14,903,099
14,903,925
827
Toll-7
+12482
Obp56i
-27903
11
11
13
13
7.8
23
PCE8074
3R
23,192,304
23,192,750
447
CG13980
+8073
side
+40862
7
8
16
18
7.7
24
PCE8075
3R
10,762,920
10,764,750
1,831
CG3837
+18501
CG14861
-75759
13
19
7
10
7.6
25
PCE8076
2R
5,038,454
5,039,041
588
CG12134
+6673
eve
-682
8
10
14
17
7.6
26
PCE8077
2L
13,541,662
13,542,651
990
kuz
+9371
kuz
+9371
11
13
11
13
7.6
27
PCE8078
2L
14,424,056
14,425,158
1,103
BG:DS06238.4
-16773
BG:DS08340.1
+7810
12
13
11
12
7.6
28
PCE8080
2L
3,601,045
3,602,748
1,704
odd
-1728
Dot
-9112
12
19
7
11
7.5
29
PCE8081
3L
17,412,324
17,413,414
1,091
CG18265
+24035
CG7603
-1413
11
14
10
13
7.5
ftz upstream [23]
sqz neurogenic
eve stripe 2 [75]
odd stripes 3/6
30
PCE8083
3L
14,121,556
14,123,127
1,572
Sox21b
-41352
D
+4373
12
17
8
11
7.3
31
PCE8084
2L
4,098,489
4,099,006
518
ed
+74542
ed
+74542
7
9
14
17
7.3
32
PCE8085
2R
12,253,766
12,255,302
1,537
CG10953
-23540
CG10950
-3625
13
15
8
10
7.2
33
PCE8086
3L
20,612,647
20,614,073
1,427
kni
+1254
CG13253
+23663
11
17
8
12
7.2
34
PCE8087
2R
3,391,037
3,391,561
525
CG30358
+10444
CG14755
-16724
7
9
13
17
7.2
35
PCE8088
3L
16,418,107
16,418,469
363
CG33158
+49435
argos
+14111
6
6
17
17
7.2
36
PCE8089
3R
12,368,159
12,368,687
529
CG11769
+28970
CG31448
-670
7
9
13
17
7.2
37
PCE8091
3L
11,213,064
11,213,664
601
scylla
+3224
CG32083
+24695
8
9
13
15
7.1
38
PCE8092
2L
1,233,357
1,235,228
1,872
CG5156
+3715
CG5397
-6475
9
23
5
12
7.1
39
PCE8093
3L
15,688,222
15,691,204
2,983
comm
-10920
CG13445
-67172
13
22
4
7
7.0
40
PCE8094
2R
10,492,861
10,493,546
686
CG30472
-5321
CG12959
-26488
9
9
13
13
7.0
41
PCE8095
3R
23,894,562
23,895,459
898
CG12870
+31901
CG12870
+31901
10
11
11
12
7.0
6.9
42
PCE8096
3L
6,762,543
6,765,157
2,615
vvl
+12855
Prat2
+108336
13
20
5
8
43
PCE8097
3R
10,238,130
10,238,652
523
CG14846
-1983
CG14847
+4557
7
8
13
15
6.8
44
PCE8099
2L
18,305,051
18,306,251
1,201
Fas3
+6868
Fas3
+6868
10
14
8
12
6.7
45
PCE8100
eve early APR [79]
2R
5,042,174
5,042,884
711
eve
+2451
TER94
-6909
8
10
11
14
6.7
46
PCE8102
tll posterior [80]
3R
26,663,942
26,665,204
1,263
CG15544
+21005
tll
-2251
11
13
9
10
6.6
47
PCE8104
ems neurogenic [81]
3R
9,723,602
9,724,936
1,335
E5
-23682
ems
-2663
12
12
9
9
6.6
48
PCE8105
3R
17,817,909
17,818,791
883
Eip93F
+25598
Eip93F
+25598
9
11
10
12
6.6
49
PCE8106
3L
10,499,018
10,501,551
2,534
CG32062
+25485
CG32062
+25485
11
21
4
8
6.6
50
PCE8107
3L
4,612,891
4,614,005
1,115
CG13716
-161
CG13715
+1681
11
11
10
10
6.6
51
PCE8108
2L
14,403,771
14,404,937
1,167
CG15284
-4301
BG:DS06238.4
+2346
10
13
9
11
6.5
6.5
52
PCE8109
3R
7,941,601
7,942,426
826
CG31361
+17775
CG4702
+11512
9
10
11
12
53
PCE8110
2L
8,804,166
8,805,336
1,171
CG9468
-30684
SoxN
-12519
10
13
9
11
6.5
54
PCE8111
3L
8,612,337
8,613,016
680
CG6486
+4104
h
-21652
8
9
12
13
6.5
55
PCE8112
3L
4,377,989
4,379,208
1,220
CG7447
+13842
Syx17
-3984
11
12
9
10
6.5
56
PCE8113
2L
14,113,291
14,113,893
603
CG15292
-3974
CG31768
-6693
7
9
12
15
6.5
57
PCE8114
58
PCE8115
59
PCE8116
3L
eve stripe 1 [79]
3,997,600
3,998,923
1,324
CG14985
+13500
fd64A
-799
11
13
8
10
6.5
2R
5,046,559
5,047,297
739
eve
+6836
TER94
-2496
8
10
11
14
6.5
2R
16,921,501
16,922,240
740
CG13493
-11091
PpN58A
+4194
8
10
11
14
6.5
60
PCE8118
3R
14,822,848
14,823,484
637
gukh
+13085
gukh
+13085
8
8
13
13
6.4
61
PCE8119
3R
12,671,525
12,672,987
1,463
abd-A
-15737
CG10349
-32477
11
14
8
10
6.4
6.4
62
PCE8120
3L
10,492,688
10,495,539
2,852
CG32062
+19155
CG32062
+19155
10
23
4
8
63
PCE8121
2L
16,841,696
16,842,392
697
CG6012
-2193
CG31781
-5178
8
9
11
13
6.4
64
PCE8122
3L
6,885,832
6,887,436
1,605
Prat2
-11445
CG14820
-5022
11
15
7
9
6.4
Genome Biology 2004, 5:R61
/>
Genome Biology 2004,
Volume 5, Issue 9, Article R61
Berman et al. R61.15
Table 3 (Continued)
New pCRMs from genome-wide eCIS-ANALYST (75 highest scoring predictions)
PCE8123
2L
15,162,778
15,164,524
1,747
BG:DS03192.2
-6373
BG:DS07295.1
+59479
11
16
6
9
66
PCE8124
2R
6,888,483
6,889,700
1,218
CG12443
+13963
CG13192
-428
10
13
8
11
6.4
6.4
67
PCE8125
2L
20,466,022
20,467,708
1,687
CG2493
-32831
CG15476
+4184
10
17
6
10
6.4
comment
65
6.3
68
PCE8126
3L
2,779,198
2,779,658
461
CG2083
+1101
CG2083
+1101
6
7
13
15
69
PCE8127
X
4,630,473
4,632,106
1,634
CG12681
+14179
CG15470
-3196
9
18
6
11
6.3
70
PCE8128
3R
27,713,381
27,715,087
1,707
heph
+35171
heph
+35171
10
17
6
10
6.3
6.3
PCE8130
3R
12,383,752
12,385,269
1,518
CG14889
+1858
CG14889
+1858
11
14
7
9
PCE8131
3R
21,329,716
21,331,058
1,343
CG5111
+8355
msi
-2351
8
17
6
13
6.3
73
PCE8132
3R
16,242,660
16,243,128
469
CG10881
+8657
CG17208
+20535
6
7
13
15
6.3
74
PCE8133
3R
24,120,296
24,122,240
1,945
CG12516
-668
larp
+19112
12
15
6
8
6.2
75
PCE8134
3L
8,733,754
8,734,394
641
CG32030
+8601
CG32030
+8601
7
9
11
14
6.2
Seventy-five top pCRMs, ranked by a z-score based on the number and density of conserved binding sites (see text for details). Site density columns
list the number of conserved sites per kilobase (relative to the D. melanogaster sequence). The number and density of conserved sites are shown
under two conditions - aligned sites only (A), or aligned + preserved sites (A+P) (see Materials and methods). The 5' and 3' gene columns
correspond to the closest transcription (or annotation) start 5' and 3' of the pCRM. If a pCRM is within an intron, only the intron-containing gene is
reported and its name is italicized. The names of genes with early anterior-posterior patterns are in bold. Early anterior-posterior genes that start
within 20 kb of the pCRM (but are not the immediate annotation in the 5' or 3' direction) are also listed. Named enhancers without a reference are
from this study.
refereed research
interactions
Comparative genomics in CRM predictions
The extent of non-coding sequence conservation between D.
melanogaster and D. pseudoobscura was surprising. A major
motivation for the National Human Genome Research
Institute (NHGRI) support of the D. pseudoobscura genome
sequencing was the identification of conserved regions that
would guide the annotation of functional sequences in D. melanogaster. D. pseudoobscura was chosen as the second
member of this genus to be sequenced in part because it was
Genome Biology 2004, 5:R61
information
Comprehensive methods for inferring regulatory interactions
where they are not already known will be critical for the widespread application of binding-site clustering methods. In
addition to allowing less stringent focused screens, they will
also help overcome the combinatorial challenge raised by the
existence of up to 700 sequence-specific transcription factors
in Drosophila. Even assuming the availability of binding data
for all of these factors, it will not be possible to search for
targets of all combinations of these factors - there are too
many possibilities. This is not just a practical problem - it is a
fundamental statistical problem. While the false-positive rate
for a single combination of factors is low, if we tried even all
pairs of factors, it is likely that every region of the genome
would have a high binding-site density for some collection of
A greater current limitation in the widespread application of
binding-site clustering methods is the absence of high-quality
binding data for most Drosophila transcription factors. The
initial success of methods that use in vitro binding data to
predict regulatory targets has prompted the characterization
of binding specificities for many additional factors. However,
the heterogeneity of approaches used makes it difficult to
combine these data in an optimal manner. In addition, most
of the available transcription factor binding data consists of a
few to several dozen high-affinity sites. While these data are
very useful, they do not fully represent the binding capacity of
a factor and thus do not permit the identification of intermediate or low-affinity sites which are known to be important in
some regulatory systems [54]. We have begun to apply highthroughput methods [55] to characterize a broad spectrum of
target sites for all of the transcription factors involved in early
embryogenesis. The results will ultimately allow us to estimate the binding affinity of each factor for any target
sequence.
deposited research
The accuracy of our enhancer predictions would almost certainly be improved if we restricted our search space to
genomic regions adjacent to genes known to be regulated by
particular transcription factors. Drosophila enhancers have
been known to work at distances of up to 100 kb, but most are
within 10 kb of their target gene. All of our true-positive predictions were within 10 kb of the known or predicted transcription start site of a gene with a pattern that was known, or
plausibly could have been, regulated by the five regulators
used in our screen (anterior-posterior patterns in the blastoderm; expression in neuroblasts). In contrast, only one of the
negative predictions was this close to such a gene - an additional four were within 50 kb. As the comprehensive atlas of
embryonic expression patterns is completed [21,53] it will be
possible to restrict searches for CRMs to regions of the
genome near genes with expression patterns that could arise
from the regulators being considered, or to prioritize the
results of whole-genome screens on the basis of whether they
are near plausible targets.
factors. Sequence data from other Drosophila species may
allow us to determine which of these collections are conserved and therefore likely to be functional, but it is unlikely
that all aspects of regulation can be inferred from comparative analyses and therefore it is essential that we continue to
dissect the regulatory network by traditional means.
reports
Regulatory models and improving the accuracy of CRM
prediction
reviews
71
72
R61.16 Genome Biology 2004,
Volume 5, Issue 9, Article R61
Berman et al.
hb
/>
nub
run
gt
PCE8052
PCE8055, PCE8066 PCE8057
PCE8060, PCE8235 PCE8063, PCE8275, PCE8080
PCE8444
D
argos
CG4702
SoxN
gukh
PCE8083
PCE8088, PCE8270 PCE8093
PCE8109
PCE8110
PCE8118
CG14889
Antp
Btk29A
Glu-RI
Kr
PCE8130
PCE8169, PCE8332, PCE8183
PCE8398
PCE8187, PCE8483 PCE8190
PCE8193, PCE8297,
PCE8394
bowl
exex
CG31721
bun
pdm2
CrebA
PCE8198
PCE8210
PCE8218
PCE8226
PCE8237, PCE8401, PCE8258
PCE8512
CG5249
slp2
CG5888
Ptx1
comm
wg
grim
odd
CG32306
htl
PCE8307, PCE8331 PCE8309, PCE8314 PCE8328, PCE8515 PCE8358
PCE8370
PCE8415
ovo
tap
tkv
prd
NetA
PCE8439
PCE8464
PCE8495, PCE8501 PCE8519
PCE8520
PCE8528
Doc2
fkh
PCE8533
Figure 6
Expression patterns of genes adjacent to high-scoring pCRMs
Expression patterns of genes adjacent to high-scoring pCRMs. Wild-type embryonic expression patterns of 36 genes adjacent to 53 pCRMs identified by
eCIS-ANALYST (see Tables 3 and 4). The images were obtained from the BDGP Embryonic Expression Pattern Database [33], and include all pCRMs
from Tables 3 and 4 for which an adjacent gene had an early segmentation pattern.
Genome Biology 2004, 5:R61
/>
Genome Biology 2004,
Volume 5, Issue 9, Article R61
Berman et al. R61.17
Table 4
Additional new pCRMs within 20 kb of genes with anterior-posterior patterns
Known element
overlap
Arm
pCRM
start
pCRM
end
pCRM
length
5' gene
pCRM
relative position
3' gene
pCRM
relative position
Conserved
sites
Conserved
site density
A
A+P
A
z score
Additional
Gap/pair-rule
gene within 20 kb
pCRM
relative position
en
comment
CRM
+19407
A+P
PCE8137
3R
12,053,627
12,055,472
1,846
tara
+2239
tara
+2239
10
17
5
9
2
PCE8139
2R
6,573,169
6,574,383
1,215
inv
+32752
CG30034
+12378
10
12
8
10
6.1
6.1
3
PCE8140
2R
15,167,055
15,168,270
1,216
CG16898
-98356
18w
-6952
10
12
8
10
6.1
4
PCE8144
3L
3,503,831
3,504,156
326
Eip63E
+7518
Eip63E
+7518
4
6
12
18
6.1
ImpE2
-10525
5
PCE8145
3R
4,536,237
4,536,936
700
CG8112
+1795
CG8112
+1795
8
8
11
11
6.0
hb
-12682
6
PCE8150
3R
6,379,567
6,380,474
908
hth
+50936
hth
+50936
8
11
9
12
6.0
ftz
-19388
nub
-6071
cenB1A
12397
7
PCE8165
X
8,390,109
8,392,075
1,967
oc
-513
CG12772
-23984
10
16
5
8
5.8
8
PCE8166
3R
12,570,467
12,571,123
657
Ubx
-10101
CG31275
+5951
7
8
11
12
reviews
1
5.7
9
PCE8167
Ubx S1 [82]
3R
12,589,099
12,589,755
657
CG31275
(Ubx adjacent)
-11970
Glut3
-24295
7
8
11
12
5.7
10
PCE8169
ftz stripes 1/5 [51]
3R
2,693,336
2,694,915
1,580
ftz
+3290
Antp
+63624
11
12
7
8
5.7
11
PCE8170
3R
2,670,658
2,672,242
1,585
Scr
+2100
Scr
+2100
9
15
6
9
5.7
12
PCE8177
2R
5,634,520
5,635,604
1,085
psq
+4661
psq
+4661
8
12
7
11
5.7
13
PCE8183
2L
7,305,525
7,305,940
416
wg
+4205
wg
+4205
5
6
12
14
5.6
14
PCE8187
2L
8,286,022
8,287,399
1,378
Btk29A
+5904
Btk29A
+5904
9
13
7
9
5.6
15
PCE8190
5.6
16
PCE8193
17
PCE8195
6,589,453
6,590,721
1,269
Glu-RI
+5891
Glu-RI
+5891
9
12
7
9
2R
20,268,656
20,269,940
1,285
CG9380
-36249
Kr
-244
7
15
5
12
5.5
3L
5,126,445
5,126,805
361
CG32423
+17297
CG32423
+17297
4
6
11
17
5.5
18
PCE8198
2L
3,767,311
3,769,396
2,086
bowl
+2110
bowl
+2110
9
17
4
8
5.5
19
PCE8210
3L
7,925,371
7,926,049
679
exex
+17651
RNaseX25
-4074
6
9
9
13
5.4
20
PCE8214
2L
12,601,146
12,602,225
1,080
ref2
-895
CG15488
-433
8
11
7
10
5.4
21
PCE8218
2L
10,545,226
10,547,197
1,972
CG31721
+7937
CG31721
+7937
10
14
5
7
reports
3L
Kr CD2 [83]
5.3
5.2
PCE8226
2L
12,541,433
12,542,145
713
bun
-11992
CG15489
-40512
6
9
8
13
PCE8235
X
2,190,216
2,191,697
1,482
gt
-4481
tko
+9051
9
12
6
8
5.2
24
PCE8237
2L
12,670,755
12,671,417
663
pdm2
+3280
pdm2
+3280
6
8
9
12
5.2
25
PCE8258
3L
15,491,385
15,492,925
1,541
CrebA
+7093
CrebA
+7093
7
15
5
10
5.1
26
PCE8270
3L
16,421,730
16,422,846
1,117
argos
+9734
argos
+9734
8
10
7
9
5.0
27
PCE8275
3L
18,329,419
18,330,261
843
grim
-76126
rpr
+17021
6
10
7
12
5.0
28
PCE8277
3R
6,448,750
6,449,993
1,244
hth
+8759
hth
+8759
6
14
5
11
5.0
29
PCE8297
2R
20,280,374
20,281,018
645
Kr
+10190
CG30429
-9080
6
7
9
11
4.9
30
PCE8306
3L
12,278,550
12,279,346
797
CG4328
-28041
CG32105
-7436
6
9
8
11
4.9
31
PCE8307
3L
5,580,997
5,581,649
653
CG12756
-13449
CG5249
-8641
6
7
9
11
4.9
32
PCE8309
2L
3,825,809
3,827,419
1,611
slp1
+7561
slp2
-1991
8
13
5
8
deposited research
22
23
4.9
PCE8314
2L
3,842,537
3,843,621
1,085
slp2
+13127
CG3964
-11628
6
12
6
11
4.8
PCE8328
2L
16,418,533
16,419,580
1,048
BG:DS02780.1
+8016
Idgf1
-3783
7
10
7
10
4.8
35
PCE8331
3L
5,582,709
5,583,340
632
CG12756
-15161
CG5249
-6950
5
8
8
13
4.8
36
PCE8332
3R
2,725,376
2,726,195
820
Antp
+32344
Antp
+32344
6
9
7
11
4.8
4.7
37
PCE8338
3R
3,987,824
3,989,532
1,709
grn
+17647
grn
+17647
8
13
5
8
38
PCE8348
3L
18,966,181
18,967,380
1,200
nkd
+26830
nkd
+26830
7
11
6
9
4.7
39
PCE8355
3R
6,421,647
6,422,583
937
hth
+8827
hth
+8827
6
10
6
11
refereed research
33
34
4.7
40
PCE8356
3L
22,244,275
22,244,894
620
Ten-m
+80890
CG32450
-2161
6
6
10
10
4.7
41
PCE8358
3R
26,740,914
26,742,495
1,582
Ptx1
+2496
Ptx1
+2496
8
12
5
8
4.7
4.6
PCE8361
3R
12,526,665
12,527,949
1,285
Ubx
+32417
Ubx
+32417
6
13
5
10
43
PCE8367
Ubx BRE [84]
2R
4,771,288
4,771,881
594
CG10459
+3018
dap
-1074
5
7
8
12
4.6
44
PCE8369
3L
14,540,753
14,541,382
630
HGTX
+7066
HGTX
+7066
6
6
10
10
4.6
45
PCE8370
3L
2,395,158
2,396,393
1,236
CG13800
+12412
CG32306
-13538
5
14
4
11
4.6
46
PCE8391
3L
5,254,002
5,254,895
894
CG32423
-16750
lama
+55892
6
9
7
10
4.5
47
PCE8394
2R
20,266,323
20,267,047
725
CG9380
-33916
Kr
-3137
6
7
8
10
4.5
48
PCE8398
Kr 730 [83]
3R
2,770,846
2,771,901
1,056
Antp
+12307
Antp
+12307
7
9
7
9
4.5
49
PCE8401
2L
12,660,502
12,661,614
1,113
CG15485
-2463
pdm2
+5861
6
11
5
10
4.5
50
PCE8408
X
8,379,690
8,381,014
1,325
oc
+8582
oc
+8582
5
14
4
11
interactions
42
4.4
4.4
PCE8415
3R
13,867,601
13,868,164
564
CG7794
+18158
htl
+6934
5
6
9
11
PCE8417
2L
587,804
588,638
835
Gsc
+7714
Gsc
+7714
6
8
7
10
4.4
53
PCE8418
3R
18,950,000
18,950,634
635
CG31457
-5638
hh
+7739
5
7
8
11
4.4
54
PCE8425
2R
18,693,096
18,694,318
1,223
retn
+16917
CG5411
-6825
7
10
6
8
4.4
55
PCE8439
X
4,770,587
4,771,859
1,273
CG12680
+32240
ovo
-17051
7
10
5
8
4.3
56
PCE8444
3L
18,330,763
18,332,045
1,283
grim
-77470
rpr
+15237
7
10
5
8
4.3
57
PCE8450
3L
5,141,131
5,141,793
663
CG32423
+2971
CG10677
-438
5
7
8
11
4.3
58
PCE8458
3L
19,101,833
19,102,666
834
fz2
+6194
fz2
+6194
5
9
6
11
4.2
59
PCE8464
3L
17,314,105
17,314,815
711
tap
+5577
Cad74A
+13577
6
6
8
8
4.2
60
PCE8483
2L
8,265,854
8,267,283
1,430
Btk29A
+2646
Btk29A
+2646
4
15
3
10
4.1
61
PCE8493
3R
6,403,852
6,405,604
1,753
hth
+25806
hth
+25806
7
12
4
7
4.1
62
PCE8494
3R
7,931,641
7,932,680
1,040
CG31361
+7815
CG31361
+7815
6
9
6
9
4.1
Genome Biology 2004, 5:R61
information
51
52
R61.18 Genome Biology 2004,
Volume 5, Issue 9, Article R61
Berman et al.
/>
Table 4 (Continued)
Additional new pCRMs within 20 kb of genes with anterior-posterior patterns
63
PCE8495
2L
5,214,677
5,215,845
1,169
CG6514
+3847
tkv
+14084
6
10
5
9
4.1
64
PCE8501
2L
5,247,719
5,248,767
1,049
tkv
+10898
Cyp4ac1
-7804
6
9
6
9
4.1
65
PCE8511
66
PCE8512
3R
6,469,170
6,470,599
1,430
hth
-4766
CG6465
+32311
7
10
5
7
4.0
2L
12,663,453
12,664,721
1,269
pdm2
+2754
pdm2
+2754
5
12
4
9
4.0
67
68
PCE8513
3L
14,550,945
14,551,746
802
HGTX
-2497
Cyp314a1
-16963
5
8
6
10
4.0
PCE8515
2L
16,390,610
16,392,235
1,626
BG:DS02780.1
+34314
BG:DS02780.1
+34314
7
11
4
7
4.0
pdm2 neurogenic
69
PCE8519
3L
8,975,309
8,975,873
565
Doc2
+2077
Doc2
+2077
5
5
9
9
4.0
70
PCE8520
2L
12,080,772
12,081,448
677
prd
-5445
CG5325
-1193
4
8
6
12
4.0
71
PCE8521
2L
7,252,370
7,253,008
639
CG31909
+2569
Wnt4
+16391
5
6
8
9
4.0
72
PCE8528
X
14,366,706
14,367,311
606
NetA
+17535
NetA
+17535
4
7
7
12
4.0
73
PCE8531
3R
6,363,866
6,364,968
1,103
CG31394
-8970
hth
+66442
6
9
5
8
PCE8533
3R
24,402,963
24,403,946
984
fkh
-2792
Noa36
+10421
6
8
6
8
PCE8536
3R
12,764,472
12,765,970
1,499
Abd-B
+4036
Abd-B
+4036
7
10
5
7
Ndae1
-19639
3.9
75
11402
4.0
74
Doc3
3.9
Seventy-five top pCRMs within 20 kb of a gene with early anterior-posterior expression, excluding those already listed in Table 3, are ranked by a zscore based on the number and density of conserved binding sites (see text for details). Site density columns list the number of conserved sites per
kilobase (relative to the D. melanogaster sequence). The number and density of conserved sites are shown under two conditions - aligned sites only
(A), or aligned + preserved sites (A+P) (see Materials and methods). The 5' and 3' gene columns correspond to the closest transcription (or
annotation) start 5' and 3' of the pCRM. If a pCRM is within an intron, only the intron-containing gene is reported and its name is italicized. The
names of genes with early anterior-posterior patterns are in bold. Early anterior-posterior genes that start within 20 kb of the pCRM (but are not
the immediate annotation in the 5' or 3' direction) are also listed. Named enhancers without a reference are from this study.
felt that it had separated from D. melanogaster sufficiently
long ago that non-functional sequences would exhibit substantial divergence. However, despite an evolutionary
separation that is greater than human and mouse (an average
synonymous substitution rate of 1.8-2.6 substitutions/site
[29] compared to 0.6 substitutions/site [30]), and despite
some variation in conservation in non-coding sequences, we
were not able to use standard measures of sequence conservation to differentiate active pCRMs from their flanking
sequence or from inactive pCRMs, reinforcing other recent
observations [32].
One reason for the limited efficacy of these methods is that
they do not recognize the specific patterns of conservation
characteristic of different classes of functional sequences. For
example, coding sequences can be easily recognized from the
characteristic triplet pattern in evolutionary rates where the
third (and often synonymous) position of codons tends to
evolve at a greater rate than the first two positions [56,57].
Similarly, RNAs that form conserved secondary structures
can be recognized by patterns of co-substitution ([58] and references cited within). The early developmental enhancers we
are studying here are made up of large collections of transcription factor-binding sites, and it is expected that both
individual functional binding sites and the overall composition of functional CRMs will be conserved [25,26]. Conservation of binding-site clustering is a specific evolutionary
signature of this class of functional regulatory sequences,
and, like the evolutionary signatures of protein-coding and
RNA genes, can be used to specifically identify these
sequences from comparative sequence data.
Contrast PCE8010 (the odd stripe enhancer) and PCE8015
(Figure 3). Both have the same overall amount of sequence
conservation, indicating that they are under some functional
constraint. However, 80% of the predicted binding sites in
PCE8001 are conserved, compared to 20% for PCE8015. The
conservation of binding sites (both number and location) in
PCE8001 makes it highly unlikely that the cluster was found
by chance in D. melanogaster, and suggests (correctly) that
this sequence is actively responding to the presence of these
binding sites. The poor conservation of binding sites in
PCE8015 (no greater than is found in random regions of
genome) suggests either that the BCD, HB, KR, KNI and CAD
sites in this region are not functional or that the region is
undergoing rapid functional diversification. Of course the
absence of binding site conservation does not suggest that the
sequence is non-functional, merely that these sequences are
unlikely to have the particular function we are studying here.
From the data shown in Figure 4, we expect the incorporation
of binding-site conservation into the CRM search process to
greatly reduce the number of false-positive predictions. We
anticipate that a significant number of the new predictions
from our genome-wide screen and screen targeted at genes
with early anterior-posterior patterns to be active CRMs, and
we have begun testing these predictions.
The pattern of binding-site conservation in positive pCRMs
sheds additional light on the processes that govern CRM evolution. We find that predicted binding sites in positive D. melanogaster pCRMs are roughly three times more likely to be
aligned to predicted sites in the D. pseudoobscura compared
to predicted binding sites in negative pCRMs, in the
sequences flanking pCRMs, or in random regions of the
genome. The demonstration that this strictest form of
binding-site conservation is strengthened in functional CRMs
contrasts with an earlier study that concluded that binding
Genome Biology 2004, 5:R61
Genome Biology 2004,
sites in functional CRMs had only a slightly elevated probability of falling in conserved sequence [32]. Their methodology
differed from ours in that they used randomly shuffled binding-site positions within functional CRMs as the background,
while we used actual predicted binding-site positions in randomly picked regions of the genome.
factors and an impending wealth of comparative sequence
data, we anticipate rapid progress on the identification and
functional characterization of regulatory sequences. We will
then be able to turn our attention to the next great challenge
- understanding the precise relationship between the binding-site composition and architecture of regulatory sequences
and the expression patterns they specify.
The collection of CRM sequences was previously described
[11]
Transgenics
DNA fragments identified as candidate CRMs were amplified
from either bacterial artifical chromosome (BAC) or y; cn bw
sp fly genomic DNA by PCR using two primers containing
unique sequence and synthetic AscI and NotI restriction sites
(Additional data file 5). The PCR product was digested with
AscI and NotI, and inserted in its native orientation into the
AscI-NotI site of a modified CaSpeR-AUG-bgal transformation vector [62] containing the eve basal promoter, starting at
-42 bp and continuing through codon 22 fused in-frame with
lacZ [63]. The P-element transformation vectors were
injected into w1118 embryos, as described previously [63,64].
Transgenic fly lines containing CRMs CE8005 (7A), CE8016
(55C) and CE8020 (70EF) were verified by generating
genomic DNA [65] from each line for PCR. PCR products
were amplified using primers designed from the CaSpeRAUG-bgal vector - forward primer 5' CGCTTGGAGCTTCGTCAC and reverse primer 5' GAGTAACAACCCGTCGGATTC
and 35 cycles (Gene Amp 9700, Perkin-Elmer). The resulting
PCR products were sequenced using standard conditions
with BigDye version 3.0 and electrophoresed on a 3730 capillary sequencer (ABI).
Whole-mount in situ hybridizations
interactions
Embryonic whole-mount in situ RNA hybridizations were
performed as previously described [21]. RNA probes were
generated using cDNA clones RE29225 (gt), RE14252 (odd),
RE34782 (nub), RE49429 (pdm2), and RE47384 (sqz). Exon
1 of the ftz gene was amplified from genomic DNA using forward primer 5' GCGTTGCGTGCACATC and reverse primer 5'
ATTCTTCAGCTTCTGCGTCTG. The PCR product was cloned
into the TA vector (Invitrogen) and used to generate ftz RNA
probe.
refereed research
Double-labeling
RNA probes, using cDNAs or genomic DNA as templates,
were labeled with fluorescein-12-UTP while lacZ RNA probes
were labeled with digoxigenin-11-UTP (Roche). Hybridizations were performed as described above with the following
modifications: (1) 2 µl of each probe were added to give a final
concentration of 1:50; (2) sequential alkaline phosphatase
staining was performed first with Sigma Fast red to detect
Genome Biology 2004, 5:R61
information
With methods like the one we have presented here, aided by
new and better binding data on Drosophila transcription
Collection of CRMs
deposited research
From a practical perspective, this requires adjusting how conservation is incorporated into searches for clusters of binding
sites that are likely to be CRMs. For relatively short evolutionary distances, searches for clusters of aligned sites will be less
sensitive to noise and will focus on functional binding sites.
For longer distances, where binding site turnover will likely
preclude searching for clusters of conserved sites, searches
for conserved binding site clusters should still work well. In
fact, this latter method can work - with some modification among species whose sequences can no longer be aligned.
Anopheles gambiae diverged from its common ancestor with
D. melanogaster roughly 220 million years ago, and there is
little or no detectable non-coding sequence similarity
between these two species. Nonetheless, we find clusters of
HB, KR and KNI binding sites in the vicinity of gap and pairrule genes and suggest that many of these are functional
orthologs of D. melanogaster CRMs. Despite strong selection
to maintain function, enough binding-site turnover has
occurred in these CRM during their 220 million years of independent evolution to eliminate detectable sequence similarity. But they remain functionally similar and we can detect
this functional similarity through its evolutionary signature.
Materials and methods
reports
The relative importance of binding-site architecture and
binding-site composition to maintaining the function of an
enhancer over evolutionary time remains unclear. Over
relatively short evolutionary distances (as between D.
melanogaster and D. pseudoobscura) most binding sites are
conserved and found in the same place. Over longer evolutionary distances, individual binding sites are often poorly
conserved even as the overall composition and function of a
CRM is conserved.
Berman et al. R61.19
reviews
In addition to this colinear conservation, we also observe that
there is an overall enrichment for binding sites in positive
pCRMs independent of the conservation of individual sites.
Specifically, the presence of a binding site for a factor in a positive D. melanogaster pCRM increases (relative to negative
pCRMs and random genomic fragments) the probability of
finding a site for the same factor in the orthologous region of
D. pseudoobscura, even if the site is not in the same (aligned)
position. Thus, in this set of positive pCRMs, there appears to
be selection to maintain binding site composition, but not
always the specific order and orientation of sites. This is consistent with models of enhancer plasticity that have been proposed and discussed elsewhere [25,59-61].
Volume 5, Issue 9, Article R61
comment
/>
R61.20 Genome Biology 2004,
Volume 5, Issue 9, Article R61
Berman et al.
endogenous transcripts, stopped by washing for 30 min in 0.1
M glycine-HCl pH 2.2, 0.1% Tween-20 at room temperature,
and then continued as described to detect lacZ expression.
Assembly
The input to the genome assembly was the set of wholegenome shotgun reads from the Baylor Genome Sequencing
Center retrieved from the National Center for Biotechnology
Information (NCBI) Trace Archive, consisting of 2,607,525
total sequences. After trimming the sequences to remove vector and low-quality regions, the average read length was 607
bp. Approximately 75% of the reads were from short insert
(approximately 2.5-3.0 kb) libraries, with another 25% from
longer (6-7 kb) libraries. Another 46,040 reads came from the
ends of 40-kb fosmids.
We ran the Celera Assembler several times, and found that by
adjusting one parameter in particular we could produce considerably better assemblies. In particular, the assembler has
an arrival rate statistic j, which measures the probability that
a contig is repetitive on the basis of its depth of coverage. The
default setting is very conservative: if a contig has more than
50% likelihood of being repetitive, it is marked as such and is
set aside during most of the assembly process. For large
highly repetitive mammalian genomes this setting may be
appropriate, but for D. pseudoobscura we found that setting
it to 90% or higher produced considerably better contigs,
while apparently causing few if any misassemblies.
/>
annotations from the Berkeley Drosophila Genome Project
[68]. Potentially orthologous D. pseudoobscura contigs/scaffolds were identified using WU-BLAST 2.0 [69] using default
parameters except for (-span1 -spsepqmax = 5000 -hspsepsmax = 5000 -gapsepmax = 5000 -gapsepsmax = 5000).
High-scoring pairs (HSPs) with E-values less than 1e-20 were
flagged as potential homologous regions. HSPs located more
than 5,000 bp from each other in the D. melanogaster
sequence were treated as separate hits. After examining dotplots of the hits, we noticed a large number of small, local
inversions that were found in both our assembly and the
assemblies released by the Baylor Human Genome Sequencing Center. We used BLASTZ [70]) to automatically identify
inversions, and when necessary inverted the corresponding
D. pseudoobscura sequence. Each D. pseudoobscura
sequence was aligned to the D. melanogaster corresponding
sequence using LAGAN 1.2 [43] with default settings. A total
of 31 genomic loci of approximately 50 kb were examined;
these regions contain 36 pCRMs (the eve and h loci contain
three pCRMs each, and PCE8003 and PCE8004 are within
20 kb of each other). Twenty-eight regions had aligned D.
pseudoobscura sequence that spanned all or most of the
region. For three regions (PCE8002, PCE8003/8004 and
PCE8009) we were not able to identify large regions of orthologous sequence; these were excluded from subsequent comparative analyses. Dot-plots of the alignments from all 30
regions are available at [42].
Scoring gross conservation of pCRMs
The overall assembly contained 10,089 scaffolds and 10,329
contigs, containing 165,864,212 bp. The estimated span of the
scaffolds, using the gap sizes estimated from clone insert
sizes, is 172,362,884. The largest scaffold was 3.05 million
base-pairs (Mbp) and the scaffold N50 size was 418,046. (The
N50 size is the size of the smallest scaffold such that the total
length of all scaffolds greater than this size is at least one half
the total genome size, where genome size here is 172 Mbp.)
There are 308 scaffolds larger than 100,000 bp, whose total
span is 129.5 Mbp. The N50 contig size, using 166 Mbp as the
genome size (not counting gaps), was 43,555. Another measure of assembly quality is the number of large contigs: if we
define 'large' as 10 kbp, then the assembly contains 3177 large
contigs whose total length is 131,067,828 bp. (For reference,
the assembly produced by the Baylor Human Genome
Sequencing Center contains 129.4 Mbp in all contigs,
including small ones, and the span of all scaffolds is 139.3
Mbp.) All of our contigs and scaffolds are freely available by
anonymous ftp at [66].
Alignment and conservation of pCRMs
The extent and pattern of conservation between D. melanogaster and D. pseudoobscura in regions containing
pCRMs were determined as follows. The D. melanogaster
genomic sequence of the region of interest (with known repetitive elements masked) was extracted from a BioPerl genome
database [67] containing Release 3.1 sequence and
The conservation of a specific genomic segment was scored as
the fraction of D. melanogaster bases aligned to the identical
base in aligned regions (percent identity).
Scoring binding-site conservation of pCRMs
We used two definitions of binding-site conservation. A binding site was considered 'aligned' if it overlaps a predicted D.
pseudoobscura binding site for the same factor in the LAGAN
alignment. Only overlap, and not strict alignment, was
required to compensate for small errors in the alignment. A
non-aligned binding site was considered 'preserved' if it could
be matched to a D. pseudoobscura site for the same factor
within the bounds of the pCRM, allowing each D. pseudoobscura site to be the match for only a single D. melanogaster
site. The number of aligned plus preserved sites for each factor in a region is thus equal to the minimum number of sites
for that factor in the two species.
Generating an orthology map for genome searches
To develop an orthology map for genome-wide searches, we
used NUCmer [71] to align the Release 3 D. melanogaster
genome (with annotated repetitive elements and transposable elements masked) and the D. pseudoobscura scaffolds
described above. NUCmer was run with the command line
parameters (-c 36 -g 10 --mum -d 0.3 -l 9). NUCmer generated a collection of short, highly conserved regions of homology ('anchors') spaced on average every 1 kb throughout the
Genome Biology 2004, 5:R61
Genome Biology 2004,
Volume 5, Issue 9, Article R61
Berman et al. R61.21
D. melanogaster genome. Anchors flanking either side of a D.
melanogaster region of interest were used to pull out the corresponding D. pseudoobscura region, and additional flanking
anchors were examined to ensure that the region was unambiguously orthologous. The region identified was re-aligned
to the melanogaster region with LAGAN 1.2 using default
settings.
where NSm is the number of binding sites in the D. melanogaster pCRM and NSc is the number of conserved binding
sites. Different values of the logarithmic base b give different
behavior. The data shown in Additional data file 3 support
values of b between 1.15 and 1.4. We defined a more intuitive
parameter, CF (conservation factor), which can range from 0
to 1 where 0 is the least stringent threshold (b = 1.4) and 1 is
the most stringent (b = 1.15)
comment
/>
Random sampling of non-coding genome
b = 1.4 - (CF * (1.4 - 1.15))
(2)
We performed genome searches with CF values of 0.25, 0.5,
0.55 and 0.75 and manually inspected the results with respect
to false-negative and false-positive rates based on our 15 positive and 17 negative pCRMs (Additional data file 3). While we
did not strictly optimize a single metric, we picked the values
that gave a reasonable balance between false positives and
false negatives, b = 0.25 for aligned sites alone, and b = 0.55
for aligned plus preserved sits.
(1)
Additional data files
The following additional data files are available with the
online version of this article.
Additional data file 1 shows the binding site densities (column
1), aligned site densities (column 2), and aligned plus preserved site densities (column 3) for individual transcription
factors. The top portion of each panel contains a histogram of
the values for randomly chosen 1,000 bp regions of the D.
Genome Biology 2004, 5:R61
information
NSm
NSc ≥ min( NSm , log b
)
2
interactions
We examined our functional (positive) and non-functional
(negative) pCRMs and noticed that in the positives, the lower
bound for the number of conserved sites as a function of D.
melanogaster sites followed an approximately logarithmic
curve (Additional data file 3). From this observation, we classified a D. melanogaster binding site cluster as conserved if:
Four metrics were then used to rank these 929 pCRMs: the
number of aligned binding sites; the density of aligned binding sites; the number of aligned plus preserved binding sites;
and the density of aligned plus preserved binding sites. All
values were normalized according to background distribution
of random non-coding sequences. The four normalized values
were then summed to compute an overall score, which was
then renormalized to arrive at a final z-score used to rank
pCRMs in Tables 3 and 4 and Additional data files 7, 8, 10,
and 11.
refereed research
For each potential D. melanogaster cluster, we identified the
corresponding D. pseudoobscura region using the homology
anchors described above. A pairwise alignment was made
using LAGAN 1.2 (default parameters), and the number of
aligned and preserved binding sites were determined as
described above. The 2-kb flanking either side of the pCRM
was included in the alignment to avoid edge effects, and was
subsequently removed when calculating pCRM properties.
eCIS-ANALYST genome searches were run with the following
parameters: min_sites = 10, wind_size = 700 (run #1), and
min_sites = 13, wind_size = 1,100 (run #2). All conserved
clusters (with conservation defined as described in Equations
1 and 2 above) were combined. In order to capture weaker
clusters, we performed an additional run (run number 3)
using min_sites = 9, wind_size = 700. For this low stringency
run, we used a non-standard conservation threshold different
from the one described above, accepting all clusters with at
least four aligned plus preserved sites, independent of the
number of sites in D. melanogaster. We merged overlapping
clusters from runs 1-3, yielding 929 non-overlapping clusters
as described in Results.
deposited research
Binding-site clusters in the D. melanogaster genome were
determined as described in [11], where the minimum number
of sites (min_sites) and the window size (wind_size) are
variable. Release 3 genomic sequence with exons masked was
searched with PATSER [72] using the following command
line options: -c -d2 -l4. An 'alphabet' file (specified with the
command line parameter '-a') was used to provide the following background frequencies: A/T = 0.297, G/C = 0.203. Position weight matrix (PWM) models were identical to those
used in [11]. In the online version of eCIS-ANALYST, the minimum PWM match threshold site_p is also variable, but in the
current study it was held constant at 0.0003 for all factors.
Tests using alternate values for this variable did not lead to
significant improvement in prediction efficacy.
reports
Genome-wide predictions
eCIS-ANALYST genome searches
reviews
To characterize properties of non-coding sequences across
the genome, we picked 4,000 1-kb segments of the D. melanogaster genome, sampled uniformly from all non-coding
sequence. For 3,300 of these, we could find orthologous
regions in D. pseudoobscura, and these were used to calculate
the properties of random non-coding sequence shown in Figure 4 and discussed in the text. Properties determined using
this data are considered properties of only the portion of the
genome that is detectably orthologous under our conditions.
The regions themselves are available as supplemental material at [42].
R61.22 Genome Biology 2004,
Volume 5, Issue 9, Article R61
Berman et al.
melanogaster genome. The blue line plots the cumulative distribution. The colored asterisks show the average values for
each class of pCRM. The panel below the histogram shows the
values for each pCRM (each dot represents one pCRM, with
positives in blue, negatives in red, ambiguous in green).
Additional data file 2 shows expression patterns of 65 genes
adjacent to 122 pCRMs identified by eCIS-ANALYST. The
images were obtained from the BDGP Embryonic Expression
Pattern Database [33], and include all pCRMs from Additional data files 7,8,10,11 for which an adjacent gene had an
early segmentation pattern.
Additional data file 3 shows discrimination of positive and
negative pCRMs. Comparisons of the number of predicted
binding sites in D. melanogaster pCRMs to the number of
aligned sites (top panel) and aligned plus preserved sites (bottom panel). Blue dots represent the 15 positive pCRMs from
the text; green dots the ten known CRMs that were below the
threshold used in [11]; red dots negative pCRMs; pink dots
ambiguous pCRMs. Gray boxes represent the distribution of
values for random 1,000 bp non-coding regions. The blue line
shows the discrimination function (see Materials and
methods).
Additional data file 4 shows new pCRMs. Three 30 kb regions
were chosen to illustrate new predictions: (A) the argos locus,
(B) the CG4702 locus (note that CG31361 is not expressed in
blastoderm embryos and PCE8494 is a low-scoring pCRM),
and (C) the SoxN locus. Exons are shows as blue boxes,
introns are represented with horizontal lines, and the direction of transcription is indicated by the arrow. New pCRMs
are shown as gray ovals. The green graphs show average (in
300 bp windows) percent identity and fraction of bases in
conserved blocks. Below the percent identity plots are shown
insertions (gray boxes) and deletions (orange boxes) in the D.
melanogaster sequence relative to their D. pseudoobscura
ortholog. The location of binding sites in D. melanogaster,
binding sites in D. pseudoobscura and aligned binding sites
along with the density of sites averaged over 700 bp are
shown in the bottom three panels for each region.
Additional data file 5 gives the primers used to amplify
pCRMs for transgenics. Additional data file 6 gives additional
information from Table 2. Additional data file 7 gives all new
pCRMs from genome-wide eCIS-ANALYST located within 20
kb of annotated transcript. Additional data file 8 gives all new
pCRMs from genome-wide eCIS-ANALYST located more
than 20 kb from annotated transcript. Additional data file 9
lists genes with anterior-posterior patterns and the source of
the information. Additional data file 10 gives all new pCRMs
from genome-wide eCIS-ANALYST located within 20 kb of
gene with anterior-posterior pattern. And, finally, Additional
data file 11 gives all new pCRMs from genome-wide eCISANALYST located between 20 kb and 50 kb from gene with
anterior-posterior pattern.
/>
between annotated 4
information used positive (column
Genes with aligned3
than 2), and site annotatedand
20 20 kb of and transcript
All newsites anterior-posterior gene with
additional information from patterns and
Newbindingpatterns2panel) transcript D. 122 densities (colservednumber ofdensities genes
to kb ofpCRMs file50genome-wide eCIS-ANALYST
theeCIS-ANALYST anterior-posterior
Discriminationpredicted preserved2 intransgenicslocated within
by thehere data ofaligned from (top 1), aligned aligned of the
Expressioninformation 65sitesfile sitespattern site(column pattern
ClickpCRMs(bottom plusbindingadjacentanterior-posterior preindividual transcriptionfrom Table panel) to melanogaster 3) for
umnprimerskbadditional dataTable 2 for densitiesComparisons of
Thenumberfromfromofkbfactorsnegative pCRMs. pCRMs identified
Additionalfor withto1amplify pCRMssiteand the source pluspCRMs
gene
20
9
8
7
6
5
11
10
more
Acknowledgements
We thank Richard Weiszman, Naomi Win and Nipam Patel for assistance
with RNA in situ hybridizations, Pavel Tomancak for generating the database to store images of stained transgenic embryos and Amy Beaton and
members of the Hartenstein lab for discussions of embryonic patterns of
expression, Casey Bergman and Joseph Carlson for generating the database
to store CRM transgenic sequences and the members of the BDGP for
clones and sequencing support. We also thank Arthur Delcher and Mihai
Pop for help with running and fine-tuning the Celera Assembler. This work
was supported by National Institutes of Health Grants HG00750 (to
G.M.R.), and HL667201 (to M.B.E.), and LM06845 (to S.L.S.); Department
of Energy contract DE-AC03-76SF00098 (to M.B.E.); and by the Howard
Hughes Medical Institute. M.B.E. is a Pew Scholar in the Biomedical Sciences. Author contributions are as follows: B.D.P. made P-element constructs containing the 28 candidate CRMs. T.R.L. injected these constructs
into Drosophila embryos, screened for transformants and generated the
lines for analysis. B.D.P. collected embryos, generated probes and performed whole-mount in situ hybridization. B.D.P. and S.E.C. imaged and analyzed transgenic embryos. S.L.S. assembled the D. pseudoobscura genomic
sequence. B.P.B. and M.B.E. performed all computational analyses. S.E.C.,
M.B.E. and G.M.R. provided guidance and direction for the project. S.E.C.
supervised experimental aspects of the project. M.B.E. supervised computational aspects of the project. M.B.E. wrote the paper. B.P.B. prepared the
tables and figures. B.D.P. and S.E.C. contributed to the content and edited
the paper.
References
1.
2.
3.
4.
5.
6.
7.
8.
9.
10.
11.
12.
13.
14.
15.
Arnone MI, Davidson EH: The hardwiring of development:
organization and function of genomic regulatory systems.
Development 1997, 124:1851-1864.
Levine M, Tjian R: Transcription regulation and animal
diversity. Nature 2003, 424:147-151.
The C. elegans Sequencing Consortium: Genome sequence of the
nematode C. elegans: a platform for investigating biology. Science 1998, 282:2012-2018.
Venter JC, Adams MD, Myers EW, Li PW, Mural RJ, Sutton GG, Smith
HO, Yandell M, Evans CA, Holt RA, et al.: The sequence of the
human genome. Science 2001, 291:1304-1351.
Lander ES, Linton LM, Birren B, Nusbaum C, Zody MC, Baldwin J,
Devon K, Dewar K, Doyle M, FitzHugh W, et al.: Initial sequencing
and analysis of the human genome. Nature 2001, 409:860-921.
Adams MD, Celniker SE, Holt RA, Evans CA, Gocayne JD, Amanatides PG, Scherer SE, Li PW, Hoskins RA, Galle RF, et al.: The
genome sequence of Drosophila melanogaster. Science 2000,
287:2185-2195.
Crowley EM, Roeder K, Bina M: A statistical model for locating
regulatory regions in genomic DNA. J Mol Biol 1997, 268:8-14.
Wasserman WW, Fickett JW: Identification of regulatory
regions which confer muscle-specific gene expression. J Mol
Biol 1998, 278:167-181.
Frith MC, Hansen U, Weng Z: Detection of cis-element clusters
in higher eukaryotic DNA. Bioinformatics 2001, 17:878-889.
Krivan W, Wasserman WW: A predictive model for regulatory
sequences directing liver-specific transcription. Genome Res
2001, 11:1559-1566.
Berman BP, Nibu Y, Pfeiffer BD, Tomancak P, Celniker SE, Levine M,
Rubin GM, Eisen MB: Exploiting transcription factor binding
site clustering to identify cis-regulatory modules involved in
pattern formation in the Drosophila genome. Proc Natl Acad Sci
USA 2002, 99:757-762.
Markstein M, Markstein P, Markstein V, Levine MS: Genome-wide
analysis of clustered Dorsal binding sites identifies putative
target genes in the Drosophila embryo. Proc Natl Acad Sci USA
2002, 99:763-768.
Rajewsky N, Vergassola M, Gaul U, Siggia ED: Computational
detection of genomic cis-regulatory modules applied to body
patterning in the early Drosophila embryo. BMC Bioinformatics
2002, 3:30.
Rebeiz M, Reeves NL, Posakony JW: SCORE: a computational
approach to the identification of cis-regulatory modules and
target genes in whole-genome sequence data. Site clustering
over random expectation. Proc Natl Acad Sci USA 2002,
99:9888-9893.
Papatsenko DA, Makeev VJ, Lifanov AP, Regnier M, Nazina AG, Desplan C: Extraction of functional binding sites from unique reg-
Genome Biology 2004, 5:R61
/>
16.
18.
19.
20.
22.
23.
25.
26.
28.
29.
30.
32.
33.
34.
36.
37.
39.
40.
48.
49.
50.
51.
52.
53.
54.
55.
56.
57.
58.
59.
60.
61.
62.
63.
64.
65.
66.
67.
Genome Biology 2004, 5:R61
information
38.
47.
interactions
35.
45.
46.
refereed research
31.
44.
deposited research
27.
42.
43.
sequencing projects. Methods Mol Biol 2004, 255:279-294.
Mayor C, Brudno M, Schwartz JR, Poliakov A, Rubin EM, Frazer KA,
Pachter LS, Dubchak I: VISTA : visualizing global DNA
sequence alignments of arbitrary length. Bioinformatics 2000,
16:1046-1047.
Online supplemental material [ />Brudno M, Do CB, Cooper GM, Kim MF, Davydov E, Green ED,
Sidow A, Batzoglou S: LAGAN and Multi-LAGAN: efficient
tools for large-scale multiple alignment of genomic DNA.
Genome Res 2003, 13:721-731.
Pollard DA, Bergman CM, Stoye J, Celniker SE, Eisen MB: Benchmarking tools for the alignment of functional noncoding
DNA. BMC Bioinformatics 2004, 5:6.
CIS-ANALYST [ />The FlyBase Consortium: The FlyBase database of the Drosophila genome projects and community literature. Nucleic
Acids Res 2002, 30:106-108.
Biggin MD, Tjian R: Transcriptional regulation in Drosophila:
the post-genome challenge. Funct Integr Genomics 2001,
1:223-234.
Markstein M, Levine M: Decoding cis-regulatory DNAs in the
Drosophila genome. Curr Opin Genet Dev 2002, 12:601-606.
Ingham PW, Martinez-Arias A: The correct activation of Antennapedia and bithorax complex genes requires the fushitarazu gene. Nature 1986, 324:592-597.
Ingham PW, Baker NE, Martinez-Arias A: Regulation of segment
polarity genes in the Drosophila blastoderm by fushi tarazu
and even skipped. Nature 1988, 331:73-75.
Calhoun VC, Levine M: Long-range enhancer-promoter interactions in the Scr-Antp interval of the Drosophila Antennapedia complex. Proc Natl Acad Sci USA 2003, 100:9878-9883.
Yu Y, Pick L: Non-periodic cues generate seven ftz stripes in
the Drosophila embryo. Mech Dev 1995, 50:163-175.
Simin K, Scuderi A, Reamey J, Dunn D, Weiss R, Metherall JE, Letsou
A: Profiling patterned transcripts in Drosophila embryos.
Genome Res 2002, 12:1040-1047.
Stathopoulos A, Levine M: Dorsal gradient networks in the Drosophila embryo. Dev Biol 2002, 246:57-67.
Roulet E, Busso S, Camargo AA, Simpson AJ, Mermod N, Bucher P:
High-throughput SELEX SAGE method for quantitative
modeling of transcription-factor binding sites. Nat Biotechnol
2002, 20:831-835.
Li WH, Wu CI, Luo CC: A new method for estimating synonymous and nonsynonymous rates of nucleotide substitution
considering the relative likelihood of nucleotide and codon
changes. Mol Biol Evol 1985, 2:150-174.
Lewontin RC: Inferring the number of evolutionary events
from DNA coding sequence differences. Mol Biol Evol 1989,
6:15-32.
Innan H, Stephan W: Selection intensity against deleterious
mutations in RNA secondary structures and rate of compensatory nucleotide substitutions. Genetics 2001, 159:389-399.
Shaw PJ, Wratten NS, McGregor AP, Dover GA: Coevolution in
bicoid-dependent promoters and the inception of regulatory
incompatibilities among species of higher Diptera. Evol Dev
2002, 4:265-277.
McGregor AP, Shaw PJ, Hancock JM, Bopp D, Hediger M, Wratten
NS, Dover GA: Rapid restructuring of bicoid-dependent
hunchback promoters within and between Dipteran species:
implications for molecular coevolution. Evol Dev 2001,
3:397-407.
MacArthur S, Brookfield JF: Expected rates and modes of evolution of enhancer sequences. Mol Biol Evol 2004, 21:1064-1073.
Thummel CS, Boulet AM, Lipshitz HD: Vectors for Drosophila Pelement-mediated transformation and tissue culture
transfection. Gene 1988, 74:445-456.
Small S, Blair A, Levine M: Regulation of even-skipped stripe 2 in
the Drosophila embryo. EMBO J 1992, 11:4047-4057.
Kosman D, Small S: Concentration-dependent patterning by an
ectopic expression domain of the Drosophila gap gene knirps.
Development 1997, 124:1343-1354.
Bender W, Spierer P, Hogness DS: Chromosome walking and
jumping to isolate DNA from the Ace and rosy loci and the
bithorax complex in Drosophila melanogaster. J Mol Biol 1983,
168:17-33.
TIGR:
D.
pseudoobscura
[ />D_pseudoobscura]
Stajich JE, Block D, Boulez K, Brenner SE, Chervitz SA, Dagdigian C,
reports
24.
41.
Berman et al. R61.23
reviews
21.
ulatory regions: the Drosophila early developmental
enhancers. Genome Res 2002, 12:470-481.
Halfon MS, Grad Y, Church GM, Michelson AM: Computationbased discovery of related transcriptional regulatory modules and motifs using an experimentally validated combinatorial model. Genome Res 2002, 12:1019-1028.
Nazina AG, Papatsenko DA: Statistical extraction of Drosophila
cis-regulatory modules using exhaustive assessment of local
word frequency. BMC Bioinformatics 2003, 4:65.
Nusslein-Volhard C, Wieschaus E: Mutations affecting segment
number and polarity in Drosophila. Nature 1980, 287:795-801.
Lewis EB: A gene complex controlling segmentation in Drosophila. Nature 1978, 276:565-570.
White KP, Rifkin SA, Hurban P, Hogness DS: Microarray analysis
of Drosophila development during metamorphosis. Science
1999, 286:2179-2184.
Tomancak P, Beaton A, Weiszmann R, Kwan E, Shu S, Lewis SE, Richards S, Ashburner M, Hartenstein V, Celniker SE, Rubin GM: Systematic determination of patterns of gene expression during
Drosophila
embryogenesis.
Genome
Biol
2002,
3:research0088.1-0088.14.
Lis JT, Simon JA, Sutton CA: New heat shock puffs and betagalactosidase activity resulting from transformation of Drosophila with an hsp70-lacZ hybrid gene. Cell 1983, 35:403-410.
Hiromi Y, Kuroiwa A, Gehring WJ: Control elements of the Drosophila segmentation gene fushi tarazu. Cell 1985, 43:603-613.
Powell JR: Progress and Prospects in Evolutionary Biology. The Drosophila
Model New York/Oxford: Oxford University Press; 1997.
Ludwig MZ, Patel NH, Kreitman M: Functional analysis of eve
stripe 2 enhancer evolution in Drosophila: rules governing
conservation and change. Development 1998, 125:949-958.
Ludwig MZ, Bergman C, Patel NH, Kreitman M: Evidence for
stabilizing selection in a eukaryotic enhancer element. Nature
2000, 403:564-567.
Pennacchio LA, Rubin EM: Genomic strategies to identify mammalian regulatory sequences. Nat Rev Genet 2001, 2:100-109.
Hardison RC: Comparative genomics. PLoS Biol 2003, 1:E58.
Bergman CM, Pfeiffer BD, Rincón-Limas DE, Hoskins RA, Gnirke A,
Mungall C, Wang A, Kronmiller B, Pacleb J, Park S, et al.: Assessing
the impact of comparative genomic sequence data on the
functional annotation of the Drosophila genome. Genome Biol
2002, 3:research0086.1-0086.20.
Waterston RH, Lindblad-Toh K, Birney E, Rogers J, Abril JF, Agarwal
P, Agarwala R, Ainscough R, Alexandersson M, An P, et al.: Initial
sequencing and comparative analysis of the mouse genome.
Nature 2002, 420:520-562.
Elnitski L, Hardison RC, Li J, Yang S, Kolbe D, Eswara P, O'Connor
MJ, Schwartz S, Miller W, Chiaromonte F: Distinguishing regulatory DNA from neutral sites. Genome Res 2003, 13:64-72.
Emberly E, Rajewsky N, Siggia ED: Conservation of regulatory
elements between two species of Drosophila. BMC
Bioinformatics 2003, 4:57.
Berkeley Drosophila Genome Project Database of Embryonic Gene Expression Patterns [ />ex/insitu.pl]
Ward EJ, Coulter DE: odd-skipped is expressed in multiple
tissues during Drosophila embryogenesis. Mech Dev 2000,
96:233-236.
Calhoun VC, Stathopoulos A, Levine M: Promoter-proximal tethering elements regulate enhancer-promoter specificity in
the Drosophila Antennapedia complex. Proc Natl Acad Sci USA
2002, 99:9243-9247.
Yang X, Yeo S, Dick T, Chia W: The role of a Drosophila POU
homeo domain gene in the specification of neural precursor
cell identity in the developing embryonic central nervous
system. Genes Dev 1993, 7:504-516.
Allan DW, St Pierre SE, Miguel-Aliaga I, Thor S: Specification of
neuropeptide cell identity by the integration of retrograde
BMP signaling and a combinatorial transcription factor code.
Cell 2003, 113:73-86.
Makeev VJ, Lifanov AP, Nazina AG, Papatsenko DA: Distance preferences in the arrangement of binding motifs and hierarchical levels in organization of transcription regulatory
information. Nucleic Acids Res 2003, 31:6016-6026.
Myers EW, Sutton GG, Delcher AL, Dew IM, Fasulo DP, Flanigan MJ,
Kravitz SA, Mobarry CM, Reinert KH, Remington Ka, et al.: A wholegenome assembly of Drosophila. Science 2000, 287:2196-2204.
Pop M, Kosack D: Using the TIGR assembler in shotgun
Volume 5, Issue 9, Article R61
comment
17.
Genome Biology 2004,
R61.24 Genome Biology 2004,
68.
69.
70.
71.
72.
73.
74.
75.
76.
77.
78.
79.
80.
81.
82.
83.
84.
Volume 5, Issue 9, Article R61
Berman et al.
Fuellen G, Gilbert JG, Korf I, Lapp H, et al.: The Bioperl toolkit:
Perl modules for the life sciences. Genome Res 2002,
12:1611-1618.
Berkeley Drosophila Genome Project []
WU-BLAST []
Schwartz S, Kent WJ, Smit A, Zhang Z, Baertsch R, Hardison RC,
Haussler D, Miller W: Human-mouse alignments with
BLASTZ. Genome Res 2003, 13:103-107.
Delcher AL, Kasif S, Fleischmann RD, Peterson J, White O, Salzberg
SL: Alignment of whole genomes. Nucleic Acids Res 1999,
27:2369-2376.
Hertz GZ, Stormo GD: Identifying DNA and protein patterns
with statistically significant alignments of multiple
sequences. Bioinformatics 1999, 15:563-577.
Pankratz MJ, Seifert E, Gerwin N, Billi B, Nauber U, Jackle H: Gradients of Kruppel and knirps gene products direct pair-rule
gene stripe patterning in the posterior region of the Drosophila embryo. Cell 1990, 61:309-317.
Pankratz MJ, Hock M, Seifert E, Jackle H: Kruppel requirement for
knirps enhancement reflects overlapping gap gene activities
in Drosophila embryo. Nature 1989, 341:337-340.
Harding K, Hoey T, Warrior R, Levine M: Autoregulatory and gap
gene response elements of the even-skipped promoter of
Drosophila. EMBO J 1989, 8:1205-1212.
Butler BA, Soong J, Gergen JP: The Drosophila segmentation
gene runt has an extended cis-regulatory region that is
required for vital expression at other stages of development.
Mech Dev 1992, 39:17-28.
Tautz D: Regulation of the Drosophila segmentation gene
hunchback by two maternal morphogenetic centres. Nature
1988, 332:281-284.
Sackerson C, Fujioka M, Goto T: The even-skipped locus is
contained in a 16-kb chromatin domain. Dev Biol 1999,
211:39-52.
Fujioka M, Emi-Sarker Y, Yusibova GL, Goto T, Jaynes JB: Analysis
of an even-skipped rescue transgene reveals both composite
and discrete neuronal and early blastoderm enhancers, and
multi-stripe positioning by gap gene repressor gradients.
Development 1999, 126:2527-2538.
Rudolph KM, Liaw GJ, Daniel A, Green P, Courey AJ, Hartenstein V,
Lengyel JA: Complex regulatory region mediating tailless
expression in early embryonic patterning and brain
development. Development 1997, 124:4297-4308.
Hartmann B, Hirth F, Walldorf U, Reichert H: Expression, regulation and function of the homeobox gene empty spiracles in
brain and ventral nerve cord development of Drosophila.
Mech Dev 2000, 90:143-153.
Pirrotta V, Chan CS, McCabe D, Qian S: Distinct parasegmental
and imaginal enhancers and the establishment of the
expression pattern of the Ubx gene. Genetics 1995,
141:1439-1450.
Hoch M, Schroder C, Seifert E, Jackle H: cis-acting control elements for Kruppel expression in the Drosophila embryo.
EMBO J 1990, 9:2587-2595.
Qian S, Capovilla M, Pirrotta V: The bx region enhancer, a distant cis-control element of the Drosophila Ubx gene and its
regulation by hunchback and other segmentation genes.
EMBO J 1991, 10:1415-1425.
Genome Biology 2004, 5:R61
/>