Báo cáo y học: "Alternative splicing of mouse transcription factors affects their DNA-binding domain architecture and is tissue specific" pot
Bạn đang xem bản rút gọn của tài liệu. Xem và tải ngay bản đầy đủ của tài liệu tại đây (265.53 KB, 9 trang )
Genome Biology 2004, 5:R75
comment reviews reports deposited research refereed research interactions information
Open Access
2004Taneriet al.Volume 5, Issue 10, Article R75
Research
Alternative splicing of mouse transcription factors affects their
DNA-binding domain architecture and is tissue specific
Bahar Taneri
*
, Ben Snyder
*
, Alexey Novoradovsky
*
and Terry Gaasterland
*†
Addresses:
*
The Laboratory of Computational Genomics, The Rockefeller University, New York, NY 10021, USA.
†
Scripps Institution of
Oceanography, University of California San Diego, La Jolla, CA 92093, USA.
Correspondence: Terry Gaasterland. E-mail:
© 2004 Taneri et al.; licensee BioMed Central Ltd.
This is an Open Access article distributed under the terms of the Creative Commons Attribution License (
which permits unrestricted use, distribution, and reproduction in any medium, provided the original work is properly cited.
Alternative splicing of mouse transcription factors affects their DNA-binding domain architecture and is tissue specific<p>Analyzing proteins in the context of all available genome and transcript sequence data has the potential to reveal functional properties not accessible through protein sequence analysis alone. To analyze the impact of alternative splicing on transcription factor (TF) protein structure, we constructed a comprehensive database of splice variants in the mouse transcriptome, called MouSDB3 containing 461 TF loci.</p>
Abstract
Background: Analyzing proteins in the context of all available genome and transcript sequence
data has the potential to reveal functional properties not accessible through protein sequence
analysis alone. To analyze the impact of alternative splicing on transcription factor (TF) protein
structure, we constructed a comprehensive database of splice variants in the mouse transcriptome,
called MouSDB3 containing 461 TF loci.
Results: Our analysis revealed that 62% of these loci in MouSDB3 have variant exons, compared
to 29% of all loci. These variant TF loci contain a total of 324 alternative exons, of which 23% are
in-frame. When excluded, 80% of in-frame alternative exons alter the domain architecture of the
protein as computed by SMART (simple modular architecture research tool). Sixty-eight % of these
exons directly affect the coding regions of domains important for TF function. Seventy-five % of the
domains affected are DNA-binding domains. Tissue distribution analyses of variant mouse TFs
reveal that they have more alternatively spliced forms in 14 of the 18 tissues analyzed when
compared to all the loci in MouSDB3. Further, TF isoforms are homogenous within a given single
tissue and are heterogeneous across different tissues, indicating their tissue specificity.
Conclusions: Our study provides quantitative evidence that alternative splicing preferentially adds
or deletes domains important to the DNA-binding function of the TFs. Analyses described here
reveal the presence of tissue-specific alternative splicing throughout the mouse transcriptome. Our
findings provide significant biological insights into control of transcription and regulation of tissue-
specific gene expression by alternative splicing via creation of tissue-specific TF isoforms.
Background
Alternative splicing is a widespread mechanism involved in
regulation of gene expression, which enables production of
many structurally and functionally different forms of proteins
from a single gene, adding to the complexity of the genomes
[1-3]. Different mRNA transcripts of a gene can be expressed
in different tissues or developmental stages or physiological
conditions [4,5].
An expanding body of expressed sequence data from the
human and mouse genomes indicates that alternative splic-
ing is an important mechanism in creating protein diversity,
and adds to functional complexity encoded in eukaryotic
genomes. Earlier studies indicate that at least 50% of the
genes in the human genome are alternatively spliced [6].
Examples include the vast majority of immune system and
nervous system genes [7].
Published: 30 September 2004
Genome Biology 2004, 5:R75
Received: 28 May 2004
Revised: 17 August 2004
Accepted: 18 August 2004
The electronic version of this article is the complete one and can be
found online at />R75.2 Genome Biology 2004, Volume 5, Issue 10, Article R75 Taneri et al. />Genome Biology 2004, 5:R75
Comprehensive analysis of alternative splicing is essential to
understand fully the proteomes of organisms [8]. Several
reports have indicated that variant splice forms result in pro-
teins with different functions. These can range from minimal
changes in function to absolutely opposite functions. For
example, the cAMP-response element modulator has three
different isoforms with entirely different DNA-binding
domains, which are all transcription activators. On the other
hand, isoforms of the human transcription factor AML1 func-
tion both as positive and as negative regulators of transcrip-
tion [9]. However, for the majority of genes, the functional
significance of alternative splicing is still not known [8].
Transcription is a critical process that specifies the mRNAs
and the proteins expressed within a cell. Expression of a given
gene is dependent on the interactions of different transcrip-
tion factors and their cofactors with the regulatory regions of
that gene. These transcription factors are in turn regulated by
processes that include interaction with other proteins and
signaling cascades [9].
Alternative splicing is a mechanism that regulates transcrip-
tion factor (TF) activity by generating a variety of protein iso-
forms from a single gene. As noted by Lopez, alternative
splicing can affect TF structure in two primary ways [9]: alter-
ations can be in the DNA-binding domains affecting their
affinity or specificity; or alterations can modulate interac-
tions of transcription factors with their cofactors. Such
changes have been observed experimentally to alter specifi-
city or binding strength or to switch between activator and
repressor isoforms of the same TF [10]. TF isoforms can have
stage-specific and tissue-specific expression patterns
throughout the development of an organism [9]. Little is
known about the tissue specificity of alternative splicing [11].
In this paper, we use an integrated approach to analyze DNA
and protein sequence data jointly to determine the potential
effect of alternative splicing on protein structure and func-
tion. We perform a detailed analysis of tissue-specific distri-
bution of alternatively spliced mouse TFs to gain biologically
meaningful insights into regulation of gene expression by
alternative splicing.
Results
Definitions
For our joint DNA-protein analysis described here, we devel-
oped MouSDB3 [12], which identifies, classifies, computes,
stores and answers queries about splice variants within the
mouse genome. As described in Materials and methods,
MouSDB3 uses the mouse genome and expressed sequences
in GenBank [13] and dbEST [14] to compute splice variants of
mouse transcripts organized by genomic loci. This section
provides definitions of terms used in MouSDB3 and in the
joint DNA-protein analysis method described here. A 'tran-
script' is a sequence transcribed from the genomic DNA
sequence. MouSDB3 is restricted to transcripts with at least
one splice junction. A 'locus' is a genomic region that includes
a set of overlapping transcripts mapped to the genome such
that a transcript appears in only one locus and all transcripts
whose genome coordinates overlap by at least one nucleotide
are included in the locus. Within a locus, a 'cassette exon' is
completely included in some transcripts and completely
excluded in others. A 'length variant exon' has alternative 5' or
3' splice sites, or both, in different transcripts. An exon can be
both length variant and cassette. A 'variant exon' is either cas-
sette or length variant or both. We consider an exon whose
number of nucleotides is a multiple of three and which starts
at the first base of a codon to be an 'in-frame exon'. Such
exons do not introduce an amino-acid substitution or a stop
codon when skipped, unless they are terminal exons within
the coding sequence. A 'genomic exon' is an uninterrupted
series of nucleotides, each of which is mapped to a transcript.
By this definition the genomic exon for a length variant exon
reflects the outermost splice sites. A 'cluster' is the set of tran-
scripts that map to a locus. A 'variant cluster' contains one or
more variant exons. An 'invariant cluster' has no variant
exons.
MouSDB3 cluster analysis
Our cluster analysis revealed that out of the 461 TF clusters,
62% are variant, compared to 29% of all genes in MouSDB3
(Table 1). The majority (62%) of the variation in TFs is due to
cassette exons, which is comparable to cassette-exon distri-
bution in the entire transcriptome (68% of the variant exons
in all loci are cassette). As the majority of alternative splicing
is due to cassette exons, we focus on these exons for our
analyses.
Table 1
Cluster analyses of transcription factors and entire MouSDB3
Transcription factors Entire MouSDB3
Total number of clusters 461 55,087
Number of invariant clusters 174 (38%) 39,273 (71%)
Number of variant clusters 287 (62%) 15,814 (29%)
Genome Biology 2004, Volume 5, Issue 10, Article R75 Taneri et al. R75.3
comment reviews reports refereed researchdeposited research interactions information
Genome Biology 2004, 5:R75
Cassette exon analysis
We screened the 287 variant TF clusters for the presence of
cassette exons within coding sequences. We categorized
MouSDB3 transcripts into three categories with respect to
each cassette exon within a cluster. Category 1 transcripts
contain the exon and are referred to as 'long transcripts'. Cat-
egory 2 transcripts skip the exon and are referred to as 'short
transcripts'. Category 3 transcripts do not overlap with the
cassette exon due to 5' or 3' truncations. In our structural
analysis, we computationally delete in-frame cassette exons
from Category 1 transcripts to produce an 'altered transcript'.
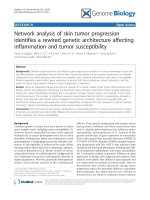
Figure 1 displays a MouSDB3 cluster and illustrates these
categories.
The 287 variant TF loci contain 324 cassette exons of which
23% (76 exons) are in-frame. Only 11% of cassette exons are
expected to be multiples of three and in codon position 1
randomly. The twofold difference between expected and
observed numbers indicates a bias towards in-frame cassette
exons. The exons which are a multiple of three and in codon
position 2 and 3 comprise 10% and 7%, respectively. When
deleted, these exons introduce an amino-acid substitution to
the sequence. As exons which are a multiple of three starting
at codon position 1 are enriched and do not introduce an
amino-acid substitution when deleted, our study focuses on
these exons only.
Transcripts of a MouSDB3 clusterFigure 1
Transcripts of a MouSDB3 cluster. (a) Partial image of MouSDB3 cluster number scl24819 [31] displaying alternatively spliced transcripts. (b)
Categorization of transcripts with respect to the cassette exon indicated by the arrow. This figure shows an example transcript for each of the three
categories from the scl24819 cluster. Category 1, long transcript with cassette exon indicated by the arrow. Category 2, short transcript skips the cassette
exon. Category 3, cassette exon is missing owing to a 5' truncation. Pink bars represent in-frame cassette exons. Green and blue bars represent exons
with other types of splice variation. (Green are invariant, blue are length-variant exons). The red line represents intronic regions of the genome sequence.
Category 1
Category 2
Category 3
Cassette exon
(a)
(b)
R75.4 Genome Biology 2004, Volume 5, Issue 10, Article R75 Taneri et al. />Genome Biology 2004, 5:R75
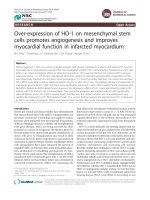
As shown in Figure 2, of the 76 in-frame cassette exons, 66
have domain architectures predicted by SMART. The remain-
ing 10 exons are either from transcripts with too short
sequences or these transcripts do not have any of the domains
annotated in SMART. Of the 66 in-frame cassette exons, 80%
(53) induce a domain-structure alteration to the protein when
skipped. Of these 53 structure-altering exons, 68% are within
coding regions for the domains that are important for TF
activity, such as DNA-binding or activation domains. The
remaining 32% (17) of exons are proximal to the computed
domain boundaries; that is, the domain is coded by the
upstream or the downstream neighboring exon of the cassette
exon. When the cassette exon is removed, the sequence no
longer meets the computational criteria for the domain (Fig-
ure 2).
Assessing domain architecture alterations
SMART [15,16] and Pfam [17,18] entries for the altered
domains revealed that 75% of the domains affected by alter-
native splicing with known functions are DNA-binding
domains. The names of all altered domains and links to their
annotated biological functions are provided on our web page
[19]. There we provide the 53 in-frame cassette exons (shown
in Figure 2), which alter the domain architecture of their tran-
scripts when skipped. Links to MouSDB3 clusters containing
these transcripts and links to their GenBank entries are
provided. In addition, we provide the names of the domains
altered by these 53 exons as active links to their SMART and
Pfam annotations. All sequences for long transcripts, altered
transcripts and in-frame cassette exons are provided as links
to fasta files on the same web page. Our domain-alteration
results correlate with recent findings of Resch et al. [20], who
show that alternative splicing preferentially removes certain
domains more frequently.
Tissue-distribution analysis
Part two of our analysis assessed the tissue distribution of
alternatively spliced transcription factors. We chose 18 tis-
sues from the existing libraries in MouSDB3 on the basis of
the fact that they contain both variant and invariant tran-
scripts annotated as TFs. There are a total of 1,413 library
names in MouSDB3 imported from expressed sequence
records in GenBank and dbEST. Of these, 328 are ambiguous
in that they list several different tissues or cell types for a
single library, such as 'mixture of brain and testis' or no tis-
sues at all, such as 'embryo or carcinoma'. For the work
described here we did not include tissue information from
such ambiguous libraries. There are a total of 95 libraries in
MouSDB3 for which there are TF transcripts. In addition, to
account for library ambiguities within these 95 libraries, we
pooled different parts of a tissue into one library. For exam-
ple, the term 'brain' corresponds to all parts of the brain found
Transcription factor cassette exon analysisFigure 2
Transcription factor cassette exon analysis. This figure illustrates the distribution of 324 cassette exons within variant TF transcripts. These 324 exons are
from 287 different variant MouSDB3 clusters. When 76 of the 324 cassette exons are skipped, the altered transcripts are in-frame; exclusion of remaining
exons either introduces an amino-acid substitution or causes frameshifting. Of the in-frame exons, 53 alter domain architecture and 13 do not. Of the
exons that cause domain alteration, 36 are in coding regions for domains and 17 are proximal to these coding regions. In-frame cassette exon sequences,
sequences of their transcripts and annotations of the domains they alter are provided on our web page [19].
248
Frameshift or
amino-acid substitution
10
No domain architecture
predicted by SMART
13
No structural alteration
17
Outside of domains
36
Within a domain
53
Alters structure
66
With domain architecture
76
In-frame
324
Cassette exons
287 Variant clusters
Genome Biology 2004, Volume 5, Issue 10, Article R75 Taneri et al. R75.5
comment reviews reports refereed researchdeposited research interactions information
Genome Biology 2004, 5:R75
in MouSDB3, including cerebellum, thalamus, hippocampus
and 16 other libraries. When analyzing the tissue distribution
of all genes, only the libraries that contain TF transcripts have
been used.
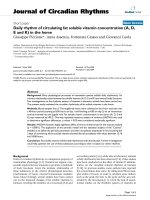
Transcript counts within variant loci for 18 pooled libraries
indicated that in 14 of the 18 analyzed tissues, the proportion
of TFs that are variant is higher than the proportion of all
genes that are variant (Figure 3a). This finding, together with
the observation that 62% of TF loci are variant, indicates the
widespread impact of alternative splicing on regulation of
gene expression via TFs.
For each of the 18 tissues in Figure 3a, we compared the pro-
portion of TFs that vary to the proportion of all genes that
vary. As shown in Figure 3b, eight tissues exhibited more than
twofold difference in variant TFs versus variant genes in total.
(Note that values in Figure 3b are base 2 logarithms of the
ratios. Tissues with twofold differences have log
2
values above
1 on the graph). In salivary gland, skeletal muscle, urinary
bladder and testis, the fold-differences are 8.7, 5.6, 3.8 and
3.0-fold respectively. Spinal cord, liver, adipose tissue and
eye also exhibit more than twofold differences. These values
are independent of the sampling depth of the transcripts from
these tissues, as illustrated in Figures 4a and 4b. Sampling
depth is the number of transcripts sequenced per tissue
(either a single library or a pooled library as in the case of
'brain'). Figure 4a displays absolute numbers of variant TF
transcripts and Figure 4b displays absolute numbers of the
entire variant transcripts of the transcriptome. In Figures
4a,b, tissues are presented along the x-axis as in Figure 3b for
the reader's convenience. The correlation coefficient of the
absolute numbers of TFs and the fold-differences between
variant TFs and all genes is -0.13, indicating that they do not
correlate. Likewise, the correlation coefficient of the absolute
numbers of all genes and the fold-differences between variant
TFs and all genes is -0.46. Additionally, the scatter-plots in
Figures 4c,d show that there is no correlation between the
fold-differences and sampling depth. The datasets used in
calculating the correlation coefficients can be found on our
web page [19].
Isoform heterogeneity
We analyzed the presence of different isoforms of transcrip-
tion factors within and across these 18 tissues. For this analy-
sis we consider transcripts with coding sequence information
only. We ignore variation due to 5' and 3' truncation of tran-
scripts. We consider only cassette exons within coding
sequences when assessing the differences between isoforms.
Within a cluster we compute homogeneity and heterogeneity
within a single tissue by checking for the transcripts from the
same library and comparing the cassette exons within their
coding sequences. If all transcripts from the same tissue con-
tain the same cassette exons with same splice sites they are
termed 'homogeneous within'. If the cassette exon
distribution within the coding sequences of these transcripts
differ, they are termed 'heterogeneous within'. We compute
'homogeneity across' and 'heterogeneity across' tissues in the
same way by taking into account transcripts within the same
clusters but from different libraries. As shown in Figure 5,
when heterogeneity to homogeneity ratios are compared
within and across tissues, there is significantly more hetero-
geneity of isoforms across tissues than within a single tissue
(p-value = 0.04). This is true for both transcription factors
and the rest of the genes in the mouse transcriptome.
When single tissues are taken into account, TFs are more
homogenous within each tissue analyzed. As shown in Figure
6, heterogeneity to homogeneity ratios in all tissues are lower
than 1, indicating that these tissues are more homogeneous in
terms of TF isoforms. In fact, except for brain and thymus, all
values for TFs are zero, hence the absence of blue bars from
Figure 6. When all genes are considered, heterogeneity to
homogeneity ratios are also below 1, indicating homogeneity
of isoforms of all genes within these tissues. However, there is
still a significant difference in heterogeneity to homogeneity
ratios between TF isoforms and isoforms of all genes: TFs are
significantly more homogeneous within single tissues when
compared to all genes (p-value = 0.02). (The data used in cal-
culating the homogeneity and heterogeneity values can be
found on our web page [19].)
Figures 5 and 6 show that the majority of TF isoforms and the
isoforms of all alternatively spliced genes differ across tis-
sues: within a given single tissue there generally is only one
isoform. These data indicate the presence of tissue-specific
alternative splicing throughout the mouse transcriptome. In
addition, our findings indicate expression of different TF iso-
forms in different tissues. This implies contribution of alter-
native splicing to regulation of gene expression in a tissue-
specific manner by controlling activation or repression of dif-
ferent sets of genes in different tissues via variant TF iso-
forms. These data have significant implications in further
understanding the regulation of tissue-specific gene expres-
sion and control of transcription.
Discussion
Through integrated analyses of DNA and protein sequences
for TF genes, we show that alternative splicing of TFs are
more prevalent in the entire mouse transcriptome and in spe-
cific tissues when compared to alternatively spliced forms of
all the genes. In 78% of the tissues analyzed, higher
proportions of TFs exhibit alternative splicing compared to all
the genes in the mouse transcriptome. This result, along with
the finding that 62% of TF loci are variant, indicates the wide-
spread impact of alternative splicing on regulation of TF
function.
We also show that alternative splicing changes TF structure
by adding or deleting domains. This study reveals that 80% of
R75.6 Genome Biology 2004, Volume 5, Issue 10, Article R75 Taneri et al. />Genome Biology 2004, 5:R75
alternatively spliced TFs have different domain architectures
due to introduction of an in-frame cassette exon by alterna-
tive splicing. Of the altered domains, 75% have a role in DNA
binding. These findings provide quantitative evidence for the
role of alternative splicing in controlling the presence of
domains in the proteins. They also suggest that alternative
splicing might regulate TF activity by changing the architec-
ture of the DNA-binding domains of these proteins.
Our analyses revealed that within a single tissue there gener-
ally is only one TF isoform, and that across tissues, isoforms
differ. This finding indicates tissue specificity of alternatively
TF variation is higher in the majority of tissues compared to all genesFigure 3
TF variation is higher in the majority of tissues compared to all genes. (a) Tissue distribution of alternatively spliced TFs versus tissue distribution of all
alternatively spliced genes. For each tissue, the number of variant TF transcripts in tissue normalized by the total number of variant TF transcripts in
MouSDB3 is represented as a blue bar. This number is computed as follows: t = number of variant TF transcripts in tissue; T = total number of variant TF
transcripts; bar value = (t/T × 100). Red bars represent the number of variant transcripts of all genes in the tissue normalized by the total number of
variant transcripts in MouSDB3. This value is computed as follows: a = total number of variant transcripts in tissue; A = total number of all variant
transcripts in MouSDB3; bar value = (a/A × 100). (b) Fold differences in variant number of transcripts between TFs and all genes. This value is computed
as follows: bar value = log
2
((t/T)/(a/A)). Tissues are in descending order from highest to lowest fold difference of variation in TF versus variation in all
genes. Tissue abbreviations: SG, salivary gland; SM, skeletal muscle; UB, urinary bladder; SC, spinal cord; AT, adipose tissue; MG, mammary gland.
Kidney
MG
Pancreas
Bone
log
2
(TF variation: variation in all genes) Percent variation
Brain
Testis
Thymus
Eye
Liver
Lung
Kidney
MG
Heart
Colon
SC
SG
Pancreas
UB
Bone
SM
Intestine
AT
0
1
2
3
4
5
6
7
8
9
SG
SM
UB
Testis
SC
Liver
AT
Eye
Thymus
Colon
Brain
Lung
Heart
Intestine
−4
−3
−2
−1
0
1
2
3
4
(a)
(b)
Genome Biology 2004, Volume 5, Issue 10, Article R75 Taneri et al. R75.7
comment reviews reports refereed researchdeposited research interactions information
Genome Biology 2004, 5:R75
spliced TFs and suggests that TFs might regulate gene expres-
sion in a tissue-specific manner by having different isoforms
in different tissues. These findings further indicate the role of
alternative splicing in regulation of tissue-specific gene
expression. Activation and repression of different sets of
genes within different tissues can be regulated through vari-
ant TF isoforms created by alternative splicing. These find-
ings will significantly aid further understanding of control of
transcription and tissue-specific gene expression. In addi-
tion, our study shows that all variant loci in the mouse tran-
scriptome display isoform homogeneity within single tissues
and heterogeneity across tissues. This finding demonstrates
the presence of tissue-specific alternative splicing across the
mouse transcriptome and greatly expands the knowledge on
the tissue specificity of alternatively spliced genes.
Conclusions
Overall, our study provides quantitative evidence for the
effect of alternative splicing on protein structure and sheds
light on how alternative splicing might regulate transcription
factor function in a tissue-specific manner. This, in turn,
reveals the contribution of alternative splicing to regulation of
gene expression via tissue-specific TF isoforms. The work
described here implies that future high-throughput screens of
gene expression analyses should be sensitive to multiple
alternatively spliced forms of TFs. Because gene-expression
arrays are intended to measure transcription, the next gener-
ation of arrays should contain probes specific to all known
isoforms of genes represented on the arrays. Given that alter-
natively spliced exons are highly conserved across species
[21,22], it would be of further interest to extend this study to
Higher variation in TFs is independent of sampling depth from each tissueFigure 4
Higher variation in TFs is independent of sampling depth from each tissue. (a) Absolute number of variant TF transcripts per tissue. (b) Absolute number
of all variant transcripts per tissue. (c) For each tissue (labeled to the right of each data point), x-axis: ratio of variant TF transcripts to all variant
transcripts (x = (t/T)/(a/A)); y-axis: absolute numbers of variant TF transcripts. See Figure 3 legend or definitions of t, T, a and A. (d) For each tissue (labeled
to the right of each data point), x-axis: ratio of variant TF transcripts to all variant transcripts (x = (t/T)/(a/A)); y-axis: absolute numbers of all variant
transcripts. Tissue abbreviations: SG, salivary gland; SM, skeletal muscle; UB, urinary bladder; SC, spinal cord; AT, adipose tissue; MG, mammary gland.
Number of variant TF transcripts
Number of variant TF transcripts
Number of all variant transcripts
Number of all variant transcripts
Brain
MG
Kidney
Bone
Pancreas
Intestine
Colon
Lung
Heart
Thymus
Eye
Liver
Testis
AT
SC
UB
SM
SG
Brain
Testis
Thymus
Eye
Liver
Heart
Lung
MG
Kidney
Pancreas
Bone Intestine
Colon
AT
SC
UB
SG
SM
Variation of TF: variation of all genes
0
10
20
30
40
50
60
70
80
0
10,000
20,000
30,000
40,000
50,000
60,000
70,000
0
10
20
30
40
50
60
70
80
0
10,000
20,000
30,000
40,000
50,000
60,000
70,000
Kidney
MG
Pancreas
Bone
SG
SM
UB
Testis
SC
Liver
AT
Eye
Thymus
Colon
Brain
Lung
Heart
Intestine
Kidney
MG
Pancreas
Bone
SG
SM
UB
Testis
SC
Liver
AT
Eye
Thymus
Colon
Brain
Lung
Heart
Intestine
012345678910
Variation of TF: variation of all genes
012345678910
(a) (b)
(c) (d)
R75.8 Genome Biology 2004, Volume 5, Issue 10, Article R75 Taneri et al. />Genome Biology 2004, 5:R75
other organisms. Strong sequence homology between mouse,
human and rat exons suggests that a comparative analysis of
human, mouse and rat TF variations will be a natural exten-
sion of the studies described here.
Materials and methods
Development of the alternative splicing database
MouSDB3
For this analysis, we constructed a database of alternatively
spliced mouse transcripts called MouSDB3 [12], using the
methods described in [23]. Briefly, full-length transcript
nucleotide sequences were obtained by an Entrez query on 5
August 2003 from GenBank [24] with molecule selected as
mRNA and limits used to exclude expressed sequence tags
(ESTs), sequence-tagged sites (STSs), genome sequence sur-
vey (GSS), third-party annotation (TPA), working draft and
patents. EST sequences were downloaded on 31 July 2003
from dbEST [25] by extracting only Mus musculus entries. All
expressed sequences were mapped to a region of the Univer-
sity of California Santa Cruz (UCSC) February 2003 version
mm3 of the mouse genome assembly using BLAT [26]. BLAT
tools gfServer and gfClient were installed from jksrc444 dated
15 July 2002 [27]. This was followed by a careful alignment by
SIM4 [28] version 3/3/2002 to establish splice sites of exons.
A post-processing analysis computed genomic exons and
determined types of variation for each exon, transcript and
locus.
Cassette exon analysis
We identified in-frame cassette exons and extracted from
MouSDB3 nucleotide and amino-acid sequences for tran-
scripts containing these exons. The selected amino-acid
sequences were then analyzed with SMART [29,30] to
compute protein-domain architecture for each transcript
within a cluster.
Tissue distribution of alternatively spliced TFs
From MouSDB3, we then extracted library information for
the transcripts within clusters and their annotations. We used
these data to compute the tissue distribution of variant tran-
scripts as reported in Results. All scripts and README files
used to carry out this data-gathering process are available
upon request from the Laboratory of Computational Genom-
ics of The Rockefeller University.
Acknowledgements
We acknowledge support from Mathers Foundation and Hirschl Founda-
tion. This work has been partially funded by NSF grant DBI9984882 and
NIH grant GM62529 to T.G. We thank Joseph A. Sorge for suggestions
regarding the tissue-distribution analyses and members of Laboratory of
Computational Genomics for their support. Corresponding author T.G.
can be reached at as well as at
References
1. Caceres JF, Kornblihtt AR: Alternative splicing: multiple control
mechanisms and involvement in human disease. Trends Genet
2002, 18:186-193.
2. Brett D, Popisil H, Valcarel J, Reich J, Bork P: Alternative splicing
and genome complexity. Nat Genet 2002, 30:29-30.
3. Black DL: Protein diversity from alternative splicing: a chal-
lenge for bioinformatics and post-genome biology. Cell 2000,
103:367-370.
4. Graveley BR: Alternative splicing: increasing diversity in the
proteomic world. Trends Genet 2001, 17:100-107.
5. O'Donovan KJ, Darnell RB: Neuronal signaling through alterna-
tive splicing: some exons CaRRE. Sci STKE 2001:PE2.
6. Modrek B, Lee C: A genomic view of alternative splicing. Nat
Genet 2002, 30:13-19.
Isoforms of alternatively spliced genes are more heterogeneous across different tissues than within single tissuesFigure 5
Isoforms of alternatively spliced genes are more heterogeneous across
different tissues than within single tissues. The blue bars represent the
ratio of all TF clusters with multiple isoforms within a tissue to all TF
clusters with only one isoform within each tissue. The red bars represent
the ratio of all variant clusters with multiple isoforms within a tissue to all
variant clusters with only one isoform within each tissue.
Heterogeneity: homogeneity
of isoforms
0
0.05
0.1
0.15
0.2
0.25
Within single tissues Across several tissues
Heterogeneity versus homogeneity of isoforms in single tissuesFigure 6
Heterogeneity versus homogeneity of isoforms in single tissues. The blue
bars represent the ratio of TF clusters with multiple isoforms within the
given tissue to TF clusters with only one isoform within that tissue. The
red bars represent the ratio of variant clusters with multiple isoforms
within the given tissue to variant clusters with only one isoform within
that tissue. Tissue abbreviations: MG, mammary gland; SM, skeletal muscle;
SC, spinal cord.
Brain
Heart
Eye
Kidney
Testis
Thymus
colon
Liver
Lung
MG
SM
SC
Heterogeneity: homogeneity
of isoforms
0
0.05
0.1
0.15
0.2
0.25
0.3
Genome Biology 2004, Volume 5, Issue 10, Article R75 Taneri et al. R75.9
comment reviews reports refereed researchdeposited research interactions information
Genome Biology 2004, 5:R75
7. Modrek B, Resch A, Grasso C, Lee C: Genome-wide detection of
alternative splicing in expressed sequences of human genes.
Nucleic Acids Res 2001, 29:2850-2859.
8. Cline MS, Shigeta R, Wheeler RL, Siani-Rose MA, Kulp D, Loraine AE:
The effects of alternative splicing on transmembrane pro-
teins in the mouse genome. Pac Symp Biocomput 2004:17-28.
9. Lopez AJ: Developmental role of transcription factor isoforms
generated by alternative splicing. Dev Biol 1995, 172:396-411.
10. Foulkes NS, Sassone-Corsi P: More is better activators and
repressors from the same gene. Cell 1992, 68:411-414.
11. Xu Q, Modrek B, Lee C: Genome-wide detection of tissue-spe-
cific alternative splicing in the human transcriptome. Nucleic
Acids Res 2002, 30:3754-3766.
12. MouSDB3 [ />sdb.php?db=MouSDB3]
13. Bilofsky HS, Burks C, Fickett JW, Goad WB, Lweitter FI, Rindone
WP, Swindell CD, Tung CS: The GenBank genetic sequence
databank. Nucleic Acids Res 1986, 14:1-4.
14. Boguski MS, Lowe TM, Tolstoshev CM: dbEST - database for
'expressed sequence tags'. Nat Genet 1993, 4:332-333.
15. Schultz J, Milpetz F, Bork P, Ponting CP: SMART, a simple modu-
lar architecture research tool: Identification of signaling
domains. Proc Natl Acad Sci USA 1998, 95:5857-5864.
16. Letunic I, Copley RR, Schmidt S, Ciccarelli FD, Doerks T, Schultz J,
Ponting CP, Bork P: SMART 4.0: towards genomic data
integration. Nucleic Acids Res 2004, 32 Database
issue:D142-D144.
17. Bateman A, Coin L, Durbin R, Finn RD, Hollich V, Griffiths-Jones S,
Khanna A, Marshall M, Moxon S, Sonnhammer EL, Studholme DJ, et
al.: The Pfam protein families database. Nucleic Acids Res 2004,
32 Database issue:D138-D141.
18. Pfam [ />19. Supplementary Web Page [ />~bahar/TF.html]
20. Resch A, Xing Y, Modrek B, Gorlick M, Riley R, Lee C: Assessing the
impact of alternative splicing on domain interactions in the
human proteome. J Proteome Res 2004, 3:76-83.
21. Sugnet CW, Kent WJ, Ares M Jr, Haussler D: Transcriptome and
genome conservation of alternative splicing events in
humans and mice. Pac Symp Biocomput 2004:66-77.
22. Thanaraj TA, Clark F, Muilu J: Conservation of human alterna-
tive splice events in mouse. Nucleic Acids Res 2003, 31:2544-2552.
23. Zavolan M, van Nimwegen E, Gaasterland T: Splice variation in
mouse full-length cDNAs identified by mapping to the
mouse genome. Genome Res 2002, 12:1377-1385.
24. Entrez nucleotide [ />query.fcgi?db=Nucleotide]
25. FTP directory/repository/dbEST [ />tory/dbEST]
26. Kent WJ: BLAT - the BLAST-like alignment tool. Genome Res
2002, 12:656-664.
27. Jim Kent's web page [ />28. Florea L, Hartzell G, Zhang Z, Rubin GM, Miller W: A computer
program for aligning a cDNA sequence with a genomic DNA
sequence. Genome Res 1998, 8:967-974.
29. Letunic I, Goodstadt L, Dickens NJ, Doerks T, Schultz J, Mott R, Cic-
carelli F, Copley RR, Ponting CP, Bork P: Recent improvements to
the SMART domain-based sequence annotation resource.
Nucleic Acids Res 2002, 30:242-244.
30. SMART - simple modular architecture research tool [http://
smart.embl-heidelberg.de]
31. Cluster scl24819 [ />cluster_map.php?cluster_id=scl24819&db=MouSDB3]