Báo cáo y học: "How biologically relevant are interaction-based modules in protein networks" ppsx
Bạn đang xem bản rút gọn của tài liệu. Xem và tải ngay bản đầy đủ của tài liệu tại đây (538.4 KB, 11 trang )
Genome Biology 2004, 5:R93
comment reviews reports deposited research refereed research interactions information
Open Access
2004Poyatos and HurstVolume 5, Issue 11, Article R93
Method
How biologically relevant are interaction-based modules in protein
networks?
Juan F Poyatos
*
and Laurence D Hurst
†
Addresses:
*
Evolutionary Systems Biology Initiative, Structural and Computational Biology Program, Spanish National Cancer Center (CNIO),
Melchor Fernández Almagro 3, 28029 Madrid, Spain.
†
Department of Biology and Biochemistry, University of Bath, Bath BA2 7AY, UK.
Correspondence: Juan F Poyatos. E-mail:
© 2004 Poyatos and Hurst; licensee BioMed Central Ltd.
This is an Open Access article distributed under the terms of the Creative Commons Attribution License (
which permits unrestricted use, distribution, and reproduction in any medium, provided the original work is properly cited.
How biologically relevant are interaction-based modules in protein networks? <p>The authors present a method to identify modules within protein-interaction networks. Phylogenetic profiles are used to determine the biological relevance of the modules.</p>
Abstract
By applying a graph-based algorithm to yeast protein-interaction networks we have extracted
modular structures and show that they can be validated using information from the phylogenetic
conservation of the network components. We show that the module cores, the parts with the
highest intramodular connectivity, are biologically relevant components of the networks. These
constituents correlate only weakly with other levels of organization. We also discuss how such
structures could be used for finding targets for antimicrobial drugs.
Background
There is a strong belief underpinning systems biology that
between the individual molecules and an organism's pheno-
type there exist intermediary levels of organization [1]. The
lowest level, and one that can be objectively defined, is that of
the motif, for example a feedforward loop [2-5]. At the next
level there exist putative modules within networks [6-16].
However, unlike motifs, modules are not objectively defined
and are hence rather fuzzy. Moreover, even if a stringent def-
inition or sophisticated algorithms could be envisaged, the
data used to identify such modules are typically very noisy, for
example, protein-protein interaction data. The central prob-
lem [17] with the notion of modules, therefore, is not identify-
ing putative candidates but verifying which of them really
reflect an important level of biological organization, rather
than artifacts of the data or module-defining protocol. In
addition, it would be of interest to determine the minimal
information needed to identify such candidates, so that this
level of organization can be readily probed, even in relatively
poorly characterized systems.
Given that we could define such modules for a particular data
source, for example, protein-protein interactions, there exists
the further problem of understanding how modules relate to
other forms of organization. Do for example, the proteins in a
given module within a protein-protein interaction network
show evidence of being coexpressed? Are they regulated by
the same transcription factors and do they have the same level
of dispensability?
Whether we can define modules in a stringent biologically rel-
evant fashion is not just important for our understanding of
the organization of biological systems. Many authors have
conjectured that if modules are real they may also be more
likely to contain proteins that are essential to viability. Hence,
a network approach could be imagined to hone down poten-
tial drug targets such as, for instance, candidate targets for
antimicrobials.
Here we ask whether phylogenetic information could be used
to verify putative interaction-based modules. The assumption
we make is that if a set of proteins belongs to the same module
and that module has some biological relevance, then such a
Published: 1 November 2004
Genome Biology 2004, 5:R93
Received: 17 July 2004
Revised: 31 August 2004
Accepted: 1 October 2004
The electronic version of this article is the complete one and can be
found online at />R93.2 Genome Biology 2004, Volume 5, Issue 11, Article R93 Poyatos and Hurst />Genome Biology 2004, 5:R93
set should be generally conserved to act as an integrated func-
tional unit [18,19]. Hence we should expect a genome to con-
tain roughly all the set components or none. The extent to
which we find the module components present or absent
together we define as the 'phylogenetic correlation' of the
module. We show that this correlation can be used to verify
putative modules in a network context and that the modules
identified in this way have important biological properties.
Results and discussion
Extracting modules in protein networks
Several network-clustering algorithms have been developed
recently that make use of the local and global properties of
networks [9-11]. To this end, it is helpful to represent net-
works as graphs, with proteins playing the role of nodes and
protein-protein interactions playing the role of edges between
nodes. In such graphs, the presence of modular topology
could be manifested in the fact that the shortest distance, L,
between any given node and the rest of the nodes in the graph
would exhibit a similar pattern for those nodes belonging to
the same module. Alternatively, modularity could also imply
that proteins within a module would interact more frequently
with each other than with proteins of different modules, a
property characterized by high values of a generalized cluster-
ing coefficient, C (see Materials and methods).
We introduce here a simple algorithm that makes use of both
sources of information. The basic steps of the so-called over-
lap algorithm are as follows (see also Materials and methods
and Figure 1a).
Selection of the number of modules
C-based and L-based matrices were obtained from the inter-
action matrix. These matrices are the input data of a standard
hierarchical agglomerative average-linkage clustering algo-
rithm with a Pearson-based distance metric [20]. We
obtained as an output of the clustering different sets of mod-
ules associated to each matrix by delimiting clusters accord-
ing to a given number of branches present in the clustering
tree ( ) (discarding those ones containing just a single pro-
tein). In the next step we calculated an average overlap
between both modular structures. A -value with signifi-
cantly high maximal overlap was then chosen.
Extraction of a particular modular structure
Having obtained C-based and L-based modules with a -
value selected as previously described, we calculated the over-
lap of each C-based module with all those obtained with the
L-based method. An L-based method less efficiently discrim-
inates modular structures in small-world networks [21], col-
lapsing some of the modules extracted with the C-based
technique into a unique module. The C-based method is more
robust but is weak at discriminating modules when organiza-
tion levels are high. Therefore we used the C-based results as
a template and the L-based method as a filter in the extraction
of modular structure. In the C-based modular structure we
kept in each module only those components which also
appeared in the corresponding L-based module with which
the selected C-module had the greatest overlap. In those cases
with more than one module with maximal overlap, we
selected one of them at random. Although finding the optimal
classification choice is a common problem of clustering anal-
ysis, this simple algorithm allows one to select a -value
with a high average maximal overlap and low overlap ratios
between both methods, a measure of the reliability of the
obtained modules (see Materials and methods and Additional
data file 1 for more details).
The overlap method was applied to the yeast protein-interac-
tion network; that is, yeast would act as an imaginary 'poorly'
characterized system where we can, however, check the rele-
vance of our findings. This was derived from two public data-
bases (see Materials and methods) and would be, more
generally, the result of high-throughput experiments. In any
case, these data are probably incomplete and no doubt con-
tain false interactions [22]. Should the analysis be done on
the whole network? Certainly this could be done - and many
similar analyses have been done. However, one of the novel-
ties of the current analysis is that we perform the analysis on
sub-parts. This is because we are interested in knowing
whether different functional categories differ in the extent to
which they might be modular [1], not least because we also
want to know whether this modularity might be reflected in
such things as coexpression of the genes involved. This ten-
dency is likely to vary by functional class. For example, cell-
cycle genes should in principle show a strong coexpression
signal if the modules are real. In contrast, one might imagine
that all cell-signaling components need to be present under
all circumstances and so coexpression need not be detectable.
Analyzing the network as a whole, one might come to con-
clude that there exists no or just a weak correspondence
between modules and coexpressed genes, when in reality
there might be a very strong relationship for some categories
while none for others.
We therefore opted to analyze networks consisting of proteins
belonging to different Munich Information Center for Protein
Sequences (MIPS) protein functional categories [23]. This
also has some methodological advantages. First, as methods
for detecting protein-protein interactions may vary systemat-
ically according to functional grouping - for example, cyto-
plasmic complexes tend to be under-reported - it can be
helpful to isolate each grouping alone. Second, it is probably
desirable to filter out highly connected proteins to avoid big
hubs and star-like clusters with low statistical significance
[9]. Projecting the networks onto functional categories is a
possible way of achieving such a filter. In every functional net-
work, we found a regime of -values with significantly high
average maximal overlap, that is, overlap equal to or greater
than 0.8, and low ratios, characterizing the reliability of the
B
B
B
B
B
Genome Biology 2004, Volume 5, Issue 11, Article R93 Poyatos and Hurst R93.3
comment reviews reports refereed researchdeposited research interactions information
Genome Biology 2004, 5:R93
proposed modular organizations. For an analysis of the per-
formance of the algorithm as a function of -see Additional
datafile 1. Note that these results extend the presence of mod-
ularity found previously in some yeast networks [9,10,24] to
the functional networks introduced here. Explicit -values
in the regime described above were chosen such that the aver-
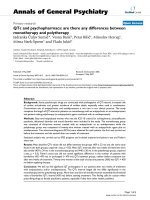
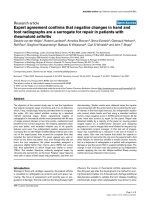
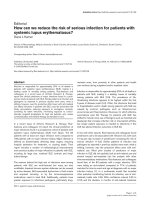
Overlap algorithm and multi-response randomization test methodFigure 1
Overlap algorithm and multi-response randomization test method. (a) Overlap algorithm. C-based and L-based matrices are obtained from the interaction
matrix. These matrices are then the input data of a standard hierarchical agglomerative average-linkage clustering algorithm [20] which extracts modules
according to a given number of branches present in the clustering tree ( ) (see text). Finally, in the C-based modular structure, we kept in each module
only those components which also appeared in the corresponding L-based module with which the selected C-module had the greatest overlap. The
organization thus obtained is the putative modular organization of the network under consideration. (b) Multi-response permutation procedure. We
validate the previous modular organization with the use of the phylogenetic conservation of module protein constituents across species. We calculate a
matrix of mean pairwise similarities (or distances) among those phylogenetic profiles [18] of proteins belonging to the same module, W
i
, or every two
pairs of modules, W
ij
, and computed a representative statistic
ξ
observed
. P-values are obtained by randomly permuting the data and recomputing the statistic.
This step is repeated a large number of times, 10,000 in our case. The resulting values form a randomized distribution. The observed value from the
original data can then be compared with this distribution to compute the P-value.
Interaction matrix
L matrix
L matrix clustered C matrix clustered
C matrix
Modular organization
Module 1
Module 2
Module 3
Module 4
Module 5
Module 1
Module 2
Module 3
Module 4
Module 5
W
1
W
12
W
13
W
14
W
15
W
2
W
23
W
24
W
25
W
3
W
34
W
35
W
4
W
45
W
5
W
1
W
12
W
13
W
14
W
15
W
2
W
23
W
24
W
25
W
3
W
34
W
35
W
4
W
45
W
5
Randomization
Species
Species
Distance matrix
Distance matrix
Clustering Clustering
Proteins
Proteins
Proteins
Proteins
Proteins
Proteins
Proteins
Proteins
Proteins
Proteins
Proteins
Proteins
Proteins Proteins
ξ
observed
ξ
randomized distribution
(a) (b)
B
B
B
R93.4 Genome Biology 2004, Volume 5, Issue 11, Article R93 Poyatos and Hurst />Genome Biology 2004, 5:R93
age module size is around equal to 5 to 25 proteins, the so-
called meso scale of biological networks [9] (Table 1).
Modular phylogenetic profiles
To ask whether the degree of phylogenetic correlation of the
modules is higher than expected, we made use of the idea of
phylogenetic profiles [18]; that is, patterns of presence or
absence of homologs of a given protein across different
genomes. We then adapted the underlying general assump-
tion of phylogenetic profiles, that proteins belonging to a par-
ticular functional class should display a similar pattern of
homologs in a set of organisms, to a more restricted hypothe-
sis. We considered that modules within functional networks
could indeed reflect a stronger functional link among their
components than with the rest of the proteins. This stronger
functional link, even when all proteins in the networks are
part of the same functional classification, could consequently
be reflected in the correlated presence or absence of module
components across different organisms - that is, their phylo-
genetic profiles.
To verify this initial suggestion, we examined the correspond-
ing null hypothesis, that there is no phylogenetic correlation
of the proposed structures, which is based on a completely
uncorrelated distribution of phylogenetic profiles with
respect to the modular organization. We made use of a class
of statistical methods termed multi-response permutation
procedure (MRPP). MRPPs are commonly used in ecological
and environmental studies to compare an a priori group clas-
sification of a population in which measurements of r
responses (r ≥ 1) are obtained from each member of the pop-
ulation [25]. In contrast to well-known parametric statistical
techniques such as the univariate and multivariate analysis of
variance, MRPPs do not require any assumption with respect
to the distribution of the response measurements. In the
present case, proteins are the members of the population,
modules are the group classification, and the phylogenetic
profiles play the role of response measurements. A further
difference from standard statistical techniques is that
similarity measures, or normed distances, and not individual
object measurements, are the primary units of analysis.
Table 1
Global and follow-up analysis of the network modular organizations
Function Full Core
nM
ξ
PP
m
/P
m
†
ξ
PP
m
/P
m
†
Cellular fate 34 323 14 0.012 <0.001 2/5 16.7 0.035 <0.001 3/6 6.5
Energy 25 84 5 0.066 <0.001 1/1 12.4 0.156 <0.001 1/4 4.4
Metabolism 102 420 15 0.067 <0.001 2/8 15.7 0.177 <0.001 4/9 4.7
Cellular transport 32 336 15 0.014 <0.001 2/5 18.7 0.021 < 0.001 -/2 10.8
Cell cycle 26 514 13 0.012 <0.001 2/3 26.6 0.05 <0.001 2/7 8.5
Protein fate 48 352 18 0.014 0.004 -/9 15.3 0.03 0.001 -/10 8.7
Transport facilitation 20 63 4 0.034 0.047 1/1 10.7 0.372 0.097 1/1 6.5
Cellular environment 18 87 8 0.037 0.007 2/3 8.5 0.072 0.002 3/4 5.6
Protein synthesis 16 137 7 0.038 0.002 1/1 17.3 0.194 <0.001 2/5 4.8
Cell rescue 26 88 8 0.08 <0.001 1/2 7.7 0.108 <0.001 1/3 4.2
Signaling 14 67 6 0.017 0.082 -/2 9.3 0.018 0.157 -/2 6.2
Cellular organization 36 258 15 0.032 <0.001 1/7 12.3 0.097 <0.001 3/9 5.3
Transcription 40 654 21 0.019 <0.001 2/7 25.1 0.037 <0.001 4/9 12.3
For every functional network of size n, we applied the network clustering algorithm with a given number of branches in the clustering tree, .
These -values were chosen to be among those with significantly high average maximal overlap, that is, overlap equal to or greater than 0.8, low
overlap ratios, and meso-scale average module size, that is, ~5-25. The outcome of this algorithm is a modular organization with M modules. For
the follow-up analysis of both full and core components of the modules, third and fourth column groups, the following quantities are shown:
ξ
, the
overall statistic, P, statistical significance of global test, P
m
†
, number of modules whose branch length in the similarity dendrogram (see text for
details) is bigger than 0.1 in similarity units and P
m
, number of modules whose within-similarity is statistically significant (P < 0.05) in the modular test.
All P-values were obtained by means of an approximate permutation test with 10,000 randomizations and the use of binary phylogenetic profiles with
a threshold of E
th
= 1e
-6
in the BLAST E-value [35].
B
m
m
B
B
m
m
Genome Biology 2004, Volume 5, Issue 11, Article R93 Poyatos and Hurst R93.5
comment reviews reports refereed researchdeposited research interactions information
Genome Biology 2004, 5:R93
We compared the within-module scores to the between-mod-
ule scores. For each pair of modules we calculated each
between-module protein pairwise similarity and took the
average of these. To examine overall between-module simi-
larity we calculated a weighted mean correlation of all
between-module similarities. We then asked about the size of
the difference between the mean within-module score and the
mean between-module score, that is,
ξ
= - (see Materi-
als and methods). Significance was tested by randomization;
that is, we randomly permute the proteins within the modules
while keeping the global modular organization fixed (Figure
1b). Not all putative network modular organizations, accord-
ing to different s, are shown to be biologically significant.
However, we find for all networks a strong signal of phyloge-
netic correlation between genes in a module for some -val-
ues within the regime of high reliability of the algorithm
(Table 1 and Additional datafile 1).
We can extend the analysis to identify those modules showing
the strongest signal. We used a method based on the analysis
of each within-module similarity and the use of mean similar-
ity dendrograms. For every module, we subtracted from the
mean within-module similarity W
m
, the mean of all between-
module similarity , a sort of representative of all pairs of
between-module similarities: that is,
ξ
m
= W
m
- . We esti-
mated the significance of the values observed with such a
modular test by performing again an approximate permuta-
tion procedure with a Holm's correction to multiple testing
(Figure 1b and Materials and methods). This gives a signifi-
cance measure of which module similarities reflect correlated
evolution of their components in a particular functional
network.
Statistical significance does not supply any information on
the magnitude of the respective similarities. To this end, we
constructed a graphical representation, a mean similarity
dendrogram [26], with branches for each module joined at a
node plotted at . Branches terminate at W
m
, giving branch
lengths of
ξ
m
in similarity units (Figure 2). Those branches
with considerable positive length, for example,
ξ
m
equal to or
greater than 0.1, indicate correlated evolution of the respec-
tive module components according to the phylogenetic pro-
files of the whole functional network, even though some of
them could not be shown to be statistically significant because
of the conservative nature of Holm's test. Thus, this combined
approach provides both statistical significance and a clear
quantitative picture of the compactness and isolation of the
proposed modules. Figure 2 shows two examples of the appli-
cation of this approach to evaluate modular network struc-
tures with the use of mean similarity dendrograms and
phylogenetic profiles (we have chosen two small networks as
examples to show a full picture of the modular characteriza-
tion). Network phylogenetic profiles can be easily visualized
as a matrix whose columns display the presence or absence of
network nodes in a given organism and whose rows show the
presence or absence of a given node in all the organism set. It
then presents a full view of the degree of conservation of net-
work modules for a collection of organisms. The arrangement
of species in taxonomic groups is a convenient representation
of the relative conservation of modules across the different
lineages.
Module cores
Previous studies suggest that any given module may have a
module core and a periphery [10]. In addition, in an evolu-
tionary context, it is not clear to what extent full modules
should be present or absent in different species, considering
the tinkering aspect of most evolutionary processes. Can we
use the network method to discriminate a core and does the
core have a stronger phylogenetic correlation? To examine
this hypothesis, we selected the most connected components
of each module that was part of a given network, according to
their intra-modular connectivity, and applied again the over-
all and modular tests to these cores (see Materials and meth-
ods). We found a substantial increase in the validation of the
evolutionary significance of the modules revealed, for exam-
ple, by the presence of a bigger number of significant modules
(Table 1, 'core' column group). Such statistically significant
cores are mainly characterized by two distinct phylogenetic
profiles; either their components had profiles with homologs
present in all three kingdoms, or they had homologs present
only in Eukarya (Table 2). This agrees with previous results
and seems to support a picture of network assembly with a
combination of ancient and modern modules [12,24,27].
The phylogenetic correlation suggests that this core architec-
ture is biologically meaningful. Such extracted structures
could then be used to probe this intermediate level of
organization even in the case of uncharacterized biological
systems. Owing to the extensive biochemical knowledge
about yeast we are ready to validate such hypothesis. We have
made use of the MIPs yeast complexes database [12,24] to
characterize the biological relevance of the cores (see Addi-
tional data file 1 for a full list of phylogenetically distinct mod-
ule cores and their biological characterization). As suggested,
many, but not all, of the cores describe a significant part of
relevant protein complexes, for example, anaphase-promot-
ing complex, prenyltransferases (Ftase, GGTase I and
GGTase II), some cytoplasmic translation initiation com-
plexes such as eIF2 and eIF2B, Kel1p/Kel2p complex and
Gim complexes (Table 3). Other module cores are not identi-
fied as parts of known protein complexes. This could mean
either that some of the cores correspond to uncharacterized
complexes or that these cores represent dynamic modules.
Dynamic modules control a particular cellular activity by
means of interactions of different proteins at different times
or places instead of by the assembly of a macromolecular
machine [1]. Thus, the combination of modular analysis and
W
D
B
B
D
D
D
R93.6 Genome Biology 2004, Volume 5, Issue 11, Article R93 Poyatos and Hurst />Genome Biology 2004, 5:R93
phylogenetic correlation is useful to find relevant compo-
nents of biological systems.
Do we also find that the significantly phylogenetically corre-
lated cores have other properties of biologically relevant
cores, that is, show a high degree of coexpression? We exam-
ined both the extent of coexpression [28] and degree of simi-
larity in 5' motifs [29], the latter being an indirect method of
assaying possible expression parameters. As regards coex-
pression, most functional groups have cores with more simi-
lar coexpression than expected by chance, but the significance
levels tend to be low and hence the effect, while widespread,
is relatively weak. This is probably a consequence of the
dynamic organization of modularity [15], a phenomenon pre-
viously observed in protein complexes [28] (Table 4 and
Materials and methods). This weakness is similarly reflected
in the extent of sharing of 5' motifs. This latter result is prob-
ably as expected, given a lack of certainty over the relevance
of many motifs and the fact that two genes of similar expres-
sion profile can have different motifs.
Do the modules also represent units of homogeneity of dis-
pensability? That is, if one protein in the core is lethal are all
lethal, if one is dispensable are all dispensable? This can be
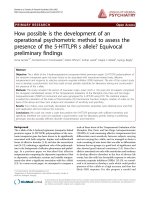
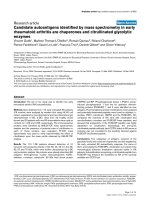
Modular organization, mean similarity dendrogram and phylogenetic profileFigure 2
Modular organization, mean similarity dendrogram and phylogenetic profile. Modular organization, mean similarity dendrogram and phylogenetic profile of
(a-c) cellular rescue, and (d-f) cellular environment functional networks. (a-d) Modular organization extracted with the network clustering algorithm.
Protein interactions are plotted in brown. Modules are highlighted in white. Proteins within each module have been reorganized to show those with the
greatest intra-modular connectivity - the core proteins - in the center of the module. (b,e) Mean similarity dendrograms. Branches for each corresponding
module in (a) and (d) are joined at a node plotted at . Branches terminate at the mean similarity of each module, W
m
, giving branch lengths of W
m
-
in similarity units. Dendrograms related to full modules are in black and those corresponding to the core components are in red. Those branches
statistically significant (P < 0.05) end in a circle. (c,f) Continuous phylogenetic profiles color-coded from dark blue (maximal homology) to brown (no
homology). Columns show the presence or absence of network nodes in a given organism and rows show the presence or absence of a given node in all
the organism set. Species are arranged in taxonomic groups separated by white dashed vertical lines: Bacteria (left), Archaea (center), and Eukarya (right)
(see Additional data file 1). The horizontal white dashed lines represent the localization of modules. A quick look at these figures provides evidence that
proteins that are part of the same module exhibit a loosely correlated degree of conservation, as should be the case if modules represent some sort of
discrete functional unit. This argument is quantitatively estimated by the branch length in the mean similarity dendrogram and the corresponding statistical
significance.
Proteins
Proteins
Proteins
Proteins
Proteins
Proteins
0.6 1
B
lank
space
her
e
B
lank
space
her
e
0.8
0.6 10.8
Bacteria Archaea Eukarya
Bacteria Archaea Eukarya
Blank
space
here
Max
Min
(a) (b) (c)
(d) (e) (f)
D D
Genome Biology 2004, Volume 5, Issue 11, Article R93 Poyatos and Hurst R93.7
comment reviews reports refereed researchdeposited research interactions information
Genome Biology 2004, 5:R93
quantified by the absolute distance of the ratio of lethal pro-
teins in the core (0 ≤ ratio ≤1) to 1/2. We then sum these dis-
tances for the relevant cores in each network and estimate
statistical significance by randomization (Figure 1b). We find
some cases where there is indeed higher homogeneity than
expected (Table 4). But does this also mean that the modules
all contain more lethals than expected? We find that for some
functional groups this is indeed very profoundly the case.
However, for other functional groups this is not so (Table 4).
Assuming that the putative functional group of a protein can
be assigned blind to genes, this method then has the potential
Table 2
Conservation properties of module core components for those functional networks with more than one statistically significant module
core
Conservation
Function (B,A,E) (-,-,E)
Cell fate 0(0) 6(3)
Metabolism 3(1) 6(3)
Cellular organization 3(0) 6(3)
Cellular environment 3(2) 1(1)
Protein synthesis 3(0) 2(2)
Transcription 1(1) 8(3)
Cell cycle 0(0) 7(2)
Conservation of components follows two distinct patterns: module core components are conserved in all three kingdoms: (B,A,E) Bacteria, Archaea
and Eukarya, or are only present in eukaryotes, (-,-,E). The table shows the number of module cores, with branch length
ξ
m
≥ 0.1, whose components
have a representative phylogenetic profile of either type. Conservation profiles of statistically significant core components is shown in parenthesis.
See also Table 1.
Table 3
List of complexes significantly represented in the phylogenetically distinct module cores
Function Cores (r
cc
≥ 5) Complexes
Cell fate 6 (2) Actin-associated motor protein, 431
Energy 4 (2) 47, 346, Serine/threonine phosphoprotein phosphatase
Metabolism 9 (3) 521, GGTase II, OT
Cellular transport 2 (2) Class C Vps, 239, 77, AP-3, AP-2
Cell cycle 7 (4) Tubulins, CA, AP, 3, OR, SCF-GRR1, SCF-CDC4, RI
Protein fate 10 (5) Vps, Class C Vps, 71, 77, FT, GGTase I, 168, 651, OT, AP, 23
Transport facilitation 1 (1) TOM
Cell environment 4 (3) STE5-MAPK, Kel1p/Kel2p, 521
Protein synthesis 5 (2) elF3, elF2B, elF2, 340, 339, 613
Cell rescue 3 (3) No complexes
Signaling 2 (1) 167, 308, 521
Cell organization 9 (6) 272, 5, 71, 289, casein kinase II, 181, 167, Gim
Transcription 9 (6) 154, RM, RP, Ma, Cbf, Mb, 126, NSP1, TF, 178, CPK, 634, 160, CF
Numbers correspond to those complexes found by systematic analysis as described in MIPS [23]. Abbreviations: AP, anaphase-promoting complex;
CA, chromatin-assembly complex; Cbf, Cbf1/Met4/Met28; CF, core factor; CPK, cAMP-dependent protein kinase; FT, farnesyltransferase; GGTase I,
geranylgeranyltransferase I; GGTase II, geranylgeranyltransferase II; Ma, Met4/Met28/Met32; Mb, Met4/Met28/Met31; OR, origin-recognition
complex; OT, oligosaccharyltransferase; RI, replication initiation complex; RM, RNase MRP; RP, RNase P; TF, TFIIIC; TOM, transport across the
outer membrane complex; Vps, Vps35/Vps29/Vps2. Here, r
cc
is the ratio between the number of complex components being part of a core and the
total number of complex constituents.
R93.8 Genome Biology 2004, Volume 5, Issue 11, Article R93 Poyatos and Hurst />Genome Biology 2004, 5:R93
to narrow down the possible drug targets in poorly described
species. Perhaps as expected, cell-cycle, protein synthesis and
transcription-related modules have the most significant ten-
dency to amass lethal genes. Could we apply the knowledge of
validated network structures in a therapeutical context, for
instance to identify targets for antimicrobials? In principle,
identifying candidate proteins as antimicrobial targets is
straightforward: the protein needs to be in the microbe and
not the host and to be essential to the microbe. To this end, we
calculated the probability of finding lethal genes in the set of
proteins without human homolog belonging to the significant
cores. We compared this with the probability of finding lethal
genes in those yeast proteins not found in humans which are
part of the full network. While the data on which genes are
essential is questionable, owing to condition-dependent
lethality [30], the ratio of these two measures should give an
indication of the extent to which our method improves the
search strategy. Crucially, the method greatly increases the
probability of finding such essential genes (Table 4). Some of
these targets in yeast could be, for instance, the proteins
APC4, ORC6 or POP5, which are part of complexes involved
in the functional categories mentioned earlier (see Additional
data file 1 for a detailed list).
Conclusions
We have shown that by combining protein-protein data and
phylogenetic information it is possible to systematically
describe biologically relevant modules in protein networks
which partially correlate with other types of organization. The
analysis also suggests, however, that not all core modules
within the functional network are equally vital for the organ-
ism's survival. This may just reflect condition-dependent
lethality [30]. Indeed, the fact that fewer than half of the core
metabolic modules show significant enrichment for lethal
genes is possibly due to such condition-dependency. Given
this result, in the development of antimicrobials it seems
wiser to attack modules related to transcription, protein syn-
thesis and the cell cycle than it is to attack metabolic path-
ways. This simple example hints at the relevance of
knowledge about the modular organization of networks in
other therapeutic settings, such as that in cancer, to home in
on which modules and which parts of modules within these
systems should be selected in a putative list of potential drug
candidates. Overall, our results contribute to validate the rel-
evance of the modular level of organization of biochemical
networks.
Materials and methods
Data
We used two databases as of July 2003: MIPS [23], contrib-
uting 9,036 protein interactions; and DIP [31], contributing
15,116 interactions. Networks were assembled using a joint
set of interactions after filtering common pairs. Protein infor-
mation for the fully sequenced organisms selected is available
Table 4
Statistical significance of the overall analysis of coexpression, common 5' regulatory motifs, homogeneity in dispensability and lethality
for the phylogenetically distinct module cores
Function P-exp P-mot P-hom P-let p-core p-net
Cell fate <0.05 - - <0.05 0.28 0.08
Energy - <.005 - - 0 0.05
Metabolism <0.0005 <0.05 - <0.01 0.14 0.08
Cellular transport - - < 0.01 - None 0.28
Cell cycle <0.05 - < 0.05 0.0001 0.35 0.29
Protein fate <0.0005 - - - 0.41 0.16
Transport facilitation 0.50.15
Cell environment - - - <0.05 0 0.06
Protein synthesis <0.05 - < 0.0005 0.0001 0.2 0.06
Cell rescue <0.05 - - - 0 0.12
Signaling 00.12
Cell organization <0.01 <0.05 - - 0.08 0.12
Transcription <0.05 <0.01 <0.01 <0.001 0.68 0.3
Statistical significance (P-values), of the overall analysis of coexpression (P-exp), common 5' regulatory motifs (P-mot), homogeneity in dispensability
(P-hom) and lethality (P-let), for the phylogenetically distinct module cores (see text and Materials and methods for details). Not significant statistical
results are denoted by p-core is the probability of finding lethal genes in the set of proteins without human homolog belonging to the significant
cores. p-net is the probability of finding lethal genes in those proteins not found in humans which are part of each full network.
Genome Biology 2004, Volume 5, Issue 11, Article R93 Poyatos and Hurst R93.9
comment reviews reports refereed researchdeposited research interactions information
Genome Biology 2004, 5:R93
at the website of the European Bioinformatics Institute [32].
A dataset on the presence of 5' regulatory motifs was down-
loaded from the Church Laboratory [33]. Expression data was
obtained from a whole-genome mRNA expression data com-
piled by the Eisen laboratory [34].
Network clustering matrices
Network clustering can be based on a global property, that is,
L-based clustering, where L is referred to the shortest path
length between two nodes in the network. From the interac-
tion network, a matrix of distances is computed and trans-
formed into an 'association' matrix by taking 1/L
2
[10]. A
second approach to network clustering is based on a local
property, C-based clustering, where C is a generalized local
connectivity coefficient measuring common interactors of
any two proteins in the interaction graph [8,9,11] given by
Here | | denotes the size of the set, ∩ the intersection and
Adj(i) the adjacency matrix, that is, the set of proteins inter-
acting with protein i. Local properties tend to be more robust
[11].
Module overlap
Given two different modules, M
i
, M
j
, we considered the fol-
lowing overlap [13]:
with | | denoting the size of the set and ∩ the intersection.
The average overlap used to determine the number of
branches present in the clustering tree ( ) is given by:
In this case, |C| and |L| denote the number of C-based and L-
based modules extracted in a given functional network.
Network small-worldness
To characterize the small-world property of the networks, we
first calculated the clustering coefficient, , and characteris-
tic path length, L, for all assembled networks. = 2j/m(m -
1), the ratio between the number of interactions found among
the m proteins connected to a given one, say j, and the maxi-
mal potential number of such interactions, which equals m(m
- 1)/2 for a undirected graph. We obtained high values of such
clustering coefficient and small characteristic path length for
all cases, reflecting the small-worldness of the networks. To
assess the statistical significance of these values, we gener-
ated 100 randomly rewired graphs for each functional net-
work with the algorithm described in [21]. All cases were
shown to be highly significant (P = 0.01), that is,
, and L ≥ L
random
(we obtained P < 0.05 for L in
the case of the energy network).
Phylogenetic profiles
We calculated binary and continuous phylogenetic profiles
[18] for different threshold values, obtaining robust results
for all discussed tests in both cases. For each yeast protein of
interest, BLAST searches were done against 70 proteomes of
species from the Archaea (14), Bacteria (47), and Eukarya (9)
(see organism list in Additional data file 1). BLAST hits with
Karlin-Altschul E-values bigger than a given threshold, E
th
,
were considered absent [35]. A particular value is then
assigned to each homolog present, characterizing in this way
every protein by means of a phylogenetic vector. For continu-
ous profiles, homologs receive a score of -1/logE and the
absent ones receive a score of -1/logE
th
. For the binary case,
profiles take the value 1 or 0 when the E-values are below or
above the threshold, respectively. Finally, note that E-values
were corrected to account for the different database sizes.
Results in the main text are for the case of binary phylogenetic
profiles and a threshold value of E
th
= 1e
-6
.
Multi-response permutation procedures
Non-parametric randomization methods, such as MRPP,
have several advantages compared to more well-known para-
metric procedures. In particular, if the assumption of nor-
mally distributed populations is not reasonable, the datasets
have multiple measurements and if multivariate comparisons
are desired [25].
Similarity measure
Given two binary phylogenetic profiles corresponding to pro-
teins i, and j, we considered the following matching coeffi-
cient as a simple similarity measure: S
ij
= (x + w)/(x + y + z +
w), where x is the number of homologs present in both phyl-
ogenetic profiles, y is the number present in profile i only and
z is the number present in profile j only. Finally, w is the
number of absent homologs in both profiles.
Mean within and between similarities
Within similarity
Here, c
m
is the ratio between the number of components of
module m, n
m
, and the number of components of all modules,
N
M
, that is, c
m
= n
m
/N
M
, W
m
is the mean of similarities
between proteins belonging to module m, and M is the total
number of modules.
Between similarity:
C
Adj i Adj j
min Adj i Adj j
ij
=
∩
()
() ( )
(), ( )
.()1
O
MM
MM
ij
ij
υ
,
,=
∩
12
B
O
C
max Ov
C
c
cl
lL
=
∑
=
1
1
{{ } } .
,
C
C
CC
random
>>
WcW
mm
m
M
=
∑
.
R93.10 Genome Biology 2004, Volume 5, Issue 11, Article R93 Poyatos and Hurst />Genome Biology 2004, 5:R93
Here, c
m,s
is the ratio between the product of the number of
components of modules m and s, n
m-
n
s
, and the total number
of components squared, N
2
M
, that is c
m,s
= n
m
n
s
/N
2
M
. W
m,s
is
the mean of similarities between proteins of modules m and
s, and M is the total number of modules. Results for all dis-
cussed tests were robust to the use of Euclidean distances
with continuous profiles instead of similarities with binary
profiles, as it is argued in the main text.
Holm's test
The Holm test [36] is a method that gets round the problem
of the Bonferroni procedure being too conservative, by means
of the added power of sequential stepping versions of the tra-
ditional Bonferroni tests. The procedure behind the Holm
test is to find all the P-values for a set of k individual tests that
are being performed and then rank them from smallest to
largest. While Bonferroni would compare all null hypothesis
to the same value
α
, the Holm test compares the smallest to
α
/k and, in case of rejection of the null case, to decreasing val-
ues
α
/(k - 1), until failing to reject the null.
To perform the MRPP Holm test, we computed the branch
length, that is, W
m
- (see above) and determined the unad-
justed P-value for each module by means of a permutation
test with 10,000 randomizations. Suppose that we have M
modules. We assemble an ordered vector of size M whose
components are the uncorrected P-values in increasing order,
that is, P
1
is the smallest uncorrected P-value and P
M
is the
largest. To adjust a particular vector component P
i
we multi-
ply this component by A
i
= (M - i + 1), thus generating a vector
P for adjusted P-values. The added power of the Holm test can
then be seen in a simple example. Imagine the case of three
modules, that is, M = 3. The uncorrected P-values of the cor-
responding MRPP tests are: P
ν
= (0.01, 0.02, 0.03). A Bonfer-
roni procedure for multiple testing would consider only the
first test as significant according to a 0.05 significancy thresh-
old. However, the adjusted P-values obtained with the Holm
test would imply that all tests are significant, that is, = P
ν
× (3,2,1) = (0.03, 0.04, 0.04).
Core components
To obtain the core component of the modules, we selected for
each module those components with more than two interac-
tions, for the case of a module whose component with maxi-
mal number of interactions (MNI) is less than ten, or those
components with more than four interactions for the case of
a module whose component with MNI is equal to or greater
than 10. Slight modifications to these rules produced similar
results.
5' regulatory motifs, coexpression and lethality of
module cores
For each of the significant module cores,
ξ
m
≥ 0.1, we calcu-
lated the mean of pairwise Euclidean distances between
expression vectors of proteins belonging to a given module
core. In the case of the 5' motifs, the statistic measures the
number of regulatory motifs common to at least more than
half of the core size. Finally, for each significant core, we sim-
ply measured the number of components that are lethal. The
overall statistic for all cases is the sum of each corresponding
measure in each core weighted by the ratio of the core size vs
network size. P values are obtained with 10,000
randomizations.
Additional data files
Additional data file 1, available with the online versin of this
article, includes a discussion on the network clustering algo-
rithm, the list of species and lineages for the phylogenetic
profiles, and a list of phylogenetically distinct module core
components and their biological characterization.
Additional data file 1A discussion on the network clustering algorithm, the list of species and lineages for the phylogenetic profiles, and a list of phylogenet-ically distinct module core components and their biological characterizationA discussion on the network clustering algorithm, the list of species and lineages for the phylogenetic profiles, and a list of phylogenet-ically distinct module core components and their biological characterizationClick here for additional data file
Acknowledgements
J.F.P thanks H.J. Dopazo, R. Díaz-Uriarte and, especially, J. Van Sickle for
fruitful discussions, and the Evolutionary Systems Biology Initiative at CNIO
and M. Baena for valuable comments. This research has been supported by
the Spanish MCyT (Ministry of Science and Technology) Ramón y Cajal Pro-
gram (J.F.P) and the UK Biotechnology and Biological Sciences Research
Council (L.D.H.).
References
1. Hartwell LH, Hopfield JJ, Leibler S, Murray A: From molecular to
modular cell biology. Nature 1999, 402:C47-C52.
2. Milo R, Shen-Orr S, Itzkovitz S, Kashtan N, Chklovskii D, Alon U:
Network motifs: simple building blocks of complex
networks. Science 2002, 298:824-827.
3. Shen-Orr SS, Milo R, Mangan S, Alon U: Network motifs in the
transcriptional regulation network of Escherichia coli. Nat
Genet 2002, 31:64-68.
4. Lee TI, Rinaldi NJ, Robert F, Odom DT, Bar-Joseph Z, Gerber GK,
Hannett NM, Harbison CT, Thompson CM, Simon I, et al.: Tran-
scriptional regulatory networks in Saccharomyces cerevisiae .
Science 2002, 298:799-804.
5. Yeger-Lotem E, Sattath S, Kashtan N, Itzkovitz S, Milo R, Pinter RY,
Alon U, Margalit H: Network motifs in integrated cellular net-
works of transcription-regulation and protein-protein
interaction. Proc Natl Acad Sci USA 2004, 101:5934-5939.
6. Snel B, Bork P, Huynen M: The identification of functional mod-
ules from the genomic association of genes. Proc Natl Acad Sci
USA 2002, 99:5890-5895.
7. Maslov S, Sneppen K: Specificity and stability in topology of pro-
tein networks. Science 2002, 296:910-913.
8. Ravasz E, Somera A, Mongru D, Oltvai Z, Barabasi A: Hierarchical
organization of modularity in metabolic networks. Science
2002, 297:1551-1555.
9. Spirin V, Mirny L: Protein complexes and functional modules in
molecular networks. Proc Natl Acad Sci USA 2003,
100:12123-12128.
10. Rives A, Galitski T: Modular organization of cellular networks.
Proc Natl Acad Sci USA 2003, 100:1128-1133.
11. Goldberg D, Roth F: Assessing experimentally derived interac-
tions in a small world. Proc Natl Acad Sci USA 2003, 100:4372-4376.
12. Stuart J, Segal E, Koller D, Kim S: A gene-coexpression network
for global discovery of conserved genetic modules. Science
2003, 302:249-255.
DcW
ms ms
sm
M
m
M
=
>
∑∑
,,
.
D
P
v
Genome Biology 2004, Volume 5, Issue 11, Article R93 Poyatos and Hurst R93.11
comment reviews reports refereed researchdeposited research interactions information
Genome Biology 2004, 5:R93
13. Ihmels J, Friedlander G, Bergmann S, Sarig O, Ziv Y, Barkai N:
Revealing modular organization in the yeast transcriptional
network. Nat Genet 2002, 31:370-377.
14. Segal E, Shapira M, Regev A, Pe'er D, Botstein D, Koller D, Friedman
N: Module networks: identifying regulatory modules and
their condition-specific regulators from gene expression
data. Nat Genet 2003, 34:166-176.
15. Han JD, Bertin N, Hao T, Goldberg DS, Berriz GF, Zhang LV, Dupuy
D, Walhout AJ, Cusick ME, Roth FP, Vidal M: Evidence for dynam-
ically organized modularity in the yeast protein-protein
interaction network. Nature 2004, 430:88-93.
16. Tanay A, Sharan R, Kupiec M, Shamir R: Revealing modularity and
organization in the yeast molecular network by integrated
analysis of highly heterogeneous genomewide data. Proc Natl
Acad Sci USA 2004, 101:2981-2986.
17. Barabasi AL, Oltvai ZN: Network biology: understanding the
cell's functional organization. Nat Rev Genet 2004, 5:101-113.
18. Pellegrini M, Marcotte E, Thompson M, Eisenberg D, Yeates T:
Assigning protein functions by comparative genome analy-
sis: protein phylogenetic profiles. Proc Natl Acad Sci USA 1999,
96:4285-4288.
19. Snel B, Huynen M: Quantifying modularity in the evolution of
biomolecular systems. Genome Res 2004, 14:391-397.
20. Everitt BS, Landau S, Leese M: Cluster Analysis 4th edition. London:
Arnold; 2001.
21. Watts D, Strogatz S: Collective dynamics of 'small-world'
networks. Nature 1998, 393:440-442.
22. von Mering C, Krause R, Snel B, Cornell M, Oliver S, Fields S, Bork P:
Comparative assessment of large-scale data sets of protein-
protein interactions. Nature 2002, 417:399-403.
23. Mewes H, Frishman D, Guldener U, Mannhaupt G, Mayer K, Mokrejs
M, Morgenstern B, Munsterkotter M, Rudd S, Weil B: MIPS: a data-
base for genomes and protein sequences. Nucleic Acids Res
2002, 30:31-34.
24. Qin H, Lu H, Wu W, Li W: Evolution of the yeast protein inter-
action network. Proc Natl Acad Sci USA 2003, 100:12820-12824.
25. Mielke PW, Berry KJ: Permutation Methods: A Distance Function
Approach Berlin: Springer; 2001.
26. VanSickle J: Using mean similarity dendograms to evaluate
classifications. J Agric Biol Environ Stat 1997, 2:370-388.
27. Wuchty S, Oltvai Z, Barabasi A: Evolutionary conservation of
motif constituents in the yeast protein interaction network.
Nat Genet 2003, 35:176-179.
28. Jansen R, Greenbaum D, Gerstein M: Relating whole-genome
expression data with protein-protein interactions. Genome Res
2002, 12:37-46.
29. Simonis N, van Helden J, Cohen GN, Wodak SJ: Transcriptional
regulation of protein complexes in yeast. Genome Biol 2004,
5:R33.
30. Papp B, Pál C, Hurst LD: Metabolic network analysis of the
causes and evolution of enzyme dispensability in yeast. Nature
2004, 429:661-664.
31. Xenarios I, Salwinski L, Duan X, Higney P, Kim S, Eisenberg D: DIP,
the Database of Interacting Proteins: a research tool for
studying cellular networks of protein interactions. Nucleic
Acids Res 2002, 30:303-305.
32. European Bioinformatics Institute []
33. Church Lab []
34. Eisen Lab []
35. Korf I, Yandell M, Bedell J: BLAST Sebastopol, CA: O'Reilly; 2002.
36. Holm S: A simple sequentially rejective multiple test
procedure. Scand J Statist 1979, 6:65-70.