Báo cáo y học: "Large-scale 13C-flux analysis reveals mechanistic principles of metabolic network robustness to null mutations in yeast" pptx
Bạn đang xem bản rút gọn của tài liệu. Xem và tải ngay bản đầy đủ của tài liệu tại đây (403.5 KB, 16 trang )
Genome Biology 2005, 6:R49
comment reviews reports deposited research refereed research interactions information
Open Access
2005Blanket al.Volume 6, Issue 6, Article R49
Research
Large-scale
13
C-flux analysis reveals mechanistic principles of
metabolic network robustness to null mutations in yeast
Lars M Blank, Lars Kuepfer and Uwe Sauer
Address: Institute of Biotechnology, ETH Zürich, 8093 Zürich, Switzerland.
Correspondence: Uwe Sauer. E-mail:
© 2005 Blank et al.; licensee BioMed Central Ltd.
This is an Open Access article distributed under the terms of the Creative Commons Attribution License (
which permits unrestricted use, distribution, and reproduction in any medium, provided the original work is properly cited.
Large-scale 13
C
-flux analysis in yeast<p>Genome-scale 13<sup>C</sup>-flux analysis in Saccharomyces cerevisiae revealed that the apparent dispensability of knockout mutants with metabolic function can be explained by gene inactivity under a particular condition, by network redundancy through dupli-cated genes or by alternative pathways.</p>
Abstract
Background: Quantification of intracellular metabolite fluxes by
13
C-tracer experiments is
maturing into a routine higher-throughput analysis. The question now arises as to which mutants
should be analyzed. Here we identify key experiments in a systems biology approach with a
genome-scale model of Saccharomyces cerevisiae metabolism, thereby reducing the workload for
experimental network analyses and functional genomics.
Results: Genome-scale
13
C flux analysis revealed that about half of the 745 biochemical reactions
were active during growth on glucose, but that alternative pathways exist for only 51 gene-encoded
reactions with significant flux. These flexible reactions identified in silico are key targets for
experimental flux analysis, and we present the first large-scale metabolic flux data for yeast,
covering half of these mutants during growth on glucose. The metabolic lesions were often
counteracted by flux rerouting, but knockout of cofactor-dependent reactions, as in the adh1, ald6,
cox5A, fum1, mdh1, pda1, and zwf1 mutations, caused flux responses in more distant parts of the
network. By integrating computational analyses, flux data, and physiological phenotypes of all
mutants in active reactions, we quantified the relative importance of 'genetic buffering' through
alternative pathways and network redundancy through duplicate genes for genetic robustness of
the network.
Conclusions: The apparent dispensability of knockout mutants with metabolic function is
explained by gene inactivity under a particular condition in about half of the cases. For the remaining
207 viable mutants of active reactions, network redundancy through duplicate genes was the major
(75%) and alternative pathways the minor (25%) molecular mechanism of genetic network
robustness in S. cerevisiae.
Background
The availability of annotated genomes and accumulated bio-
chemical evidence for individual enzymes triggered the
reconstruction of stoichiometric reaction models for net-
work-based pathway analysis [1,2]. For many microbes, such
network models are available at the genome scale, providing
a largely comprehensive metabolic skeleton by interconnect-
ing all known reactions in a given organism [3,4]. Thus, net-
work properties such as optimal performance, flexibility to
cope with ever-changing environmental conditions, and
Published: 17 May 2005
Genome Biology 2005, 6:R49 (doi:10.1186/gb-2005-6-6-r49)
Received: 1 February 2005
Revised: 8 March 2005
Accepted: 6 April 2005
The electronic version of this article is the complete one and can be
found online at />R49.2 Genome Biology 2005, Volume 6, Issue 6, Article R49 Blank et al. />Genome Biology 2005, 6:R49
enzyme dispensability (also referred to as robustness or
genetic robustness [5,6]) become mathematically tractable.
These computational advances are matched with post-
genomic advances in experimental methods that assess the
cell's molecular make-up at the level of mRNA, protein, or
metabolite concentrations. As the functional complement to
these compositional data, quantification of intracellular in
vivo reaction rates or molecular fluxes has been a focal point
of method development in the realm of metabolism [7-9].
Recent progress in increasing the throughput of stable-iso-
tope-based flux analyses [8,10,11] has allowed the quantifica-
tion of flux responses to more than just a few intuitively
chosen genetic or environmental perturbations [12-14]. Now
that flux quantification in hundreds of null mutants under a
particular condition is feasible in principle, the question
arises of which mutants should be analyzed.
As perhaps the most widely used model eukaryote, the yeast
Saccharomyces cerevisiae features a metabolic network of
about 1,200 reactions that represent about 750 biochemically
distinct reactions [3,15]. Is it necessary to quantify flux
responses to null mutations in all reactions for a comprehen-
sive view of the metabolic capabilities under a given condi-
tion? To address this question, we used a recently modified
version (iLL672; L Kuepfer, U Sauer and LM Blank, unpub-
lished work) of the original iFF708 genome-scale model pub-
lished by Förster et al. [3]. On the basis of this model, we
estimated the genome-scale flux distribution in wild-type S.
cerevisiae from
13
C-tracer experiments, to identify the 339
biochemical reactions that were active during growth on glu-
cose. Yeast metabolism has the potential flexibility to use
alternative pathways for 105 of these active reactions. For a
major fraction of the potentially flexible reactions that cata-
lyze significant flux, we then constructed prototrophic knock-
out mutants to elucidate whether or not the alternative
pathway was used upon experimental knockout; that is,
whether it contributes to the genetic robustness of the net-
work [5,6]. For the purpose of this work, robustness is defined
as the ability to proliferate on glucose as the sole carbon
source upon knockout of a single gene with metabolic
function.
Results
Identification of flexible reactions in yeast metabolism
To identify all potentially flexible reactions in yeast glucose
metabolism that were active under a given condition, we used
the recently reconciled metabolic network model iLL672 with
1,038 reactions (encoded by 672 genes) that represent 745
biochemically distinct reactions (L Kuepfer, U Sauer and LM
Blank, unpublished work), which was based on the genome-
scale S. cerevisiae model iFF708 [3]. The main modifications
to the original model include elimination of dead-end reac-
tions and a new formulation of cell growth. It should be noted
that none of the results below critically depended on the net-
work model, but the reconciliation of iLL672 enabled a more
accurate discrimination between lethal and viable reactions
than iFF708, as was validated by large-scale growth experi-
ments (L Kuepfer, U Sauer and LM Blank, unpublished
work).
First, we identified all reactions active in wild-type glucose
metabolism by genome-scale flux analysis. For this purpose,
we determined the wild-type flux distribution in central
metabolism from a stable isotope batch experiment with 20%
[U-
13
C] and 80% unlabeled glucose. This flux solution was
then mapped to the genome scale by using minimization of
the Euclidean norm of fluxes as the objective function. In
total, 339 of the 745 biochemical reactions were active during
growth on glucose alone (Figure 1 and Additional data file 1),
which agrees qualitatively with the estimate of Papp et al.
[16]. Most active reactions (234) were essential: 155 are
encoded by singleton genes, 64 by two or more duplicate
genes and 15 by yet unknown genes (Figure 1; Additional data
file 1). In the entire network, only the remaining 105 reactions
(30 encoded by yet unknown genes) were active and poten-
tially flexible in the sense that they may be bypassed via alter-
native pathways (Figure 1). As fluxes in the peripheral
reactions were typically below 0.1% of the glucose uptake rate
(see Additional data file 1), we focused on the 51 gene-
encoded flexible reactions that catalyzed a flux of at least
0.1%. These 51 reactions were encoded by 75 genes (43 dupli-
cates, 23 singletons and 9 multiprotein complexes).
Physiological fitness of mutants deleted in flexible
reactions
In 38 of these genes, which encoded 28 of the 51 potentially
flexible and highly active reactions, we constructed pro-
totrophic deletion mutants by homologous recombination
[17] in the physiological model strain CEN.PK [18] (Figure 2).
The prototrophic background was chosen to minimize poten-
tial problems of amino-acid supplementation for quantitative
analysis [19]. These 38 experimental knockouts were in the
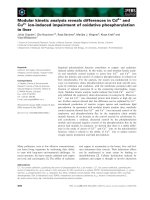
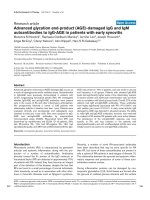
Genome-wide proportion of active, essential and flexible metabolic reactions during growth of S. cerevisiae (iLL672) on glucoseFigure 1
Genome-wide proportion of active, essential and flexible metabolic
reactions during growth of S. cerevisiae (iLL672) on glucose. Flexible
reactions are defined as having a non-zero flux but are not essential for
growth. The number of genes that encode biochemical reactions is given in
parentheses.
Total reactions of iLL672: 745
Active reactions: 339
234 essential reactions encoded by:
- singleton genes: 155(124)
- duplicate genes: 64(150)
- unknown: 15
105 non-essential
reactions
Non-essential reactions: 105
flexible reactions encoded by:
-singleton genes: 52(47)
-duplicate genes: 23(46)
-unknown: 30
Genome Biology 2005, Volume 6, Issue 6, Article R49 Blank et al. R49.3
comment reviews reports refereed researchdeposited research interactions information
Genome Biology 2005, 6:R49
pentose phosphate (PP) pathway, tricarboxylic acid (TCA)
cycle, glyoxylate cycle, polysaccharide synthesis, mitochon-
drial transporters, and by-product formation (Figure 2, Table
1). Genetically, the knockouts encompass 14 singleton and 24
duplicate genes, including six gene families of which all mem-
bers were deleted.
With the exception of gnd1, all 38 mutants grew with glucose
as the sole carbon source. The lethal phenotype of the gnd1
mutant is consistent with a previous report [20] and is similar
to the gndA mutant in Bacillus subtilis [21]. As in B. subtilis,
we could select gnd1 suppressor mutants on glucose (data not
shown). To assess the quantitative contribution of each gene
to the organism's fitness, we determined maximum specific
growth rates in minimal and complex medium using a well-
aerated microtiter plate system [22]. Mutant fitness was then
expressed as the normalized growth rate, relative to the
growth rate of the reference strain (Table 1). In contrast to the
previously reported competitive fitness [20,23,24], the fit-
ness determined here is a quantitative physiological value.
In complex YPD medium, physiological fitness in the 38 via-
ble haploid mutants was generally in qualitative agreement
with the competitive fitness [20]. Quantitatively, however,
our data seem to allow a better discrimination (Table 1), and
significant differences between physiological and competitive
fitness were seen in the adh1, fum1, and gpd1 mutants. Only
threemutants - adh1, fum1, and gly1 - exhibited a fitness
defect of 20% or greater (Table 2). gly1 lacks threonine
aldolase, which catalyzes cleavage of threonine to glycine
[25], hence its phenotype remains unexplained because gly-
cine was present in the YPD medium.
Table 1
Fitness of mutants with deletions in flexible central metabolic reactions
Physiological fitness* Competitive fitness
†
Physiological fitness Competitive fitness
Mutants MM YPD YPD Mutants MM YPD YPD
Reference strain 1 1 1
adh1/YOL086C 0.47 0.57 0.79 mdh2/YOL126C 0.89 0.98 1.01
adh3/YMR083W 0.92 0.87 0.98 mdh3/YDL078C 1.00 0.96 1.01
ald5/YER073W 1.02 0.94 1 mls1/YNL117W 1 0.98 1
ald6/YPL061W 0.34 0.87 0.9 oac1/YKL120W 0.71 0.94 1.01
cox5A/YNL052W 0.63 0.91 1 pck1/YKR097W 1 0.96 1
ctp1/YBR291C 0.91 1 0.97 pda1/YER178W 0.41 0.98 1
dal7/YIR031C 0.94 0.85 1 pgm1/YKL127W 0.82 0.94 1
fum1/YPL262W 0.52 0.62 0.93 pgm2/YMR105C 0.90 1 1
gnd1/YHR183W 0 0.87 1.01 rpe1/YJL121C 0.33 0.94 0.88
gnd2/YGR256W 0.83 0.98 1 sdh1/YKL148C 0.72 0.94 1
gcv2/YMR189W 0.92 0.94 1 ser33/YIL074C 0.92 0.94 1.01
gly1/YEL046C 0.79 0.74 0.87 sfc1/YJR095W 0.84 0.96 1.01
gpd1/YDL022W 1 0.98 0.84 sol1/YNR034W 0.91 1 1.02
icl1/YER065C 1 1 1 sol2/YCRX13W 0.99 0.98 1
idp1/YDL066W 0.92 0.94 1.03 sol3/ YHR163W 0.71 0.94 1
idp2/YLR174W 0.86 0.96 0.95 sol4/ YGR248W 0.95 0.91 1.01
lsc1/YOR142W 1.05 0.93 1 tal1/ YLR354C 0.89 0.94 1
mae1/YKL029C 1.01 0.96 1 YGR043C 0.92 0.87 1.02
mdh1/YKL085W 0.72 0.91 1 zwf1/YNL241C 0.38 0.96 ND
*Physiological fitness is defined as the maximal specific growth rate of a mutant normalized to the reference strain CEN.PK 113-7D ho::kanMX4. The
average from triplicate experiments is shown. The standard deviation was generally below 0.05.
†
From Steinmetz et al. [20]. ND, not detected.
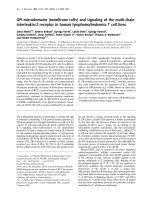
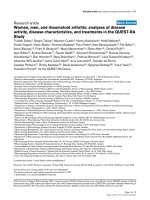
Central carbon metabolism of S. cerevisiae during aerobic growth on glucoseFigure 2 (see following page)
Central carbon metabolism of S. cerevisiae during aerobic growth on glucose. Gene names in boxes are given for reactions that were identified as flexible
by flux balance analysis. Dark gray boxes indicate mutants, for which the carbon flux distribution was determined by
13
C-tracer experiments. Dots indicate
that the gene is part of a protein complex. Arrowheads indicate reaction reversibility. Extracellular substrates and products are capitalized. C1, one-
carbon unit from C
1
metabolism.
R49.4 Genome Biology 2005, Volume 6, Issue 6, Article R49 Blank et al. />Genome Biology 2005, 6:R49
Figure 2 (see legend on previous page)
GLUCOSE
glucose-6-P
fructose-6-P
triose-3-P
acetaldehyde
acetate
succinate
α-ketoglutarate
isocitrate isocitrate
fumarate
pyruvate
ETHANOL
acetyl-CoA
malate
oxaloacetate
MITOCHONDRION
P-enol-
pyruvate
pyruvate
ACETATE
acetyl-CoA
oxaloacetate
3-P-glycerate
erythrose-4-P
sedoheptulose-7-P
ribulose-5-P
glyoxylate
malate
oxaloacetate
citrate
citrate
MAE1
6-P-glucono
-1,5-lactone
6-P-gluconate
acetate
acetaldehyde
ethanol
MDH1
FUM 1
MDH2
MDH3
GLY1
ZWF1
glucose-1-P
PGM 1
PGM 2
Thr
glycogen
trehalose
CTP1
SFC1
OAC1
PDA1\
ALD5
LSC1\
IDP2
IDP3
IDP1
ALD6
ADH1
ADH2
ADH5
SFA1
TAL1
YGR043c
GND1
GND2
SDH1\
SDH1b
SOL1
SOL2
SOL3
SOL4
ALD5
ALD4
ADH3
ADH4
GlySer
C1
GCV2\
SER33
SER3
GLYCEROL
GPD1
GPD2
glycerol-3-P
HOR2
RHR2
DIC1
YEL006W
YIL006W
COX5A\
COX5B\
H
+
ODC1
ODC2
Glu Glu
AGC1
α-ketoglutarate
2-oxoadipate
α-ketoglutarate
2-oxoadipate
xylulose-5-P
RPE1
CHA1
Glu
GDH1
GDH3
GAD1
UGA1
UGA2
GLT1
succinate
DAL7
MLS1
PCK1
ZWF1ZWF1ZWF1ZWF1ZWF1
KGD1\2
ICL1
ICL2
BPH1
glycerol
GUP1
GUP2
Genome Biology 2005, Volume 6, Issue 6, Article R49 Blank et al. R49.5
comment reviews reports refereed researchdeposited research interactions information
Genome Biology 2005, 6:R49
In general, growth on the single substrate reduced the meta-
bolic flexibility, as a much greater proportion of mutants
exhibited significant fitness defects (Table 2). Major fitness
defects were prominent in mutants of the PP pathway (gnd1,
rpe1, sol3, and zwf1), which indicates an increased demand of
NADPH for biosynthesis. Fitness of the fum1 mutant was
clearly lower than that of other TCA-cycle mutants, for which
duplicate genes exist. The strong phenotype of the fum1
mutant was somewhat unexpected because the flux through
the TCA cycle is generally low or absent in glucose batch cul-
tures of S. cerevisiae [13,14,26,27].
Intracellular carbon flux redistribution in response to
gene deletions
While physiological data quantify the fitness defect, they can-
not differentiate between intracellular mechanisms that bring
about robustness to the deletion. To identify how carbon flux
was redistributed around a metabolic lesion, we used meta-
bolic flux analysis based on
13
C-glucose experiments [8,9]. In
contrast to in vitro enzyme activities and expression data,
13
C-flux analysis provides direct evidence for such in vivo flux
rerouting or its absence. The flux protocol consists of two dis-
tinct steps: first, analytical identification of seven independ-
ent metabolic flux ratios with probabilistic equations from the
13
C distribution in proteinogenic amino acids [12,28,29]; and
second, estimation of absolute fluxes (in vivo reaction rates)
from physiological data and the flux ratios as constraints
[10,30]. The relative distribution of intracellular fluxes was
rather invariant in the 37 mutants, with the fraction of mito-
chondrial oxaloacetate derived through the TCA cycle flux
and the fraction of mitochondrial pyruvate originating from
malate as prominent exceptions (Figure 3).
Table 2
Overview of mutants with a fitness defect of at least 20% or altered flux distribution
Mutants Fitness defect in YPD Fitness defect in MM Altered intracellular flux distribution*
Total number of mutants 3 of 38 12 (+1)
†
of 38 11 of 38
Singleton genes fum1 gly1 fum1 pda1 fum1 pda1
gly1 rpe1 lsc1 rpe1
oac1 zwf1 mae1 zwf1
oac1
Duplicate genes adh1 adh1 sdh1 adh1 cox5A
ald6 sol3 ald6 mdh1
cox5A (gnd1)
mdh1
*See Figures 5 and 6.
†
Lethal mutations are given in parentheses.
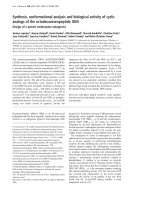
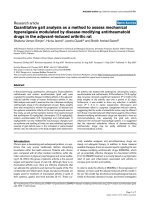
The distribution of six independently determined metabolic flux ratios in 37 deletion mutants during growth on glucoseFigure 3
The distribution of six independently determined metabolic flux ratios in
37 deletion mutants during growth on glucose. In each case, the median of
the distribution is indicated by a vertical line, the 25th percentile by the
grey box and the 90th percentile by the horizontal line. Data points
outside the 90th percentile are indicated by dots. The reference strain is
indicated by the open circle.
Relative activity (%)
(1) Oxaloacetate
mit
through TCA cycle
(3) PEP from oxaloacetate
cyt
(2) Serine through PP pathway
(4) Pyruvate
mit
from malate
(5) Serine from glycine
(6) Glycine from serine
zwf1rpe1
zwf1
pda1
fum1
fum1
0 20 40 60 80 100
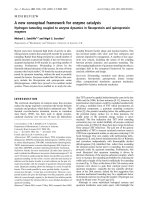
Absolute metabolic fluxes in the 37 flexible mutants as a function of glucose uptake rate or selected intracellular fluxesFigure 4 (see following page)
Absolute metabolic fluxes in the 37 flexible mutants as a function of glucose uptake rate or selected intracellular fluxes. (a-f) Glucose uptake rate; (g,h)
selected intracellular fluxes. The linear regression of the distribution and the 99% prediction interval are indicated by the solid and dashed lines,
respectively. Mutants with significant changes in the carbon-flux distribution are indicated. The reference strain is indicated by an open circle. Extreme flux
patterns were verified in 30-ml shake flask cultures (data not shown).
R49.6 Genome Biology 2005, Volume 6, Issue 6, Article R49 Blank et al. />Genome Biology 2005, 6:R49
Figure 4 (see legend on previous page)
Specific glucose uptake rate (mmol/g/h) Specific glucose uptake rate (mmol/g/h)
Ethanol secretion rate (mmol/g/h)
Glycerol secretion rate (mmol/g/h)
Acetate secretion rate (mmol/g/h)
PP pathway flux (mmol/g/h)
Malate dehydrogenase flux (mmol/g/h)
Malic enzyme flux (mmol/g/h)
zwf1
Succinate secretion rate (mmol/g/h)
Mitochondrial citrate synthase flux (mmol/g/h)
PEP carboxykinase flux (mmol/g/h)
TCA cycle flux (mmol/g/h)
cox5A
lsc1
ald6
adh1
cox5A
0.0 0.5 1.0 1.5 2.0 2.5
mae1
pda1
zwf1
rpe1
zwf1
ald6
fum
1
mdh1
0
0 5 10 15 20
Specific glucose uptake rate (mmol/g/h)
0 5 10 15 20
0 5 10 15 20
5
10
15
20
25
30
35
0.0
0.5
1.0
1.5
2.0
2.5
3.0
3.5
0.0
0.5
1.0
1.5
2.0
2.5
3.0
3.5
Specific glucose uptake rate (mmol/g/h)
0 5 10 15 20
0.0
0.5
1.0
1.5
2.0
2.5
3.0
3.5
Specific glucose uptake rate (mmol/g/h)
0 5 10 15 20
0.0
0.5
1.0
1.5
2.0
2.5
3.0
3.5
Specific glucose uptake rate (mmol/g/h)
0 5 10 15 20
0.0
0.5
1.0
1.5
2.0
2.5
3.0
3.5
0.0
0.5
1.0
1.5
2.0
2.5
3.0
3.5
0.0
0.2
0.4
0.6
0.8
1.0
1.2
0.0 0.5 1.0 1.5 2.0 2.5 3.0 3.5 4.0
(a) (b)
(c) (d)
(e) (f)
(g) (h)
Genome Biology 2005, Volume 6, Issue 6, Article R49 Blank et al. R49.7
comment reviews reports refereed researchdeposited research interactions information
Genome Biology 2005, 6:R49
From the experimentally determined uptake/production
rates and the flux ratios as constraints (Additional data file 3),
absolute intracellular fluxes were calculated using a compart-
mentalized stoichiometric model that consists of 35 reactions
and 30 metabolites (Additional data file 2). This flux model
comprised mostly the reactions of central carbon metabolism
that were most relevant to the genetic changes introduced. It
should be noted that the deleted reactions, with the exception
of pyruvate dehydrogenase (PDA1), were not omitted from
the network model; thus the calculated absence of flux
through a given reaction was independently verified from the
13
C-labeling data. In contrast to the relative distribution of
intracellular fluxes, absolute reaction rates varied signifi-
cantly in the mutants. With the exception of the flux through
the TCA cycle (Figure 4f) and the gluconeogenic PEP carbox-
ykinase (Figure 4d), all other fluxes generally increased with
increasing glucose uptake rates (Figure 4). Eleven of the 37
mutants, however, exhibited specific flux responses that devi-
ated from this general trend (Table 2, Figure 4).
Specific flux responses in singleton and duplicate gene
knockouts
Specific flux responses were more prominent among the sin-
gleton mutants (Table 2, Figure 4). Although the TCA cycle
flux through the NAD
+
-dependent fumarase reaction from
fumarate to malate was already very low in the reference
strain (Figures 3, 4f), the fum1 mutant exhibited a
pronounced phenotype with altered redox metabolism and
significant glycerol production (Figure 5). Inactivation of the
mitochondrial pyruvate dehydrogenase complex in the pda1
mutant was bypassed by the import of cytosolic acetyl-CoA
into the mitochondria. Inactivation of the oxidative PP path-
way branch in the zwf1 mutant was compensated by a
reversed flux in the non-oxidative PP pathway to provide the
biomass precursors pentose 5-phosphate and erythrose 4-
phosphate (Figure 5). Because the primary role of the PP
pathway on glucose is generation of NADPH, NADP
+
-
dependent mitochondrial malic enzyme flux was significantly
increased in the zwf1 mutant. This NADPH compensation by
malic enzyme was also suggested recently from co-feeding
experiments [31].
In contrast to singletons, deletion of flexible duplicate genes
could be compensated by either alternative pathways or
isoenzymes. In most cases, however, the isoenzymes were
used because no flux alteration was detected, with the a dh1,
ald6, cox5A, and mdh1 mutants as exceptions (Table 2). Dele-
tion of the major acetate-producing acetaldehyde dehydroge-
nase, the cytoplasmic ALD6 [32], significantly reduced
acetate formation. The primary effect of the deletion was the
strongly reduced glucose-uptake rate (Figure 4). Although a
major source of NADPH was inactivated in this mutant [33],
the PP pathway flux was not increased, but was even lower
than in the reference strain (Figure 6). This indicates that the
strongly decreased fitness of the ald6 mutant (Table 1) could
result from NADPH starvation - that is, a suboptimal rate of
NADP
+
reduction. Consistent with this, we estimated that the
NADPH requirement exceeded the combined NADPH forma-
tion from the oxidative PP pathway and malic enzyme by
70%, indicating that an as-yet-unidentified reaction(s) sub-
stitutes for the remaining NADPH production. Candidates
are the mitochondrial acetaldehyde dehydrogenase Ald4p
[34], which can use either NAD
+
or NADP
+
as redox cofactors
or the mitochondrial NADH kinase Pos5p [35]. Deletion of
the cytochrome c oxidase subunit Va COX5A in the mitochon-
drial respiratory chain increased glycerol production, which
serves as means to reoxidize NADH (Figures 4b, 6). Because
this mutant lacks functional mitochondria [36], glycerol pro-
duction was driven by the limited NADH reoxidation through
residual NADH oxidase activity in the electron-transport
chain. Thus, robustness was brought about by using an alter-
native NADH sink. Considering that the flux through the
mitochondrial malate dehydrogenase Mdh1 was already very
low in the reference strain, the fitness defect of the mdh1 was
surprising. Akin to the fum1 and ald6 mutants, the signifi-
cantly reduced fitness of mdh1 may be explained by the
imbalance between the TCA cycle and glucose catabolism
(Figure 4f). Generally, the TCA cycle flux increases with
decreasing glucose uptake rates [29], but remains non-pro-
portionally low (absent) in the fum1, ald6, and mdh1 mutants
(Figure 4f). The cytosolic and peroxisomal duplicate genes
MDH2 and MDH3, respectively, did not compensate for the
mitochondrial lesion, which is consistent with the observed
lethal phenotype of the mdh1 mutant when grown on acetate
[37].
Relative distributions of absolute carbon fluxes in the S. cerevisiae reference strain (Ref) and the singleton gene mutants fum1, pda1 and zwfFigure 5 (see following page)
Relative distributions of absolute carbon fluxes in the S. cerevisiae reference strain (Ref) and the singleton gene mutants fum1, pda1 and zwf. All fluxes are
normalized to the specific glucose uptake rate, which is shown in the top inset, and are given in the same order in each box. Reactions encoded by deleted
genes are shown on a black background, but were not removed from the flux model (except for PDA1). The NADPH balance that is based on the
quantified fluxes and the known cofactor specificities is given as a synthetic transhydrogenase flux. In general, the 95% confidence intervals were between
5 and 10% for the major fluxes. Larger confidence intervals were estimated for reactions with low flux such as malic enzyme and PEP carboxykinase. Flux
distributions were verified in 30-ml shake flask cultures (data not shown). C1, one-carbon unit from C
1
metabolism; P5P, pentose 5-phosphates.
R49.8 Genome Biology 2005, Volume 6, Issue 6, Article R49 Blank et al. />Genome Biology 2005, 6:R49
Figure 5 (see legend on previous page)
GLUCOSE
glucose-6-P
fructose-6-P
triose-3-P
GLYCEROL
succinate
α-ketoglutarate
isocitrate
fumarate
pyruvate
acetyl-CoA
malate
oxaloacetate
P-enol-
pyruvate
pyruvate
acetyl-CoA
oxaloacetate
erythrose-4-P
sedoheptulose-7-P
P5P
citrate
Biomass
Biomass
Biomass
Biomass
11
10
4
3
3
1
0
3
3
1
0
3
3
1
−1
85
86
92
94
172
165
169
173
10
18
19
12
3
3
25
4
12
12
4
48
9
10
23
26
0
0
0
0
5
7
21
23
0
0
0
16
20
19
58
169
6
7
25
58
6
7
25
57
6
7
59
0
0
22
0
1
1
1
1
1
1
1
1
1
1
1
1
3
3
3
3
5
5
4
5
2
2
3
3
3
3
3
4
5
5
4
5
1
1
1
1
91
91
94
94
171
164
168
172
149
141
139
97
1
1
<1
1
acet-
aldehyde
ETHANOL
ACETATE
acetate
5
9
8
7
141
129
105
86
8
12
33
11
100= 16.7 ± 0.7 mmol/g/h
100= 9.0 ± 0.4
mmol/g/h
100= 8.4 ± 0.6 mmol/g/h
100
reference
fum1
pda1
zwf1 = 6.5 ± 0.4 mmol/g/h
3-P-glycerate
Gly
Ser
1
1
1
1
1
1
1
1
3
2
15
1
SUCCINATE
MITOCHONDRION
NADH
CYTOSOL
H
+
NADPH
NADH
2
6
23
2
0
0
4
4
21
55
1
0
10
54
<1
0
6
36
0
0
0
0
C1
0
0
0
0
Genome Biology 2005, Volume 6, Issue 6, Article R49 Blank et al. R49.9
comment reviews reports refereed researchdeposited research interactions information
Genome Biology 2005, 6:R49
Genetic network robustness
The above flux results reveal that knockouts of flexible reac-
tions are bypassed through alternative pathways in about one
third of the cases and through isoenzymes in the other two
thirds. Does this reflect the relative contribution of alterna-
tive pathways and duplicate genes to genetic network robust-
ness? [5] To address this question quantitatively for glucose
metabolism, we grew the 196 duplicate (encoding 87 reac-
tions) and 171 singleton (encoding 207 reactions) knockout
mutants of all 294 gene-encoded active reactions on glucose
plates.
In the 47 viable singleton knockouts, flux rerouting through
an alternative pathway ensures survival, which was directly
verified by flux data in 10 cases (Figure 4, Table 3 and Addi-
tional data file 3). Of the 196 experimental duplicate mutants,
180 grew on sole glucose, while 16 of the mutations were
lethal. As these 16 duplicates obviously did not contribute to
genetic robustness, their entire families (36 genes) were sub-
tracted from the 150 duplicate-encoded essential reactions
(Figure 1). For the remaining 114 duplicate genes we have
strong evidence for network redundancy as the underlying
mechanism of robustness, because they encode essential
reactions (as determined in silico) and each of the experimen-
tal knockouts was viable (Figure 7). For the 46 duplicate
genes that encode flexible reactions (Figure 1), both
compensation by duplicates and/or alternative pathways
might ensure proliferation. Where available, these mutants
were classified according to their flux distribution; that is, of
the 24 experimental duplicate mutants analyzed, four used
alternative pathways and 20 an isoenzyme (Figure 4, Table 3
and Additional data file 3). In total we analyzed all 367 exper-
imental mutants that encode the 294 active reactions of glu-
cose metabolism, 140 of which were lethal and 227 viable. For
the vast majority of the viable mutants, we identified the
molecular mechanism that brought robustness to the knock-
out about: about 25% were alternative pathways and 75%
duplicate genes (Figure 7).
Discussion
Using an integrated computational and experimental
approach, we show here that metabolic flexibility to knockout
mutations is restricted to a relatively small set of biochemical
reactions. About a third of all active reactions under the par-
ticular condition investigated may be bypassed by alternative
pathways, of which about 30% support only negligible fluxes.
The occurrence of flexible reactions might be even lower in
prokaryotes, because several alternative pathways involved
inter-compartmental transport. In general, the number of
flexible reactions will differ substantially between species,
with free-living yeast and fungi at the upper end of the scale,
and intracellular pathogens with highly reduced genomes at
the lower end.
Table 3
Overview of mechanisms of metabolic flexibility that confer robustness to central metabolic deletions
Duplicate gene* Duplicate gene and alternative
pathway
†
Alternative pathway
‡
None
ADH3, ALD5, DAL7, GPD1,ICL1,
IDP1, IDP2, MDH2, MDH3, MLS1,
PGM1, PGM2, SDH1, SER33,SOL1,
SOL2, SOL3, SOL4, TAL1, YGR043c
ADH1, ALD6, COX5A,MDH1 FUM1, GLY1, LSC1, MAE1, MDH1,
OAC1, PCK1, PDA1, RPE1, ZWF1
CTP1, GCV2, GND1
§
, GND2, SFC1
*Wild-type-like flux distribution.
†
Altered flux distribution, but some residual flux through the reaction was observed.
‡
Altered flux distribution, but
no residual flux through the reaction was observed.
§
Lethal, probably because of a non-stoichiometric effect.
Relative distributions of absolute carbon fluxes in the S. cerevisiae reference strain and the duplicate gene mutants ald6, cox5A and mdh1Figure 6 (see following page)
Relative distributions of absolute carbon fluxes in the S. cerevisiae reference strain and the duplicate gene mutants ald6, cox5A and mdh1. All fluxes are
normalized to the specific glucose uptake rate, which is shown in the top inset, and are given in the same order in each box. Reactions encoded by deleted
genes are shown on a black background, but were not removed from the flux model. The NADPH balance that is based on the fluxes and the known
cofactor specificities is given as a synthetic transhydrogenase. In general, the 95% confidence intervals were between 5 and 10% for the major fluxes.
Larger confidence intervals were estimated for reactions with low flux such as malic enzyme and PEP carboxykinase. Flux distributions were verified in 30-
ml shake flask cultures (data not shown). C1, one-carbon unit from C
1
metabolism; P5P, pentose 5-phosphates.
R49.10 Genome Biology 2005, Volume 6, Issue 6, Article R49 Blank et al. />Genome Biology 2005, 6:R49
Figure 6 (see legend on previous page)
GLUCOSE
glucose-6-P
fructose-6-P
triose-3-P
GLYCEROL
succinate
α-ketoglutarate
isocitrate
fumarate
pyruvate
acetyl-CoA
malate
oxaloacetate
P-enol-
pyruvate
pyruvate
acetyl-CoA
oxaloacetate
erythrose-4-P
sedoheptulose-7-P
P5P
citrate
Biomass
Biomass
Biomass
Biomass
11
20
7
4
6
3
2
4
6
3
2
3
5
3
1
84
70
86
84
171
161
174
163
9
1
10
10
4
7
3
6
12
92
13
41
9
38
10
25
0
6
2
0
5
25
5
19
1
16
1
15
21
289
27
137
4
89
6
41
0
70
4
26
6
95
9
45
6
95
9
45
6
96
9
46
0
0
0
0
1
2
1
1
1
2
1
2
2
3
1
2
4
7
3
6
6
11
5
9
3
5
2
4
4
7
3
6
5
10
4
8
1
1
1
1
90
81
92
88
170
165
175
161
147
33
152
95
1
1
1
1
acet-
aldehyde
ETHANOL
ACETATE
acetate
5
6
5
10
138
20
144
78
9
13
8
16
100 = 12.2 ± 0.6 mmol/g/h
100 = 7.0 ± 0.3 mmol/g/h
100 = 11.3 ± 0.5 mmol/g/h
100 = 3.0 ± 0.1 mmol/g/h
3-P-glycerate
Gly
Ser
C1
1
3
1
2
1
2
1
1
0
0
0
0
2
2
1
0
SUCCINATE
10
7
58
104
169
MITOCHONDRION
NADH
CYTOSOL
Reference
ald6
cox5A
mdh1
Genome Biology 2005, Volume 6, Issue 6, Article R49 Blank et al. R49.11
comment reviews reports refereed researchdeposited research interactions information
Genome Biology 2005, 6:R49
Using flux balance (FBA) [1,2], elementary flux mode [38,39],
or similar analyses [40], all in silico flexible reactions can be
precisely identified. Hence, experimental analysis of intracel-
lular flux responses to metabolic gene deletions can be lim-
ited to these potentially flexible mutants, rather than having
to analyze the entire mutant collection. Using the systems
biological approach described here, the true in vivo capability
of metabolic network operation can be mapped with a reason-
able workload. As the knowledge base on intracellular flux
responses increases, a handful of flux experiments in compu-
tationally identified mutants will probably suffice to identify
the in vivo network capability under a given condition. At the
next level, such flux analyses will also include mutants
affected in regulatory genes that modulate the network com-
position. Although not covered in the stoichiometric models
employed for flux-balance analysis, several recently discussed
computational approaches [39,41,42] may aid in identifying
the most relevant regulatory mutants for in vivo flux
quantification.
Consistent with the notion that metabolic networks undergo
minimal flux redistributions with respect to the metabolic
state of the parent [40], deletion of flexible singleton genes
was mostly counteracted by local flux rerouting, for example,
the lsc1,mae1, and oac1 mutants (see Additional data file 3).
Deletions in redox cofactor-dependent singleton or duplicate
reactions such as those mediated by adh1, ald6, cox5A, pda1,
and zwf1, however, affected flux alterations in more distant
reactions. While the relative flux distribution (in % values)
was perturbed only very little in these mutants, the absolute
magnitude of fluxes (in vivo reaction velocities) varied dra-
matically. In particular, knockout of fum1, whose encoded
protein catalyzes only a rather small flux, led to an unexpect-
edly strong phenotype with about a 50% reduction in glucose-
uptake rate. Although unexpected, this finding was qualita-
tively consistent with results from a recent genetic footprint-
ing study [43], which also showed a significant fitness defect
in this mutant. It was speculated that intramitochondrial
shortage of amino acids such as aspartate and glutamate
causes a lack of respiratory chain components, which leads to
a petite-like phenotype [44]. Another key mutant was pda1,
whose knockout caused a substantial import of acetyl-CoA
into the mitochondria; the mechanism for this remains elu-
sive because the carnitine auxotrophic CEN.PK strain does
not use the carnitine shuttle [45]. As a consequence, a twofold
overproduction of NADPH was estimated, which suggests
that the NAD
+
-dependent acetaldehyde dehydrogenases
instead of the NADP
+
-dependent ALD6 were active to balance
NADPH formation/consumption. Consistent with this, the
flux through the NADPH-producing PP pathway was signifi-
cantly lower in this mutant. The strongly altered redox
metabolism in pda1 is further evidenced by the substantial
secretion of glycerol and succinate (Figure 5).
The metabolic flexibility to cope with metabolic lesions is gen-
erally known as genetic robustness [5], a concept that is used
to explain the seemingly surprising number of phenotypically
silent deletion mutations: only about 1,100 knockouts of the
5,700 genes are lethal in haploid S. cerevisiae [23,46]. The
causes and evolution of gene dispensability have been inves-
tigated in several theoretical analyses of pre-existing data, but
the issue remains controversial [5,6,16,47-49]. For metabolic
networks, our flux data differentiate between the relative con-
tributions of three mechanisms to the apparent genetic
robustness: inactive, and thus dispensable, genes; 'genetic
buffering' through alternative reactions; and functional com-
plementation from duplicate genes ('redundancy').
Conclusions
In qualitative agreement with a recent estimate [16], genome-
scale flux analysis revealed that about half of the available
reactions (45% of the known metabolic genes) were not
required for growth on glucose (Figure 1). Hence, deletion of
these genes would not affect the growth phenotype on this
substrate, making inactive reactions the primary reason for
the apparent dispensability of genes with metabolic function.
It should be noted that this apparent gene dispensability is a
The mechanistic basis of gene dispensability in all active reactions during glucose metabolism of S. cerevisiaeFigure 7
The mechanistic basis of gene dispensability in all active reactions during
glucose metabolism of S. cerevisiae. The mechanism was mostly identified
from the phenotype on glucose plates. For 10 of the alternative pathways
and for 20 duplicates encoding flexible reactions, the results were
confirmed by
13
C-flux analysis. For 22 duplicate genes the data are not
sufficient to distinguish between both mechanisms and they are labeled as
not analyzed.
Alternative
pathways
(51 genes)
Duplicate genes in
essential reactions
(114)
Not analyzed
Duplicate genes in
flexible reactions
(20)
R49.12 Genome Biology 2005, Volume 6, Issue 6, Article R49 Blank et al. />Genome Biology 2005, 6:R49
somewhat artificial classification that does not contribute to
genetic robustness because most of these genes encode meta-
bolic functions that are only relevant under conditions differ-
ent from the one tested. The most important mechanism of
true genetic robustness in yeast glucose metabolism was
duplicate genes (Figure 7), the majority of which encoded
essential reactions with no alternative pathway. Alternative
pathways, contributed about 25% to genetic robustness by
carbon flux rerouting. This leaves redundancy as the major,
and modularity the minor, cause [50] of metabolic network
robustness to single-gene deletions during growth on glucose.
Materials and methods
Yeast strains
All prototrophic S. cerevisiae deletion mutants were con-
structed in the haploid, CEN.PK113-7D (Mata MAL2-8
c
SUC2) background with the homolog flanking region
approach [17] (Table 1). Briefly, genomic DNA was isolated
from the corresponding amino-acid auxotrophic mutants
[23]. The kanMX4 cassettes of each mutant were amplified by
PCR with primers located about 500 bp upstream and down-
stream of the deleted genes. The PCR reaction mixture was
directly used for transformation and integrants were selected
on YPD plates with 300
µ
g/ml geneticin. Correct cassette
insertion was confirmed by overlapping PCR using either
primer KanB (5'-CTGCAGCGAGGAGCCGTAAT-3') or KanC
(5'-TGATTTTGATGACGAGCGTAA-3') primers in
combination with one gene-specific primer. The reference
strain was CEN.PK 113-7D with a deletion of the switching
endonuclease, which was shown to be phenotypically neutral
in chemostat competition experiments [51] and is commonly
used as reference [52,53].
Media and growth conditions
The composition of the yeast minimal medium (MM) was
[54]: 5 g (NH
4
)
2
SO
4
, 3 g KH
2
PO
4
, 0.5 g MgSO
4
·7H
2
O, 4.5 mg
ZnSO
4
·7H
2
O, 0.3 mg CoCl
2
·6H
2
O, 1.0 mg MnCl
2
·4H
2
O, 0.3
mg CuSO
4
·5H
2
O, 4.5 mg CaCl
2
·2H
2
O, 3.0 mg FeSO
4
·7H
2
O,
0.4 mg NaMoO
4
·2H
2
O, 1.0 mg H
3
BO
3
, 0.1 mg KI, 15 mg
EDTA, 0.05 mg biotin, 1.0 mg calcium pantothenate, 1.0 mg
nicotinic acid, 25 mg inositol, 1.0 mg pyridoxine, 0.2 mg p-
aminobenzoic acid, and 1.0 mg thiamine. The medium was
buffered at pH 5.0 with 100 mM KH-phthalate to reduce pH
changes throughout the growth experiments to 0.05. Filter-
sterilized glucose and geneticin (300 µg/ml) were added
freshly to the media. Batch growth experiments (1.2 ml) were
carried out in deep-well plates (System Duetz, Kühner AG,
Switzerland) using an orbital shaker with 5 cm amplitude at
300 rpm to allow optimal mixing [22].
Qualitative testing of mutant growth on glucose was done on
agar plates. For this purpose, we used the haploid yeast
mutant library in the BY4741 strain (MATa his3
∆
1 leu2
∆
0
met15
∆
0 ura3
∆
0) [23]. The composition of the yeast minimal
medium for the plate growth assay was as described above
[54] with the exception of 20 g/l agar for solidification. Glu-
cose was added to a final concentration of 20 g/l. Strain
auxotrophies were complemented with 20 mg/l histidine,
uracil, methionine, lysine and 60 mg/l leucine. The plates
were incubated at 30°C for 3 days before scoring of the growth
phenotype and further incubated for 1 week to score slow-
growth phenotype mutants.
Analytical procedures and
13
C-labeling experiments
Cell growth was monitored by following optical density
changes at a wavelength of 600nm (OD
600
). Aliquots for
extracellular metabolite analysis were centrifuged at 14,000
rpm in an Eppendorf tabletop centrifuge to remove cells. Glu-
cose, acetate, ethanol and glycerol concentrations in the
supernatant were determined with commercial enzymatic
kits (Scil Diagnostics, Germany). Organic acids were quanti-
fied by high-pressure liquid chromatography (HPLC) using a
Supelcogel C8 (4.6 by 250 mm) ion-exclusion column. The
column was eluted at 30°C with 2% sulfuric acid at a flow rate
of 0.3 ml/min. The organic acids were detected using a Perk-
inElmer UV detector (Series 2000) at a wavelength of 210
nm. The physiological parameters maximum specific growth
rate, biomass yield on glucose, and specific glucose consump-
tion rate were calculated during the exponential growth
phase.
All labeling experiments were carried out in batch cultures
assuming pseudosteady-state conditions during the
exponential growth phase [12,55].
13
C-labeling of proteino-
genic amino acids was achieved either by growth on 5 g/l glu-
cose as a mixture of 80% (w/w) unlabeled and 20% (w/w)
uniformly labelled [U-
13
C]glucose (
13
C > 99%; Martek Bio-
sciences, Columbia, MD) or 100% [1-
13
C]glucose (> 99%;
Omicron Biochemicals, South Bend, IN). Cells from over-
night cultures were harvested by centrifugation and washed
using sugar-free MM to remove residual unlabeled carbon
sources. Cultures were routinely inoculated to an maximum
OD
600
of 0.03 and harvested by centrifugation at an OD
600
≤
1. Residual medium was removed by washing the pellet with
water. Cell protein was hydrolyzed for 24 h at 105°C in 6 M
HCL and dried in a heating block at 85°C for 6 h. The free
amino acids were derivatized at 85°C for 1 h using 15 µl
dimethylformamide and 15 µl N-(tert-butyldimethylsilyl)-N-
methyl-trifluoroacetamide [10]. Gas chromatography-mass
spectrometry (GC-MS) analysis was carried out as reported
[12] using a series 8000 GC in combination with an MD800
mass spectrometer (Fisons Instruments, Beverly, MA).
Metabolic flux ratio analysis
The recorded MS spectra include the distribution of mass iso-
topomers in 1-5 fragments of alanine, aspartate, glutamate,
glycine, isoleucine, leucine, phenylalanine, proline, serine,
threonine, tyrosine, and valine. For each amino-acid frag-
ment
α
, a mass isotopomer distribution vector (MDV) was
assigned:
Genome Biology 2005, Volume 6, Issue 6, Article R49 Blank et al. R49.13
comment reviews reports refereed researchdeposited research interactions information
Genome Biology 2005, 6:R49
with m
0
being the fractional abundance of the lowest mass
and m
i>0
the abundances of molecules with higher masses.
The MDV
α
values were corrected for naturally occurring sta-
ble isotopes [12] to obtain the exclusive mass isotopomer dis-
tributions of the carbon skeletons. The corrected MDV
α
were
used to calculate the amino acids (MDV
AA
) and metabolites
(MDV
M
) mass distribution vectors. Ratios of converging
intracellular fluxes to a given metabolite were calculated from
the MDV
M
as described previously [12,29].
In addition, the relative contribution of the PP pathway was
quantified from [1-
13
C]glucose experiments by tracking the
positional
13
C-labeling [10,56]. The expected labeling pattern
of triose phosphates or serine, which is derived exclusively
through glycolysis, is 50%
13
C-label in the C
1
positions. Hence,
the fraction of serine derived through the pentose phosphate
(PP) pathway can be derived according to Equation 2 [12]:
where GLU3
unlabeled
is an unlabeled three-carbon fragment
from a source molecule of glucose. The remaining fraction of
serine must then be derived through glycolysis. This flux ratio
was not corrected for the potential withdrawal of
13
C-label in
dihydroxyacetone-phosphate-based biomass synthesis (such
as phospholipids) and glycerol formation [21], because the
influence was negligible under the condition used. The largest
effect was found in the mutant with the highest specific glyc-
erol formation rate (cox5A), where the estimated relative flux
through the PP pathway would decrease from 12 ± 1% to 9 ±
1%.
13
C-constrained flux analysis
Absolute values of intracellular fluxes were calculated with a
flux model comprising all the major pathways of yeast central
carbon metabolism (Additional data file 2). Deleted reactions
were not omitted from the mutant models; thus the muta-
tions were independently verified from the
13
C data. The stoi-
chiometric matrix of 34 linear equations and 30 metabolites
has an infinite condition number [57]; it is thus underdeter-
mined, and has a solution space with an infinite number of
different flux vectors that fulfill the constraints from deter-
mined uptake and production rates. To uniquely solve the
system for fluxes (
ν
), a set of linearly independent equations
that quantify flux ratios (FlRs) were used to obtain eight con-
straints on the relative flux distribution from METAFoR anal-
ysis (see Additional data file 2).
The fraction of cytosolic oxaloacetate originating from
cytosolic pyruvate is given by:
The fraction of mitochondrial oxaloacetate derived through
anaplerosis is given by:
The fraction of PEP originating from cytosolic oxaloacetate is
given by:
The fraction of serine derived through glycolysis is given by:
The upper and lower bounds for mitochondrial pyruvate
derived through the malic enzyme (from mitochondrial
malate) are given by:
The contribution of glycine to serine biosynthesis is given by:
and, finally, the contribution of serine to glycine biosynthesis
is given by:
The stoichiometric matrix including Equations 3-10 has a
condition number of 31, implying that the model is numeri-
cally robust [57]. Error minimization was carried out as
described by Fischer et al. [10]. Balanced NADPH production
and consumption were not added as additional constraints.
In general, NADPH production was constrained by Equations
3 and 7/8, which estimate the relative use of the PP pathway
and malic enzyme, respectively. As an additional source of
NADPH, the flux through the NADPH-dependent acetalde-
hyde dehydrogenase [33] was estimated from the acetate pro-
duction rate and the biomass requirement for cytosolic
acetyl-CoA. Deviation of the NADPH production estimated in
this way from the consumption for biosynthesis was generally
below ± 20%, suggesting that the model assumptions and the
experimental data are highly consistent. All extreme flux
MDV with m
i
α
=
()
()
()
()
=
()
∑
m
m
m
m
n
0
1
2
11
"
Serine through PP pathway
Serine13 GLU3
GLU
=−
−
×
1
05
unlabeled
.( 33 GLU3 GLU3
1unlabeled unlabeled
×−
()
)
2
FlR
v
vv
1
23
23 30
3=
+
()
FlR
v
vv
2
29
19 29
4=
+
()
FlR
v
vv
3
22
22 12
5=
+
()
FlR
vvv
vvv
4
24 6 7
24 5 6
6=
−−
++
()
FlR
v
vv
FlR5
21
32 21
678≥
+
≥
()
/
FlR
v
vv
7
10
10 8
9=
+
()
FlR
v
vv
8
9
911
10=
+
()
R49.14 Genome Biology 2005, Volume 6, Issue 6, Article R49 Blank et al. />Genome Biology 2005, 6:R49
patterns were independently verified in 30-ml cultures (data
not shown).
Genome-scale flux analysis
We used the experimentally determined in vivo flux data
(
ν
exp
) to constrain the purely stoichiometric solution space of
model iLL672 to obtain an experimentally validated genome-
scale wild-type flux solution
ν
WT
. For glucose minimal
medium, we constrained the model iLL672 with 30 fluxes
that were derived from
13
C-labeling experiments [8]. In par-
ticular, we used
13
C-constrained flux analysis [58] for GC-MS-
detected mass isotope distributions in proteinogenic amino
acids from a 20% [U-
13
C] glucose experiment and a compart-
mentalized yeast model [29]. These experimental data were
to be kept within an accuracy
δ
of ± 10% when mapping the
determined central metabolic fluxes to the genome-scale ref-
erence flux solution. To overcome mathematical artifacts
such as futile cycling (that is, a closed loop of fluxes that bring
no net change), the original linear programming problem was
modified. A minimization of the Euclidean norm of fluxes was
chosen as the objective function such that (s.t.) the mass bal-
ance equations hold:
with j as the set of experimentally determined fluxes. Reac-
tions were categorized as flexible when fulfilling the following
criteria: the reactions carried a non-zero flux; and the reac-
tion was not essential for growth.
In silico phenotyping of duplicate gene families
Phenotype predictions of deletion mutants were analyzed
computationally with FBA [3,59]. Assuming steady-state
growth, mass balances were put up for each intracellular
metabolite M
i
(1 × n) that have to be fulfilled, when multiplied
with the overall flux vector
ν
(n × 1):
M
i
·
ν
= 0. (12)
The entity of all m metabolite mass balances yields the stoi-
chiometric matrix S (m × n), where:
S·
ν
= 0. (13)
To pick one solution out of the overall solution space formed
by the stoichiometric constraints, FBA generally assumes
maximization of biomass growth
µ
as the global cellular goal
[3,59]. Thus, the search for a single flux distribution
ν
results
in a linear programming (LP) problem:
where i = 1, ,M and
ν
lb,i
and
ν
ub,i
correspond to upper and
lower bounds of a specific reaction i. Gene knockout mutants
can be simulated easily in silico by setting the deleted reac-
tions to zero. All LPproblems were solved using the open-
source GNU linear programming kit [60].
Additional data files
The following additional data are available with the online
version of this paper. The classification of reactions according
to Figure 1 is presented in Additional data file 1. The flux anal-
ysis model is defined in Additional data file 2. The physiolog-
ical data, flux ratios and the calculated flux distributions are
presented in Additional data file 3.
Additional File 1Classification of reactions according to Figure 1Classification of reactions according to Figure 1. Classification of reactions according to Figure 1Click here for fileAdditional File 2The flux analysis modelThe flux analysis model. The flux analysis modelClick here for fileAdditional File 3Physiological data, flux ratios and the calculated flux distributionsPhysiological data, flux ratios and the calculated flux distributions. Physiological data, flux ratios and the calculated flux distributionsClick here for file
Acknowledgements
We are grateful to Eckhard Boles for providing the mae1 mutant. LarsM.
Blank gratefully acknowledges financial support by the Deutsche Akademie
der Naturforscher Leopoldina (BMBF-LPD/8-78).
References
1. Papin JA, Stelling J, Price ND, Klamt S, Schuster S, Palsson BO: Com-
parison of network-based pathway analysis methods. Trends
Biotechnol 2004, 22:400-405.
2. Price ND, Reed JL, Palsson BO: Genome-scale models of micro-
bial cells: evaluating the consequences of constraints. Nat Rev
Microbiol 2004, 2:886-897.
3. Förster J, Famili I, Fu P, Palsson BO, Nielsen J: Genome-scale
reconstruction of the Saccharomyces cerevisiae metabolic
network. Genome Res 2003, 13:244-253.
4. Reed JL, Palsson BO: Thirteen years of building constraint-
based in silico models of Escherichia coli. J Bacteriol 2003,
185:2692-2699.
5. Gu X: Evolution of duplicate genes versus genetic robustness
against null mutations. Trends Genet 2003, 19:354-356.
6. Hartman JLT, Garvik B, Hartwell L: Principles for the buffering of
genetic variation. Science 2001, 291:1001-1004.
7. Hellerstein MK: In vivo measurement of fluxes through meta-
bolic pathways: the missing link in functional genomics and
pharmaceutical research. Annu Rev Nutr 2003, 23:379-402.
8. Sauer U: High-throughput phenomics: experimental methods
for mapping fluxomes. Curr Opin Biotechnol 2004, 15:58-63.
9. Wiechert W:
13
C metabolic flux analysis. Metab Eng 2001,
3:195-206.
10. Fischer E, Zamboni N, Sauer U: High-throughput metabolic flux
analysis based on gas chromatography-mass spectrometry
derived
13
C constraints. Anal Biochem 2004, 325:308-316.
11. Zamboni N, Sauer U: Model-independent fluxome profiling
from
2
H and
13
C experiments for metabolic variant
discrimination. Genome Biol 2004, 5:R99.
12. Fischer E, Sauer U: Metabolic flux profiling of Escherichia coli
mutants in central carbon metabolism using GC-MS. Eur J
Biochem 2003, 270:880-891.
13. Blank LM, Sauer U: TCA cycle activity in Saccharomyces cerevi-
siae is a function of the environmentally determined specific
growth and glucose uptake rates. Microbiology 2004,
150:1085-1093.
14. Blank LM, Lehmbeck F, Sauer U: Metabolic flux and network
analysis in fourteen hemiascomycetous yeasts. FEMS Yeast Res
2005, 5:545-558.
15. Duarte NC, Herrgard MJ, Palsson BO: Reconstruction and
min
,,
v
Sv
vvv
vv
i
WT
i
WT
lb i
WT
i
WT
ub i
WT
j
exp
j
∑
⋅=
()
≤≤
⋅−
()
≤
s.t. 0 11
1
δ
WWT
j
exp
v≤⋅+
()
1
δ
max
,
,,
µ
s.t.
i
Sv
vvv
lbiiub
⋅=
()
≤≤
014
Genome Biology 2005, Volume 6, Issue 6, Article R49 Blank et al. R49.15
comment reviews reports refereed researchdeposited research interactions information
Genome Biology 2005, 6:R49
validation of Saccharomyces cerevisiae iND750, a fully com-
partmentalized genome-scale metabolic model. Genome Res
2004, 14:1298-1309.
16. Papp B, Pal C, Hurst LD: Metabolic network analysis of the
causes and evolution of enzyme dispensability in yeast. Nature
2004, 429:661-664.
17. Wach A, Brachat A, Pohlmann R, Philippsen P: New heterologous
modules for classical or PCR-based gene disruptions in Sac-
charomyces cerevisiae. Yeast 1994, 10:1793-1808.
18. van Dijken JP, Bauer J, Brambilla L, Duboc P, Francois JM, Gancedo C,
Giuseppin ML, Heijnen JJ, Hoare M, Lange HC, et al.: An interlabo-
ratory comparison of physiological and genetic properties of
four Saccharomyces cerevisiae strains. Enzyme Microb Technol
2000, 26:706-714.
19. Pronk JT: Auxotrophic yeast strains in fundamental and
applied research. Appl Environ Microbiol 2002, 68:2095-2100.
20. Steinmetz LM, Scharfe C, Deutschbauer AM, Mokranjac D, Herman
ZS, Jones T, Chu AM, Giaever G, Prokisch H, Oefner PJ, et al.: Sys-
tematic screen for human disease genes in yeast. Nat Genet
2002, 31:400-404.
21. Zamboni N, Fischer E, Laudert D, Aymerich S, Hohmann HP, Sauer
U: The Bacillus subtilis yqjI gene encodes the NADP
+
-depend-
ent 6-P-gluconate dehydrogenase in the pentose phosphate
pathway. J Bacteriol 2004, 186:4528-4534.
22. Duetz WA, Ruedi L, Hermann R, O'Connor K, Buchs J, Witholt B:
Methods for intense aeration, growth, storage, and replica-
tion of bacterial strains in microtiter plates. Appl Environ
Microbiol 2000, 66:2641-2646.
23. Giaever G, Chu AM, Ni L, Connelly C, Riles L, Veronneau S, Dow S,
Lucau-Danila A, Anderson K, Andre B, et al.: Functional profiling
of the Saccharomyces cerevisiae genome. Nature 2002,
418:387-391.
24. Winzeler EA, Liang H, Shoemaker DD, Davis RW: Functional anal-
ysis of the yeast genome by precise deletion and parallel phe-
notypic characterization. Novartis Found Symp 2000, 229:105-109.
discussion 109-111.
25. Monschau N, Stahmann KP, Sahm H, McNeil JB, Bognar AL: Identifi-
cation of Saccharomyces cerevisiae GLY1 as a threonine aldo-
lase: a key enzyme in glycine biosynthesis. FEMS Microbiol Lett
1997, 150:55-60.
26. Gombert AK, Moreira dos Santos M, Christensen B, Nielsen J: Net-
work identification and flux quantification in the central
metabolism of Saccharomyces cerevisiae under different con-
ditions of glucose repression. J Bacteriol 2001, 183:1441-1451.
27. Maaheimo H, Fiaux J, Cakar ZP, Bailey JE, Sauer U, Szyperski T: Cen-
tral carbon metabolism of Saccharomyces cerevisiae explored
by biosynthetic fractional
13
C labeling of common amino
acids. Eur J Biochem 2001, 268:2464-2479.
28. Szyperski T: Biosynthetically directed fractional
13
C-labeling
of proteinogenic amino acids. An efficient analytical tool to
investigate intermediary metabolism. Eur J Biochem 1995,
232:433-448.
29. Blank LM, Sauer U: TCA cycle activity in Saccharomyces cerevi-
siae is a function of the environmentally determined specific
growth and glucose uptake rates. Microbiology 2004,
150:1085-1093.
30. Sauer U, Hatzimanikatis V, Bailey JE, Hochuli M, Szyperski T,
Wüthrich K: Metabolic fluxes in riboflavin-producing Bacillus
subtilis. Nat Biotechnol 1997, 15:448-452.
31. Dos Santos MM, Gombert AK, Christensen B, Olsson L, Nielsen J:
Identification of in vivo enzyme activities in the cometabo-
lism of glucose and acetate by Saccharomyces cerevisiae by
using (13)C-labeled substrates. Eukaryotic Cell 2003, 2:599-608.
32. Meaden PG, Dickinson FM, Mifsud A, Tessier W, Westwater J, Bussey
H, Midgley M: The ALD6 gene of Saccharomyces cerevisiae
encodes a cytosolic, Mg(2+)-activated acetaldehyde
dehydrogenase. Yeast 1997, 13:1319-1327.
33. Grabowska D, Chelstowska A: The ALD6 gene product is indis-
pensable for providing NADPH in yeast cells lacking glucose-
6-phosphate dehydrogenase activity. J Biol Chem 2003,
278:13984-13988.
34. Boubekeur S, Bunoust O, Camougrand N, Castroviejo M, Rigoulet M,
Guerin B: A mitochondrial pyruvate dehydrogenase bypass in
the yeast Saccharomyces cerevisiae. J Biol Chem 1999,
274:21044-21048.
35. Outten CE, Culotta VC: A novel NADH kinase is the mitochon-
drial source of NADPH in Saccharomyces cerevisiae. EMBO J
2003, 22:2015-2024.
36. McEwen JE, Cumsky MG, Ko C, Power SD, Poyton RO: Mitochon-
drial membrane biogenesis: characterization and use of pet
mutants to clone the nuclear gene coding for subunit V of
yeast cytochrome c oxidase. J Cell Biochem 1984, 24:229-242.
37. McAlister-Henn L, Thompson LM: Isolation and expression of the
gene encoding yeast mitochondrial malate dehydrogenase. J
Bacteriol 1987, 169:5157-5166.
38. Schuster S, Fell DA, Dandekar T: A general definition of meta-
bolic pathways useful for systematic organization and analy-
sis of complex metabolic networks. Nat Biotechnol 2000,
18:326-332.
39. Stelling J, Klamt S, Bettenbrock K, Schuster S, Gilles ED: Metabolic
network structure determines key aspects of functionality
and regulation. Nature 2002, 420:190-193.
40. Segre D, Vitkup D, Church GM: Analysis of optimality in natural
and perturbed metabolic networks. Proc Natl Acad Sci USA 2002,
99:15112-15117.
41. Covert MW, Knight EM, Reed JL, Herrgard MJ, Palsson BO: Inte-
grating high-throughput and computational data elucidates
bacterial networks. Nature 2004, 429:92-96.
42. Segre D: The regulatory software of cellular metabolism.
Trends Biotechnol 2004, 22:261-265.
43. Dunn B, Ferea T, Spellman P, Schwarz J, Terraciano J, Troyanovich J,
Walker S, Greene J, Shaw K, DiDomenico B, et al.: Genetic foot-
printing: a functional analysis of the S. cerevisiae genome.
[].
44. Wu M, Tzagoloff A: Mitochondrial and cytoplasmic fumarases
in Saccharomyces cerevisiae are encoded by a single nuclear
gene FUM1. J Biol Chem 1987, 262:12275-12282.
45. Van Maris AJ, Luttik MA, Winkler AA, Van Dijken JP, Pronk JT: Over-
production of threonine aldolase circumvents the biosyn-
thetic role of pyruvate decarboxylase in glucose-limited
chemostat cultures of Saccharomyces cerevisiae. Appl Environ
Microbiol 2003, 69:2094-2099.
46. Winzeler EA, Shoemaker DD, Astromoff A, Liang H, Anderson K,
Andre B, Bangham R, Benito R, Boeke JD, Bussey H, et al.: Func-
tional characterization of the S. cerevisiae genome by gene
deletion and parallel analysis. Science 1999, 285:901-906.
47. Nowak MA, Boerlijst MC, Cooke J, Smith JM: Evolution of genetic
redundancy. Nature 1997, 388:167-171.
48. Wagner A: Robustness against mutations in genetic networks
of yeast. Nat Genet 2000, 24:355-361.
49. Gu Z, Steinmetz LM, Gu X, Scharfe C, Davis RW, Li WH: Role of
duplicate genes in genetic robustness against null mutations.
Nature 2003, 421:63-66.
50. Stelling J, Sauer U, Szallasi Z, Doyle FJ 3rd, Doyle J: Robustness of
cellular functions. Cell 2004, 118:675-685.
51. Baganz F, Hayes A, Marren D, Gardner DC, Oliver SG: Suitability
of replacement markers for functional analysis studies in
Saccharomyces cerevisiae. Yeast 1997, 13:1563-1573.
52. Allen J, Davey HM, Broadhurst D, Heald JK, Rowland JJ, Oliver SG,
Kell DB: High-throughput classification of yeast mutants for
functional genomics using metabolic footprinting. Nat
Biotechnol 2003, 21:692-696.
53. Raamsdonk LM, Teusink B, Broadhurst D, Zhang N, Hayes A, Walsh
MC, Berden JA, Brindle KM, Kell DB, Rowland JJ, et al.: A functional
genomics strategy that uses metabolome data to reveal the
phenotype of silent mutations. Nat Biotechnol 2001, 19:45-50.
54. Verduyn C, Postma E, Scheffers WA, Van Dijken JP: Effect of ben-
zoic acid on metabolic fluxes in yeasts: a continuous-culture
study on the regulation of respiration and alcoholic
fermentation. Yeast 1992, 8:501-517.
55. Sauer U, Lasko DR, Fiaux J, Hochuli M, Glaser R, Szyperski T,
Wüthrich K, Bailey JE: Metabolic flux ratio analysis of genetic
and environmental modulations of Escherichia coli central
carbon metabolism. J Bacteriol 1999, 181:6679-6688.
56. Christensen B, Christiansen T, Gombert AK, Thykaer J, Nielsen J:
Simple and robust method for estimation of the split
between the oxidative pentose phosphate pathway and the
Embden-Meyerhof-Parnas pathway in microorganisms. Bio-
technol Bioeng 2001, 74:517-523.
57. Nissen TL, Schulze U, Nielsen J, Villadsen J: Flux distributions in
anaerobic, glucose-limited continuous cultures of Saccharo-
myces cerevisiae. Microbiology 1997, 143:203-218.
58. Fischer E, Zamboni N, Sauer U: High-throughput metabolic flux
analysis based on gas chromatography-mass spectrometry
derived
13
C constraints. Anal Biochem 2004, 325:308-316.
59. Edwards JS, Palsson BO: The Escherichia coli MG1655 in silico
R49.16 Genome Biology 2005, Volume 6, Issue 6, Article R49 Blank et al. />Genome Biology 2005, 6:R49
metabolic genotype: its definition, characteristics, and
capabilities. Proc Natl Acad Sci USA 2000, 97:5528-5533.
60. Makhorin A: GNU Linear Programming Kit 2001 [ />software/glpk/glpk.html]. Moscow, Russia: Moscow Aviation Institute
61. Yeast Deletion Project and Proteomics of Mitochondria
Database [ />