Báo cáo y học: "Relationship between the tissue-specificity of mouse gene expression and the evolutionary origin and function of the protein" ppsx
Bạn đang xem bản rút gọn của tài liệu. Xem và tải ngay bản đầy đủ của tài liệu tại đây (286.34 KB, 9 trang )
Genome Biology 2005, 6:R56
comment reviews reports deposited research refereed research interactions information
Open Access
2005Freilichet al.Volume 6, Issue 7, Article R56
Research
Relationship between the tissue-specificity of mouse gene
expression and the evolutionary origin and function of the proteins
Shiri Freilich
*
, Tim Massingham
*
, Sumit Bhattacharyya
†
,
Hannes Ponstingl
*
, Paul A Lyons
†
, Tom C Freeman
*
and Janet M Thornton
*
Addresses:
*
EMBL-EBI, Wellcome Trust Genome Campus, Cambridge, CB10 1SB, UK.
†
Rosalind Franklin Centre Genomics Research,
Wellcome Trust Genome Campus, Cambridge, CB10 1SB, UK.
Correspondence: Shiri Freilich. E-mail:
© 2005 Freilich et al.; licensee BioMed Central Ltd.
This is an Open Access article distributed under the terms of the Creative Commons Attribution License />Relationship between gene-expression profile and function and phyletic origin in mouse<p>A microaaray analysis of mouse gene expression combined with the proteins functional and phyletic classification suggests that phyletic age (and not function) is the dominant factor shaping the expression profle of a protein.</p>
Abstract
Background: The combination of complete genome sequence information with expression data
enables us to characterize the relationship between a protein's evolutionary origin or functional
category and its expression pattern. In this study, mouse proteins were assigned into functional and
phyletic groups and the gene expression patterns of the different protein groupings were examined
by microarray analysis in various mouse tissues.
Results: Our results suggest that the proteins that are universally distributed in all tissues are
predominantly enzymes and transporters. In contrast, the tissue-specific set is dominated by
regulatory proteins (signal transduction and transcription factors). An increased tendency to tissue-
specificity is observed for metazoan-specific proteins. As the composition of the phyletic groups
highly correlates with that of the functional groups, the data were tested in order to determine
which of the two factors - function or phyletic age - is dominant in shaping the expression profile
of a protein. The observed differences in expression patterns of genes between functional groups
were found mainly to reflect their different phyletic origin. The connection between tissue
specificity and phyletic age cannot be explained by the recent rate of evolution. Finally, although
metazoan-specific proteins tend to be tissue-specific compared with phyletically conserved
proteins present in all domains of life, many such 'universal' proteins are also tissue-specific.
Conclusion: The minimal cellular transcriptome of the metazoan cell differs from that of the
ancestral unicellular eukaryote: new functions were added (metazoan-specific proteins), whilst
other functions became specialized and no longer took place in all cells (tissue-specific pre-
metazoan proteins).
Background
Higher animals are characterized by differentiated tissue
types, where each tissue has its own unique cellular composi-
tion and physiological function. Comparative genomic stud-
ies have shown that the evolution of the metazoan lineage
involves the expansion of those specific protein families
known to participate in cellular communication and tran-
scriptional regulation [1,2]. However, at the cellular level, it is
not yet clear how processes taking place in specific tissues
relate to similar processes that took place in the ancestral
Published: 29 June 2005
Genome Biology 2005, 6:R56 (doi:10.1186/gb-2005-6-7-r56)
Received: 17 February 2005
Revised: 11 April 2005
Accepted: 11 May 2005
The electronic version of this article is the complete one and can be
found online at />R56.2 Genome Biology 2005, Volume 6, Issue 7, Article R56 Freilich et al. />Genome Biology 2005, 6:R56
unicellular species. The recent availability of fully sequenced
genomes, together with analysis platforms capable of gener-
ating 'global' profiles, enables us not only to identify those
proteins that are unique to multicellular species but also to
examine their contribution to tissue diversity. We can now
study the protein content of a mammalian tissue in compari-
son with the protein content of unicellular organisms. To
what extent does the differentiation process involve gaining
new functions and to what extent does it involve specializa-
tion of pathways that existed in a unicellular ancestor? Will
'young' proteins (that is, proteins that are unique to multicel-
lular species) exhibit a different expression pattern than
'ancient' or universal proteins?
Recent studies have related several characteristics of a pro-
tein to its expression profile. Subramanian and Kumar [3]
have shown a connection between a protein's phyletic age and
the intensity of expression, as measured by the number of
expressed sequence tags. Lehner and Fraser [4] showed that
protein domains differ in their tendency to be specifically or
widely expressed and that many of the tissue-specific
domains are metazoan-specific. Tissue-specific genes evolve
more rapidly than broadly expressed ones [5-7]. We have
studied the relationship between the phyletic age of a protein
and its expression profile, and related this to the function of
the protein. The term 'phyletic age' used here describes an
estimated point in time when a protein integrated into the
mouse genome. The universal and eukaryotic specific phyletic
groups include proteins that are estimated to be found in the
ancestral mouse genome before the transition from unicellu-
larity to multicellularity. The metazoan-specific and mamma-
lian-specific protein groups describe those proteins that are
estimated to be integrated into the mouse genome after the
transition. As the phyletic protein groups differ in their func-
tions we wanted to determine whether a protein's expression
profile better reflects function or age.
Finally, we wanted to verify that the phyletic age of a protein
is indeed a major factor in shaping its expression profile
rather than merely a reflection of the level of conservation in
a protein - a factor that has already been shown to play a role
in determining expression [5-7]. To rule out the possibility
that the connection between age and expression is spurious
due to the misclassification of rapidly evolving genes and the
connection between tissue expression and recent rate of evo-
lution, Subramanian and Kumar [3] showed that the connec-
tion still exists in a slowly evolving set of data. However, the
assumption that the slow rate of evolution of the genes
assumes a correct age classification may not hold if there has
been a change in rate during their evolutionary history, for
example, diversifying selection followed by conservation after
a gene duplication [8]. In this paper, we propose a direct test
to show that the connection between phyletic age and tissue
expression of a gene cannot be explained by the connection
between rate and tissue expression alone, a test which does
not assume homotachy and makes use of all the available
data.
In order to tackle these questions we have studied expression
patterns in 14 mouse tissues. Gene expression patterns (for
example, ubiquitous in all tissues examined or tissue-spe-
cific) were related to the evolutionary origin of the protein as
reflected in the distribution of proteins in different phyla.
Firstly, we have assigned mouse proteins to one of four func-
tional categories: two regulatory categories (signal transduc-
tion and transcription regulation) and two metabolic
categories (enzymes and transporters). Next, the proteins
were assigned to a phyletic category: mammalian-specific
proteins, metazoan-specific proteins, eukaryote-specific pro-
teins and universal proteins - present in prokaryote species.
Then we compared the expression pattern of the different cat-
egories within various mouse tissues and studied the ten-
dency of proteins within these groups to be tissue-specific or
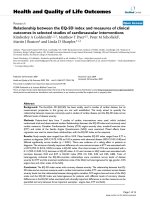
ubiquitous. The assignment process is described in Figure 1.
Results
Comparing expression patterns within different tissues
For each tissue we counted the number of expressed probe
sets. The fraction of probe sets expressed in each tissue ranges
from 0.35 (muscle) to 0.55 (eye). Nearly a constant fraction
(~60%) of the probe sets in each tissue is mapped to proteins.
Similarly a constant fraction (~45%) of the proteins in each
tissue can be assigned a Gene Ontology (GO) annotation (Fig-
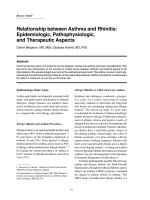
ure 2a). We compared the tissues for their content of func-
tional and phyletic groups (Figure 2b,c). All tissues display a
strikingly similar functional and phyletic composition. The
functional composition of annotated proteins in a tissue is
approximately 60% enzymes, 20% transporters, 15% signal
transduction proteins and 5% transcription regulation pro-
teins. The phyletic composition of proteins in a tissue is found
to be approximately 25% universal proteins, 40% eukaryotic-
specific proteins, 20% metazoan-specific proteins and 15%
mammalian-specific proteins.
As the tissues seem to have almost identical overall composi-
tion of functional categories (Figure 2b), tissue diversity must
be achieved through differences in the protein composition
within each different category. We counted the number of
proteins expressed in one tissue, two tissues, and so on (Fig-
ure 3a). About a third of the proteins are expressed in all tis-
sues examined, so variation is seen for two-thirds of the
proteins in our sample.
Comparing expression patterns within functional and
phyletic categories
We further studied the contribution of different functional
and phyletic groups to tissue variation. Are some functional
categories more tissue-specific than others? We examined the
expression profile of proteins from the four functional catego-
ries within 14 different mouse tissues. For each group, we
Genome Biology 2005, Volume 6, Issue 7, Article R56 Freilich et al. R56.3
comment reviews reports refereed researchdeposited research interactions information
Genome Biology 2005, 6:R56
calculated the fraction of its protein members expressed in
one tissue, two tissues, and so on (Figure 3b). Surprisingly,
less than one-third of the enzymes and transporters are ubiq-
uitously expressed in all tissues examined. The fraction is
even lower for the other functional groups where only about
one-tenth of the transcription factors and signal transduction
proteins are expressed in all tissues examined. Two different
patterns of expression can be observed: the relative abun-
dance of enzymes and transporter proteins is higher among
proteins that are ubiquitously expressed; in contrast, a larger
fraction of transcription factors and signal transduction pro-
teins are tissue-specific.
Signal transduction proteins and transcription factors are
known to be the main functional categories that were
expanded in the metazoa lineage while enzymes and trans-
porter proteins are usually more highly conserved between
the different domains of life [1,2]. Therefore, unsurprisingly,
the distribution of the functional groups in our dataset largely
correlates with the phyletic clusters (Table 1). Reproducing
the expression data charts using the phyletic groups naturally
reveals the trend predicted from Table 1 - the relative abun-
dance of universal and eukaryote-specific proteins is higher
among proteins that are expressed in a wide variety of tissues,
while mammalian-specific proteins have a higher tendency to
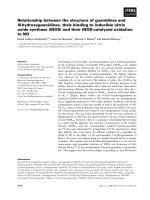
A schematic description of the expression profile determination and protein annotation as described in Materials and methodsFigure 1
A schematic description of the expression profile determination and protein annotation as described in Materials and methods. The numbers in the pie
charts indicate the number of proteins assigned to the relevant category. GO, Gene Ontology.
12,487 probe sets
Aymetrix U74AV2
mouse chip
Determine probe
expression profile
for 14 adult mouse tissues
Mapping and filtering
probe ids to proteins
Functional assignment
of 4,918 proteins (GO annotation)
Signal
transduction
Enzymatic
activity
Transcription
regulation
Transporters
Universal
Metazoan-
specific
Eukaryota
specific
Mammalian-
specific
6,242 mouse proteins
mapped
1,400
384
617
285
Calculate a distribution profile
of mouse protein
in 146 genomes
146 fully sequenced
genomes (Bacteria,
Archeae, Eukaryota)
2,088
1,567
1,123
1,428
Assignment of mouse proteins into phyletic
categories based on their distribution profiles (6,206 proteins)
Selecting 2,686 proteins uniquely
assigned to one of four chosen GO categories
R56.4 Genome Biology 2005, Volume 6, Issue 7, Article R56 Freilich et al. />Genome Biology 2005, 6:R56
be tissue-specific (Figure 3c). The observations are
compatible with those obtained in a recent study where meta-
zoan-specific protein domains and protein domains involved
in intercellular communication were shown to be tissue-spe-
cific [4]. As the expression of the functional (Figure 3b) and
phyletic (Figure 3c) groups represent two sides of the same
coin, the remaining question is whether enzymes tend to be
ubiquitously expressed due to their phyletic-universal origin
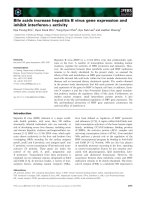
Fraction of expressed probe sets (out of all 12,488 probe sets) in a tissue (black)Figure 2
Fraction of expressed probe sets (out of all 12,488 probe sets) in a tissue
(black). The grey bars represent the fraction of expressed probe sets in a
tissue that can be uniquely mapped to a single protein. (a) The pink bars
represent the fraction of expressed probe sets in a tissue that are assigned
with a GO annotation. (b) Distribution of the four functional categories of
all annotated proteins expressed in a tissue. (c) Distribution of the four
phyletic categories of all the mapped proteins expressed in a tissue.
Phyletic classes
Universal
Eukaryote spc
Metazoan spc
Mammalian spc
Tissue types
Fraction
Fraction of expressed probe sets
Fraction of probe sets mapped to a single protein
Fraction of probe sets with a GO assignment
Functional classes
Enzymes
Transporters
Signal transduction
Transcription regulation
Annotations coverage
Bladder
Brain
Eye
Gallbadder
Heart
Kidney
Liver
L
ung
Muscl
es
Pleen
Testis
Thymus
Ovary
Colon(proximal)
1.0
0.8
0.6
0.4
0.2
0.0
Tissue types
Fraction
Bladder
Brain
Eye
Gallbadder
Heart
Kidney
Liver
Lung
Muscl
es
P
leen
T
estis
Thymus
Ovary
Colon(proximal)
1.0
0.8
0.6
0.4
0.2
0.0
Tissue types
Fraction
Bladder
Brain
Eye
Gallbadder
Heart
Kidney
Liver
Lung
Muscl
es
Pleen
Testis
T
hymus
Ovary
Colon(proximal)
1.0
0.8
0.6
0.4
0.2
0.0
(a)
(b)
(c)
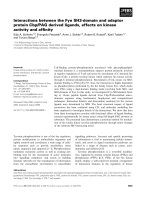
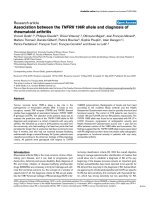
Expression distributions of mouse proteinsFigure 3
Expression distributions of mouse proteins. (a) Expression pattern of all
mapped proteins expressed in at least a single tissue (5,528 out of 6,242
proteins). (b) Expression pattern of proteins in different functional groups
and (c) in different phyletic groups. The plot presents the fraction of
proteins in a group that are expressed in N tissues. The analysis is
restricted to those proteins expressed in at least a single tissue. Sample
size (number of assigned proteins): 1,294 enzymes; 343 transporters; 450
signal transduction; 214 transcription regulation; 1,359 universal; 1,951
eukaryote-specific; 1,281 metazoan-specific; and 910 mammalian-specific.
Expression distribution of mouse proteins
Fraction of all proteins in N tissues
Expression distribution of mouse proteins in
14 tissues, grouped by function
Fraction of all proteins in a given
group expressed in N tissues
Enzymes
Transporters
Transcription regulators
Signal tranduction
Expression distribution of mouse protein in 14 tissues,
grouped by phyletic distribution
Fraction of all proteins in a given
group expressed in N tissues
Universal
Eukaryote spp
Metazoan spp
Mammalian spp
1234567
Summed number of tissues where protein is expressed
Summed number of tissues where protein is expressed
Summed number of tissues where protein is expressed
8 9 10 11 12 13 14
1234567891011121314
1234567891011121314
0.3
0.2
0.1
0.0
0.3
0.2
0.1
0.0
0.3
0.2
0.1
0.0
(a)
(b)
(c)
Genome Biology 2005, Volume 6, Issue 7, Article R56 Freilich et al. R56.5
comment reviews reports refereed researchdeposited research interactions information
Genome Biology 2005, 6:R56
or whether phyletic-universal proteins tend to be ubiqui-
tously expressed due to being enzymes.
The inter-relationship between function, 'phyletic age'
and expression
In order to identify whether a protein's expression pattern
better reflects function or age, the inter-relationship between
these three factors was compared statistically. After phyletic
age was taken into account, only a weak dependence between
function and tissue specificity was detected (test statistic
264.7, p value 0.04), suggesting that most of the relationship
observed between function and tissue specificity is accounted
for by the age of the gene. The relationship between phyletic
age and tissue specificity is not explained by a gene's function
(test statistic 339.1, p < 0.0001), nor is the relationship
between phyletic age and function explained by the tissue
specificity (test statistic 967.2, p << 0.0001). Therefore, the
results imply that enzymes tend to be ubiquitously expressed
mainly due to their phyletic universal origin (rather than due
to their functional classification).
In order to show the extent to which ancient metabolic pro-
teins are widely expressed, or to which young regulatory pro-
teins are tissue-specific, we have divided the functional
groups according to their phyletic groups (Figure 4). To have
a sufficient sample size for the bootstrap error analysis in Fig-
ure 4, we merged the four functional categories into two:
metabolism (enzymes and transporters) and regulation (tran-
scription factors and signal transduction). The expression
pattern of the two functional categories was examined in two
phyletic groups: the pre-metazoan group (universal and
eukaryote-specific groups) and the metazoan-specific group
(metazoan and mammalian-specific proteins) (Figure 4a,b).
From the expression distribution of metabolic proteins
(enzymes and transporters, Figure 4a), one can observe (as
can be inferred from the statistical test reported above) obvi-
ous differences between the 'older' pre-metazoan proteins
(universal and eukaryote-specific groups) and the more
recent metazoan proteins. Differences can be observed for the
regulatory proteins as well (Figure 4b): metazoan-specific
proteins tend to be more tissue-specific compared with pre-
metazoan ones, regardless of their functional class. A notable
difference between the expression patterns in Figure 4a and
4b occurs for specifically expressed pre-metazoan proteins,
where the proportion of regulatory proteins is much higher
than metabolic proteins, and it is not significantly different
from the fraction of metazoan-specific proteins. This con-
firms that the function has some influence on expression
independent of age but suggests that the effect is stronger in
specifically expressed pre-metazoan proteins.
Yet, although pre-metazoan proteins tend to be more widely
expressed, less than one-third of the pre-metazoan metabolic
proteins are expressed in all tissues. Ldhc (testis-specific lac-
tate dehydrogenase) is one example of a universal enzyme
whose expression is limited to few cell types in mammals. Ldh
participates in anaerobic glycolysis - a nearly universal path-
way that converts glucose into pyruvate. The sequence of
reactions in the pathway is similar in all organisms and in all
cell types. In contrast, the fate of pyruvate is variable. In a
variety of microorganisms, lactate is normally formed from
pyruvate in a reaction catalyzed by Ldh. In higher organisms,
most cells do not convert pyruvate to lactate and the reaction
is limited to few tissues [9]. In germ cells, where lactate is a
preferred energy source [10], we observe specific expression
of Ldhc (testis-specific expression). The expression of Ldhc is
an example of a function occurring in the ancestral unicellular
cell that becomes tissue-specific in multicellular species.
The testis-specific expression of two other universal enzymes
in our dataset - glucose-6-phosphate dehydrogenase 2
(G6pd-2) and phosphoglycerate kinase 2 (Pgk-2) - provides a
different example for a specific expression of universal
enzymes. G6pd-2 and Pgk-2 are believed to arise from their
isoenzymes, G6pd and Pgk-1, respectively, by a gene duplica-
tion event. G6pd and Pgk-1 are essential, widely expressed, X
chromosome-encoded genes. The absence of those two
enzymes during the inactivation of the X chromosome in
postmeiotic spermatogenic cells is compensated for by the
expression of their autosomal testis-specific isoenzymes
G6pd-2 and Pgk-2 [11,12]. Duplication events can therefore
explain some of the cases where universal enzymes are specif-
ically expressed.
Table 1
The distribution of function within the phyletic groups
Phyletic groups/functional
groups
Total functionally annotated
proteins (%)
Enzymes, % Transporters, % Transcription factors, % Signal transduction, %
Universal 833 (31%) 82 15 2 1
Eukaryote-specific 823 (31%) 60 18 12 10
Metazoan-specific 656 (24%) 26 7 23 44
Mammalian-specific 372 (14%) 13 17 6 64
All 2,684 52 14 11 23
R56.6 Genome Biology 2005, Volume 6, Issue 7, Article R56 Freilich et al. />Genome Biology 2005, 6:R56
The inter-relationship between 'phyletic age',
evolutionary rate and expression
Tissue-specific genes tend to evolve more rapidly than
broadly expressed ones [5-7]. Therefore, difficulties might
arise in identifying their distant homologs, leading to a corre-
lation between age and rate of evolution. We wanted to verify
that the expression patterns observed here cannot be
explained purely in terms of variation in the recent rate of
evolution, and so we have studied the expression profile of
different phyletic groups in a subset of the data where all
phyletic groups have evolved at approximately the same rate.
For each protein in our dataset we calculated an evolutionary
rate by measuring the K
a
/K
s
ratio with its ortholog in rat (see
Methods). The chi-squared test statistic for the independence
of age and tissue expression given rate in our data was 226.5,
whereas the maximum observed statistic in 10,000 random
draws, generated as described in Methods, was 84.3. The con-
nection between phyletic age and tissue specificity that we
observed in our data cannot be explained purely in terms of
both factors' mutual correlation with the recent rate of
evolution.
Discussion
It is important to remember that our analysis is based only on
those proteins that are present on the Affymetrix chip and
have GO annotation. Our dataset covers approximately one-
quarter of mouse proteins. Clearly, a better coverage for the
expression and annotation of proteins is desirable and could
change the conclusion presented below. In order to decrease
the probability that our results are arbitrary, we repeated the
experiment with a different set of tissues (seven components
of the gastrointestinal tract). The results obtained are com-
patible with the observations we report here (data not
shown).
We show here that multicellular specific proteins tend to be
more tissue-specific than 'ancient' universal proteins. Most of
the 'late' evolutionary proteins are transcription factors and
signal transduction proteins, categories that have previously
been suggested to play a crucial role in tissue differentiation.
However, our analysis suggests that more recent enzymes and
transporters also contribute to tissue diversity as many of
them are tissue-specific (Figure 4a). The selective expression
pattern of recent genes implies that a new protein is often
selected to perform a tissue-specific function rather than a
global one. A greater evolutionary flexibility of tissue-specific
proteins is compatible with previous studies suggesting that
tissue-specific proteins evolve more rapidly [5-7] due to less
strict functional constraints compared with broadly
expressed proteins [5,13].
Despite this trend, many metazoan-specific proteins are ubiq-
uitous and many universal proteins are tissue-specific. The
minimal cellular transcriptome of the metazoan cell differs
from that of the ancestral unicellular eukaryote: new func-
tions were added (metazoan-specific proteins), whilst other
functions became specialized and no longer took place in all
cells (tissue-specific pre-metazoan proteins). The extent of
the cellular specialization can be implied from the
observation that only one-third of the proteins are expressed
in all tissues examined. In some of these cases, functions
occurring in the unicellular cell become tissue-specific in
multicellular species. In other cases, universal genes that
have been duplicated become specific to a tissue whilst a
second copy maintains its original expression pattern. Only
about one-third of the pre-metazoan metabolic enzymes are
expressed in all tissues. Tissue differentiation is at least in
part achieved by tissue specialization of metabolism - either
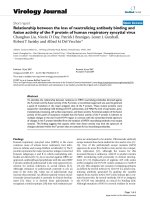
Expression distribution of mouse proteins functional groupsFigure 4
Expression distribution of mouse protein functional groups. (a) The
metabolic functional group includes enzymes and transporter proteins. (b)
The regulatory group includes signal transduction and transcription
regulation proteins. The pre-metazoa group includes universal proteins
and eukaryote specific proteins. The metazoan-specific group includes
metazoan-specific and mammalian-specific proteins. The plot presents the
fraction of proteins in a group that are expressed in N tissues. The analysis
is restricted to those proteins expressed in at least a single tissue. Sample
size (number of assigned proteins): pre-metazoa metabolic proteins 1370;
metazoan metabolic proteins 267, pre-metazoa regulatory proteins 169;
metazoan regulatory proteins 493. The error bars indicate the standard
error estimate using bootstrap resampling.
Expression distribution of mouse proteins'
metabolic functional groups
Pre-metazoan
Metazoan spp
Pre-metazoan
Metazoan spp
Expression distribution of mouse proteins'
regulatory functional groups
12
Fraction of all proteins in a given group
expressed in N tissues
3
0.00
0.05
0.10
0.15
0.20
0.25
0.30
Fraction of all proteins in a given group
expressed in N tissues
0.00
0.05
0.10
0.15
0.20
0.25
0.30
4567
Number of tissues in which protein is expressed
8 9 10 11 12 13 14
1234567
Number of tissues in which protein is expressed
8 9 10 11 12 13 14
(a)
(b)
Genome Biology 2005, Volume 6, Issue 7, Article R56 Freilich et al. R56.7
comment reviews reports refereed researchdeposited research interactions information
Genome Biology 2005, 6:R56
by differentially expressing two-thirds of the ancient meta-
bolic proteins, or by encoding new metabolic proteins. Pre-
sumably, the additional transcription-related proteins
provide the necessary control. We aim to further characterize
the expression patterns of processes that exist in the ancestral
metazoa and those that are specific to metazoa. In particular,
we are interested in studying the contribution of function dif-
ferentiation versus gene duplication to tissue diversity in
multicellular species.
Materials and methods
Expression profile determination
Tissues were dissected and snap frozen from 8-12-week old
C57/BL6 male mice with the exception of the ovaries, which
were taken from females. Tissue was pooled from between
four to six animals, the RNA extracted and 10 mg of total RNA
was labeled and then hybridized to the Affymetrix U74AV2
GeneChip using standard protocols (Affymetrix Inc, CA,
USA); complete experimental details for each of these stages
are given at [14]. Expression values and presence/absence
flags were generated from the CEL files using the Microarray
Suite 5.0 package (Affymetrix MAS 5.0) and its default set-
tings. The global scaling normalization method operated with
a target value setting of 100. Expression data flagged with a
marginal call was excluded from further analysis. The quality
of the microarray data was assessed first using the parameters
defined in the report file generated by MAS 5.0, next through
recording the percentage of outliers reported by dCHIP on
calculating expression values [15] and finally by using the Affy
package in the BioConductor suite of microarray analysis pro-
grams to generate degradation plots [16]. Chips failing the
quality control parameters recommended by the authors of
these programs were omitted from further analysis. The
microarray data (accession ID = E-HGMP-2) used in this
study is now available to download from ArrayExpress [17].
A subset of 14 samples representing distinct non-redundant
organs was chosen out of the complete dataset. The tissues
are listed in Figure 2. The use of different cut-offs within the
range of 0.025 <P value < 0.075 for absent/present flags labe-
ling has no effect on the analysis. Only absent/present calls
were used to define tissue-specificity and expression levels
have not been a factor in this analysis.
Mapping probe sets to mouse proteins
Out of 12,487 probe sets, 8,218 were mapped into EnsEmbl
mouse transcripts using Ensmart [18] (version 13.1, [19]).
Mapping of EnsEmbl transcripts to SWISS-PROT [20]
(release 41.25) and TrEmbl proteins (Release 24.13) were
obtained from the International Protein Index (IPI, [21]).
Proteins represented by more than a single probe set were
discarded in order to avoid re-counting. Different proteins
sharing the same probe sets were also eliminated (with the
exception of splice variants). A single and unique probe set
therefore represents each of the 6,242 remaining proteins.
Mouse protein functional annotation
A total of 4,918 proteins were assigned with a GO annotation
[22]. For simplicity and in order to avoid overlaps between
the functional categories, we studied the tissue distribution of
proteins assigned to four main categories from the highest
hierarchy level of the functional classification: enzymatic
activity, transporters, transcription regulation and signal
transduction. Proteins assigned to more than a single cate-
gory were discarded, leaving 2,686 proteins distributed as fol-
lows: 1,400 enzymes, 384 transporters, 617 proteins involved
in signal transduction and 285 proteins that regulate tran-
scription. The functional assignments are available from [23].
Mouse protein phyletic assignment
We used four categories to describe the evolutionary origin of
mouse proteins: universal proteins, that is, ubiquitous in the
three domains of life (bacteria, archaea and eukaryotes),
eukaryote-specific proteins, metazoan-specific proteins and
mammalian-specific proteins. The 6,242 mouse proteins
were classified into the phyletic categories according to the
results of a BLAST [24] search against 146 fully sequenced
species. A protein could only be assigned to a single category.
The classification process is hierarchical: proteins with hits to
more than five prokaryote species are classified as universal;
the remaining mouse proteins with at least a single hit to non-
metazoan eukaryotes are classified as eukaryote-specific; the
remaining mouse proteins with at least a single hit to non-
mammalian metazoa are classified as metazoan-specific; and,
finally, proteins recognizing only other mammalian proteins
are classified as mammalian-specific. The cut-off used was
BLAST e-score < 1e-3. Genomes were downloaded from the
COGENT [25] database (release 152).
The observations reported here are maintained using differ-
ent cut-offs within the range of 1e-10 < e-score < 1e-1. The
observations are also maintained when a universal protein is
defined as a protein with a hit in at least a single prokaryote
species or when it defined as a protein with a hit in at least ten
prokaryote species (examined under e-value cut-off of e-score
< 1e-3). Additional tests were performed in order to assure
that the phyletic distribution truly describes a complete
sequence distribution rather than domain distribution. The
classification of a protein to a phyletic group was done when
additional filters were added. This was in order to discard
those cases where a match between query and hit is based
only on recognition of a conserved domain rather than a com-
plete sequence (e-score <1e-3). Firstly, pfam domain compo-
sition: all query-hit pairs that do not share an identical pfam
domain composition were discarded from our dataset. Sec-
ondly, full coverage: all query-hit pairs where the alignment
does not cover the full length (80%) of both proteins were dis-
carded from our dataset.
When repeating the analysis with the filtered data, the results
confirm that the trends reported here are maintained (not
shown). Similar results were also obtained when using the
R56.8 Genome Biology 2005, Volume 6, Issue 7, Article R56 Freilich et al. />Genome Biology 2005, 6:R56
homologous clusters database STRING [26] for a phyletic
classification (universal proteins have to be recognized in at
least five prokaryote species). The 6,242 proteins are distrib-
uted in phyletic categories as follows: 1,428 universal pro-
teins, 2,088 eukaryote specific proteins, 1,567 metazoan
proteins, 1,123 mammalian-specific proteins; and 36 unclas-
sified proteins. The phyletic assignments are available from
[23].
K
a
/K
s
values
Mouse and rat 1:1 ortholog pairs were obtained from
EnsEmbl [16]. In those cases where a mouse protein had
more than a single rat ortholog it was discarded from the
analysis unless one of the ortholog pairs was annotated as
'best reciprocal hit' (BRH). The ratio of K
a
(the number of
non-synonymous substitutions per non-synonymous site) to
K
s
(the number of synonymous substitutions per synonymous
site) was calculated using the codeml program from the
PAML 3.13d package [27]. Two sequences had one or fewer
nucleotide mutations and so their K
a
/K
s
ratio could not be
reliably estimated. These sequences were discarded from the
analysis. In total, the K
a
/K
s
ratio was calculated for 4,056
mouse proteins from the 5,501 proteins classified to a phyletic
category and expressed in at least a single tissue (as shown in
Figure 3c).
Statistical tests
By grouping the genes into equal bins of similar recent rates
of evolution (K
a
/K
s
values) and then shuffling the phyletic
ages within each group, sample sets of data can be created
which have no connection between phyletic age and tissue
expression other than through their common connection to
recent rate of evolution. The connection between rate and tis-
sue specificity in each of these sample sets is identical to the
observed data and, because all genes in each bin have a simi-
lar rate of evolution, the connection between age and rate is
similar to the observed data. By generating random samples
in the manner as described above, the expected contingency
table of age/expression dependence and the null distribution
of the chi-squared test statistic can be estimated. Using the
estimated expected table, the chi-squared statistic for the
observed data can be calculated. The significance of the
observation was assessed by comparing the observed test sta-
tistic with those from 10,000 sets of data, of equal size to the
observed data, randomly generated according to the expected
contingency table (and so satisfying the null hypothesis).
The relationship between tissue specificity and phyletic age
and function was investigated using a contingency table test
under the null hypothesis that function and specificity are
independent of given age. Conceptually, the genes are divided
up according to age and a separate contingency table for spe-
cificity and function is formed for each group. The chi-
squared test statistic [25] for independence between function
and specificity is calculated for each table and then pooled,
weighted by the proportion of genes of each age, to give the
test statistic for independence between function and specifi-
city given age. The dependence between specificity and age
given function, and age and function given specificity, were
calculated similarly. The tables analyzed had cells expected to
contain a small number of observations, so it was inappropri-
ate to assess the significance of the test statistic using tables
of pre-calculated critical values. Instead, 10,000 sets of data,
of equal size to that observed, were generated in accordance
to the expected contingency table and the test statistics of
these were used to form an estimate of their distribution
under the null hypothesis, to which the observed test statistic
can be compared.
Additional data files
The following additional data are available with the online
version of this paper. Additional data file 1 contains the func-
tional assignments of the proteins used in the analysis. Addi-
tional data file 2 contains the phyletic assignments of the
proteins used in the analysis. Additional data file 3 contains
the sequences of the proteins used in the analysis.
Additional File 1Functional assignments of the proteins used in the analysisFunctional assignments of the proteins used in the analysis. Func-tional assignments of the proteins used in the analysisClick here for fileAdditional File 2Phyletic assignments of the proteins used in the analysisPhyletic assignments of the proteins used in the analysis. Phyletic assignments of the proteins used in the analysisClick here for fileAdditional File 3The sequences of the proteins used in the analysisThe sequences of the proteins used in the analysis. The sequences of the proteins used in the analysisClick here for file
Acknowledgements
We thank Eric Blanc for his suggestions on microarray data analysis and
Christian Von Mering for help with using the STRING database. Shiri
Freilich is supported by EMBL fellowship. Tim Massingham is supported by
BBRC grant 721/BEP17055. Tom Freeman, Paul Lyons and Sumit Bhattach-
aryya are supported by the UK MRC.
References
1. Chervitz SA, Aravind L, Sherlock G, Ball CA, Koonin EV, Dwight SS,
Harris MA, Dolinski K, Mohr S, Smith T, et al.: Comparison of the
complete protein sets of worm and yeast: orthology and
divergence. Science 1998, 282:2022-2028.
2. Aravind L, Subramanian G: Origin of multicellular eukaryotes -
insights from proteome comparisons. Curr Opin Genet Dev 1999,
9:688-694.
3. Subramanian S, Kumar S: Gene expression intensity shapes evo-
lutionary rates of the proteins encoded by the vertebrate
genome. Genetics 2004, 168:373-381.
4. Lehner B, Fraser AG: Protein domains enriched in mammalian
tissue-specific or widely expressed genes. Trends Genet 2004,
20:468-472.
5. Duret L, Mouchiroud D: Determinants of substitution rates in
mammalian genes: expression pattern affects selection
intensity but not mutation rate. Mol Biol Evol 2000, 17:68-74.
6. Winter EE, Goodstadt L, Ponting CP: Elevated rates of protein
secretion, evolution, and disease among tissue-specific
genes. Genome Res 2004, 14:54-61.
7. Zhang L, Li WH: Mammalian housekeeping genes evolve more
slowly than tissue-specific genes. Mol Biol Evol 2004, 21:236-239.
8. Hughes ALP: Adaptive evolution of genes and genomes New York:
Oxford University Press; 1999.
9. Stryer L: Biochemistry 4th edition. New York, NY: Freeman; 1995.
10. Goddard I, Florin A, Mauduit C, Tabone E, Contard P, Bars R, Chuzel
F, Benahmed M: Alteration of lactate production and transport
in the adult rat testis exposed in utero to flutamide. Mol Cell
Endocrinol 2003, 206:137-146.
11. Hendriksen PJ, Hoogerbrugge JW, Baarends WM, de Boer P, Vree-
burg JT, Vos EA, van der Lende T, Grootegoed JA: Testis-specific
expression of a functional retroposon encoding glucose-6-
phosphate dehydrogenase in the mouse. Genomics 1997,
41:350-359.
12. Boer PH, Adra CN, Lau YF, McBurney MW: The testis-specific
phosphoglycerate kinase gene pgk-2 is a recruited
Genome Biology 2005, Volume 6, Issue 7, Article R56 Freilich et al. R56.9
comment reviews reports refereed researchdeposited research interactions information
Genome Biology 2005, 6:R56
retroposon. Mol Cell Biol 1987, 7:3107-3112.
13. Hastings KE: Strong evolutionary conservation of broadly
expressed protein isoforms in the troponin I gene family and
other vertebrate gene families. J Mol Evol 1996, 42:631-640.
14. Affymetrix GeneChip
®
probe array methods [http://
www.hgmp.mrc.ac.uk/Research/Microarray/Affymetrix_Genechip/
protocols_affymetrix.jsp]
15. Li C, Wong WH: Model-based analysis of oligonucleotide
arrays: expression index computation and outlier detection.
Proc Natl Acad Sci USA 2001, 98:31-36.
16. Bioconductor []
17. ArrayExpress [ />18. Kasprzyk A, Keefe D, Smedley D, London D, Spooner W, Melsopp C,
Hammond M, Rocca-Serra P, Cox T, Birney E: EnsMart: a generic
system for fast and flexible access to biological data. Genome
Res 2004, 14:160-169.
19. Ensembl MartView [ />20. Bairoch A, Apweiler R: The SWISS-PROT protein sequence
database and its supplement TrEMBL in 2000. Nucleic Acids Res
2000, 28:45-48.
21. International Protein Index [ />help.html]
22. Camon E, Magrane M, Barrell D, Binns D, Fleischmann W, Kersey P,
Mulder N, Oinn T, Maslen J, Cox A, Apweiler R: The Gene Ontol-
ogy Annotation (GOA) project: implementation of GO in
SWISS-PROT, TrEMBL, and InterPro. Genome Res 2003,
13:662-672.
23. Supplemental data [ />24. Altschul SF, Madden TL, Schaffer AA, Zhang J, Zhang Z, Miller W, Lip-
man DJ: Gapped BLAST and PSI-BLAST: a new generation of
protein database search programs. Nucleic Acids Res 1997,
25:3389-3402.
25. Janssen P, Enright AJ, Audit B, Cases I, Goldovsky L, Harte N, Kunin
V, Ouzounis CA: COmplete GENome Tracking (COGENT): a
flexible data environment for computational genomics. Bioin-
formatics 2003, 19:1451-1452.
26. von Mering C, Huynen M, Jaeggi D, Schmidt S, Bork P, Snel B:
STRING: a database of predicted functional associations
between proteins. Nucleic Acids Res 2003, 31:258-261.
27. Yang Z: PAML: a program package for phylogenetic analysis
by maximum likelihood. Comput Appl Biosci 1997, 13:555-556.
28. Howell DC: Statistical methods for psychology 4th edition. Belmont, CA:
Duxbury Press; 1992.