Báo cáo y học: "Datasets for evolutionary comparative genomics" ppsx
Bạn đang xem bản rút gọn của tài liệu. Xem và tải ngay bản đầy đủ của tài liệu tại đây (1.21 MB, 4 trang )
Genome Biology 2005, 6:117
comment
reviews
reports
deposited research
interactions
information
refereed research
Opinion
Datasets for evolutionary comparative genomics
David A Liberles
Address: Computational Biology Unit, Bergen Centre for Computational Science, University of Bergen, 5020 Bergen, Norway.
E-mail:
Published: 28 July 2005
Genome Biology 2005, 6:117 (doi:10.1186/gb-2005-6-8-117)
The electronic version of this article is the complete one and can be
found online at />© 2005 BioMed Central Ltd
Bioinformaticists and computational biologists working in the
field of comparative genomics are largely dependent on
datasets generated by others. Working with available data
opens up desires for complementary datasets to fill knowledge
gaps. In addition to writing grants for experimental laborato-
ries and molecular biology supplies, one can also write an
opinion piece to convince others to do some of the dirty work
for you; this is what I am attempting to do here. Comparative
genomics starts with sequencing. Many have suggested gaps
in the tree of life, where additional genome projects will
augment current knowledge, either to shorten long ‘branches’
on the tree of sequenced genomes or to complement existing
genome projects. For example, there remain huge gaps in our
knowledge of archaea. But with the faith that these gaps will
ultimately be filled in, in this article I focus on alternative
strategies for directing genomic resources so as to answer fun-
damental questions in evolution.
The tape of life
A whole class of genomic experiments can be hypothesized
through what can be called the ‘tape of life’ question.
Stephen J. Gould wrote in his book Wonderful Life [1],
“Wind back the tape of life to the early days of the Burgess
shale; let it play again from an identical starting point, and
the chance becomes vanishingly small that anything like
human intelligence would grace the replay”. At the molecu-
lar level, the tape of life has been played in parallel. Different
species have gone from a similar ancestral point to a similar
derived phenotype. In these cases, are the same molecules
and pathways driving the phenotypic evolution? Compara-
tive genomics gives us unprecedented opportunities to
answer such questions.
A few studies have tried to address the tape-of-life question
through analysis of a single gene, such as the melanocortin-1
receptor (MC1R). This receptor plays a role in pigmentation
and body/hair color, representing an obvious link between
selectable genotype and phenotype. MC1R has been demon-
strated to be under such selective pressure in various birds
[2] and mammals [3]. In another set of studies, the tran-
scription factor Pitx1, involved in hindlimb formation, has
been implicated in parallel evolution of morphologically very
distinct types of stickleback fish [4]. At a genomic level,
there are whole classes of experiments that can be proposed
where phenotypic evolution is the driving force.
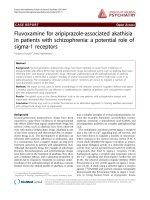
As an example of the tape-of-life question played in parallel,
terrestrial mammals have returned to the water in at least
three independent lineages (see Figure 1). Seals diverged
from dogs (which have an ongoing genome project); whales
evolved from an ancestor shared with the hippopotamus
(there are ongoing terrestrial Artiodactyl genome projects
for the somewhat related pig and cow); and manatees
evolved from an ancestor shared with hyrax (a small furry
mammal also know as a dassie) and elephants (a genome
project for elephants has now been funded) [5]. Systematic
comparisons of parallel anatomic evolution have been made
Abstract
Many decisions about genome sequencing projects are directed by perceived gaps in the tree of life,
or towards model organisms. With the goal of a better understanding of biology through the lens of
evolution, however, there are additional genomes that are worth sequencing. One such rationale for
whole-genome sequencing is discussed here, along with other important strategies for understanding
the phenotypic divergence of species.
from several aquatic mammal lineages (see, for example,
[6]). In the three branches suggested above, a close terres-
trial relative has an ongoing or highly prioritized complete
genome sequencing project, but sufficient sequences are not
available from the aquatic mammals to allow thorough com-
parisons. Systematic study of gene sequences, relative
expression levels of genes, alternative splicing changes, and
other functional data in appropriate related species will
allow the type of analysis that tests whether the same path-
ways, genes, and nucleotide positions were under similar
selective pressures during re-adaptation of an ancestral ter-
restrial mammal to an aqueous environment.
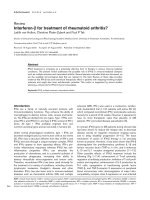
Cichlid fish (together with Darwin’s finches) may be the text-
book example(s) of parallel evolution (reviewed in [7,8]). As
seen in Figure 2a, haplochromine cichlids from Lake Tan-
ganyika gave rise to a whole diversity of cichlids in Lake
Malawi and in Lake Victoria. The entire 600 species of Lake
Victoria cichlids diverged from a single lineage of Lake Tan-
ganyika cichlids in about 100,000 years [7]. A similar origin of
Lake Malawi cichlids has resulted in species closely resem-
bling more distantly related Lake Tanganyika cichlids, as seen
in Figure 2b. Cichlids are another ideal system in which to
study the link between selectable genotype and phenotype;
many other adaptive regimes, for example cold adaptation,
can also be examined in this context, and a draft cichlid
genome is now planned by the US Joint Genome Institute [9].
Rapid phenotypic evolution
Just as genome sequencing projects can be directed at inter-
esting examples of parallel evolution, large-scale sequencing
efforts can also be directed at points where phenotypic change
appears to have been particularly rapid. This will improve the
signal-to-noise ratio in attempting to detect those substitu-
tions that drove phenotypic change. Studies of parallelism in
the cichlid fish, especially in Lake Victoria, fall into this cate-
gory (as well as the parallel evolution category) [7]. In another
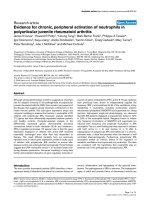
example, polar bears diverged from brown bears only a little
more than 100,000 years ago. The oldest polar bear fossil is
less than 100,000 years old [10]. From phylogenetics, polar
bears fall within the brown bear clade (see Figure 3), indicat-
ing that some brown bears are more closely related to polar
bears than they are to other brown bears [11]. During the past
100,000 years, polar bears have undergone changes in body
size and morphology, hair color, dietary preference, and
habitat, as well as multiple behavioral changes. Morphologists
can probably point to other similar examples of rapid pheno-
typic evolution. Sequencing from species such as these will
enable better detection of the links between genotype and
phenotype using a comparative approach.
Examination of the tape-of-life question or rapid phenotypic
evolution does not need to involve entire genome sequenc-
ing. Large-scale full-length cDNA [12,13] and upstream pro-
moter sequence can be generated more cheaply but contains
much of the relevant functional information. The molecular
basis for changes in coding sequence function, gene expres-
sion, and possibly alternative splicing is likely to be con-
tained within such data. Ultimately, population-level data in
the form of single nucleotide polymorphisms (SNPs) linked
to biogeography will also be desirable, to shed light on the
process of speciation.
Regulatory evolution
In addition to coding-sequence evolution, changes in alter-
native splicing patterns and gene-expression levels and pat-
terns can also contribute to lineage-specific diversification.
Large-scale inter-specific datasets that characterize relative
splice-site usage or splice-variant frequencies would be valu-
able. An initial study comparing alternative splicing patterns
in mouse, rat, and human led to the conclusion that alterna-
tive splice variants, like gene duplicates, have been used as a
testbed for evolutionary novelty [14].
Changes in gene expression have become the leading candi-
dates as drivers of evolutionary novelty, dating back to Allan
Wilson’s attempt to explain the phenotypic divergence
between human and chimpanzee [15]. Pioneering work on the
evolution of regulatory networks in echinoderms has pointed
to a major role for changes in the expression of key regulatory
proteins during development in driving morphological change
[16]. A systematic examination of gene-expression changes in
higher primates has also been presented [17]. The molecular
117.2 Genome Biology 2005, Volume 6, Issue 8, Article 117 Liberles ttp://genomebiology.com/2005/6/8/117
Genome Biology 2005, 6:117
Figure 1
A standard rooted phylogenetic tree of eutherian mammals [5]. It
indicates the branches where the aquatic species, seals, whales, and
manatees, evolved together with their closest relatives that do (in bold)
or do not (plain text) have complete genome sequencing projects. Some
relationships are indicated in non-binary nodes where the branching
order is not clear.
Dog
Seal
Pig
Cow
Whale
Hippopotamus
Elephant
Hyrax
Manatee
variation in the human population that affects gene expres-
sion that is subject to the diversifying selection and fixation
seen in inter-specific studies is also being characterized [18]
and can be related to chimpanzee sequences in a bid to
understand lineage-specific evolution. Extending this in a
well controlled study across larger portions of the tree of life
(initially at the inter-specific level) is warranted.
Both relative gene-expression levels and relative alternative
splicing levels are continuous variables, unlike sequences that
are discretely A, C, G or T. There are methods for reconstruct-
ing such values over a phylogenetic tree and parsing changes
onto branches, coupled to a reconstruction of the regulatory
sequences that govern such processes (see, for example, [19]).
The power of harnessing phylogenetic information not only
provides an understanding of the molecular basis for organis-
mal phenotypic divergence but can also be used to reduce the
background ‘noise’ in attempts to understand basic principles
of transcriptional regulation, mRNA splicing, and protein
folding and function [19,20].
Even within the completed genomes that we already have,
there are many unknown genes. Phylogenetic focusing (sys-
tematically attempting to sequence such genes from closely
related species) will help us understand how they evolved,
their function, and the evolution of novel genes in general.
This can also be applied to rare protein structures, in order to
understand the process of neostructuralization by searching
for phylogenetic intermediates that provide a ‘missing link’
sequence. Phylogenetic focusing will be greatly aided by the
establishment of local DNA banks containing genomic DNA
from regionally specific species. This will also aid nations and
their regions in understanding local biodiversity.
Ohno [21], and subsequently Lynch and Conery [22], pro-
posed a major role for gene duplication in the generation of
evolutionary novelty. Wilson and Davidson and colleagues
have done the same for gene expression [15,16]; the Lee lab
has done the same for alternative splicing [14]. All are proba-
bly right to some degree, as evolution is opportunistic and
different regulatory mechanisms have potential different
selectable outcomes. Generating datasets that enable us to
integrate such knowledge and output better models (also
comment
reviews
reports
deposited research
interactions
information
refereed research
Genome Biology 2005, Volume 6, Issue 8, Article 117 Liberles 117.3
Genome Biology 2005, 6:117
Heterochromis multidens
Tylochromis polylepis
Oreochromis tanganyicae
Cyphotilapia frontosa
Boulengerochromis microlepis
Schwetzochromis malagaraziensis
Bathybatini (8)
Eretmodini (4)
Lamprologini (approximately 100)
10 5 0 MYA
Limnochromini (13)
Perissodini (6)
Cyprichromini (6)
Riverine haplochromines
(approximately 30)
Tropheini (approximately 30)
Lake Malawi species flock
(approximately 1000)
Riverine haplochromines
(approximately 100)
Lake Victoria region superflock
(approximately 600)
Ectodini (30)
Trematocarini (8)
(a)
Julidochromis ornatus
Melanochromis
auratus
Pseudotropheus
microstoma
Ramphochromis
longiceps
Cyrtocara moorei
Placidochromis
milomo
Tropheus brichardi
Bathybates ferox
Lobochilotes
labiatus
Cyphotilapia
frontosa
(b)
Figure 2
The evolution of cichlid fish. (a) A phylogenetic tree adapted with
permission from [7] indicates the origin of Lake Malawi and Lake Victoria
cichlids from a single lineage of Lake Tanganyika cichlids; the bracket
indicates the Lake Tanganyika and riverine cichlids. MYA, millions of years
ago; numbers of species are indicated in parentheses; all species shown
are cichlids. (b) A single lineage from the diverse cichlid species of Lake
Tanganyika (left) recapitulates a diverse group of cichlid species in Lake
Malawi (right) from a single lineage. Many of the Lake Malawi cichlids
evolved to fill similar niches to more distantly related species in Lake
Tanganyika, and species in similar niches have a surprisingly similar
appearance (reproduced from [8] with permission from Roberto Osti).
drawing on work in population genetics, structural genomics,
and systems biology) will allow a better understanding of
biology, with evolution at its core. This article aims to con-
tinue a dialog between experimental and computational
researchers towards the aim of a better understanding of
genomes, and to encourage experimentalists to provide the
community with even more varieties of genomic data.
Acknowledgements
I thank Axel Meyer for interesting discussions and for providing Figure 2,
Peter Haase (Copenhagen Zoo) for providing Figure 3b and 3c and Marie
Skovgaard, Matthew Betts, Janos Kodra, and Stephen Liberles for com-
ments and suggestions.
References
1. Gould SJ: Wonderful Life: The Burgess Shale and the Nature of History.
New York: W.W. Norton & Company; 1989.
2. Mundy NI, Badcock NS, Hart T, Scribner K, Janssen K, Nadeau NJ:
Conserved genetic basis of a quantitative plumage trait
involved in mate choice. Science 2004, 303:1870-1873.
3. Nachman MW, Hoekstra HE, D’Agostino SL: The genetic basis of
adaptive melanism in pocket mice. Proc Natl Acad Sci USA 2003,
100:5268-5273.
4. Shapiro MD, Marks ME, Peichel CL, Blackman BK, Nereng KS, Jonsson
B, Schluter D, Kingsley DM: Genetic and developmental basis of
evolutionary pelvic reduction in threespine sticklebacks. Nature
2004, 428:717-723.
5. Liu FG, Miyamoto MM, Freire NP, Ong PQ, Tennant MR, Young TS,
Gugel KF: Molecular and morphological supertrees for euther-
ian (placental) mammals. Science 2001, 291:1786-1789.
6. Hatfield JR, Samuelson DA, Lewis PA, Chisholm M: Structure and
presumptive function of the iridocorneal angle of the West
Indian manatee (Trichechus manatus), short-finned pilot whale
(Globicephala macrorhynchus), hippopotamus (Hippopotamus
amphibius), and African elephant (Loxodonta africana). Vet
Opthalmol 2003, 6:35-43.
7. Salzburger W, Meyer A: The species flocks of East African cichlid
fishes: recent advances in molecular phylogenetics and popu-
lation genetics. Naturwissenschaften 2004, 91:277-290.
8. Stiassny MLJ, Meyer A: Cichlids of the rift lakes. Sci Am 1999, 64-69.
9. DOE Joint Genome Institute - Why Sequence Cichlid Fish?
[ />10. Kurten B: The evolution of the polar bear, Ursus maritimus. Acta
Zoologica Fennica 1964, 108:1-26.
11. Talbot SL, Shields GF: A phylogeny of the bears (Ursidae) inferred
from complete sequences of three mitochondrial genes. Mol
Phylogenet Evol 1996, 5:567-575.
12. Okazaki Y, Furuno M, Kasukawa T, Adachi J, Bono H, Kondo S,
Nikaido I, Osato N, Saito R, Suzuki H, et al.: Analysis of the mouse
transcriptome based on functional annotation of 60,770 full-
length cDNA. Nature 2002, 420:563-573.
13. Crawford DL: Functional genomics does not have to be limited
to a few select organisms. Genome Biol 2001, 2:interactions1001.1-
1001.2.
14. Modrek B, Lee CJ: Alternative splicing in the human, mouse and
rat genomes is associated with an increased frequency of exon
creation and/or loss. Nature Genet 2003, 34:177-180.
15. King MC, Wilson AC: Evolution at two levels in humans and
chimpanzees. Science 1975, 188:107-116.
16. Hinman VF, Nguyen AT, Cameron RA, Davidson EH: Developmental
gene regulatory network architecture across 500 million years
of echinoderm evolution. Proc Natl Acad Sci USA 2003, 100:13356-
13361.
17. Enard W, Khaitovich P, Klose J, Zollner S, Heissig F, Giavalisco P,
Nieselt-Struwe K, Muchmore E, Varki A, Ravid R, et al.: Intra- and
interspecific variation in primate gene expression patterns.
Science 2002, 296:340-343.
18. Rockman MV, Wray GA: Abundant raw material for cis-regula-
tory evolution in humans. Mol Biol Evol 2002, 19:1991-2004.
19. Rossnes R, Eidhammer I, Liberles DA: Phylogenetic reconstruction
of ancestral character states for gene expression and mRNA
splicing data. BMC Bioinformatics 2005, 6:127.
20. Fukami-Kobayashi K, Schreiber DR, Benner SA: Detecting compen-
satory covariation signals in protein evolution using recon-
structed ancestral sequences. J Mol Biol 2002, 319:729-743.
21. Ohno S: Evolution by Gene Duplication. Berlin: Springer; 1970.
22. Lynch M, Conery JS: The origins of genome complexity. Science
2003, 302:1401-1404.
117.4 Genome Biology 2005, Volume 6, Issue 8, Article 117 Liberles ttp://genomebiology.com/2005/6/8/117
Genome Biology 2005, 6:117
Figure 3
The relationship of polar bears to other bears. (a) A rooted phylogenetic
tree adapted from [11]. Polar bears are thought to have diverged from
brown bears from the ABC Islands in Canada after these brown bears
had diverged from other brown bears. Black bears and other bear species
are more distantly related to both polar bears and brown bears. The
pictures show (b) a brown bear (not from the ABC islands) (Ursus arctos)
and (c) a polar bear (Ursus maritimus). Original bear images courtesy of
Peter Haase, Carl Lund and Michael Petersen (Copenhagen Zoo).
Polar bears
ABC Island brown bears
Other brown bears
Black bears
(a)
(b)
(c)