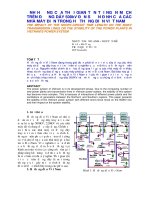
CỘNG HƯỞNG TẦN SỐ THẤP TRONG HỆ THỐNG ĐIỆN (SUBSYNCHRONOUS RESONANCE IN POWER SYSTEMS)
Bạn đang xem bản rút gọn của tài liệu. Xem và tải ngay bản đầy đủ của tài liệu tại đây (4.42 MB, 272 trang )
SUBSYNCHRONOUS
RESONANCE
IN
POWER
SYSTEMS
OTHER IEEE PRESS BOOKS
Teleconferencing,
Edited by D. Bodson and R. Schaphorst
Polysilicon Emitter Bipolar Transistors, Edited by A. K. Kapoor and D. J. Roulston
Integration of Information Systems: Bridging Heterogeneous Databases, Edited by A. Gupta
Numerical Methods for Passive Microwave and Millimeter Wave Structures, Edited by R.
Sorrentino
Visual Communications Systems, Edited by A. N. Netravali and B. Prasada
Analog MOS Integrated Circuits, II, Edited by P. R. Gray, B. A. Wooley, and R. W.
Brodersen
Electrostatic Discharge and Electronic Equipment, By W. Boxleitner
Instrumentation and Techniques for Radio Astronomy, Edited by P. F. Goldsmith
Network Interconnection and Protocol Conversion, Edited by P. E. Green, Jr.
VLSI Signal Processing, III, Edited by R. W. Brodersen and H. S. Moscovitz
Microcomputer-Based Expert Systems, Edited by A. Gupta and B. E. Prasad
Principles of Expert Systems, Edited by A. Gupta and B. E. Prasad
High Voltage Integrated Circuits, Edited by B. J. Ba/iga
Microwave Digital Radio, Edited by L. J. Greenstein and M. ShaJi
Oliver Heaviside: Sage in Solitude, By P. J. Nahin
Radar Applications, Edited by M. I. Skolnik
Principles of Computerized Tomographic Imaging, By
A.
C. Kak and M. Slaney
Selected Papers on Noise in Circuits and Systems, Edited by
M.
S. Gupta
Spaceborne Radar Remote Sensing: Applications and Techniques, By C. Elachi
Engineering Excellence, Edited by D. Christiansen
A complete listing of IEEE PRESS books is available upon request.
ii
SUBSYNCHRONOUS
RESONANCE
IN
POWER
SYSTEMS
P.
M.
Anderson
President
and
Principal
Engineer
Power
Math
Associates,
Inc.
8.
L.
Agrawal
Senior
Consulting
Engineer
Arizona
Public
Service
Co.
J.
E.
Van
Ness
Professor
of
Electrical
Engineering
and
Computer
Science
Northwestern
University
Published
under
the
sponsorship
of
the
IEEE
Power
Engineering
Society_
+
IEEE
PRESS
The
Institute
of
Electrical
and
Electronics
Engineers,
Inc.,
New
York
F. S. Barnes
J. E. Brittain
J. T. Cain
S.
H. Charap
D. G. Childers
H. W. Colborn
R. C. Dorf
L.
J. Greenstein
IEEE PRESS
1989 Editorial Board
Leonard Shaw,
Editor in Chief
Peter Dorato, Editor, Selected Reprint Series
J.
F. Hayes
W. K. Jenkins
A.
E. Joel, Jr.
R. G. Meyer
Seinosuke
Narita
W. E. Proebster
J. D. Ryder
G. N. Saridis
C. B. Silio, Jr.
W. R. Crone,
Managing Editor
Hans P. Leander, Technical Editor
Allen Appel, Associate Editor
M. I. Skolnik
G. S. Smith
P.
W. Smith
M. A. Soderstrand
M. E. Van Valkenburg
Omar Wing
J. W. Woods
John Zaborsky
Copyright
© 1990 by
THE INSTITUTE OF ELECTRICAL AND ELECTRONICS ENGINEERS, INC.
3 Park
Avenue,
17th Floor,New
York,
NY 10016-5997
All
rights reserved.
IEEE Order
Number:
PP2477
The
Library
of Congress has catalogued the
hard
cover edition of this title as follows:
Anderson, P. M. (Paul M.), 1926-
Subsynchronous resonance
in power systems/P. M. Anderson, B. L.
Agrawal, J.
E. Van Ness.
p. em.
,'Published under the sponsorship of the IEEE Power Engineering Society."
Includes bibliographical references.
ISBN 0-87942-258-0
1. Electric power system stability-Mathematical models.
2. Subsynchronous resonance (Electrical engineering)-Mathematical models.
wal, B.
L. (Bajarang L.), 1947- . II. Van Ness, J. E. (James E.) III. Title.
TKlOO5.A73
1989
621.3-dc20
iv
I. Agra-
89-28366
CIP
Dedicated to
Our
Colleagues
Richard
G.
Farmer
and
Eli Katz
who provided
the
opportunity for preparation of
this
book
and
gave generously of
their
special technical knowledge
of Subsynchronous Resonance
v
TABLE OF CONTENTS
Preface
xi
PART 1
INTRODUCTION
Chapter
1 Introduction
1.1 Definition of SSR 3
1.2 Power System Modeling 4
1.3 Introduction to SSR 9
1.3.1 Types of SSR Interactions 10
1.3.2 Analytical Tools 11
1.4 Eigenvalue Analysis 16
1.4.1 Advantages of Eigenvalue Computation 16
1.4.2 Disadvantages of Eigenvalue Calculation 17
1.5 Conclusions 17
1.6 Purpose, Scope, and Assumptions 18
1.7 Guidelines for Using This Book 19
1.8 SSR References 20
1.8.1 General References 20
1.8.2 SSR References 20
1.8.3 Eigenvalue/Eigenvector Analysis References 21
1.9 References for Chapter 1 23
3
PART 2
SYSTEM MODELING
29
Chapter 2 The Generator Model
2.1 The Synchronous Machine Structure 31
2.2 The Machine Circuit Inductances 36
2.2.1 Stator Self Inductances 37
2.2.2 Stator Mutual Inductances 38
2.2.3 Rotor Self Inductances 38
2.2.4 Rotor Mutual Inductances 38
2.2.5 Stator-to-Rotor Mutual Inductances 39
2.3 Park's Transformation 40
2.4 The Voltage Equations 47
2.5 The Power and Torque Equations 53
2.6 Normalization of the Equations 57
2.7 Analysis of the Direct Axis Equations 62
2.8 Analysis of the Quadrature Axis Equations 68
2.9 Summary of Machine Equations 68
2.10 Machine-Network Interface Equations 70
2.11 Linear State-Space Machine Equations 73
2.12 Excitation Systems 78
2.13 Synchronous Machine Saturation 80
2. 13.1 Parameter Sensitivity to Saturation 85
vii
31
2.13.2 Saturation in SSR Studies 87
2.14 References for Chapter 2 91
Chapter 3 The Network Model
3.1 An Introductory Example 95
3.2 The Degenerate Network 102
3.3 The Order of Complexity of the Network 106
3.4 Finding the Network State Equations 108
3.5 Transforming the State Equations 113
3.6 Generator Frequency Transformation 119
3.7 Modulation of the 60 Hz Network Response 122
3.8 References for Chapter 3 127
Chapter 4 The Turbine-Generator Shaft Model
4.1 Definitions and Conventions 129
4.2 The Shaft Torque Equations 132
4.3 The Shaft Power Equations 136
4.4 Normalization of the Shaft Equations 141
4.5 The Incremental Shaft Equations 144
4.6 The Turbine Model 146
4.7 The Complete Turbine and Shaft Model 148
4.8 References for Chapter 4 154
93
129
PART 3
SYSTEM PARAMETERS
155
189
Chapter 5 Synchronous Generator Model Parameters
157
5. 1 Conventional Stability Data 158
5. 1.1 Approximations Involved in Parameter Computation 161
5.2 Measured Data from Field Tests 162
5.2.1 Standstill Frequency Response (SSFR) Tests 168
5.2.2 Generator Tests Performed Under Load 170
5.2.2.1 The On-Line Frequency Response Test 170
5.2.2.2 Load Rejection Test 171
5.2.2.3 Off-Line Frequency Domain Analysis of Disturbances 172
5.2.3 Other Test Methods 172
5.2.3.1 The Short Circuit Test 172
5.2.3.2 Trajectory Sensitivity Based Identification 173
5.3 Parameter Fitting from Test Results 173
5.4 Sample Test Results 174
5.5 Frequency Dependent
R and X Data 182
5.6 Other Sources of Data 184
5.7 Summary 184
5.8 References for Chapter 5 185
Chapter 6 Turbine-Generator Shaft Model Parameters
6.1 The Shaft Spring-Mass Model 189
6.1.1 Neglecting the Shaft Damping 190
6. 1.2 Approximate Damping Calculations 193
6.1.2.1 Model Adjustment 194
6.1.2.2 Model Adjustment for Damping 197
viii
215
6.1.2.3 Model Adjustment for Frequencies 199
6.1.2.4 Iterative Solution of the Inertia Adjustment Equations 200
6.2 The Modal Model 207
6.3 Field Tests for Frequencies and Damping 208
6.4 Damping Tests 209
6.4.1 Transient Method 209
6.4.2 Steady-State Method 210
6.4.3 Speed Signal Processing 211
6.4.4 Other Methods 211
6.4.5 Other Factors 211
6.5 References for Chapter 6 212
PART
4 SYSTEM ANALYSIS 213
Chapter 7
Eigen
Analysis
7.1 State-Space Form of System Equations 215
7.2 Solution of the State Equations 218
7.3 Finding Eigenvalues and Eigenvectors 223
7.4 References for Chapter 7 225
Chapter 8 SSR Eigenvalue Analysis 227
8.1 The IEEE First Benchmark Model 227
8.1.1 The FBM Network Model 228
8.1.2 The FBM Synchronous Generator Model 230
8.1.3 The FBM Shaft Model 230
8.2 The IEEE Second Benchmark Model 233
8.2.1 Second Benchmark Model-System #1 234
8.2.2 Second Benchmark Model-System #2 235
8.2.3 SBM Generator, Circuit, and Shaft Data 236
8.2.4
Computed Results for the Second Benchmark Models 240
8.3 The CORPALS Benchmark Model 242
8.3.1 The CORPALS Network Model 245
8.3.2 The CORPALS Machine Models 245
8.3.3 The CORPALS Eigenvalues 246
8.4 An Example of SSR Eigenvalue Analysis 250
8.4.1 The Spring-Mass Model 251
8.4.2 The System Eigenvalues 253
8.4.3 Computation of Net Modal Damping 255
8.5 References for Chapter 8 256
Index
About
the Authors
ix
257
269
Preface
This book is
intended
to provide
the
engineer with technical information on
subsynchronous
resonance
(SSR),
and
to show how
the
computation
of
eigenvalues for
the
study
of SSR in an interconnected power system can be
accomplished.
It
is
primarily
a book on
mathematical
modeling.
It
describes
and
explains
the
differential equations of
the
power system
that
are
required
for
the
study
of SSR. However,
the
objective of modeling is
analysis. The analysis of SSR may be performed in several different ways,
depending
on
the
magnitude
of
the
disturbance
and
the
purpose of
the
study.
The
goal
here
is to examine
the
small
disturbance behavior of a
system
in which SSR oscillations
may
exist. Therefore, we
present
the
equations
to compute
the
eigenvalues
of
the
power
system
so
that
the
interaction
between
the
network
and
the
turbine-generator
units
can
be
studied. Eigenvalue
analysis
requires
that
the
system
be linear. Since
turbine-generator
equations
are
nonlinear,
the
linearization
of
these
equations is also explained in detail. The equations
are
also normalized to
ease
the
problem of providing
data
for existing systems
and
for
estimating
data
for future systems
that
are
under
study.
There
are
many
references
that
describe SSR phenomena, some general or
introductory in
nature,
and
others very technical
and
detailed. The
authors
have been motivated to provide a book
that
is tutorial on
the
subject of SSR,
and
to provide more detail in
the
explanations
than
one generally finds in
the
technical
literature.
It
is
assumed
that
the
user
of
this
book is
acquainted
with
power
systems
and
the
general
way in which power
systems
are
modeled for analysis.
Normalization
of
the
power
system
equations
is
performed
here,
but
without
detailed
explanation.
This
implies
that
background
study
may
be
required
by some readers,
and
this
study
is
certainly
recommended. In some cases,
the
background
reading
may be very important. Numerous references
are
cited to point
the
way
and
certain references
are
mentioned in
the
text
that
are
believed to be helpful.
The
authors
wish
to acknowledge
the
support
of
the
Los
Angeles
Department
of
Water
and
Power (DWP)
and
the
Arizona Public Service
Company (APS) for sponsoring
the
work
that
led to
the
writing of this book.
In particular,
the
advice
and
assistance of Eli Katz
and
Richard Lee of DWP
and
of Richard
Farmer
of APS
are
acknowledged. Mr. Katz was
the
prime
mover in
having
this
work
undertaken,
and
he did so in anticipation of his
retirement,
at
which time he realized
that
he was
about
the
only person in
his company with experience in solving SSR problems. He
and
Mr. Lee felt
xi
that
a tutorial reference book would be helpful to
their
younger colleagues,
since
there
are
no textbooks on
the
subject,
and
requested
that
a
tutorial
report be submitted on
the
subject. They also felt
that
their
company needed
the
eigenvalue computation capability to reinforce
other
methods
then
in
use by
their
company for SSR studies.
Mr.
Farmer
of APS also became involved in
the
project
and
assisted greatly
in
its
success,
drawing
on his
personal
knowledge of
the
subject. He
provided valuable insight
and
was responsible for focusing
our
work
at
the
microcomputer level.
This
had
not
been
previously considered,
partly
because eigenvalue computation is computer intensive
and
had
"always
been done" on large computers. In retrospect,
this
was a
great
idea,
and
we all became quite enthusiastic about it.
This project led to a collaboration among
the
three
authors,
and
indeed led
to
the
writing of
this
book.
Jim
Van Ness was our expert on eigenvalue
and
eigenvector computation. We used
the
program PALS
that
he
had
written
earlier
for
the
Bonneville Power Administration as
the
backbone code for
the
eigenvalue/eigenvector calculations.
Jim
was also responsible for
the
coding of
our
additions to
that
backbone
program
and
for
testing
our
equations on his computer to make sure we were getting
the
right
answers.
Baj
Agrawal
was
our
expert
on
many
topics,
but
particularly
the
specification of
data
for making SSR studies. His extensive experience in
performing system
tests
to determine these
data
provided us with valuable
insights. We hope
that
his
documentation of
this
information will be
helpful to
the
reader, especially those who have
the
responsibility of system
testing. Much of
this
information
has
never before appeared in a tutorial
book before,
and
is
taken
from fairly recent research documents.
Paul
Anderson provided
the
material
on modeling of
the
system,
its
transformation,
and
normalization. He worked on much of
the
descriptive
material for
the
book
and
served as a managing editor to see
that
it all came
together in the same language, if not in the same style.
It
was a good collaboration for
the
three
of us
and
we learned to appreciate
the
expertise of
our
colleagues as we worked together. We sincerely hope
that
this
comes
through
for
the
reader
and
that
the
book
might
be as
interesting for
the
engineer to
read
as it was for us to prepare.
The
authors
would like to
thank
several individuals who provided valuable
assistance in
the
preparation
and
checking of
the
manuscript. Most of
the
XII
figures were prepared on
the
computer by
Garrett
Rusch, a
student
at
the
University of California
at
San
Diego, whose skill in computer graphics
drafting is acknowledged. We are also indebted to Jai-Soo
Jang,
a graduate
student
at
Northwestern
University, who studied
the
entire
manuscript
and
found
many
typographical errors
that
we were glad to have corrected.
We also
thank
Mahmood Mirheydar for his work in
preparing
data
in a
convenient form for plotting. Finally, we extend a special
thanks
Dr.
Christopher Pottle of Cornell University, who helped us to
understand
the
proper methods for modeling
the
network for eigenvalue calculations
and
provided us with a computer program for this evaluation.
For those who might be interested in
the
details of producing a book of this
kind, a few facts concerning
its
production may be of interest. This book
was
written
entirely
on a Macintosh®l computer
using
the
program
Word® 4.0
2
.
All
the
line drawings were produced using MacDraw®
and
MacDraw®II3,
and
the
plots were produced using
the
Igor©4 program.
All equations were
written
using
the
program
Mathtype®5.
The pages
were printed using a Linotronic®6 300 printer,
at
a resolution of 1270 dots
per inch. The typeface is New Century Schoolbook,
and
was chosen for its
clarity
and
style,
and
because
it
lends
itself
well to
mathematical
expressions. The personal computer process
permitted
the
authors
to
deliver camera ready copy directly to IEEE. Since the text did not have to be
reset
by a professional typographer,
the
usual
process of page proofs and
galleys was
thereby
eliminated. This saved a
great
deal of time
and
prevented
the
introduction of errors in the retyping of
the
entire book and,
especially,
the
equations. This is
the
first book published by IEEE using this
process,
but
will surely not be
the
last.
P. M. Anderson
B. L. Agrawal
J. E. Van Ness
IMacintosh is a registered trademark of Apple Computer, Inc.
2Microsoft Word is a registered
trademark
of Microsoft.
3MacDraw and MacDraw II are registered trademarks of Claris Corporation.
4Igor is a registered
trademark
of WaveMetrics
5Mathtype is a registered trademark of Design Science, Inc.
6Linotronic is a registered
trademark
of Linotype AG.
xiii
SUBSYNCHRONOUS
RESONANCE
IN
POWER
SYSTEMS
INTRODUCTION
This book provides a tutorial description' of the mathematical models and
equation formulations
that
are
required for
the
study of a special class of
dynamic power
system
problems,
namely
subsynchronous
resonance
(SSR). Systems
that
experience SSR exhibit dynamic oscillations
at
frequencies below
the
normal system base frequency (60 Hz in North
America). These problems
are
of
great
interest
in utilities where
this
phenomenon is a problem,
and
the
computation of conditions
that
excite
these SSR oscillations are important to those who design and operate these
power systems.
This book presents
the
mathematical modeling of the power system, which
is explained in considerable detail. The
data
that
are required to support
the
mathematical
models
are
discussed, with special emphasis on field
testing to determine
the
needed data. However, the purpose of modeling is
to
support
mathematical
analysis of
the
power system. Here, we
are
interested in
the
oscillatory behavior of
the
system,
and
the
damping of
these
oscillations. A convenient method of analysis to determine
this
damping is to compute
the
eigenvalues of a
linear
model of
the
system.
Eigenvalues
that
have negative real
parts
are
damped,
but
those with
positive
real
parts
represent
resonant
conditions
that
can lead to
catastrophic
results.
Therefore,
the
computation of eigenvalues
and
eigenvectors for the study of SSR is an excellent method of providing crucial
information
about
the
nature
of
the
power system. The method for
computing
eigenvalues
and
eigenvectors
is
presented,
and
the
interpretation of the resulting information is described.
1.1
DEFINITION OF SSR
Subsynchronous resonance (SSR) is a dynamic phenomenon of
interest
in
power
systems
that
have
certain
special characteristics. The formal
definition of SSR is provided by the IEEE [1]:
Subsynchronous resonance is an electric power system condition
where
the
electric
network
exchanges
energy
with
a
turbine
generator
at
one or more of the
natural
frequencies of
the
combined
system below the synchronous frequency of the system.
The definition includes any system condition
that
provides the opportunity
for an exchange of energy
at
a given subsynchronous frequency. This
4
SUBSYNCHRONOUS RESONANCE IN POWER SYSTEMS
includes
what
might
be considered "natural" modes of oscillation
that
are
due to
the
inherent
system
characteristics, as well as "forced" modes of
oscillation
that
are
driven by a
particular
device or control system.
The
most
common
example
of
the
natural
mode of
sub
synchronous
oscillation is
due
to networks
that
include series capacitor compensated
transmission
lines. These lines,
with
their
series LC combinations, have
natural
frequencies to
that
are defined by
the
equation
n
(1.1)
where
ron
is
the
natural
frequency associated
with
a
particular
line L C
product,
roB
is
the
system base frequency,
and
XL
and
Xc
are
the
inductive
and
capacitive reactances, respectively. These frequencies
appear
to
the
generator
rotor
as
modulations
of
the
base
frequency,
giving
both
subsynchronous
and
supersynchronous
rotor
frequencies.
It
is
the
subsynchronous
frequency
that
may
interact
with
one of
the
natural
torsional modes of
the
turbine-generator
shaft,
thereby
setting
up
the
conditions for an exchange of energy
at
a subsynchronous frequency,
with
possible torsional fatigue damage to
the
turbine-generator shaft.
The torsional modes (frequencies) of
shaft
oscillation
are
usually known, or
may be obtained from
the
turbine-generator
manufacturer.
The network
frequencies
depend
on
many
factors,
such
as
the
amount
of
series
capacitance
in service
and
the
network
switching
arrangement
at
a
particular
time.
The
engineer
needs a
method
for
examining
a
large
number
of feasible operating conditions to determine
the
possibility of SSR
interactions. The eigenvalue program provides
this
tool. Moreover,
the
eigenvalue computation
permits
the
engineer to
track
the
locus of
system
eigenvalues as
parameters
such as
the
series capacitance
are
varied
to
represent
equipment
outages.
If
the
locus of a
particular
eigenvalue
approaches
or crosses
the
imaginary
axis,
then
a critical condition is
identified
that
will
require
the
application
of one or
more
SSR
countermeasures
[2].
1.2 POWER SYSTEM MODELING
This section
presents
an overview of power system modeling
and
defines
the
limits of modeling for
the
analysis of SSR. We
are
interested
here
in
modeling
the
power
system
for
the
study
of dynamic performance. This
means
that
the
system is described by a system of differential equations.
INTRODUCTION
5
Usually, these equations
are
nonlinear,
and
the
complete description of
the
power system
may
require a very large
number
of equations. For example,
consider
the
interconnected network of
the
western United States, from
the
Rockies to
the
Pacific,
and
the
associated
generating
sources
and
loads.
This network consists of over 3000 buses
and
about 400 generating stations,
and
service is provided to about 800 load points. Let us
assume
that
the
network
and
loads may be defined by algebraic models for
the
analytical
purpose
at
hand. Moreover, suppose
that
the
generating
stations
can be
modeled by a
set
of
about
20 first
order
differential equations. Such a
specification, which might be typical of a
transient
stability analysis, would
require 8000 differential equations
and
about 3500 algebraic equations. A
very large
number
of oscillatory modes will be
present
in
the
solution. This
makes
it
difficult to
understand
the
effects due to given causes because so
many detailed interactions
are
represented.
Power system models
are
often conveniently defined in
terms
of
the
major
subsystems
of
equipment
that
are
active in
determining
the
system
performance. Figure 1.1 shows a broad overview of
the
bulk power system,
including
the
network,
the
loads,
the
generation
sources,
the
system
control,
the
telecommunications,
and
the
interconnections
with
neighboring utilities. For SSR studies we
are
interested in
the
prime mover
(turbines)
and
generators
and
their
primary
controls,
the
speed governors
and
excitation systems. The network is very
important
and
is represented
in detail,
but
using
only algebraic
equations
and
ordinary
differential
equations (lumped
parameters)
rather
than
the
exact
partial
differential
equations. This is because we
are
interested
only in
the
low frequency
performance of
the
network, not in
traveling
waves. The loads may be
important,
but
are
usually
represented
as
constant
impedances in SSR
modeling. We
are
not
interested
in
the
energy sources, such as boilers or
nuclear
reactors,
nor
are
we concerned
about
the
system
control center,
which
deals
with
very low frequency
phenomena,
such
as daily load
tracking. These frequencies
are
too low for concern here.
Clearly,
the
transient
behavior of
the
system ranges from
the
dynamics of
lightning
surges
to
that
of
generation
dispatch
and
load following,
and
covers several decades of
the
frequency domain, as shown in Figure 1.2.
Note
that
SSR falls largely in
the
middle of
the
range depicted, with major
emphasis
in
the
subsynchronous
range.
Usually,
we
say
that
the
frequencies of oscillation
that
are
of
greatest
interest
are
those between
about
10
and
50 Hz. We
must
model frequencies outside of
this
narrow
band,
however, since
modulations
of
other
interactions
may
produce
frequencies in
the
band
of interest.
It
is noted, from Figure 1.2,
that
the.
6
SUBSYNCHRONOUS RESONANCE IN POWER SYSTEMS
Other
Systems
Tie Line
Power
Tie Line
Power
Schedule
System
Loads
System
Transmission
Network
System Control Center
Generated
Power
Other {
Generators
Voltage
Control
System
Frequency
Reference
Speed
Control
Desired
Generation
Control
Si als
Energy
Source
t
~
r
ntro
)
Energy
Source
Figure 1.1
Structure
of a Power System for Dynamic Analysis
basic range of frequencies of
interest
is not greatly different from
transient
stability. Hence,
many
of
the
models from
transient
stability
will be
appropriate to use.
In modeling
the
system for analysis, we find it useful to
break
the
entire
system up into physical subsystems, as in
Figure
1.3, which shows
the
major
subsystems
associated
with
a
single
generating
unit
and
its
interconnection
with
the
network
and
controls. In SSR analysis,
it
is
necessary
to model most,
but
not
all, of
these
subsystems,
and
it
is
necessary to model
at
least
a portion of
the
network. The
subset
of
the
system to be modeled for SSR is labeled in Figure 1.3, where
the
shaded
region is
the
subset
of
interest
in
many
studies.
Also,
it
is
usually
necessary to model several machines for SSR studies, in addition to
the
interface between each machine
and
the
network.
INTRODUCTION
.'r
r
"'::"
·:,.:;:-:'-Y:~
."
Lightning Overvoltages
Line Swi tchi ng Voltages
Subsynchro nous Resonan ce
Transient
& Line
ar
Stability
Long Term Dyn amics
Tie-Line Regula tion
I I
Daily Load Following
10-
7
10-
6
10-5 10-
4
10 ,3
10-2
.01 10
10
2
10
3
10
4
10
5
10
6
10
7
Time Scale, sec
t t
t
t t
l usec. 1 degree
at
60 Hz
1
cycle 1 sec.
1
minute
1 hour 1 day
Figure 1.2 Frequency Bands of Different Dynamic Phenomena
7
Figure 1.3 also shows a convenient definition of
the
inputs
and
outputs
defined for each subsystem model. The shaded
subset
defined in this figure
is somewhat arbitrary. Some studies may include models of exciters, speed
governors, high voltage direct
current
(HVDC) converter
terminals,
and
other
apparatus.
It
would seldom be necessary to model a boiler or nuclear
reactor for SSR studies. The
shaded
area
is
that
addressed in
this
book.
Extensions of
the
equations developed for subsystems shown in Figure 1.3
should be straightforward.
In modeling
the
dynamic system for analysis, one
must
first define
the
scope of
the
analysis
to be performed,
and
from
this
scope define
the
modeling
limitations
. No model is
adequate
for all possible types of
analysis.
Thus
, for SSR analytical modeling we define the following scope:
Scope
of
SSR Models The scope of SSR models to be derived in this
monograph is limited to the dynamic performance of
the
interactions
between
the
synchronous machine
and
the
electric network in
the
subsynchronous frequency range, generally between 0
and
50 Hz.
The subsystems defined for modeling
are
the
following:
8
SUBSYNCHRONOUSRESONANCE IN POWER SYSTEMS
Boiler-Turbine-G
ener
ator
Unit
Power V E it ti
S
s
~
XCI a IOn
ystem
S
t-oe;
- -
,
Stabilizer y
st
em
Desired Power
8
1-
1
t
t
•
·
•
·
t
I
·
·
t
t
t
,
t
·
: System
t Sta tus
,
Fir
st
Sta
ge ,
Pre s
sure
:
_______
_
___
_
______
___
_
__
_ _
~
-
.l
_
,
,
I
I
Turbin
e
Swin g
Equation
·- - -
~~
,
Gen
erator
ld lq
,
·
•
•
Pe
,
•
P
a ·
•
to
lJIf3
Boiler
Pr
es
sur
e
\
I I
I
·
•
•
I
,
I
Governo r I PGV :
& Control I
Valves St
eam'
Flow:
R
at
e •
-
-
-
I
,
,
I
I
I
I
I
I
• - - - -
~
-~
- - - - - - - - - - - - - - - - - - f , - - - - - - - - - - -
• E
FD
,
: Vd V
q
V t:
t d
-q:
Network
Tran sform I a •
Figure 1.3 Subsystems of Interest
at
a Generating Station
• Network transmission lines, including series capacitors.
• Network static
shunt
elements, consisting of R, L,
and
C
branches.
• Synchronous generators.
•
Turbine-generator
shafts
with
lumped
spring-mass
representation and with self and mutual damping.
•
Turbine
representation
in
various
turbine
cylinder
configurations.
INTRODUCTION 9
It
is also necessary to define
the
approximate model bandwidth considered
essential
for
accurate
simulated performance of
the
system
under
study.
For
the
purpose here, models will be derived
that
have a bandwidth of about
60Hz.
1.3 INTRODUCTION TO SSR
Subsynchronous resonance is a condition
that
can exist on a power system
wherein
the
network
has
natural
frequencies
that
fall below
the
nominal 60
hertz
of
the
network applied voltages.
Currents
flowing in
the
ac network
have
two components; one component
at
the
frequency of
the
driving
voltages (60 Hz)
and
another
sinusoidal component
at
a frequency
that
depends entirely on
the
elements of
the
network. We can write a general
expression for
the
current
in a simple series R-L-C network as
(1.2)
where all of
the
parameters
in
the
equation
are
functions of
the
network
elements except
lOt, which is
the
frequency of
the
driving voltages of
all
the
generators. Note
that
even
~
is a function of
the
network elements.
Currents
similar
to (1.2) flow in
the
stator
windings of
the
generator
and
are
reflected into
the
generator
rotor a physical process
that
is described
mathematically by
Park's
transformation. This transformation makes
the
60
hertz
component of
current
appear, as viewed from
the
rotor, as a de
current
in
the
steady
state,
but
the
currents
of frequency lO2
are
transformed
into
currents
of frequencies containing
the
sum
(lOl+lO2)
and
difference
(lOl-lO2)
of
the
two frequencies. The difference frequencies
are
called
subsynchronous
frequencies.
These
subsynchronous
currents
produce
shaft
torques on
the
turbine-generator rotor
that
cause
the
rotor to
oscillate
at
subsynchronous frequencies.
The
presence
of
subsynchronous
torques
on
the
rotor
causes
concern
because
the
turbine-generator
shaft
itself
has
natural
modes of oscillation
that
are
typical of
any
spring
mass
system.
It
happens
that
the
shaft
oscillatory modes
are
at
subsynchronous frequencies. Should
the
induced
subsynchronous torques coincide with one of
the
shaft
natural
modes of
oscillation,
the
shaft
will oscillate
at
this
natural
frequency, sometimes
with high amplitude. This is called subsynchronous resonance, which can
cause
shaft
fatigue
and
possible damage or failure.
10
SUBSYNCHRONOUS RESONANCE IN POWER SYSTEMS
1.3.1 Types
of
SSR Interactions
There are many ways in which
the
system and
the
generator may
interact
with
sub synchronous effects. A few of
these
interactions
are
basic in
concept and have been given special names. We mention three of these
that
are of particular interest:
Induction Generator Effect
Torsional Interaction Effect
Transient Torque Effect
Induction
Generator
Effect
Induction
generator
effect is caused by
self
excitation of
the
electrical
system. The resistance of
the
rotor to subsynchronous
current,
viewed
from
the
armature
terminals, is a negative resistance. The network also
presents a resistance to these same currents
that
is positive. However, if
the
negative resistance of
the
generator is
greater
in magnitude
than
the
positive resistance of
the
network
at
the system
natural
frequencies,
there
will be sustained subsynchronous currents. This is
the
condition known as
the
"induction generator effect."
Torsional
Interaction
Torsional interaction occurs when
the
induced sub synchronous torque in
the
generator is close to one of
the
torsional
natural
modes of
the
turbine-
generator shaft. When this happens, generator rotor oscillations will build
up
and
this
motion will induce
armature
voltage components
at
both
sub
synchronous
and
supersynchronous
frequencies. Moreover,
the
induced subsynchronous frequency voltage is
phased
to
sustain
the
subsynchronous torque.
If
this
torque equals or exceeds
the
inherent
mechanical damping of
the
rotating system,
the
system will become self-
excited. This phenomenon is called "torsional interaction."
Transient
Torques
Transient torques are those
that
result from system disturbances. System
disturbances cause sudden changes in
the
network, resulting in sudden
changes in currents
that
will tend to oscillate
at
the
natural
frequencies of
the
network. In a transmission system without series capacitors,
these
transients
are
always de
transients,
which decay to zero with a time
constant
that
depends on
the
ratio
of inductance to resistance.
For
networks
that
contain series capacitors,
the
transient
currents will be of a
form similar to equation
(1.2),
and
will contain one or more oscillatory
frequencies
that
depend on
the
network
capacitance as well as
the
inductance
and
resistance. In a simple radial
R-L-C
system,
there
will be
only one such
natural
frequency, which is exactly the situation described in
INTRODUCTION
11
(1.2),
but
in a
network
with
many
series capacitors
there
will be
many
such
subsynchronous
frequencies.
If
any
of
these
sub
synchronous
network
frequencies coincide
with
one of
the
natural
modes of a
turbine-generator
shaft,
there
can
be
peak
torques
that
are
quite
large since
these
torques
are
directly proportional to
the
magnitude
of
the
oscillating
current.
Currents
due to
short
circuits, therefore, can produce very large
shaft
torques
both
when
the
fault
is applied
and
also
when
it
is cleared. In a
real
power
system
there
may
be
many
different subsynchronous frequencies involved
and
the
analysis is
quite
complex.
Of
the
three
different types of interactions described above,
the
first two
may
be considered as small
disturbance
conditions,
at
least
initially. The
third
type is definitely
not
a small
disturbance
and
nonlinearities
of
the
system
also
enter
into
the
analysis.
From
the
viewpoint of
system
analysis, it is
important
to note
that
the
induction
generator
and
torsional
interaction
effects
may
be
analyzed
using
linear
models,
suggesting
that
eigenvalue
analysis is
appropriate
for
the
study
of
these
problems.
1.3.2 Analytical Tools
There
are
several analytical tools
that
have
evolved for
the
study
of SSR.
The most common of
these
tools will be described briefly.
Frequency
Scanning
Frequency
scanning
is a
technique
that
has
been
widely
used
in
North
America
for
at
least
a
preliminary
analysis
of
SSR
problems,
and
is
particularly
effective in
the
study
of
induction
generator
effects.
The
frequency
scan
technique'
computes
the
equivalent
resistance
and
inductance,
seen
looking into
the
network
from a
point
behind
the
stator
winding of a
particular
generator, as a function of frequency. Should
there
be a frequency
at
which
the
inductance is zero
and
the
resistance negative,
self
sustaining
oscillations
at
that
frequency would be expected
due
to
induction
generator
effect.
The
frequency
scan
method
also provides
information
regarding
possible
problems
with
torsional
interaction
and
transient
torques.
Torsional
interaction or
transient
torque problems
might
be expected to occur
if
there
is a network series resonance or a reactance
minimum
that
is very close to
one of
the
shaft
torsional frequencies.
Figure
1.4 shows
the
plot of a typical
result
from a frequency
scan
of a
network
[3].
The
scan covers
the
frequency
range
from 20 to 50
hertz
and
shows
separate
plots for
the
resistance
and
reactance
as a function of
12
400
,
350
c
Q)
300
u
I
Q)
0
250
c
Q)
200
u
c
150
(\l
,
Ul
100
"iii
Q)
0::
ill
0
2J
SUBSYNCHRONOUS RESONANCE IN POWER SYSTEMS
250
200
"'"
ro
150
~
, "
1
00
~
::l
, "
50
ro
::l
0
'0
ro
-s
- 5 0
, "
ro
::l
- 1
00
Frequency in Hz
Figure 1.4 Plot from
the
Frequency Scan of a Network [3]
frequency. The frequency
scan
shown in
the
figure was computed for a
generator
connected to a network
with
series compensated
transmission
lines and represents
the
impedance seen looking into
that
network from
the
generator.
The
computation indicates
that
there
may
be a problem with
torsional
interactions
at
the
first
torsional mode, which occurs for
this
generator
at
about 44 Hz. At
this
frequency,
the
reactance of
the
network
goes to zero,
indicating
a possible problem. Since
the
frequency
scan
results
change with different
system
conditions
and
with
the
number
of
generators
on line,
many
conditions need to be
tested.
The
potential
problem noted in
the
figure was confirmed by
other
tests
and
remedial
countermeasures were prescribed to alleviate
the
problem [3].
Frequency scanning is limited to
the
impedances seen
at
a
particular
point
in
the
network,
usually
behind
the
stator
windings of a
generator.
The
process
must
be repeated for different system (switching) conditions
at
the
terminals
of each
generator
of interest.
Eigenvalue
Analysis
Eigenvalue analysis provides additional information
regarding
the
system
performance. This type of analysis is performed with
the
network
and
the
generators
modeled in one
linear
system
of differential equations. The
results
give both
the
frequencies of oscillation as well as
the
damping
of
each frequency.
Eigenvalues
are
defined in
terms
of
the
system
linear
equations,
that
are
written in
the
following
standard
form.
INTRODUCTION 13
Table 1.1
Computed Eigenvalues for
the
First
Benchmark Model
Eigenvalue Real
Part,
Imaginary
Part,
Imaginary
Part,
Number
s -1
rad/s
Hz
1,2 +0.07854636
±127.15560200 ±20.2374426
3,4
+0.07818368
±OO.70883066
±15.86915327
5,6 +0.04089805 ±160.38986053 ±25.52683912
7,8 +0.00232994 ±202.86306822
±32.28666008
9,10 -0.00000048
±298.17672924
±47.45630037
11
-0.77576318
12
-0.94796049
13,14
-1.21804111
±10.59514740 ±96.61615878
15,16 -5.54108044
±136.97740321
±21.80063081
17,18 -6.80964255
±616.53245850
±98.12275595
19
-25.41118956
a)
-41.29551248
x=Ax+Bu
(1.3)
Then
the
eigenvalues
are
defined as
the
solutions to
the
matrix
equation
det[AU - A] =0
where
the
parameters
A
are
called
the
eigenvalues.
(1.4)
An example of eigenvalue
analysis
is
presented
using
the
data
from
the
First
Benchmark
Model, a one
machine
system
used
for SSR
program
testing
[4]. The
results
of
the
eigenvalue calculation is shown in Table 1.1.
Note
that
this
small system is of
20th
order
and
there
are
10 eigenvalues in
the
range
of 15.87 to 47.46 Hz, which is
the
range
where
torsional
interaction usually occur. Moreover, eight of
the
eigenvalues have positive
real
parts,
indicating an absence of damping in these modes of response.
Eigenvalue analysis is
attractive
since it provides
the
frequencies
and
the
damping
at
each frequency for
the
entire
system in a single calculation.
14
SUBSYNCHRONOUS RESONANCE IN POWER SYSTEMS
EMTP Analysis
The
ElectroMagnetic
Transients
Program
(EMTP) is a
program
for
numerical
integration
of
the
system
differential
equations.
Unlike
a
transient
stability
program, which usually models only positive sequence
quantities
representing
a perfectly balanced system, EMTP is a full three-
phase
model of
the
system
with
much
more
detailed
models of
transmission
lines, cables, machines,
and
special devices such as series
capacitors
with
complex bypass switching
arrangements.
Moreover,
the
EMTP
permits
nonlinear
modeling of complex system components.
It
is,
therefore, well suited for analyzing
the
transient
torque SSR problems.
The full scope of modeling
and
simulation of systems using EMTP is beyond
the
scope of
this
book. However, to
illustrate
the
type of results
that
can be
obtained
using
this
method, we
present
one
brief
example.
Figure
1.5
shows
the
torque
at
one turbine
shaft
section for two different levels of series
transmission compensation, a small level of compensation for Case A
and
a larger level for Case B [5]. The disturbance is a three phase fault
at
time t
=0
that
persists for 0.06 seconds.
It
is
apparent
that
the
Case B, the higher
level of series compensation,
results
is considerably torque amplification.
This type of information would not be available from a frequency scan or
from eigenvalue computation, although those methods would indicate
the
existence of a
resonant
condition
at
the
indicated frequency of oscillation.
EMTP adds
important
data
on
the
magnitude of
the
oscillations as well as
their
damping.
Summary
Three
prominent
methods of SSR
analysis
have been briefly described.
Frequency
scanning
provides information
regarding
the
impedance seen,
as a function of frequency, looking into
the
network from
the
stator
of a
generator.
The
method is
fast
and
easy
to use. Eigenvalue
analysis
provides a closed form
solution
of
the
entire
network
including
the
machines. This gives all of
the
frequencies of oscillation as well as
the
damping of each frequency. The method requires more modeling
and
data
than
frequency scanning
and
requires
greater
computer resources for
the
computation. EMTP requires still
greater
modeling effort
and
computer
resources,
but
allows
the
full nonlinear modeling of
the
system machines
and
other
devices, such as capacitor bypass schemes.
In
the
balance of
this
book, we concentrate only on
the
eigenvalue method of
SSR analysis. Most of
the
book is devoted to
the
mathematical modeling
and
the
determination
of accurate model
parameters
for eigenvalue analysis.
First,
however, we discuss briefly
the
types of models
used
for
the
SSR