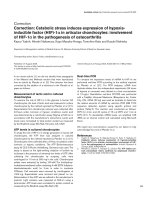
Báo cáo y học: " Correction: Multiclass classification of microarray data with repeated measurements: application to cancer" docx
Bạn đang xem bản rút gọn của tài liệu. Xem và tải ngay bản đầy đủ của tài liệu tại đây (75.26 KB, 4 trang )
Genome Biology 2005, 6:405
Correction
Correction: Multiclass classification of microarray data with
repeated measurements: application to cancer
Ka Yee Yeung and Roger E. Bumgarner
Address: Department of Microbiology, Box 358070, University of Washington, Seattle, WA 98195, USA.
Correspondence: Ka Yee Yeung. Email:
Published: 3 January 2006
Genome Biology 2005, 6:405 (doi:10.1186/gb-2005-6-13-405)
The electronic version of this article is the complete one and can be
found online at />© 2005 BioMed Central Ltd
After the publication of this work [1], we discovered program-
ming errors in our software implementation of the proposed
error-weighted, uncorrelated shrunken centroid (EWUSC)
algorithm and the uncorrelated shrunken centroid (USC)
algorithm. We have corrected these errors, and the updated
results are summarized in the revised Table 6.
On the NCI 60 data, both Figure 1 in [1] and the revised
Figure 1 showed that USC generally produces higher predic-
tion accuracy than the ‘shrunken centroid’ algorithm (SC)
[2] using the same number of relevant genes. Using the
revised software implementation, USC requires fewer (2,116
instead of 2,315 as reported in [1]) genes to achieve 72%
accuracy. The number of genes required by SC to achieve the
same prediction accuracy remains the same (3,998).
Figure 2 shows the results of applying EWUSC to the train-
ing set, four-fold cross-validation data, and test set of the
multiple tumor data over a range of shrinkage thresholds (⌬)
and correlation thresholds (
0
). The revised Figure 2 shows
the same general trend as Figure 2 in [1]: the percentage of
errors is reduced when
0
< 1 over most values of ⌬ on the
training set, cross-validation data and test set; Figure 2d
shows that the number of relevant genes is drastically
reduced when genes with correlation threshold above 0.9 are
removed. The values of the optimal shrinkage thresholds (⌬)
determined from the cross-validation results have changed
using the revised implementation. Specifically, the optimal
shrinkage threshold values (⌬) for both EWUSC and USC are
reduced to 4.8 and 4 respectively (see revised Table 6). The
numbers of relevant genes selected by EWUSC and USC are
reduced and the resulting prediction accuracy for both USC
and SC are also reduced in the revised results. In the case of
using the global optimal parameters when ⌬ = 0, the
EWUSC in the revised implementation selected slightly
fewer genes (1,622 instead of 1,626) at the expense of slightly
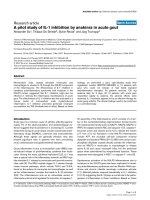
lower prediction accuracy (74% instead of 78%). Figure 4
compares the prediction accuracy on the test set of the mul-
tiple tumor data using the EWUSC and USC algorithms at
the estimated optimal correlation threshold (
0
= 0.8), the
SC algorithm and the Support Vector Machine (SVM). The
general observations previously reported in [1] still hold with
the revised Figure 4. First, USC produces higher prediction
accuracy than SC using the same number of relevant genes.
Second, EWUSC generally produces higher prediction accu-
racy than USC using the same number of relevant genes. In
fact, the performance of EWUSC is stronger than previously
reported in [1] when the number of genes is small.
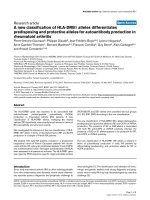
Figure 5 shows the comparison of prediction accuracy of
EWUSC, USC, and SC on the breast cancer data. With the
Figure 1
A corrected figure showing the comparison of prediction accuracy of USC
and SC on the NCI 60 data. The percentage of prediction accuracy is
plotted against the number of relevant genes using the USC algorithm at
0
= 0.6 and the SC algorithm (USC at
0
= 1.0). The horizontal axis is shown
on a log scale. Because no independent test set is available for this data, we
randomly divided the samples in each class into roughly three parts multiple
times, such that a third of the samples are reserved as a test set. Thus the
training set consists of 43 samples and the test set of 18 samples. The graph
represents typical results over these multiple random runs.
0
10
20
30
40
50
60
70
80
1 10 100 1,000 10,000
Number of genes (log scale)
USC
SC
Prediction accuracy (%)
comment
reviews
reports
deposited research
interactions
information
refereed research
revised implementation, the optimal correlation threshold
(
0
) is changed from 0.7 in [1] to 0.6 (see revised Table 6).
The observation reported in [1] that EWUSC produces
higher prediction accuracy on the test set than USC and SC
when the number of relevant genes is small still holds. The
numbers of relevant genes selected by USC and SC are sig-
nificantly larger with the revised implementation (see
revised Table 6).
The major conclusions and observations in the original man-
uscript [1] remain valid with the revised implementation.
Our EWUSC and USC algorithms represent improvements
over the SC algorithm. In general, fewer genes are required
to produce comparable prediction accuracy. On the multiple
tumor data, our EWUSC and USC algorithms produce higher
prediction accuracy using fewer relevant genes compared to
published results. The revised software implementation is
available on our web site [3]. Note: the revised version (1.0)
of the software was placed on the web site on May 9, 2005.
References
1. Yeung KY, Bumgarner RE: Multiclass classification of microar-
ray data with repeated measurements: application to
cancer. Genome Biol 2003, 4:R83.
2. Tibshirani R, Hastie T, Narasimhan B, Chu G: Diagnosis of multi-
ple cancer types by shrunken centroids of gene expression.
Proc Natl Acad Sci USA 2002, 99:6567-6572.
3. Supplementary Web Site: Multiclass classification of
microarray data with repeated measurements: application
to cancer. [ />shrunken_centroid]
4. Dudoit S, Fridlyand J, Speed TP: Comparison of discrimination
methods for the classification of tumors using gene expres-
sion data. J Am Stat Assoc 2002, 97:77-87.
5. Ramaswamy S, Tamayo P, Rifkin R, Mukherjee S, Yeang CH, Angelo
M, Ladd C, Reich M, Latulippe E, Mesirov JP, et al.: Multiclass
cancer diagnosis using tumor gene expression signatures.
Proc Natl Acad Sci USA 2001, 98:15149-15154.
6. van ‘t Veer LJ, Dai H, van de Vijver MJ, He YD, Hart AA, Mao M,
Peterse HL, van der Kooy K, Marton MJ, Witteveen AT, et al.: Gene
expression profiling predicts clinical outcome of breast
cancer. Nature 2002, 415:530-536.
405.2 Genome Biology 2005, Volume 6, Issue 13, Article 405 Yeung and Bumgarner />Genome Biology 2005, 6:405
Table 6
Summary of prediction accuracy results
Data Parameters EWUSC USC SC Published results
NCI 60 data
*
0
NA 0.6 1.0 NA
⌬ NA 0.6 0.9 NA
# relevant genes NA 2,116 (2315) 3,998 200
Prediction accuracy NA 72% 72% ~ 40-60% [4]
Multiple tumor data (estimated
0
0.8 0.8 1.0 NA
optimal parameters)
†
⌬ 4.8 (5.6) 4 (5.6) 8.8 NA
# relevant genes 241 (680) 356 (735) 3902 All genes
Prediction accuracy 93% 82% (85%) 63% (78%) 78% [5]
Multiple tumor data (global
0
0.9 0.9 1.0 NA
optimal parameters)
‡
⌬ 0 0 0.4 NA
# relevant genes 1,622 (1626) 1634 7129 All genes
Prediction accuracy 74%
(78%) 74% 59% (74%) 78% [5]
Breast cancer data
0
0.6 (0.7) 0.6 1.0 NA
⌬ 0.80 0.55 (1.15) 0.5 (1.1) NA
# relevant genes 189 (271) 1,114
(82) 3,193 (187) 70
Prediction accuracy 84% (89%) 84% (79%) 84% 89% [6]
Results different from those previously reported are highlighted in bold. Previous results are in brackets. Results improved over previously reported
are highlighted in italic, while results worse than previously reported are underlined. The optimal parameters (
0
and ⌬), number of relevant genes
chosen, and prediction accuracy for the NCI 60 data, multiple tumor data and breast cancer data are summarized here. Both EWUSC (error-weighted,
uncorrelated shrunken centroid) and USC (uncorrelated shrunken centroid) were motivated by SC (shrunken centroid) [2]. Both EWUSC and USC
take advantage of interdependence between genes by removing highly correlated relevant genes. EWUSC makes use of error estimates or variability
over repeated measurements. SC [2] is equivalent to USC at
0
= 1. The optimal parameters (⌬,
0
) for EWUSC are estimated from the cross-
validation results of EWUSC, while the optimal parameters (⌬,
0
) for USC are independently estimated from the cross-validation results of USC.
*Since no repeated measurements or error estimates are available, EWUSC is not applicable to the NCI 60 data. In addition, there is no separate test
set available for the NCI 60 data, typical results of random partitions of the original 61 samples into training and test sets are shown.
†
The prediction
accuracy and number of relevant genes are produced using optimal parameters (⌬,
0
) estimated by visual observation of ‘bends’ in the random cross-
validation curves.
‡
The prediction accuracy and number of relevant genes are produced using global optimal parameters, that is (⌬,
0
) that produces
the minimum average numbers of cross-validation errors over all ⌬ and all
0
.
(Continues on the next page)
Genome Biology 2005, Volume 6, Issue 13, Article 405 Yeung and Bumgarner 405.3
Genome Biology 2005, 6:405
Figure 2
A corrected figure showing the prediction accuracy on the multiple tumor data using the EWUSC algorithm over the range of ⌬ from 0 to 20. The
percentage of classification errors is plotted against ⌬ on (a) the full training set (96 samples) and (c) the test set (27 samples). In (b) the average
percentage of errors is plotted against ⌬ on the cross-validation data over five random runs of fourfold cross-validation. In (d), the number of relevant
genes is plotted against ⌬. Different colors are used to specify different correlation thresholds (
0
= 0.6, 0.7, 0.8, 0.9 or 1). Optimal parameters are
inferred from the cross-validation data in (b).
0 2 4 6 8 10 12 14 16 18 20
0
20
40
60
80
Classification error (%)
Training data
0 2 4 6 8 10 12 14 16 18 20
0
50
100
Average classification
error (%)
Random crossvalidation data
0 2 4 6 8 10 12 14 16 18 20
0
50
100
Classification error (%)
Test data
0 2 4 6 8 10 12 14 16 18 20
0
5,000
10,000
D
Number of genes
Number of genes
ρ
0
= 1
ρ
0
= 0.9
ρ
0
= 0.8
ρ
0
= 0.7
ρ
0
= 0.6
(d)
(c)
(b)
(a)
comment
reviews
reports
deposited research
interactions
information
refereed research
(Continues on the next page)
405.4 Genome Biology 2005, Volume 6, Issue 13, Article 405 Yeung and Bumgarner />Genome Biology 2005, 6:405
Figure 5
A corrected figure showing the comparison of prediction accuracy of
EWUSC, USC and SC on the breast cancer data. The percentage of
prediction accuracy is plotted against the number of relevant genes using
the EWUSC algorithm at
0
= 0.6, the USC algorithm at
0
= 0.6 and the
SC algorithm (USC at
0
= 1.0). Note that the horizontal axis is shown on
a log scale.
10
1
10
2
10
3
10
4
50
55
60
65
70
75
80
85
90
Total number of genes (log scale)
Prediction accuracy (%)
Test data
EWUSC (ρ
0
= 0.6)
USC (ρ
0
= 0.6)
shrunken centroid
Figure 4
A corrected figure showing the comparison of prediction accuracy of
EWUSC (
0
= 0.8), USC (
0
= 0.8), SVM and SC algorithms on the
multiple tumor data. The horizontal axis shows the total number of
distinct genes selected over all binary SVM classifiers on a log scale. Some
results are not available on the full range of the total number of genes.
For example, the maximum numbers of selected genes for EWUSC and
USC are roughly 1,000. The reported prediction accuracy is 78% [5] using
all 16,000 available genes on the full data. The EWUSC algorithm achieves
85% prediction accuracy with only 77 genes. With 241 genes, EWUSC
produces 93% prediction accuracy.
10
20
30
40
50
60
70
80
90
100
10 100 1,000 10,000
Total number of genes (log scale)
SVM
EWUSC
USC
SC
Prediction accuracy (%)