Báo cáo y học: "The undertranslated transcriptome reveals widespread translational silencing by alternative 5'''' transcript leaders" doc
Bạn đang xem bản rút gọn của tài liệu. Xem và tải ngay bản đầy đủ của tài liệu tại đây (8.59 MB, 15 trang )
Genome Biology 2005, 6:R111
comment reviews reports deposited research refereed research interactions information
Open Access
2005Lawet al.Volume 6, Issue 13, Article R111
Research
The undertranslated transcriptome reveals widespread
translational silencing by alternative 5' transcript leaders
G Lynn Law
¤
, Kellie S Bickel
¤
, Vivian L MacKay
¤
and David R Morris
Address: Department of Biochemistry, University of Washington, Seattle, WA 98195, USA.
¤ These authors contributed equally to this work.
Correspondence: David R Morris. Email:
© 2005 Law et al.; licensee BioMed Central Ltd.
This is an open access article distributed under the terms of the Creative Commons Attribution License ( which
permits unrestricted use, distribution, and reproduction in any medium, provided the original work is properly cited.
Translational silencing by alternative 5’ transcript leaders<p>Eight per cent of yeast transcripts, mostly involved in responses to stress or external stimuli, were found to be under-loaded with ribos-omes, and most of them exhibited structural changes in their 5’ transcript leaders in response to the environmental signal.</p>
Abstract
Background: Translational efficiencies in Saccharomyces cerevisiae vary from transcript to
transcript by approximately two orders of magnitude. Many of the poorly translated transcripts
were found to respond to the appropriate external stimulus by recruiting ribosomes.
Unexpectedly, a high frequency of these transcripts showed the appearance of altered 5' leaders
that coincide with increased ribosome loading.
Results: Of the detectable transcripts in S. cerevisiae, 8% were found to be underloaded with
ribosomes. Gene ontology categories of responses to stress or external stimuli were
overrepresented in this population of transcripts. Seventeen poorly loaded transcripts involved in
responses to pheromone, nitrogen starvation, and osmotic stress were selected for detailed study
and were found to respond to the appropriate environmental signal with increased ribosome
loading. Twelve of these regulated transcripts exhibited structural changes in their 5' transcript
leaders in response to the environmental signal. In many of these the coding region remained intact,
whereas regulated shortening of the 5' end truncated the open reading frame in others. Colinearity
between the gene and transcript sequences eliminated regulated splicing as a mechanism for these
alterations in structure.
Conclusion: Frequent occurrence of coordinated changes in transcript structure and translation
efficiency, in at least three different gene regulatory networks, suggests a widespread phenomenon.
It is likely that many of these altered 5' leaders arose from changes in promoter usage. We
speculate that production of translationally silenced transcripts may be one mechanism for allowing
low-level transcription activity necessary for maintaining an open chromatin structure while not
allowing inappropriate protein production.
Background
Across a cellular transcriptome the loading of ribosomes onto
individual mRNA species varies broadly [1-3], consistent with
each transcript having a uniquely defined efficiency of trans-
lation. Translational efficiencies across the transcriptome of
Saccharomyces cerevisiae have been estimated to vary from
Published: 3 January 2006
Genome Biology 2005, 6:R111 (doi:10.1186/gb-2005-6-13-r111)
Received: 2 September 2005
Revised: 17 October 2005
Accepted: 21 November 2005
The electronic version of this article is the complete one and can be
found online at />R111.2 Genome Biology 2005, Volume 6, Issue 13, Article R111 Law et al. />Genome Biology 2005, 6:R111
transcript to transcript by approximately two orders of mag-
nitude (as reported by MacKay and coworkers [3] and
herein). Many factors contribute to transcript-specific trans-
lation efficiencies, including those intrinsic and extrinsic to
mRNA structure [4]. Extrinsic factors include regulation of
the activities of translation initiation factors through phos-
phorylation [5,6] and regulation of the binding of transacting
molecules [7-9]. Factors intrinsic to the specific mRNA
include features of the 5' untranslated region (UTR) that
inhibit ribosome scanning such as secondary structure [10]
and upstream open reading frames (ORFs) [11]. In addition,
altered translational efficiency can arise from regulated
changes in mRNA structure, such as modifications in tran-
script structures occurring through alternative use of promot-
ers and splice sites within the nucleus [12], as well as RNA
splicing and polyadenylation mechanisms occurring in the
cytosol [13,14]. The relative importance of these various reg-
ulatory mechanisms differs widely from transcript to tran-
script in a given cell or tissue.
In the present study, we identified a set of under-translated
transcripts of S. cerevisiae. Within this group of transcripts,
we found over-representation of the Gene Ontology (GO) cat-
egories related to environmental responses of the organism,
suggesting that mRNA translatability may be controlled in
response to exogenous stresses. Transcripts from three of
these GO categories, namely responses to pheromone, nitro-
gen starvation, and osmotic stress, were selected to test this
hypothesis. Many of the under-translated transcripts selected
were found to respond to the appropriate environmental sig-
nal with a change in ribosome loading. Remarkably, we found
that a majority of these alterations in translation are accom-
panied by a change in the 5' UTR of the transcript. These find-
ings suggest that changes in translational efficiency as a
consequence of altered transcript structure are much more
common than was previously suspected. Furthermore, those
alterations that arise from changes in promoter usage have
implications with regard to the fate of intergenic transcripts
involved in regulation of gene expression.
Results
The under-translated transcriptome
Sucrose-gradient centrifugation, coupled with genome-wide
transcript measurements, has enabled genome-level analysis
of ribosome loading on individual transcript species [1,3].
Measurements of the fraction of a given transcript associated
with polyribosomes, together with the average spacing of
ribosomes along the mRNA, allows estimation of the effi-
ciency of translation and hence the rate of synthesis of the
encoded protein [3]. Translational efficiencies calculated
across the transcriptome of growing yeast are presented in
Figure 1a. The diversity of association of individual tran-
scripts with the translational apparatus is apparent from
these values for translational efficiencies. These quantities
vary by more than two orders of magnitude, illustrating dra-
matically the unique translational properties of each individ-
ual transcript species.
For the purposes of subsequent analysis, those transcripts
with translation efficiencies below 0.25 of the mean were
arbitrarily defined as under-translated. By this definition, of
the 3,916 transcripts for which reliable polysome profiles
could be modeled, fewer than 10% (298 transcripts) were
found to be under-translated [3]. Two experimentally acces-
sible characteristics combine to achieve inefficient transla-
tion of these transcripts: the fraction of a transcript in the act
of being translated (for example, associated with ribosomes)
and the average spacing of ribosomes along a translating
mRNA. Across the entire transcriptome, the average fraction
of transcripts associated with ribosomes is 0.82 and the aver-
age ribosome density is 4.4 ribosomes per 1,000 nucleotides.
For most members of the under-translated transcriptome,
both parameters lie below these population means (Figure 1b,
filled symbols). At the extremes of the distribution, a few of
the under-translated transcripts are more than 90% associ-
ated with ribosomes but sparsely loaded. Likewise, a few oth-
ers possess ribosome densities that are average or above, but
with less than 20% of the transcripts actually present in
polysomes.
In the under-translated transcriptome, 213 of the 298 tran-
scripts are the products of named genes. The biologic proc-
esses associated with this poorly translated group are
explored in Figure 1c. Because the analysis was restricted to
just the subset of named genes, the category 'process
unknown' represents only 3.5% of this selected group of tran-
scripts, in contrast to 13.9% in the complete dataset. The GO
categories significantly (P < 0.01) over-represented or under-
represented in the under-translated transcriptome are specif-
ically broken down in the figure, whereas all others are com-
bined in the 'other' category. The processes of protein
synthesis, ribosome biogenesis, and RNA metabolism are
under-represented in the under-translated transcriptome,
which was expected because the transcripts analyzed were
derived from steady-state growing cells, where protein syn-
thesis is vigorous. In contrast, responses to environmental
changes such as 'response to stress', 'cell cycle', 'signal trans-
duction', and 'sporulation, meiosis and pseudohyphal growth'
were significantly over-represented in the population of
under-translated transcripts. Individual representatives from
these environmental response categories were selected from
the under-translated population, and their responses to
external stimuli were evaluated.
Translational responses of the transcriptome to
mating pheromone
Previously, in a genome-level analysis of the response of yeast
to α-factor, we found 163 transcripts that increased in ribos-
ome loading and 36 that decreased [3]. From this previous
study, we selected eight regulated transcripts for detailed
examination, along with three control genes, which increase
Genome Biology 2005, Volume 6, Issue 13, Article R111 Law et al. R111.3
comment reviews reports refereed researchdeposited research interactions information
Genome Biology 2005, 6:R111
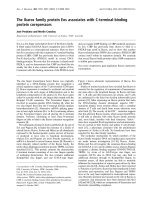
The under-translated transcripts of Saccharomyces cerevisiae Figure 1
The under-translated transcripts of Saccharomyces cerevisiae. (a) Translational efficiency across the transcriptome. Translation state array data from
exponentially growing yeast were used for 3916 transcripts with open reading frames (ORFs) longer than 400 nucleotides and whose distributions after
sucrose gradient centrifugation could be modeled reliably [3]. To calculate translational efficiency, the fraction of each transcript in polysomes was
multiplied by the mean ribosome density, expressed as ribosomes per 1,000 nucleotides of ORF, and these values were normalized to a mean of 1.0.
Translational efficiencies are plotted on a logarithmic scale versus relative transcript level obtained from the array analysis [3]. (b) Ribosome loading on
the transcriptome of steady-state growing yeast. Ribosome density (ribosomes per 1,000 nucleotides) is plotted against the fraction of each transcript in
polysomes. The data are those used to calculate the translational efficiencies in (a). The under-translated transcripts (<0.25 of the mean translation
efficiency) are represented by the filled symbols and the remaining transcripts by the open symbols. (c) Gene ontology (GO) analysis of the under-
translated transcriptome. The frequency of biologic process catagories appearing in the indicated populations was analyzed, as described in the text, using
the GO tools associated with the Saccharomyces Genome Database [66].
R111.4 Genome Biology 2005, Volume 6, Issue 13, Article R111 Law et al. />Genome Biology 2005, 6:R111
in transcript level in response to pheromone but maintain
constant ribosome loading (Table 1). SAG1 encodes a surface
protein that is important for cell-cell interaction during mat-
ing [15,16] and, in growing cells, a large fraction of the popu-
lation of SAG1 transcripts is poorly loaded with ribosomes, as
assessed by sucrose gradient centrifugation (Figure 2a). After
pheromone treatment, ribosome loading on this mRNA was
enhanced, coincident with the appearance of a new, short
form of the SAG1 transcript in Northern blots, which was
undetectable before treatment and is strongly localized in
polysomes (Figure 2b, lane 4). This efficient loading of the
short transcript with ribosomes was in clear contrast to the
long form, which is found to sediment primarily with mRNP
particles and monosomes in the presence or absence of phe-
romone (Figure 2b, lanes 1 and 3). The poor loading of the
long transcript was confirmed by real-time polymerase chain
reaction (QPCR) using primers specific for this form (data not
shown). The short, well translated SAG1 mRNA reached a
maximum level double that of the long transcript at 20-30
min after exposure to α-factor (Figure 2c).
RNase protection assays (Figure 2d) revealed that the long
SAG1 transcript has a 5' end greater than 484 nucleotides
upstream of the ORF. The short form exhibits a ladder of pro-
tected fragments (Figure 2d), probably resulting from either
multiple, closely placed transcriptional starts or breathing of
the RNA double helix during the assay. The size of the pre-
dominant short species is consistent with the 5' end being
located at approximately -40 nucleotides relative to the start
of the ORF. Results of 5' rapid amplification of cDNA ends
(RACE; Table 1), performed on total RNA from either grow-
ing cells or cells treated with α-factor for 30 minutes, revealed
major 5' termini at positions -826 and -38. Therefore, RNase
protection and 5' RACE are consistent with both transcripts
containing the initiation codon for the known form of Sag1
protein. The size of the short transcript is consistent with the
presence of a pheromone-response element [17] and a TATA
box [16] in this region of the genome.
Exploring further the apparent difference in translational
efficiency between the two SAG1 transcripts, His3p tagged
with the HA epitope was used as a reporter [3] in constructs
containing either the 826-nucleotide or 38-nucleotide 5'
leader of SAG1 under the control of a heterologous constitu-
tive promoter. Western blot analysis revealed much higher
levels of protein produced from the construct with the short 5'
leader (Figure 2e; compare lanes 1 and 3). Because the same
protein was produced from both transcripts, the difference in
level must have resulted from altered rates of synthesis rather
than differences in protein stability. Transcript levels were
determined using QPCR (data not shown) and the calculated
translation efficiency (protein/mRNA) of the transcript with
the short SAG1 leader was found to be 4.9 times that of the
long SAG1 construct, which is consistent with the qualitative
assessment of ribosome loading by sucrose gradient centrifu-
gation (Figure 2a, and Table 1). Thus, production of a new
transcript with elevated translational efficiency amplifies the
protein response resulting from transcriptional induction of
the SAG1 gene (Figure 2c).
The HO gene encodes an endonuclease that mediates switch-
ing of mating type in S. cerevisiae [18-20]. As previously
shown [21], the level of the cell-cycle regulated HO transcript
precipitously decreased after exposure to mating pheromone;
under the experimental conditions employed here, the tran-
script reached its nadir by about 20 minutes after initial expo-
sure (Figure 3a). Northern blots revealed the expected 2-
Table 1
Influence of pheromone treatment, nitrogen starvation and
osmotic stress on 5' leader structure and ribosome loading
5' termini
Gene Steady state Treated Loading ratio
Pheromone response
CRH1 -80 +2,+54 0.6
HO -39 approx. -2,000 0.3
KAR5 +115,+166 -2 5.9
PRM2 +94,+297 -45 6.1
PRP39 -89 approx. +300 0.3
PRY3 -76 +452 0.6
SAG1 -826 -38 4.2
PRM4 -64 -64 1.9
BAR1
b
-52 -52 1.0
a
FAR1
b
-47 -47 1.0
a
STE2
b
-31 -31 1.0
a
Nitrogen starvation
AMD2 -97 -23 2.7
ASP3 +657 -22 24.4
DAL5 -273 -53 15.0
DAL7 -159 -26 7.0
UGA1 -38 -38 2.0
MON1 -35 -35 1.8
ASP1
b
-41 -41 0.3
GDH1
b
-67 -67 0.7
Osmotic stress
AQY1 +28 -32 1.9
GCY1 -58 -58 2.6
PGM2 -60 -60 1.9
The 5' termini of the transcripts are expressed as nucleotides relative
to the initiation codon of the open reading frame (ORF) and were
determined by 5' rapid amplification of cDNA ends (RACE), except for
HO and PRP39 in pheromone-treated cells, which were estimated from
Northern blots and polymerase chain reaction walking. Ribosome
loading is defined as the average number of ribosomes associated with
a transcript and was determined as outlined in the method section
except when indicated differently. The genes that exhibit a change in 5'
untranslated region upon treatment are presented in bold font. The
nitrogen starvation experiments were carried out with the ᭝gcn2
strain.
a
These values were calculated from the data presented by
MacKay and coworkers [3].
b
These are control genes that do not
change in ribosome loading.
Genome Biology 2005, Volume 6, Issue 13, Article R111 Law et al. R111.5
comment reviews reports refereed researchdeposited research interactions information
Genome Biology 2005, 6:R111
kilobase form of the HO transcript in growing, untreated
cells. However, this form was replaced after pheromone treat-
ment by multiple transcripts over 2.5 kilobases in length (Fig-
ure 3b). RNase protection assays established that the long
forms of the HO transcript have 5' leaders that are contiguous
with the genomic sequence and extended by more than 470
nucleotides beyond the 5' end of the short transcript (not
shown). This change in structure of the transcript produced
was accompanied by a profound reduction in ribosome load-
ing on the HO transcripts present after pheromone treatment
(Figure 3c). QPCR across sucrose gradients, using a primer
set specific to the long forms, demonstrated that the long,
pheromone-induced transcripts are extremely under-loaded
with ribosomes (Figure 3d). Very low, but significant, levels of
the long forms are detected in untreated cells and are likewise
translated inefficiently. Thus, like SAG1, a new HO transcript
appears upon pheromone treatment. In contrast to SAG1, the
new form is poorly loaded with ribosomes, which together
with decreased transcript level, ceases production of the
endonuclease in preparation for mating.
Other transcripts in addition to HO and SAG1 were found to
change their association with ribosomes in response to mat-
ing pheromone [3]. These include CRH1, KAR5, PRM2,
PRP39, and PRY3, which - like HO and SAG1 - all show con-
comitant alterations in their 5' leaders (Table 1). Interest-
ingly, the poorly loaded forms of these particular transcripts
all have their 5' termini located within the protein encoding
regions, precluding synthesis of the full-length proteins (see
Discussion, below).
The signal transduction pathway for the pheromone response
is well understood, and strains with deletions of the involved
genes are viable but do not mate [22,23]. Key components of
this pathway are the partially redundant protein kinases
Fus3p and Kss1p along with the transcription factor Ste12p.
Strains lacking either the two kinases (Figure 4a) or the tran-
scription factor (Figure 4b) exhibited none of the changes in
ribosome loading on the HO transcript that were seen with
the wild-type strain in response to α-factor (Figure 4c; also
see Figure 3c). This lack of response of the double fus3 kss1
and the ste12 deletion strains was also observed with the
SAG1, CRH1, and PRY3 transcripts (data not shown). There-
fore, it seems that the alterations in ribosome loading on
these five transcripts require the entire pheromone signal
transduction pathway, including activation of the Ste12 tran-
scription factor. Northern blot analysis of SAG1, CRH1, and
PRY3 revealed no change in transcript structure in the ste12
mutant, which is consistent with the relationship between 5'
UTR structure and ribosome loading.
Many genes respond to α-factor with increases in transcript
level, but corresponding alterations in transcript structure
were not universally found. For example, four genes - BAR1,
FAR1, PRM4, and STE2 - all exhibited elevated transcript lev-
els after exposure to α-factor, but none of these showed a
modified 5' leader (Table 1). Of these four genes, only PRM4
exhibited significantly altered ribosome loading [3], and this
transcript is seemingly 'poised' to respond rapidly at the
translational level to pheromone. It should be emphasized
that, of the pheromone-responsive cohort of genes examined
in this paper, PRM4 is the only one that showed a change in
ribosome loading with no concomitant change in transcript
structure.
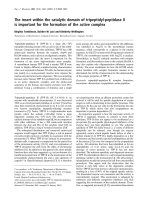
Structure of the 5' leader of the SAG1 transcript regulates its translationFigure 2 (see following page)
Structure of the 5' leader of the SAG1 transcript regulates its translation. (a) Distribution of SAG1 mRNA across polysome gradients in growing cells (filled
circles) or cells treated with α-factor for 30 min (open circles). Cell lysates [3] were loaded onto 7-47% sucrose gradients and spun for 1.5 hours in a
SW40 rotor at 39,000 rpm at 4°C. Levels of SAG1 transcript in each gradient fraction were determined by real-time polymerase chain reaction (QPCR)
and the signal in each fraction was divided by the sum of the signals in all fractions. The top of the gradient is to the left and the position of the 80S
monosome is marked with the arrow. (b) Northern blot analysis of SAG1 RNA from growing cells (lanes 1 and 2) or from cells after 45 min of α-factor
treatment (lanes 3 and 4). Equal cell equivalents of RNA from pooled sucrose gradient fractions 1-14 (lanes 1 and 3) or pooled fractions 15-25 (lanes 2 and
4) were analyzed. (c) Relative levels of SAG1 mRNA at different time points after treatment with α-factor. Total RNA was isolated from cells treated with
α-factor for the indicated times and cDNA was produced with reverse transcription by priming with oligo(dT)
25
. SAG1 transcript levels were determined
by QPCRusing either primers recognizing both transcripts or primers specific for the long transcript. Closed circles show the values for the long form and
the open circles represent calculated values for the short SAG1 transcripts, computed as the differences between the values for both transcripts and those
for the long transcript. The curves are normalized to a value of 1.0 for the long transcript at zero time of treatment. (d) RNase protection assay showing
two forms of SAG1 : lane 1, probe only; lane 2, no RNA; lane 3, tRNA control; lanes 4 and 5, 50 µg total RNA from growing cells; lanes 6 and 7, 50 µg total
RNA from cells treated for 30 min with α-factor; and lane 8, RNA markers. The antisense RNA probe was prepared from cloned genomic sequence and
contained 55 nucleotides of open reading frame, 484 nucleotides of 5' leader, and 92 nucleotides of noncomplementary sequence. Independent RNA
preparations were used in lanes 4-7. Locations of the protected probes corresponding to SAG1 long 5' leader (539 nucleotides) and short 5' leader (95
nucleotides) are indicated. (e) Western blot analysis of protein extracts from growing cells was performed to determine the relative levels of His3-HA
protein from yeast strains transformed with reporter constructs containing the ADH1 promoter and SAG1 short 5' leader (lane 1), SAG1 long 5' leader
(lane 3), or the empty vector (lane 2). The arrow indicates location of the His3-HA protein. As indicated in the figure, lanes 2 and 3 had 10 times more
protein loaded than did lane 1.
R111.6 Genome Biology 2005, Volume 6, Issue 13, Article R111 Law et al. />Genome Biology 2005, 6:R111
Figure 2 (see legend on previous page)
Genome Biology 2005, Volume 6, Issue 13, Article R111 Law et al. R111.7
comment reviews reports refereed researchdeposited research interactions information
Genome Biology 2005, 6:R111
Influence of nitrogen starvation on the translation
state of the transcriptome
In the collection of under-translated transcripts, 20 were
related to responses of yeast to nitrogen starvation (Table 2).
Many of these genes encode regulators of nitrogen metabo-
lism and enzymes that are involved in metabolism of
secondary nitrogen sources. A subclass abundantly repre-
sented in this group contains genes that are involved in the
vacuolar process known as autophagy. Through regulated
proteolysis of cytosolic proteins [24,25], autophagy liberates
Transcriptional and translational downregulation of HO expression in response to mating pheromoneFigure 3
Transcriptional and translational downregulation of HO expression in response to mating pheromone. (a) Relative levels of HO mRNA (normalized to 1.0
for the long transcript at time = 0 min) as a function of time after α-factor treatment. RNA was prepared and analyzed as in Figure 2c. Closed circles show
values for both forms of transcripts and open circles represent values for the long HO transcript. (b) Northern analysis of total RNA (10 µg) from growing
cells (lane 1) or cells treated with α-factor for 30 minute (lane 2). The blot was stripped and re-probed for ACT1 as a loading control. (c) Relative levels of
HO mRNA across polysome gradients in growing cells (filled squares) or cells treated with α-factor for 30 minute (open circles). Gradients were
performed and analyzed as described in Figure 2 using PCR primers recognizing both HO transcripts. The top of the gradient is to the left and the position
of the 80S monosome is marked with the arrow. (d) Relative levels of the long forms of HO across polysome gradients in growing cells (filled circles, right
axis) or cells treated with α-factor (open circles, left axis). QPCR using primers specific to the long forms of HO was performed on cDNA obtained from
the same RNA samples used in the experiment described in panel c of this figure. Note the difference in scale on the two axes.
R111.8 Genome Biology 2005, Volume 6, Issue 13, Article R111 Law et al. />Genome Biology 2005, 6:R111
the amino acids necessary for synthesis of new proteins
required for adaptation to a new nutritional environment.
Nitrogen starvation causes a generalized inhibition of protein
synthesis initiation, probably through activation of protein
kinase Gcn2p, which phosphorylates the a-subunit of the key
translation initiation factor eIF-2 [5]. In response to transfer
of cells to nitrogen starvation medium, there is a programmed
loss of polysomes and a concomitant accumulation of free
ribosomes (Figure 5; panels a and b). Coincident with the loss
of polysomes during nitrogen stress is a general movement of
transcripts to smaller polysomes. This is illustrated in Figure
5c for ASP1, which encodes a constitutive cytosolic asparagi-
nase. Three other control transcripts that were examined -
GDH1, DED1, and ERG11 - all showed the same reduction in
ribosome loading as did ASP1 (not shown). In contrast to
ASP1, transcripts from the four identical copies of ASP3,
which encode the periplasmic asparaginase responsible for
utilizing asparagine as a general nitrogen source, become bet-
ter loaded with ribosomes in response to nitrogen starvation
(Figure 5d).
Three other examples of transcripts that run counter to gen-
eral protein synthesis and become better loaded with ribos-
omes during nitrogen stress are shown in Figure 6. The DAL5
gene encodes an enzyme that is involved in the utilization of
allantoin, a secondary nitrogen source for yeast; UGA1
encodes a transaminase involved in the catabolism of γ-ami-
nobutyric acid; and GCN4 encodes the bZIP protein Gcn4p,
which mediates general transcriptional control over amino
acid biosynthesis in yeast. These three transcripts exhibit a
pattern similar to that seen with ASP3 (Figure 6). The activa-
tion of GCN4 translation in response to amino acid starvation
is mediated through the phosphorylation of eIF-2 [5]. Inter-
Influence of mutations in the pheromone signaling pathway on translational responses of the HO transcriptFigure 4
Influence of mutations in the pheromone signaling pathway on translational
responses of the HO transcript. The top of the gradient is to the left and
the position of the 80S monosome is marked with the arrow. Percentage
of total HO mRNA across polysome gradients in growing cells (filled
circles) and cells treated with α-factor for 30 minutes (open circles) for
strains (a) ∆fus3 ∆kss1, (b) ∆ste12, and (c) parental BY2125. Sucrose
gradient centrifugation was performed and analyzed as described in Figure
2, using polymerase chain reaction primers that are common to all HO
transcripts.
Table 2
Under-translated genes involved in responses to nitrogen stress
Gene Function
AMD2 Amidase
APG13 Autophagy
APG5 Autophagy
ARG80 Regulation of arginine and ornithine utilization
ARO80 Regulation of aromatic amino acid catabolism
ASP3 Asparaginase
CCZ1 Autophagy
DAL5 Allantoate metabolism
DAL7 Allantoate metabolism
DOA4 Regulates amino acid permease Gap1p
GCN4 General control of amino acid biosynthesis
GDH2 Glutamate dehydrogenase
GZF3 Regulates nitrogen catabolic gene expression
LST4 Regulates amino acid permease Gap1p
MON1 Autophagy
MUP3 Methionine permease
STP2 Regulator of amino acid permease genes
VPS30 Autophagy
UGA1 GABA aminotransferase
YSP3 Peptidase
This list of genes was derived from a Gene Ontology analysis of the
translation state of transcripts of yeast cells growing in rich-glucose
medium [3].
Genome Biology 2005, Volume 6, Issue 13, Article R111 Law et al. R111.9
comment reviews reports refereed researchdeposited research interactions information
Genome Biology 2005, 6:R111
pretation of the GCN4 finding (Figure 6c) is either that the
level of uncharged tRNA elevates sufficiently to activate the
Gcn2p protein kinase under these conditions of general nitro-
gen stress [5] or that the state of phosphorylation of Gcn2p
itself is lowered as a result of nitrogen starvation [26]. Activa-
tion of ribosome loading on the DAL5 and UGA1 transcripts
does not depend on Gcn2p, because the experiments illus-
trated in Figure 6 panels a and b were performed with a gcn2
deletion strain.
The 5' termini of eight transcripts related to nitrogen stress
were examined before and after starvation (Table 1). The
ASP1 and GDH1 transcripts follow the general reduction in
ribosome loading after nitrogen starvation and are unaltered
Translational responses to nitrogen starvationFigure 5
Translational responses to nitrogen starvation. Sucrose gradient centrifugation was performed and analyzed as described in Figure 2. The A
254
profiles are
shown of sucrose gradients with extracts from either (a) growing cells or (b) starved cells loaded onto gradients. The tops of the gradients and location
of the 80S ribosome peak in panel a are indicated. (c) ASP1 mRNA levels across sucrose gradients from growing cells (filled circles) or cells nitrogen
starved for 30 minutes (open squares). RNA was prepared and analyzed as described in Figure 2. The top of the gradient is to the left and the position of
the 80S monosome is marked with the arrow. (d) ASP3 mRNA levels; cell extracts and symbols are as in (c).
R111.10 Genome Biology 2005, Volume 6, Issue 13, Article R111 Law et al. />Genome Biology 2005, 6:R111
in structure. This is in contrast to a group of transcripts with
enhanced ribosome loading, namely AMD2, ASP3, DAL5, and
DAL7, which all exhibit clear alterations in the 5' termini of
their transcripts. The 5' end of the short form of ASP3 lies
within the ORF, as was noted above for some of the pherom-
one-regulated transcripts. Two other transcripts, UGA1 and
MON1, were found to have unaltered 5' termini after
starvation, although they exhibit enhanced ribosome loading
with nitrogen starvation.
Influence of osmotic stress on the under-translated
transcriptome
Of the under-translated transcripts identified in growing
cells, 18 were found to be related to responses to osmotic
stress (Table 3). Total protein synthesis in osmotically
stressed cells is inhibited [27,28], and this is reflected in a net
decrease in polysome levels (not shown). Four of the genes
included in Table 3, namely AQY1, GCY1, HAL1, and PGM2,
exhibited an increase in ribosome loading in response to 1
mole per litre sorbitol. Figure 7 shows this increase in loading
for AQY1. Analysis of AQY1, GCY1, and PGM2 by 5' RACE
revealed a change in the 5' leader of AQY1, from within the
ORF (+28) to -32 nucleotides relative to the initiator AUG
(Figure 7, inset). In contrast there was no change in the struc-
tures of GCY1 and PGM2 (Table 1). Other workers found that
the 5' terminus of HAL1 changes from -126 to a cluster from -
38 to -68 (relative to the initiator AUG codon; Serrano R,
Marques JA, personal communication). Thus, it appears that
changes in ribosome loading in response to osmotic stress
also can be accompanied by alterations in the transcript
structure, as was observed with exposure to pheromone and
nitrogen starvation.
Changes in ribosome loading in response to nitrogen starvationFigure 6
Changes in ribosome loading in response to nitrogen starvation. mRNA
levels across sucrose gradient from growing cells (open circles) and from
cells nitrogen starved for 30 minutes (filled circles) for (a) DAL5, (b) UGA1
and (c) GCN4. RNA was prepared and analyzed as described in Figure 2.
The top of the gradient is to the left and the position of the 80S
monosome is marked with the arrow. The experiments shown in (a) and
(b)were performed with strain LL1 (∆gcn2 ; described in Materials and
methods) and the experiment in panel c was conducted with the wild-type
strain.
Table 3
Under-translated osmoregulatory genes
Gene Function
GCY1 Salt induced aldo-keto reductase
AQY1 Aquaporin
ALD3 Aldehyde dehydrogenase, activity increased by osmotic shock
BCK1 MAPKKK in the PKC pathway
HAL1 Halotolerance
MSN1 Present with Hot1p at GPD1 promoter only during osmostress
HAL5 Cation homeostasis
HOT1 Transcription factor, high osmolarity
NST1 Negative effector of halotolerance
SSK22 MAPKK osmosensing, redundant w/SSK2
SSK1 osmosensing activator of MAPK pathway
SSK2 MAPKK osmosensing
DOA4 Involved in vacuole biogenesis and osmoregulation
HOG1 MAPK in osmolarity response
DAK2 Glycerone kinase, response to stress
APA2 Osmoregulation in vacuole
PGM2 Osmoregulation
WSC3 Osmoregulation
This list of genes was derived from a Gene Ontology analysis of the
translation state of transcripts of yeast cells growing in rich-glucose
medium [3]. MAPK, mitogen-activated protein kinase; MAPKK, MAPK
kinase; MAPKKK, MAPK kinase kinase; PKC, protein kinase C.
Genome Biology 2005, Volume 6, Issue 13, Article R111 Law et al.
comment reviews reports refereed researchdeposited research interactions information
Genome Biology 2005, 6:R111
Discussion
Poorly translated cytosolic transcripts are usually found pre-
dominantly within mRNP particles [27] or with single ribos-
omes arrested on them [11], depending on the mechanism of
regulation. Conversely, transcripts in the process of being
translated into protein are generally associated with multiple
actively translating ribosomes (polysomes). Because the
average rate of movement of translating ribosomes along
mRNAs (for example, polypeptide elongation) tends to be
constant among different transcript species [28], it follows
that the spacing of ribosomes along an mRNA is generally
proportional to the rate of synthesis of the encoded protein.
These considerations enable estimates of relative rates of syn-
thesis of individual proteins across transcriptomes [1,3],
which in turn allowed us to define a class of transcripts that
are under-loaded with ribosomes and thus apparently trans-
lated at lower efficiencies than the majority of the transcrip-
tome. However, this definition is not all-inclusive, because
those transcripts whose translation is regulated through
arrest of elongation would be located in the polysomal frac-
tion and therefore would not be identified as under-trans-
lated by this analysis. Transcripts regulated at the level of
polypeptide elongation may be prominent during early
embryonic development [29,30] and among transcripts regu-
lated by micro-RNAs [31]. Because of these considerations,
the definition of less than 10% of the transcripts as 'under-
translated' in growing yeast being may be an under-estimate.
Mechanisms for generating alternate 5' untranslated
regions
For a significant number of the genes implied to be under-
translated during normal growth conditions, ribosome load-
ing increased under the appropriate stress conditions, sug-
gesting the existence of specific regulatory mechanisms that
are responsive to environmental signals. One possible
mechanism for this enhanced translation is suggested by the
surprising frequency of regulated alterations in transcript
structure. Of the 17 poorly loaded, translationally controlled
transcripts examined in detail here, 12 exhibited structural
changes coincident with altered ribosome loading in response
to exogenous cues. The remaining five (PRM4, UGA1, MON1,
GCY1, and PGM2) are likely to be solely under translational
control.
The observed structural alterations were detected exclusively
at the 5' ends of the transcripts. The sequences of 5' RACE
products, together with RNase protection assays,
demonstrated co-linearity between transcript and genomic
sequences, providing no evidence for a regulated splicing
mechanism similar to that involved in regulation of HAC1 in
response to endoplasmic reticulum stress [32]. Excluding
regulated splicing as a mechanism, the alternative forms
seemingly arose either transcriptionally, through use of dif-
ferent promoters, or post-transcriptionally, either as normal
intermediates of mRNA decay or through a new RNA cleavage
mechanism. The requirement for STE12 revealed by this work
points to a role for transcription in the pheromone-induced
transcript changes described here, but this role could be
direct or indirect. Consistent with a direct role for Ste12p-
mediated promoter activation, TATA boxes and Ste12p bind-
ing sequences are found appropriately placed relative to the
putative transcription starts of the pheromone-induced forms
of the HO, PRM2, PRY3, and SAG1 transcripts (K.S. Bickel,
unpublished observation). Previously, altered promoter
usage was demonstrated directly for the nitrogen-regulated
gene CAN1 and was suggested for DAL5, although the trans-
latability of the alternative transcript forms was not assessed
[33]. Promoter elements implicated in regulation of CAN1
and DAL5 are also found in the promoter regions of AMD2
and DAL7, suggesting the possibility of a similar switch in
promoter usage.
Considering possible post-transcriptional mechanisms, the
normal process of mRNA decay in the cytosol involves
removal of the 5' cap, followed by 5'-3' exonucleolytic degra-
dation [34]. A block to exonuclease action could produce
some of the 5' truncated products described here. Perhaps
related to this is that accumulation of 5' truncated transcripts
in Arabidopsis was recently found to result from ribosome
arrest mediated by nascent peptide [35]. Importantly, all
known nonsplicing post-transcriptional mechanisms would
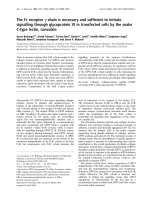
Response of AQY1 to osmotic stressFigure 7
Response of AQY1 to osmotic stress. Cells were either grown in YPD
(filled circles) or shocked by sorbitol addition for 30 minutes (open
circles). Sucrose gradient centrifugation was performed and analyzed as
described in Figure 2. The top of the gradient is to the left and the position
of the 80S monosome is marked with the arrow. The 5' termini of the
AQY1 transcript before and after osmotic stress are shown in the inset.
Rapid amplification of cDNA ends (RACE) was carried out as described in
the text (see Materials and methods), using as templates total RNA
isolated from cells either grown in YPD (-) or osmotically shocked (+).
The image contains the polymerase chain reaction products from the
second RACE amplification step after separation by electrophoresis in 2%
agarose gel. Lane 'M' contains a 100-basepair ladder.
R111.12 Genome Biology 2005, Volume 6, Issue 13, Article R111 Law et al. />Genome Biology 2005, 6:R111
be predicted to generate uncapped 5' ends, in contrast to the
termini generated by RNA polymerase II initiation.
Implications of altered 5'-untranslated regions for
protein production
Because this is the first large-scale study relating ribosome
loading to transcript structure, the frequency with which
these regulated changes in transcript structure occur across
nature is unknown. However, the suggestion that 9-18% of
mammalian transcripts may have alternative first exons [12]
is provocative. Two mammalian genes, in which alternative
first exons were found to modify translation, are the gene
encoding TIMP (tissue inhibitor of metalloproteinases) and
the oncogene mdm2. With both of these genes, the transla-
tional efficiencies of the transcripts are regulated by changes
in promoter utilization, which lead to altered 5' leaders
[36,37].
In yeast, use of alternative promoters has been shown in some
cases to produce different proteins. The SUC2 and KAR4
genes both contain multiple promoters, which generate dif-
ferent protein products with different biologic activities
[38,39]. Similarly, the short forms of the CRH1, KAR5,
PRM2, PRP39, PRY3, ASP3, and AQY1 mRNAs identified in
this study lack the primary initiation codon, resulting in 5'
truncated ORFs. These seven genes have the potential to cre-
ate short protein products from internal AUG codons within
the truncated mRNAs in the same ORFs as the primary prod-
ucts, although existence of these protein products has not
been proven. With PRM2, CRH1, and PRY3, the putative
amino-terminal truncated proteins lack signal sequences that
target these three proteins to the endoplasmic reticulum.
Therefore, if produced, the short protein products of these
three genes probably differ in intracellular location, and
possibly in function, from the full-length proteins. Similarly,
the single transmembrane domain of the full-length Kar5
protein, which localizes it in the endoplasmic reticulum
membrane, would be missing from the shorter, poorly trans-
lated form. These changes in protein targeting potentially
could play roles in regulating cellular responses to
pheromone.
With several other transcripts identified here - HO, SAG1,
AMD2, DAL5, and DAL7 - the altered 5' leaders did not mod-
ify the protein encoding regions but profoundly altered the
loading of ribosomes on the resulting transcripts. Although
one can posit functional explanations for the truncated pro-
tein products produced from alternate transcripts, the bio-
logic significance of 5' leaders with repressed translational
activity is less obvious. The HO gene represents an extreme
example in which a 5' leader as long as 2 kilobases is produced
in response to pheromone treatment and the long transcripts
are located primarily in untranslated mRNP particles. Like-
wise, poor translation of the SAG1 transcript in growing cells
is mediated by an inhibitory 826-nucleotide 5' UTR. A similar
situation seems to occur with the nitrogen-regulated AMD2,
DAL5, and DAL7 transcripts. In addition to the changes in
ribosome loading observed here, the levels of all five of these
transcripts are regulated at the transcriptional level. One out-
come of these parallel changes in transcript level and transla-
tion efficiency is to amplify the biologic consequence of
transcriptional control by accentuating the upregulation or
downregulation of protein production. This is surely one
mechanism for the 'homodirectional' changes in transcript
level and ribosome loading that have been noted by others on
a global level in yeast [2]. However, this rationalization
neglects the conundrum of why the cell does not simply
enhance an expression response by switching transcription
completely off.
Implications for transcriptional mechanisms
Why should the cell produce a transcript that is either poorly
translated or not translated at all? One speculative role for the
continued synthesis of translationally inactive transcripts,
under conditions in which the protein product is not needed,
could involve regulation of accessibility to the promoter
regions of these genes. One suggested role for the 'intergenic'
transcription, which has been found widely in eukaryotes
[40,41], is to assist in maintaining an open chromatin state
required for facile transcriptional activation. Intergenic tran-
scription has been found in the locus control regions of the
mammalian β-globin and MHC (major histocompatibility
complex) class II loci [42,43], in the promoter regions of the
interleukin-4 and interleukin-13 genes [44], in the V(D)J
region of the mouse immunoglobulin heavy chain locus [45]
and within the Drosophila bithorax complex [46]. RNA
polymerase II is found upstream of many apparently inactive
genes in stationary phase S. cerevisiae [47]. It is noteworthy
that the 5' leader of the long HO transcript extends 2,000
nucleotides upstream of the coding region through a region
that is devoid of genes (for example, intergenic) and which
contains a multitude of transcription factor binding sites that
mediate the complex transcriptional control of the HO gene
(discussed by Krebs and coworkers [48]). Maintenance of this
extended region in an open state through continued low level
transcription of the translationally inactive transcript species
could allow rapid reactivation of HO transcription upon
removal of pheromone.
In addition to keeping chromatin in an active state, transcrip-
tion from intergenic regions can also be involved in repress-
ing transcription from promoters. This has been found to
occur either by local competition between promoters [49] or
through interference by elongating polymerases coming from
an upstream promoter [50]. The competition model applies
equally to promoters located upstream or downstream of the
primary promoter, which is consistent with the occurrence of
both longer and shorter 5' UTRs in this study.
Very little is known of the mechanisms that prevent inappro-
priate protein production from intergenic transcripts. Some
'cryptic' RNA polymerase II products are removed within the
Genome Biology 2005, Volume 6, Issue 13, Article R111 Law et al.
comment reviews reports refereed researchdeposited research interactions information
Genome Biology 2005, 6:R111
nucleus through a highly conserved process utilizing a unique
poly(A) polymerase and the nuclear exosome [51]. Nonsense-
mediated decay [52,53], another highly conserved process
[54,55], removes those transcripts that are recognized as
having premature translation termination codons. This paper
describes a third process, translational silencing, wherein
continuing synthesis of transcripts with inhibitory 5' leaders
contributes to an open chromatin structure while protecting
the cell from inappropriate protein production. At this time,
we have no evidence defining the inhibitory elements in the 5'
leaders of the silenced transcripts. As discussed in the Back-
ground section (above), possible inhibitory features could be
secondary structure, protein binding sites, or ATG codons
upstream of the coding region. With regard to the latter
mechanism, we have noted ATG sequences in all of the long,
inhibitory 5' leaders. For example, the long forms of the DAL5
and AMD2 5' leaders contain five and two ATG codons,
respectively, whereas neither short form contains an ATG
upstream of the start codon. Further experimental work will
be required to establish the inhibitory elements in the trans-
lationally silenced transcripts.
Materials and methods
Yeast cultures and polysome fractionation
All experiments used strain BY2125 (MATa ade2-1 his3-11,15
leu2-3,112 ura3-1 can1-100 ssd1-d : W303 background).
Strains VM1906 (∆fus3::LEU2 ∆kss1::TRP1), VM1718
(∆ste12::TRP1) and LL1 (∆gcn2::TRP1) were derived from
BY2125 by gene disruption [56].
Cells were grown at 30°C in rich glucose medium, YPD (1%
yeast extract, 2% peptone and 2% glucose) [57], to mid-log
phase (approximately 1 × 10
7
cells/ml) before harvesting.
Preparations of cell lysates and polysome fractionation were
described previously, as was pheromone treatment of yeast
cultures [3]. For nitrogen starvation, cultures were grown at
30°C in minimal glucose medium [57] with necessary supple-
ments to mid-log phase, washed once with 10 mmol/l potas-
sium phosphate (pH 7.0), and then incubated for 30 minutes
at 30°C in pre-warmed nitrogen starvation medium (0.2%
yeast nitrogen base [without amino acids or ammonium sul-
fate], 3% glucose, 20 mmol/l potassium phosphate [pH 7.0],
and adenine and uracil added at 40 and 20 µg/ml, respec-
tively) [58]. For osmotic stress, exponential phase YPD cul-
tures (approximately 8 × 10
6
cells/ml) were diluted into an
equal volume of pre-warmed YPD or YPD + 2 mol/l sorbitol.
Incubation at 30°C was continued for 30 minutes before the
cultures were harvested.
RNA analysis
RNA was isolated using Qiagen RNeasy mini-columns (Qia-
gen Corp., Valencia, CA, USA). An equal proportion of the
RNA isolated from each sucrose gradient fraction was used
directly in reverse transcription reactions using anchored
oligo(dT)
25
primers. When comparing changes in total RNA
isolated from different culture conditions or treatments,
equal quantities of total RNA were used for reverse transcrip-
tion reactions. QPCR was performed as described previously
[3].
Northern blot analysis followed a procedure described previ-
ously [59], as did the RNase protection assays [60]. The SAG1
RNase protection assay probe was 631 bases long and con-
tained 484 nucleotides 5' of the coding region and 55 nucle-
otides into the coding region. 5' RACE was carried out as
described by Frohman [61] using gene specific primers for the
reverse transcription reaction. The Thermoscript RT-PCR
system (Invitrogen, Carlsbad, CA, USA) was used allowing for
the reverse transcription reaction to be done at 55°C to mini-
mize reverse transcriptase stops due to secondary structure in
the RNA. To estimate the HO 5' leader in cells treated with α-
factor for 30 minutes, reverse transcription reactions were
done as described above and the products were used as DNA
template in a series of PCR reactions. Two reverse primers,
located -500 and -1493 nucleotides relative to the initiation
codon of the HO ORF and 10 different forward primers,
spaced roughly 200 nucleotides apart starting at -700, were
used.
Determination of ribosome loading ratio
Using QPCR, relative levels of mRNA across polysome gradi-
ents were determined for the indicated genes in growing cells
or treated cells. The treatment was either pheromone treat-
ment for 30 minutes, nitrogen starvation for 30 minutes or
osmotic stress for 30 minutes. Using the Abs
260 nm
traces from
the polysome gradients, the number of ribosomes associated
with a specific mRNA in each fraction was determined. The
ribosome loading ratio was calculated by dividing the average
number of ribosomes associated with a transcript from a
polysome gradient from treated cells divided by the average
number of ribosomes associated with a transcript from a
polysome gradient from growing cells. A number greater than
1 indicates an increase in ribosome loading with treatment
and conversely a number less than 1 indicates a decrease in
ribosome loading with treatment.
Construction of HIS3-HA reporter plasmids
A HIS3-HA reporter plasmid (pVW12) was constructed by
insertion of the HIS3-HA sequence from pVW06 [3] between
the Bam HI and Eco RI sites of the multiple cloning sequence
of plasmid pRS416ADH1p [62], so that HIS3-HA transcrip-
tion is from the constitutive ADH1 promoter. The ADH1 5'
leader in pVW12 (nucleotides -48 to -1) was replaced with
either the SAG1 short 5' leader (nucleotides -48 to -1, plasmid
pVW13) or the SAG1 long 5' leader (nucleotides -836 to -1,
plasmid pVW14) using plasmid gap repair [63]. Specifically,
pVW12 was cleaved in the 5' leader with Spe I and Xba I and
transformed into strain BY2125 with PCR fragments bearing
the short or long SAG1 5' leader flanked with 5' and 3'
sequences homologous to the ADH1 promoter (-91 to -49)
and HIS3-HA (+1 to +48). Ura
+
yeast transformants were
R111.14 Genome Biology 2005, Volume 6, Issue 13, Article R111 Law et al. />Genome Biology 2005, 6:R111
screened by PCR to identify plasmids repaired with the SAG1
fragments and confirmed by DNA sequencing. S1 nuclease
protection assays were carried out as described [64,65], using
gel purified oligonucleotides (Qiagen Corp.), on RNA isolated
from pVW13 or pVW14 to confirm the 5' ends of each
transcript.
Western blots
Yeast transformed with pRS416ADH1, pVW13, or pVW14
were grown in selective medium (synthetic complete medium
with casamino acids and lacking uracil) to mid-exponential
phase, harvested, and lysed as described previously [3]. Pro-
tein samples (5 µg for the pVW13 lysate and 50 µg each for the
pVW14 and pRS416ADH1p lysates) were separated by
electrophoresis on a 10% polyacrylamide gel and transferred
electrophoretically to PVDF membrane. The membrane was
incubated with anti-HA mouse monoclonal antibody HA.11
(Covance Research Products, Berkeley, CA, USA) and sheep
anti-mouse immunoglobulin conjugated with horseradish
peroxidase (Amersham Biosciences, Piscataway, NJ, USA),
then developed with ECL Plus Western Blotting Detection
System (Amersham Biosciences). His-HA protein was quan-
titated using a Storm 840 phosphorimager (Amersham
Biosciences).
Additional data files
The following additional data are included with the online
version of this article: A text file containing the data used to
construct Figure 1, parts a and b (Additional data file 1); a text
file containing the data used to construct Figure 1, parts c
(Additional data file 2); and a text file containing the data
used to determine ribosome loading ratio in Figure 1 (Addi-
tional data file 3).
Additional data file 1A text file containing the data used to construct Figure 1A text file containing the data used to construct Figure 1 parts a and bClick here for fileAdditional data file 2A text file containing the data used to construct Figure 1 part cA text file containing the data used to construct Figure 1 part cClick here for fileAdditional data file 3A text file containing the data used to determine ribosome loading ratio in Figure 1A text file containing the data used to determine ribosome loading ratio in Figure 1Click here for file
Acknowledgements
This study were supported by research grants from the National Institutes
of Health (CA89807 and CA71453). KSB was supported under a National
Science Foundation Graduate Research Fellowship and in part by PHS
NRSA T32 GM07270 from NIGMS. We are grateful to Eileen Turcott for
technical assistance and to Marnie Gelbart and Stephanie Namciu for help-
ful suggestions on the possible impacts of the alternative transcripts on
transcriptional control.
References
1. Arava Y, Wang Y, Storey JD, Liu CL, Brown PO, Herschlag D:
Genome-wide analysis of mRNA translation profiles in Sac-
charomyces cerevisiae. Proc Natl Acad Sci USA 2003,
100:3889-3894.
2. Preiss T, Baron-Benhamou J, Ansorge W, Hentze MW: Homodirec-
tional changes in transcriptome composition and mRNA
translation induced by rapamycin and heat shock. Nat Struct
Biol 2003, 10:1039-1047.
3. MacKay VL, Li X, Flory MR, Turcott E, Law GL, Serikawa KA, Xu XL,
Lee H, Goodlett DR, Aebersold R, Zhao LP, Morris DR: Gene
expression in yeast responding to mating pheromone: Anal-
ysis by high-resolution translation state analysis and quanti-
tative proteomics. Mol Cell Proteomics 2004, 3:478-489.
4. Sonenberg N, Hershey JWB, Mathews MB: Translational Control of
Gene Expression Cold Spring Harbor, NY: Cold Spring Harbor Press;
2000.
5. Hinnebusch AG, Asano K, Olsen DS, Phan L, Nielsen KH, Valasek L:
Study of translational control of eukaryotic gene expression
using yeast. Ann N Y Acad Sci 2004, 1038:60-74.
6. Hay N, Sonenberg N: Upstream and downstream of mTOR.
Genes Dev 2004, 18:1926-1945.
7. Wilkie GS, Dickson KS, Gray NK: Regulation of mRNA transla-
tion by 5' and 3'-UTR-binding factors. Trends Biochem Sci 2003,
28:182-188.
8. Bartel DP: MicroRNAs. Genomics, biogenesis, mechanism,
and function. Cell 2004, 116:281-297.
9. de Moor CH, Meijer H, Lissenden S: Mechanisms of translational
control by the 3' UTR in development and differentiation.
Semin Cell Dev Biol 2005, 16:49-58.
10. Kozak M: Structural features in eukaryotic messenger RNAs
that modulate the initiation of translation. J Biol Chem 1991,
266:19867-19870.
11. Morris DR, Geballe AP: Upstream open reading frames as reg-
ulators of mRNA translation. Mol Cell Biol 2000, 20:8635-8642.
12. Landry JR, Mager DL, Wilhelm BT: Complex controls: the role of
alternative promoters in mammalian genomes. Trends Genet
2003, 19:640-648.
13. Patil C, Walter P: Intracellular signaling from the endoplasmic
reticulum to the nucleus: the unfolded protein response in
yeast and mammals. Curr Opin Cell Biol 2001, 13:349-356.
14. Mendez R, Richter JD: Translational control by CPEB: a means
to the end. Nat Rev Mol Cell Biol 2001, 2:521-529.
15. Lipke PN, Wojciechowicz D, Kurjan J: AG alpha 1 is the structural
gene for the Saccharomyces cerevisiae alpha-agglutinin, a cell
surface glycoprotein involved in cell-cell interactions during
mating. Mol Cell Biol 1989, 9:3155-3165.
16. Lipke PN, Kurjan J: Sexual agglutination in budding yeasts:
structure, function, and regulation of adhesion
glycoproteins. Microbiol Rev 1992, 56:180-194.
17. Hagen DC, Bruhn L, Westby CA, Sprague GF Jr: Transcription of
alpha-specific genes in Saccharomyces cerevisiae : DNA
sequence requirements for activity of the coregulator alpha
1. Mol Cell Biol 1993, 13:6866-6875.
18. Haber JE: Mating-type gene switching in Saccharomyces
cerevisiae. Trends Genet 1992, 8:446-452.
19. Klar AJ: Lineage-dependent mating-type transposition in fis-
sion and budding yeast. Curr Opin Genet Dev 1993, 3:745-751.
20. Nasmyth K: Regulating the HO endonuclease in yeast. Curr
Opin Genet Dev 1993, 3:286-294.
21. Breeden L, Nasmyth K: Cell cycle control of the yeast HO gene:
cis - and trans -acting regulators. Cell 1987, 48:389-397.
22. Elion EA: Pheromone response, mating and cell biology. Curr
Opin Microbiol 2000, 3:573-581.
23. Dohlman HG, Thorner JW: Regulation of G protein-initiated
signal transduction in yeast: paradigms and principles. Annu
Rev Biochem 2001, 70:703-754.
24. Klionsky DJ, Emr SD: Autophagy as a regulated pathway of cel-
lular degradation. Science 2000, 290:1717-1721.
25. Abeliovich H, Klionsky DJ: Autophagy in yeast: mechanistic
insights and physiological function. Microbiol Mol Biol Rev 2001,
65:463-479.
26. Cherkasova VA, Hinnebusch AG: Translational control by TOR
and TAP42 through dephosphorylation of eIF2alpha kinase
GCN2. Genes Dev 2003, 17:859-872.
27. Stefl R, Skrisovska L, Allain FH: RNA sequence- and shape-
dependent recognition by proteins in the ribonucleoprotein
particle. EMBO Rep 2005, 6:33-38.
28. Mathews MB, Sonenberg N, Hershey JWB: Origins and targets of
translational control. In Translational Control Edited by: Hershey
JWB, Mathews MB, Sonenberg N. Cold Spring Harbor, NY: Cold
Spring Harbor Press; 1996:1-29.
29. Braat AK, Yan N, Arn E, Harrison D, Macdonald PM: Localization-
dependent oskar protein accumulation; control after the ini-
tiation of translation. Dev Cell 2004, 7:125-131.
30. Clark IE, Wyckoff D, Gavis ER: Synthesis of the posterior deter-
minant Nanos is spatially restricted by a novel cotransla-
tional regulatory mechanism. Curr Biol 2000, 10:1311-1314.
31. Olsen PH, Ambros V: The lin-4 regulatory RNA controls devel-
opmental timing in Caenorhabditis elegans by blocking LIN-
14 protein synthesis after the initiation of translation. Dev Biol
1999, 216:671-680.
32. Ruegsegger U, Leber JH, Walter P: Block of HAC1 mRNA trans-
lation by long-range base pairing is released by cytoplasmic
Genome Biology 2005, Volume 6, Issue 13, Article R111 Law et al.
comment reviews reports refereed researchdeposited research interactions information
Genome Biology 2005, 6:R111
splicing upon induction of the unfolded protein response. Cell
2001, 107:103-114.
33. Cox KH, Rai R, Distler M, Daugherty JR, Coffman JA, Cooper TG:
Saccharomyces cerevisiae GATA sequences function as TATA
elements during nitrogen catabolite repression and when
Gln3p is excluded from the nucleus by overproduction of
Ure2p. J Biol Chem 2000, 275:17611-17618.
34. Coller J, Parker R: Eukaryotic mRNA decapping. Annu Rev
Biochem 2004, 73:861-890.
35. Onouchi H, Nagami Y, Haraguchi Y, Nakamoto M, Nishimura Y,
Sakurai R, Nagao N, Kawasaki D, Kadokura Y, Naito S: Nascent
peptide-mediated translation elongation arrest coupled with
mRNA degradation in the CGS1 gene of Arabidopsis. Genes
Dev 2005, 19:1799-1810.
36. Waterhouse P, Khokha R, Denhardt DT: Modulation of transla-
tion by the 5' leader sequence of the messenger RNA encod-
ing murine tissue inhibitor of metalloproteinases. J Biol Chem
1990, 265:5585-5589.
37. Brown CY, Mize GJ, Pineda M, George DL, Morris DR: Role of two
upstream open reading frames in the translational control of
oncogene mdm2. Oncogene 1999, 18:5631-5637.
38. Carlson M, Botstein D: Two differentially regulated mRNAs
with different 5' ends encode secreted and intracellular
forms of yeast invertase. Cell 1982, 28:145-154.
39. Gammie AE, Stewart BG, Scott CF, Rose MD: The two forms of
karyogamy transcription factor Kar4p are regulated by dif-
ferential initiation of transcription, translation, and protein
turnover. Mol Cell Biol 1999, 19:817-825.
40. Cheng J, Kapranov P, Drenkow J, Dike S, Brubaker S, Patel S, Long J,
Stern D, Tammana H, Helt G, et al.: Transcriptional maps of 10
human chromosomes at 5-nucleotide resolution. Science
2005, 308:1149-1154.
41. Johnson JM, Edwards S, Shoemaker D, Schadt EE: Dark matter in
the genome: evidence of widespread transcription detected
by microarray tiling experiments. Trends Genet 2005,
21:93-102.
42. Routledge SJ, Proudfoot NJ: Definition of transcriptional pro-
moters in the human beta globin locus control region. J Mol
Biol 2002, 323:601-611.
43. Masternak K, Peyraud N, Krawczyk M, Barras E, Reith W: Chroma-
tin remodeling and extragenic transcription at the MHC
class II locus control region. Nat Immunol 2003, 4:132-137.
44. Rogan DF, Cousins DJ, Santangelo S, Ioannou PA, Antoniou M, Lee
TH, Staynov DZ: Analysis of intergenic transcription in the
human IL-4/IL-13 gene cluster. Proc Natl Acad Sci USA 2004,
101:2446-2451.
45. Bolland DJ, Wood AL, Johnston CM, Bunting SF, Morgan G, Chaka-
lova L, Fraser PJ, Corcoran AE: Antisense intergenic transcrip-
tion in V(D)J recombination. Nat Immunol 2004, 5:630-637.
46. Schmitt S, Prestel M, Paro R: Intergenic transcription through a
polycomb group response element counteracts silencing.
Genes Dev 2005, 19:697-708.
47. Radonjic M, Andrau J-C, Lijnzaad P, Kemmeren P, Kockelkorn TTJP,
van Leenen D, van Berkum NL, Holstege FCP: Genome-wide anal-
yses reveal RNA polymerase II located upstream of genes
poised for rapid response upon S. cerevisiae stationary phase
exit. Mol Cell 2005, 18:171-183.
48. Krebs JE, Kuo MH, Allis CD, Peterson CL: Cell cycle-regulated
histone acetylation required for expression of the yeast HO
gene. Genes Dev 1999, 13:1412-1421.
49. Hirschman JE, Durbin KJ, Winston F: Genetic evidence for pro-
moter competition in Saccharomyces cerevisiae. Mol Cell Biol
1988, 8:4608-4615.
50. Martens JA, Laprade L, Winston F: Intergenic transcription is
required to repress the Saccharomyces cerevisiae SER3 gene.
Nature 2004, 429:571-574.
51. Wyers F, Rougemaille M, Badis G, Rousselle JC, Dufour ME, Boulay J,
Regnault B, Devaux F, Namane A, Seraphin B, et al.: Cryptic pol II
transcripts are degraded by a nuclear quality control path-
way involving a new poly(A) polymerase. Cell 2005,
121:725-737.
52. He F, Li X, Spatrick P, Casillo R, Dong S, Jacobson A: Genome-wide
analysis of mRNAs regulated by the nonsense-mediated and
5' to 3' mRNA decay pathways in yeast. Mol Cell 2003,
12:1439-1452.
53. Mendell JT, Sharifi NA, Meyers JL, Martinez-Murillo F, Dietz HC:
Nonsense surveillance regulates expression of diverse
classes of mammalian transcripts and mutes genomic noise.
Nat Genet 2004, 36:1073-1078.
54. Lejeune F, Maquat LE: Mechanistic links between nonsense-
mediated mRNA decay and pre-mRNA splicing in mamma-
lian cells. Curr Opin Cell Biol 2005, 17:309-315.
55. Conti E, Izaurralde E: Nonsense-mediated mRNA decay:
molecular insights and mechanistic variations across species.
Curr Opin Cell Biol 2005, 17:316-325.
56. Rothstein R: Targeting, disruption, replacement, and allele
rescue: integrative DNA transformation in yeast. Methods
Enzymol 1991, 194:281-301.
57. Sherman F: Getting started with yeast. Methods Enzymol 1991,
194:3-21.
58. Roon RJ, Murdoch M, Kunze B, Dunlop PC: Derepression of aspar-
aginase II during exponential growth of Saccharomyces cere-
visiae on ammonium ion. Arch Biochem Biophys 1982,
219:101-109.
59. MacKay VL, Mai B, Waters L, Breeden LL: Early cell cycle box-
mediated transcription of CLN3 and SWI4 contributes to
the proper timing of the G
1
-to-S transition in budding yeast.
Mol Cell Biol 2001, 21:4140-4148.
60. Ruan HJ, Brown CY, Morris DR: Analysis of ribosome loading
onto mRNA species: implications for translational control.
In Analysis of mRNA Formation and Function Edited by: Richter JD. New
York: Academic Press; 1997:305-321.
61. Frohman MA: Rapid amplification of complementary DNA
ends for generation of full-length complementary DNAs:
thermal RACE. Methods Enzymol 1993, 218:340-356.
62. Mumberg D, Muller R, Funk M: Yeast vectors for the controlled
expression of heterologous proteins in different genetic
backgrounds. Gene 1995, 156:119-122.
63. Cormack B, Castano I: Introduction of point mutations into
cloned genes. Methods Enzymol 2002, 350:199-218.
64. Mai B, Miles S, Breeden LL: Characterization of the ECB binding
complex responsible for the M/G
1
-specific transcription of
CLN3 and SWI4. Mol Cell Biol 2002, 22:430-441.
65. Iyer V, Struhl K: Absolute mRNA levels and transcriptional
initiation rates in Saccharomyces cerevisiae. Proc Natl Acad Sci
USA 1996, 93:5208-5212.
66. Saccharomyces Genome Database [stge
nome.org/]