Báo cáo y học: "A novel approach to identifying regulatory motifs in distantly related genomes" pps
Bạn đang xem bản rút gọn của tài liệu. Xem và tải ngay bản đầy đủ của tài liệu tại đây (299.58 KB, 18 trang )
Genome Biology 2005, 6:R113
comment reviews reports deposited research refereed research interactions information
Open Access
2005Van Hellemontet al.Volume 6, Issue 13, Article R113
Method
A novel approach to identifying regulatory motifs in distantly
related genomes
Ruth Van Hellemont
*
, Pieter Monsieurs
*
, Gert Thijs
*
, Bart De Moor
*
,
Yves Van de Peer
†
and Kathleen Marchal
*‡
Addresses:
*
ESAT-SCD, KU Leuven, Kasteelpark Arenberg 10, 3001 Leuven-Heverlee, Belgium.
†
Plant Systems Biology, Bioinformatics and
Evolutionary Genomics, VIB/Ghent University, Technologiepark 927, 9052 Gent, Belgium.
‡
Department of Microbial and Molecular Systems,
KU Leuven, Kasteelpark Arenberg 20, 3001 Leuven-Heverlee, Belgium.
Correspondence: Kathleen Marchal. E-mail:
© 2005 Van Hellemont et al.; licensee BioMed Central Ltd.
This is an open access article distributed under the terms of the Creative Commons Attribution License ( which
permits unrestricted use, distribution, and reproduction in any medium, provided the original work is properly cited.
Identifying regulatory motifs<p>A two-step procedure for identifying regulatory motifs in distantly related organisms is described that combines the advantages of sequence alignment and motif detection approaches.</p>
Abstract
Although proven successful in the identification of regulatory motifs, phylogenetic footprinting
methods still show some shortcomings. To assess these difficulties, most apparent when applying
phylogenetic footprinting to distantly related organisms, we developed a two-step procedure that
combines the advantages of sequence alignment and motif detection approaches. The results on
well-studied benchmark datasets indicate that the presented method outperforms other methods
when the sequences become either too long or too heterogeneous in size.
Background
Phylogenetic footprinting is a comparative method that uses
cross-species sequence conservation to identify new regula-
tory motifs [1]. Based on the observation that functional reg-
ulatory motifs evolve more slowly than non-functional
sequences, the method identifies potential regulatory motifs
by detecting conserved regions in orthologous intergenic
sequences [2,3]. The comparison of orthologous sequences
from multiple genomes is often based on multiple sequence
alignment [4,5] and several alignment algorithms, such as
CLUSTALW [6], DIALIGN [7,8], MAVID [9,10] and MLA-
GAN [11], have proven very useful to identify conserved
motifs in closely related higher vertebrate sequences
[4,12,13]. Although the comparison of closely related organ-
isms has proven successful, inclusion of more distantly
related species can greatly improve the detection of conserved
regulatory motifs. By adding more distantly related
sequences, the conserved functional motifs can be more easily
distinguished from the often highly variable 'background'
sequence. Moreover, this leads to the detection of motifs that
have a function in a wider variety of organisms, for example,
all vertebrates [14-19]. Both Sandelin et al. [20] and Woolfe et
al. [21], for instance, performed a whole genome comparison
of human and pufferfish, which diverged approximately 450
million years ago (mya) to discover non-coding elements con-
served in both organisms. They showed that most of these
conserved non-coding elements are located in regions of low
gene density (implying long intergenic regions) [21]. Moreo-
ver, many of the conserved non-coding elements are located
at large distances from the nearest gene [20,21]. These find-
ings led to the conclusion that it is interesting to analyze
whole intergenic regions of vertebrate genes, rather than limit
the comparative analyses to the promoter region located near
the transcription start.
However, vertebrate intergenic regions may differ considera-
bly in size, such as when comparing intergenics of, for exam-
ple, mammals with those of Fugu [22-24]. Since multiple
Published: 30 December 2005
Genome Biology 2005, 6:R113 (doi:10.1186/gb-2005-6-13-r113)
Received: 31 May 2005
Revised: 22 August 2005
Accepted: 1 December 2005
The electronic version of this article is the complete one and can be
found online at />R113.2 Genome Biology 2005, Volume 6, Issue 13, Article R113 Van Hellemont et al. />Genome Biology 2005, 6:R113
sequence alignments are often based on global alignment
procedures, they will likely fail to correctly align such
sequences of heterogeneous length [25].
An alternative for alignment methods is the use of de novo
motif detection procedures for phylogenetic footprinting.
These are based on either probabilistic or combinatorial algo-
rithms. One such method, FootPrinter [26,27], uses a string
based motif representation with dynamic programming to
search a phylogenetic tree for motifs that show a minimal
number of mismatches. Probabilistic algorithms, such as
MEME [28], Consensus [29,30] and Gibbs sampling [31,32],
use a matrix representation of the motif (position specific
weight matrix). Currently, several implementations of Gibbs
sampling are available, such as AlignACE [33,34], ANN-spec
[35], BioProspector [36] and MotifSampler [37-40]. How-
ever, these algorithms are sensitive to low signal-to-noise
ratios, that is, the presence of small motifs (five to eight base
pairs (bp)) in long intergenic sequences. This often results in
the detection of many false positive motifs. On the other
hand, an advantage of these procedures is that, because motif
detection comes down to locally aligning the orthologous
sequences, non-collinear motifs can still be detected.
Neither motif detection nor multiple alignment methods are
optimally suited to correctly align long intergenic sequences
of heterogeneous length. Here, we present a simple two-step
procedure that identifies conserved regions by combining the
advantages of both alignment and motif detection methods.
Such highly conserved regions most likely contain transcrip-
tion factor binding sites or other functional intergenic
sequences [41]. To show its efficiency, we applied our two-
step approach to well described benchmark datasets. Since
regions of strong conservation among divergent vertebrates
are often associated with developmental regulators [20,21],
we choose mainly these types of genes to test our methodol-
ogy. The presented approach, however, is applicable to any
set of organisms and genes for which one wants to compare
the intergenic sequences.
Results
A two-step procedure for phylogenetic footprinting
In this study, we aimed to detect regulatory motifs that have
been retained over long periods in evolution; in our test case,
this applied to mammals to ray-finned fishes such as Fugu.
The Fugu genome, however, is very compact and approxi-
mately eight or nine times smaller than the human one,
although both genomes are assumed to contain a similar rep-
ertoire of genes. The compactness of the genome of Fugu is
the result of shorter intergenic regions and introns
[22,23,42]. On the other hand, the preliminary and still often
erroneous annotation of the Fugu genome sometimes results
in the selection of very long intergenic regions. Such hetero-
geneous sizes of the intergenic regions that need to be com-
pared complicate identification of regulatory motifs. Widely
used alignment algorithms, such as AVID, LAGAN and oth-
ers, will usually fail when the sequences that need to be
aligned differ too drastically in length. This problem is exac-
erbated when the sequences have a low overall percent iden-
tity. To cope with this, motif detection procedures could offer
a solution. However, because regulatory motifs are typically
only 6 to 30 bp long, whereas intergenic sequences of verte-
brate genes range up to tens of kilobases [43], this results in a
low signal-to-noise ratio that complicates the immediate use
of de novo motif detection procedures. Therefore, we devel-
oped a two-step procedure to combine the advantages of the
alignment and motif detection procedures.
We included a first data reduction step based on an alignment
method prior to the second motif detection step (see Materi-
als and methods and Figure 1). This data reduction step
increases the signal-to-noise ratio in the input set used for
motif detection. Data reduction is based on the assumption
that longer regions conserved in the orthologs of closely
related species are more likely to contain biologically relevant
motifs compared to non-conserved regions [21]. Therefore, in
our benchmark study, regions conserved among closely
related orthologous intergenic sequences of comparable size
were preselected as input for motif detection. The mamma-
lian intergenic sequences showed a relatively high overall per-
cent identity and were comparable in length. Subsequently,
these selected conserved mammalian subsequences were
subjected to motif detection, together with the full-length
Fugu intergenic region.
Data reduction
The data reduction procedure preselects subsequences con-
served in closely related (mammalian) sequences. It requires
a multiple alignment procedure that combines a pairwise
alignment (AVID) and a clustering algorithm (Tribe-MCL).
Details on this procedure can be found in the Materials and
methods section. A resulting cluster consists of unique, non-
overlapping subsequences, corresponding to a specific region
conserved among the different related orthologs (human,
chimp, mouse and rat).
In our benchmark study, we were primarily interested in find-
ing DNA motifs conserved among all input sequences
(orthologs). Therefore, only clusters containing conserved
subsequences of all mammalian orthologs included in this
study (human, chimp, rat and mouse) were retained for fur-
ther analysis (supplementary website [44]).
Motif detection
The motif detection step aims at identifying motifs that are
statistically over-represented in the reduced set of ortholo-
gous intergenic sequences. To this end, we extended a previ-
ously developed Gibbs sampling based motif detection
approach, MotifSampler [37-39] (see Materials and meth-
ods). The adapted implementation allows the user to choose
a core sequence. A potential motif is only retained when it
Genome Biology 2005, Volume 6, Issue 13, Article R113 Van Hellemont et al. R113.3
comment reviews reports refereed researchdeposited research interactions information
Genome Biology 2005, 6:R113
occurs in this core sequence. Indeed, the input data for motif
detection consists of a set of (mammalian) subsequences and
a complete Fugu intergenic sequence. This Fugu sequence
shows a relatively low overall percent of identity with the
other sequences. Due to the high sequence conservation
(strong data dependence) between the mammalian subse-
quences, the original implementation of MotifSampler is not
appropriate for detecting motifs in the most divergent
sequence: the cost function (log likelihood score) that is opti-
mized in the original MotifSampler offers a trade-off between
the degree of conservation of the motif and the number of
occurrences of the motif [45]. This results in the detection of
motifs that are highly conserved between the highly similar
(mammalian) sequences but that show little or no conserva-
tion with the Fugu intergenic sequence. Therefore, to ensure
the detection of motifs conserved among all sequences, we
introduced the concept of a core sequence. By selecting the
most divergent ortholog (the Fugu sequence) as the core
sequence, the algorithm is forced to only detect motifs that
are also present in the most distantly related organism.
The adapted implementation was also redesigned to search
for long conserved blocks instead of searching for short con-
served motifs only. In datasets consisting of orthologs, not
only the motif itself is conserved but also the local context of
the motif [21,45]. For this reason, we designed BlockSampler
to extend motifs and search for the longest conserved blocks.
A motif is thus used as a seed to generate ungapped multiple
local alignments. Looking for longer motifs/blocks also
increases the specificity of motif detection (less false posi-
tives). Finally, since it was previously shown that choosing a
background model increases the performance of motif detec-
tion [37], we adapted the algorithm such that it uses for each
ortholog in the dataset an organism-specific background
model.
Results of developed methodology on benchmark
datasets
To evaluate its performance, we applied our two-step motif
detection procedure to several benchmark datasets. Since we
were primarily interested in detecting regulatory motifs over
large evolutionary distances, that is, conserved between Fugu
and mammalian genomes, we compiled sets of evolutionarily
divergent vertebrate orthologs that had been described to
contain conserved motifs.
In vertebrate organisms, large conserved regions tend to be
associated with genes encoding regulators of development
[20,21]. Since our strategy aims at detecting such conserved
blocks, we tested the methodology on three sets of ortholo-
gous genes that function in the regulation of development,
containing motifs described in the literature: hoxb2 [46],
pax6 [47] and scl [48]. We also included in the analysis one
gene, cfos, not related to developmental processes [26].
All the benchmark sets consisted of orthologous genes that
contain evolutionarily retained motifs described in the litera-
ture that have, to a large extent, been experimentally verified.
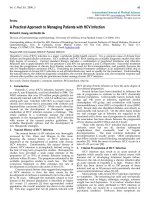
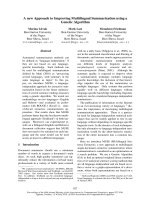
Schematic representation of the two-step procedure for phylogenetic footprintingFigure 1
Schematic representation of the two-step procedure for phylogenetic footprinting. In the data reduction step, regions conserved among closely related
(mammalian) orthologs are selected. Subsequently, these strongly conserved sequences are combined with a more distant ortholog (for example, Fugu);
this set of genes is then subjected to motif detection. Finally, significantly conserved blocks are identified using a threshold defined by a random analysis.
Data reduction Motif detection
Random analysis
Significant motifs
Fugu rubripes
Homo sapiens
Mus musculus
Rattus norvegicus
Pan troglodytes
R113.4 Genome Biology 2005, Volume 6, Issue 13, Article R113 Van Hellemont et al. />Genome Biology 2005, 6:R113
These known motifs were used to evaluate the performance of
our approach and to compare it to other algorithms.
Additionally, we monitored whether our procedure was capa-
ble of detecting as yet unknown motifs.
Using the two-step procedure we detected 8 significant blocks
for hoxb2, 13 for pax6, 1 for scl and none for the cfos dataset
(Table 1). The consensus scores of each of these 22 blocks are
given in Tables 2, 3, 4 for each benchmark dataset, respec-
tively. The location of these blocks on the complete intergenic
region of the respective Fugu orthologs is shown in Figure 2;
alignments can be found in [44].
As a first validation step, we compared our results with the
alignments and conserved regions identified by well-estab-
lished genome browsers, namely the UCSC genome browser
[49] and the UCR browser [20] (Table 1).
The UCSC genome browser [50] enables access to current
genome assemblies; it offers visualizations of several genomic
features, such as cross-species homologies [49,51]. The latter
can be viewed as multiple alignments over several species,
ranging from closely related mammals to more distantly
related species, such as chicken, zebrafish and pufferfish. The
multiple alignments were generated with MULTIZ [52]. Of
the conserved 22 blocks we identified by aligning intergenic
regions of mammals and Fugu, 16 could also be retrieved
from the USCS genome browser (Table 1); these are indicated
in Tables 2, 3, 4. The remaining six blocks could only be iden-
tified using our two-step approach.
The set up of the UCR browser [53] is slightly different from
the UCSC browser in that it focuses on the detection of ultra-
conserved regions (UCRs) only, that is, regions conserved
between human, mouse and Fugu. These regions were identi-
fied using sequence alignment strategies (BLAT) applied to
complete genome sequences without prior data reduction
[20,54]. Although our strategy also identifies regions highly
conserved among the species under study, no overlap was
detected between our conserved blocks and the UCRs (Table
1); that is, in the regions we studied (up to 40 kb intergenic
plus 5' untranslated region), no UCRs were located according
to the analysis of Sandelin et al. [20]. The regions the UCR
browser identified as ultra-conserved were located much
more upstream of the gene compared to the regions we used
for our analysis.
To further validate the detected blocks, we tested whether
they contain the motifs that were originally reported by Sce-
mama et al. [46], Kammandel et al. [47] and Göttgens et al.
[48] for hoxb2, pax6 and scl, respectively (no significant
blocks were detected for cfos). The previously described
motifs present in the respective blocks are listed in Tables 2,
3, 4 (marked with an asterisk). Of the 17 motifs reported by
Scemama et al. [46], 8 were present in the significant hoxb2-
blocks (Table 2). Five other motifs were present in non-signif-
icant blocks. The latter are blocks with scores that fell below
the threshold we chose based on the random analysis (see
Materials and methods). The four remaining motifs could not
be recovered. All motifs described by Kammandel et al. [47]
as conserved among mammalian and Fugu pax6 intergenic
regions were recovered by our methodology (Table 3). The
conserved block detected in the scl dataset contains three of
the five motifs previously identified by Göttgens et al. [48]
(Table 4); a fourth motif was picked up in a non-significant
block. One motif was not detected in any of the blocks.
Besides these blocks containing known motifs, we identified
several blocks (three for hoxb2 and eight for pax6) that corre-
spond to conserved regions not previously described in the
literature. To validate these blocks, we checked whether they
were enriched for yet undescribed regulatory motifs. Hence,
we screened all blocks with the Transfac database of verte-
brate transcription factor binding sites [55]. The result of this
screening is summarized in Tables 2, 3, 4. As expected
[41,56], the conserved blocks we identified contain many
potential binding sites; remarkably they tend to be specifi-
cally enriched for homeodomain binding sites (in blocks
hoxb2 1.1, hoxb2 2.1, hoxb2 2.3, hoxb2 2.4, pax6 1.1, pax6 1.4,
pax6 3.1, pax6 3.3 and scl 1.1, homeodomain binding sites
were significantly over-represented, with a p value < 10
-8
).
For a more detailed description of both the previously
described and the new potential regulatory motifs present in
the detected blocks, please refer to the Supplementary web-
site [44].
Besides these well-described benchmark datasets, we applied
our method to six additional datasets, differing in composi-
tion from the benchmark datasets. They all contained a com-
bination of four mammalian sequences (rat, mouse, human,
chimp or dog) to be used in the data reduction step and an
additional set of sequences originating from more distantly
related orthologs (chicken, Fugu, Tetraodon nigroviridis and
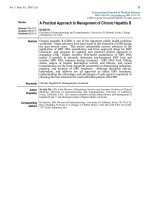
Localization of clusters and conserved blocks in the (a) hoxb2, (b) pax6 and (c) scl datasetsFigure 2 (see following page)
Localization of clusters and conserved blocks in the (a) hoxb2, (b)pax6 and (c)scl datasets. For each dataset, the different orthologous intergenic
sequences are shown: Rn,Rattus norvegicus; Mm, Mus musculus; Pt, Pan troglotydes; Hs, Homo sapiens; Fr, Fugu rubripes. Clusters of conserved mammalian
subsequences that were subjected to motif detection (that is, clusters containing at least one subsequence per mammalian organism) are represented on
the respective mammalian sequences (cluster 1 in red, cluster 2 in blue and cluster 3 in green). The conserved blocks identified using BlockSampler are
represented on the Fugu intergenic sequence (in the color of the mammalian cluster it is located in). For each block the localization relative to the start of
the Fugu gene is given. The transcription start sites are marked with an inverse triangle.
Genome Biology 2005, Volume 6, Issue 13, Article R113 Van Hellemont et al. R113.5
comment reviews reports refereed researchdeposited research interactions information
Genome Biology 2005, 6:R113
Figure 2 (see legend on previous page)
(
c) scl
(
b) pax6
(
a) hoxb2
Pax6 1.2
-11107-11039
Pax6 1.1
-10783-10667
Pax6 1.3
-10707-10641
Pax6 1.6
-10715-10618
Pax6 2.2
-14497-14467
Pax6 3.1
-13576-13511
Pax6 2.3
-12711-12687
Pax6 2.1
-12603-12558
Pax6 2.4
-2851-2814
Pax6 1.4
-11016-10976
Hs
Pt
Mm
Rn
Pax6 1.5
-10655-10636
Pax6 3.3
-13518-13473
Pax6 3.2
-13871-13818
1kb
Hoxb2 2.1
-4217 4192
Hoxb2 2.2
-4003 3977
Hoxb2 2.3
-4112 4072
Hoxb2 2.4
-4100 4047
Hoxb2 2.5
-16425 16391
Hoxb2 3.1
-338 282
Hoxb2 3.2
-309 271
Fr
Hs
Pt
Mm
Rn
Hoxb2 1.1
-9821 9762
1kb
Fr
Hs
Pt
Mm
Rn
Scl 1.1
-1593-1548
1kb
R113.6 Genome Biology 2005, Volume 6, Issue 13, Article R113 Van Hellemont et al. />Genome Biology 2005, 6:R113
zebrafish in different combinations) added in the motif detec-
tion step. Four of the six additional datasets were derived
from genes functioning in developmental regulation, includ-
ing three homeobox genes (GSH1, Meis2, HOXB5) and one
encoding the zinc finger protein EGR3. Besides these regula-
tors involved in development, two genes, PCDH8 and HIV-
EP1, were included, which are, according to our knowledge,
unrelated to development. PCDH8 is believed to function as a
calcium-dependent cell-adhesion protein and HIV-EP1 binds
to enhancer elements present in several viral promoters and
in a number of cellular promoters such as those of the class I
MHC, interleukin-2 receptor, and interferon-beta genes. In
the additional datasets involved in development, we detected
several strongly conserved blocks: GSH1 contained four
blocks that are conserved among human, chimp, mouse, rat
and pufferfish (Fugu and Tetraodon); in Meis2, two blocks
were recovered that are retained in all organisms under study
except for Fugu; and in HOXB5, six strongly conserved blocks
were detected in mammals and pufferfish, while the motif
seems to have been lost in chicken. In EGR3, two blocks were
found conserved in mammals and fish. In the non-develop-
mental related datasets, only in PCDH8 was one large block
detected, conserved in human, chimp, mouse, rat, chicken,
Tetraodon and Fugu, but not in zebrafish. This shows that
conserved regions might also exist in genes not involved in
development, although a possible involvement of this addi-
tional gene in developmental processes cannot be ruled out.
Detailed results of these analyses can be found in Additional
data file 1 and in [44]. Because the motifs in these additional
datasets have not been studied as extensively as those of the
benchmark datasets, we cannot guarantee all detected blocks
are biologically functional.
Evaluation of the developed procedure
To compare the performance of our newly developed two-step
strategy to that of other frequently used algorithms, we eval-
uated to what extent MotifSampler [39], MAVID [10] and
'Threaded Blockset Aligner' (TBA) [52] could recover known
motifs in our benchmark sets.
First, we studied the performance of the alignment algo-
rithms MAVID and TBA in detecting conserved regions
within our four benchmark datasets. Since MAVID and TBA
were originally developed to perform multiple alignments on
long sequences, we applied these algorithms to the initial full-
length benchmark datasets, that is, the complete mammalian
and Fugu intergenics. We evaluated to what extent motifs or
conserved regions described in original articles were correctly
aligned using either MAVID or TBA. The results are summa-
rized in Table 5 (MAVID and TBA columns) and in [44].
MAVID alignment of all three cfos datasets (mammalian
orthologs combined with each of the three Fugu paralogs)
could not recover either of the two motifs previously
described by Blanchette and Tompa [26] (Table 5). This is in
line with our results showing the overall low homology
between the cfos mammalian and Fugu orthologs. The
MAVID alignment of most of the hoxb2 blocks containing
previously described motifs shows that a conserved region in
the mammalian intergenic sequences is broken up into small
conserved parts interrupted by gaps when aligned to the
longer Fugu sequence, resulting in an incorrect alignment of
the regulatory motifs: previously reported motifs were not
recovered in the MAVID alignment (Table 5). Our method
performs better because the most heterogeneous sequence is
only aligned in a second step, using a highly flexible local
alignment procedure (BlockSampler). Regarding pax6, most
of the blocks containing previously described motifs were cor-
rectly aligned by MAVID and all the motifs described by Kam-
mandel et al. [47] could be correctly retrieved over all the
orthologs under study (Table 5). This dataset is probably rel-
atively well suited for MAVID because the mammalian
sequences are only twice as large as the pufferfish pax6 inter-
genic region (Table 6). Although the lengths of the intergenic
regions in the scl dataset (Table 6) are in the same order of
magnitude (ranging from 16.5 to 40 kb), MAVID did not
succeed in identifying any of the motifs previously described
by Göttgens et al. [48] (Figure 3, Table 5).
Although TBA has been shown to outperform MAVID in
aligning more divergent sequences [52], applying this align-
ment tool to the benchmark datasets generated similar
results as MAVID: all known pax6-regulating motifs were
detected, while motifs present in the other benchmark data-
sets were not recovered (Table 5, TBA column).
Besides detecting the blocks with previously described motifs,
our two-step methodology also discovered blocks (block pax6
Table 1
Conserved blocks detected in benchmark datasets
Gene Number of blocks
Two-step UCSC UCR
cfos 000
hoxb2 850
pax6 13 11 0
scl 100
Total 22 16 0
Number of blocks two-step: number of conserved blocks identified
using the two-step procedure. For more details on the blocks see
Tables 2 (hoxb2), 3 (pax6) and 4 (scl). Number of blocks UCSC: the
number of blocks detected by the two-step procedure that were
recovered in the USCS genome browser (aligned between mammals
and Fugu) [51]. Number of blocks UCR: the number of blocks detected
by the two-step procedure that correspond to an ultra-conserved
region [20].
Genome Biology 2005, Volume 6, Issue 13, Article R113 Van Hellemont et al. R113.7
comment reviews reports refereed researchdeposited research interactions information
Genome Biology 2005, 6:R113
Table 2
List of the significant blocks detected in the hoxb2 dataset
Block Consensus sequence and possible binding sites
Hoxb2 1.1 (-) AATTCTTTGATGCAATCGGAGGGAGCTGTCAGGGGGCTAAGATTGATCGCCTCATsTCCT
*Meis (CTGTCA), CTGTCA: 26-31 +
*Hox/Pbx, AGATTGATCG: 40-49 +
Cap, M00253, NCANHNNN: 39-46 - (0.937); 22-29 - (0.918)
CDP CR1, M00104, NATCGATCGS: 41-50 + (0.964)
CDP CR3+HD, M00106, NATYGATSSS: 41-50 + (0.992)
CdxA, M00101, AWTWMTR: 1-7 + (0.919); 6-12 + (0.903)
HSF2, M00147, NGAANNWTCK: 40-49 + (0.925)
MEIS1, M00419, NNNTGACAGNNN: 23-34 - (0.951)
TGIF, M00418, AGCTGTCANNA: 24-34 + (0.966)
Pbx1, M00096, ANCAATCAW: 39-47 - (0.909)
Hoxb2 2.1 (-) TTGCACTTrGAGTTTACATTTTAATG
*Octamer-motif (ATTTgCAT), GTTTACAT: 12-19 +
*Adhf-2a (TGCACTgAGA), TGCACTTrGA: 2-11 +
CdxA, M00101, AWTWMTR: 20-26 + (0.978); 19-25 - (0.905); 17-23 - (0.927)
SRY, M00148, AAACWAM: 14-20 - (0.905)
Hoxb2 2.2 (UCSC) AAAAnTGTACTTTTTTAGTATTTACyT
*HoxA5 (TTTAaTAaTTA), TTTAGTATTTA: 14-24 +
CdxA, M00101, AWTWMTR: 16-22 - (0.979)
SRY, M00148, AAACWAM: 7-13 - (0.928)
Hoxb2 2.3 (UCSC) GTGTGTTCTAGTGAACATTTTCATATATATTTATTGGTTAT
*Glucocorticoid receptor, AGTGAACA: 10-17 +
*CCAAT BOX, ATTGGTT: 27-33 +
Cap, M00253, NCANHNNN: 15-22 + (0.919); 21-28 + (0.906); 7-14 - (0.919)
CdxA, M00101, AWTWMTR: 23-29 + (0.958); 29-35 + (0.940); 28-34 - (0.956); 26-32 - (0.951); 24-30 - (0.958); 22-28 -
(0.960)
FOXJ2, M00422, NNNWAAAYAAAYANNNNN: 23-40 - (0.932)
HFH-3, M00289, KNNTRTTTRTTTA: 25-37 + (0.908)
NF-Y, M00185, TRRCCAATSRN: 30-40 - (0.914)
Oct-1, M00162, CWNAWTKWSATRYN: 14-27 + (0.913)
Pbx-1, M00096, ANCAATCAW: 30-38 - (0.948)
Hoxb2 2.4 (UCSC) GTGAACATTTTCATATATATTTATTGGTTATAGCCTGTTAAAATATTTTCTTTT
*GATA 1, TTATAGCC: 28-35 +
*CCAAT BOX, ATTGGTT: 23-29 +
Cap, M00253, NCANHNNN: 5-12 + (0.919); 11-18 + (0.906)
CCAAT box, M00254, NNNRRCCAATSA: 21-32 - (0.940)
CdxA, M00101, AWTWMTR: 13-19 + (0.958); 19-25 + (0.940); 39-45 + (0.925); 46-52 + (0.901); 36-42 - (0.930); 18-24 -
(0.957); 16-22 - (0.951); 14-20 - (0.958); 12-18 - (0.960)
FOXD3, M00130, NAWTGTTTRTTT: 41-52 + (0.924)
FOXJ2, M00422, NNNWAAAYAAAYANNNNN: 13-30 - (0.932)
HFH-3, M00289, KNNTRTTTRTTTA: 15-27 + (0.908)
HNF-3beta, M00131, KGNANTRTTTRYTTW: 39-53 + (0.920)
NF-Y, M00185, TRRCCAATSRN: 20-30 - (0.914)
Oct-1, M00162, CWNAWTKWSATRYN: 4-17 + (0.913)
Pbx-1, M00096, ANCAATCAW: 20-28 - (0.948)
R113.8 Genome Biology 2005, Volume 6, Issue 13, Article R113 Van Hellemont et al. />Genome Biology 2005, 6:R113
2.4, for instance) that could not be recovered when aligning
the intergenic sequences with MAVID or TBA [44,57].
Overall, based on our benchmark analysis, the two-step
method performs better than MAVID or TBA in identifying
conserved blocks in distantly related orthologs: the proposed
method is able to recover in our benchmark sets all the known
motifs identified by MAVID and TBA but, in addition, finds
several previously described motifs ignored by these
algorithms (Table 5, two-step BS, MAVID and TBA columns).
Using the two-step procedure, first selecting strongly con-
served orthologous sequences, clearly facilitates alignment
with the more divergent (lower overall similarity) sequence.
We also tested the performance of MotifSampler as an exam-
ple of a probabilistic motif detection procedure on the unre-
duced dataset. In this case, only one previously described
motif was detected (Table 5, MS column). This was to be
expected as in unreduced datasets the signal to noise ratio is
too high for standard motif detection procedures to give reli-
able and interpretable results.
Our two-step procedure includes two adaptations over previ-
ous existing methods: first, it allows for a data reduction step;
and secondly, we developed a motif detection procedure spe-
cifically adapted to the purpose of detecting large conserved
blocks (BlockSampler). To assess the relative contribution of
each of these adaptations to the overall result, we set up the
following experiment: to study the specific influence of the
data reduction step, we compared the results of applying
BlockSampler to both the unreduced benchmark datasets and
the datasets obtained after data reduction. Table 5 (BS and
two-step BS columns) shows the results of this comparison.
Overall, the results seem comparable: application of Block-
Sampler to the complete intergenic sequences results in
recovery of 15 of the 30 previously reported motifs (in all four
datasets), while the two-step method identified 17. Thus, at
first sight, there does not seem to be a major contribution
from the data reduction step. A closer look at Table 5, how-
ever, shows that the positive contribution of the data reduc-
tion (increasing the signal-to-noise ratio) is strongly
dependent on the lengths of the intergenic sequences to be
aligned. A major positive effect is observed for the large pax6
and scl datasets, whereas for the hoxb2 set, in which the
sequences under study are rather short, the data reduction
does not offer a clear advantage. To assess the specific
improvements of using BlockSampler instead of standard
motif detection approaches, we compared the results of
BlockSampler to those of MotifSampler when both were
applied to the reduced datasets. A reduced dataset thus con-
sists of a subcluster of mammalian sequences (Figure 4) and
a complete Fugu ortholog. The performance of MotifSampler
was far below that of BlockSampler: MotifSampler only
detected two previously described motifs (Table 5, two-step
MS column), both in the hoxb2 set, while BlockSampler
recovered 17 previously described motifs (Table 5, two-step
SRY, M00148, AAACWAM: 47-53 - (0.961)
Hoxb2 2.5 (UCSC) AATTCyCTCTTGGAACTTTCTTTGTTCTTCmGTAG
HSF1, M00146, AGAANRTTCN: 12-21 + (0.915); 12-21 - (0.930)
HSF2, M00147, NGAANNWTCK: 12-21 + (0.948); 12-21 - (0.930)
SRY, M00148, AAACWAM: 17-23 - (0.961)
Hoxb2 3.1 (UCSC) GGCCnAGACnAGCGATTGGCGGAGrCCGGTCCCGTGACCAnGAATTCCCTGyAATTT
NF-Y, M00185, TRRCCAATSRN: 12-22 - (0.915)
USF, M00187, CYCACGTGNC: 29-38 - (0.957)
USF, M00217, NCACGTGN: 30-37 + (0.902)
Hoxb2 3.2 (-) TCCCGTGACCAnGAATTCCCTGyAATTTCGnyGGAGTCC
USF, M00217, NCACGTGN: 1-8 + (0.902)
For each block, the consensus sequence is given followed by the possible binding sites situated in this block: motifs previously described in the
literature [46] are marked with an asterisk. The motifs are summarized by their motif name (in bold), by their consensus sequence, if known, as
described in the original article, by the sequence of the motif instance in our search, by the positions of the motif instance relative to the consensus
sequence of the entire block and by the strand (indicated by a '+' or a '-') on which the motif occurred. Motif hits derived by Transfac are indicated
by their matrix accession number, the consensus of this binding site and the instances of this motif in our search. These are further characterized by
their positions relative to the consensus sequence of the entire block, by the strand on which the motif occurred and by the corresponding
MotifLocator score (in parentheses). The blocks identified by the UCSC genome browser as conserved between mammals and Fugu are marked with
'UCSC', while the blocks detected by our two-step methodology but not present in the UCSC genome browser are indicated with a '-'.
Table 2 (Continued)
List of the significant blocks detected in the hoxb2 dataset
Genome Biology 2005, Volume 6, Issue 13, Article R113 Van Hellemont et al. R113.9
comment reviews reports refereed researchdeposited research interactions information
Genome Biology 2005, 6:R113
Table 3
List of the significant blocks detected in the pax6 dataset
Block Consensus sequence and possible binding sites
pax6 1.1 (UCSC) CTTAATGATGAGAGATCTTTCCGCTCATTGCCCATTCAAATACAATTGTAGATCGAAGCCGGCCTT
GTCAsGTTGAGAAAAAGTGAATTTCTAACATCCAGGACGTGCCTGTCTACT
*Minimal fragment for expression in lens and cornea as described in [46]: 11-117 +
Cap, M00253, NCANHNNN: 25-32 + (0.940); 79-86 - (0.964); 4-11 - (0.946); 1-8 - (0.903)
CCAAT box, M00254, NNNRRCCAATSA: 27-38 + (0.901)
*CdxA, M00100, 'MTTTATR': 1-7 + (0.921)*; 87-93 + (0.913)
*CdxA, M00101, AWTWMTR: 1-7 + (0.934); 4-10 + (0.921); 38-44 + (0.905), 87-93 + (0.988)
c-Ets-1(p54), M00032, NCMGGAWGYN: 98-107 + (0.906)
c-Ets-1(p54), M00074, NNACMGGAWRTNN: 92-104 - (0.901)
En-1, M00396, GTANTNN: 37-43 - (0.967)
GATA-3, M00351, ANAGATMWWA: 11-20 + (0.920)
HSF2, M00147, NGAANNWTCK: 13-22 - (0.933)
p53, M00272, NGRCWTGYCY: 101-110 + (0.949)
pax6 1.2 (UCSC) CATTATTGTTGCCAGCACGAAGCATCACAATCAATCATAAGGAAGTCCAGTTGGCAGGTGTCAAT
CTTG
CdxA, M00101, AWTWMTR: 1-7 - (0.995)
Cap, M00253, NCANHNNN: 25-32 + (0.934); 31-38 + (0.903); 35-42 + (0.903); 47-54 + (0.908); 61-68 + (0.937)
CDP CR3+HD, M00106, NATYGATSSS: 27-36 - (0.907)
c-Ets-1(p54), M00074, NNACMGGAWRTNN: 36-48 + (0.902)
*HOXA3, M00395, CNTANNNKN: 1-9 + (0.905)
MyoD, M00184, NNCACCTGNY: 53-62 - (0.956)
*Pbx-1, M00096, ANCAATCAW: 30-38 + (0.986); 2-10 - (0.923)
Sox-5, M00042, NNAACAATNN: 3-12 - (0.932)
SRY, M00148, AAACWAM: 33-39 + (0.910)
USF, M00122, NNRNCACGTGNYNN: 51-64 + (0.913); 51-64 - (0.908)
pax6 1.3 (UCSC) GAAAAAGTGAATTTCTAACATCCAGGACGTGCCTGTCTACTTTCAGwGAATTGCATCCAATCACCC
C
Cap, M00253, NCANHNNN: 3-10 - 0.964
CCAAT box, M00254, NNNRRCCAATSA: 52-63 + (0.949)
CdxA, M00100, 'MTTTATR': 11-17 + (0.913)
CdxA, M00101, AWTWMTR: 11-17 + (0.988)
c-Ets-1(p54), M00032, NCMGGAWGYN: 22-31 + (0.906)
c-Ets-1(p54), M00074, NNACMGGAWRTNN:16-28 - (0.901)
En-1, M00396, GTANTNN: 58-64 - (0.948)
GATA-1, M00075, SNNGATNNNN: 56-65 - (0.930)
GATA-3, M00077, NNGATARNG: 56-64 - (0.917)
NF-Y, M00185, TRRCCAATSRN: 54-64 + (0.910)
p53, M00272, NGRCWTGYCY: 25-34 + (0.949)
SRY, M00148, AAACWAM: 59-65 + (0.917)
pax6 1.4 (UCSC) GTCTATATTTAATCCAATTATAAGGGTCACGGAGTAAGTGC
*Motif containing homeoboxes described in [46], TTTAATCCAATTATAA: 8-23 +
Cap, M00253, NCANHNNN: 34-41 - (0.904)
CdxA, M00100, 'MTTTATR': 16-22 + (0.907)
CdxA, M00101, AWTWMTR: 16-22 + (0.995); 16-22 - (0.906); 6-12 - (0.931); 4-10 - (0.951)
En-1, M00396, GTANTNN: 15-21 - (0.948)
Nkx2-5, M00240, TYAAGTG: 34-40 + (0.927)
R113.10 Genome Biology 2005, Volume 6, Issue 13, Article R113 Van Hellemont et al. />Genome Biology 2005, 6:R113
RORalpha1, M00156, NWAWNNAGGTCAN: 18-30 + (0.919)
TCF11, M00285, GTCATNNWNNNNN: 26-38 + (0.906)
pax6 1.5 (UCSC) GCATCCAATCACCCCCAGGG
Cap, M00253, NCANHNNN: 9-16 + (0.965)
En-1, M00396, GTANTNN: 6-12 - (0.948)
GATA-3, M00077, NNGATARNG: 4-12 - (0.917)
SRY, M00148, AAACWAM: 7-13 + (0.917)
pax6 1.6 (UCSC) CAsGTTGAGAAAAAGTGAATTTCTAACATCCAGGACGTGCCTGTCTACTTTCAGw
GAATTGCATCCAATCACCCCCAGGGAATTCnGCTAATGTCTCC
*Homeobox-binding site described in [46], GCTAATGTCTC: 87-97 +
Cap, M00253, NCANHNNN: 69-76 + (0.965); 87-94 - (0.903); 11-18 - (0.964)
CCAAT box, M00254, NNNRRCCAATSA: 60-71 + (0.949)
CdxA, M00100, 'MTTTATR': 19-25 + (0.913)
CdxA, M00101, AWTWMTR: 19-25 + (0.988)
c-Ets-1(p54), M00032, NCMGGAWGYN: 30-39 + (0.906)
c-Ets-1(p54), M00074, NNACMGGAWRTNN: 24-36 - (0.901)
En-1, M00396, GTANTNN: 66-72 - (0.948)
GATA-1, M00075, SNNGATNNNN: 64-73 - (0.930)
GATA-3, M00077, NNGATARNG: 64-72 - (0.917)
NF-Y, M00185, TRRCCAATSRN: 62-72 + (0.910)
p53, M00272, NGRCWTGYCY: 33-42 + (0.949)
SRY, M00148, AAACWAM: 67-73 + (0.917)
pax6 2.1 (UCSC) TGGGTCCATTTTCCAGAyGGTTTGTTACTCTTGCTGCmTGATTTrG
Cap, M00253, NCANHNNN: 6-13 + (0.921)
CdxA, M00101, AWTWMTR: 9-15 + (0.918)
SRY, M00148, AAACWAM: 21-27 - (0.942)
pax6 2.2 (-) ATTTTGGTTGCTTTCAGGTwTAATTAACTTT
Nkx2-5, M00241, CWTAATTG: 21-28 - (0.902)
pax6 2.3 (UCSC) ATTGTAATCATTTCAATTATCTTCA
Cap, M00253, NCANHNNN: 8-15 + (0.927)
En-1, M00396, GTANTNN: 14-20 - (0.948)
Nkx2-5, M00241, CWTAATTG: 14-21 - (0.930)
pax6 2.4 (-) GGTTGCTTTCAGGTwTAATTAACTTTGAACAACAAATA
Nkx2-5, M00241, CWTAATTG: 16-23 - (0.902)
pax6 3.1 (UCSC) TTGTAATTACTGCCCTTCATGTGGTCCGGTGCCTTGAACCATCTTTAATTAAAAGCATAATTAAGG
AML-1a, M00271, TGTGGT: 20-25 + (1.000)
Cap, M00253, NCANHNNN: 39-46 + (0.910); 55-62 + (0.909); 6-13 - (0.916)
CdxA, M00100, MTTTATR: 56-62 - (0.934)
CdxA, M00101, AWTWMTR: 6-12 + (0.988); 44-50 + (0.913); 47-53 + (0.900); 48-54 + (0.905); 59-65 + (0.903); 60-66 +
(0.926); 56-62 - (0.998); 47-53 - (0.913); 44-50 - (0.901); 43-49 - (0.907); 2-8 - (0.949);
En-1, M00396, GTANTNN: 3-9 + (0.912); 4-10 - (0.912)
HSF2 , M00147, NGAANNWTCK: 35-44 + (0.908)
Nkx2-5, M00241, CWTAATTG: 56-63 + (0.935), 58-65 - (0.954)
USF, M00217, NCACGTGN: 17-24 - (0.921)
Table 3 (Continued)
List of the significant blocks detected in the pax6 dataset
Genome Biology 2005, Volume 6, Issue 13, Article R113 Van Hellemont et al. R113.11
comment reviews reports refereed researchdeposited research interactions information
Genome Biology 2005, 6:R113
BS column). Moreover, because MotifSampler searches for
short motifs (default eight nucleotides (nt)), it detects many
false positive hits. These results show that independent of the
data reduction step, BlockSampler is clearly more suited for
detecting large conserved blocks than MotifSampler.
Discussion
We developed a two-step methodology to search for regions
(motifs) conserved over different phylogenetic lineages in
long intergenic sequences of heterogeneous size. In a first
step, an alignment method is used to select conserved
subsequences in intergenic orthologous sequences of compa-
rable size of closely related vertebrate genomes, since these
are expected to be enriched for regulatory motifs [21,41]. The
combination of this preselected dataset of conserved
sequences and the full-length intergenic sequence of a more
distant ortholog, which is more likely to differ in size and
overall homology, is subjected to probabilistic motif detec-
tion. The preselection step facilitates motif detection by
enhancing the signal-to-noise ratio in the dataset. For the sec-
ond motif detection step we used an extension of a Gibbs sam-
pling based algorithm [39] with a higher performance in
detecting large conserved blocks within a set of orthologous
sequences. Using the strategy mentioned above, we could
combine the advantages of alignment methods, which have
been shown to be very suitable for aligning long, highly con-
served intergenic sequences, and the probabilistic algorithms
for motif detection that usually are more appropriate when
looking for smaller regions of conservation (lower degree of
similarity).
We applied this two-step methodology to four well-studied
datasets for which functional phylogenetically conserved
motifs had been extensively described. Our approach identi-
fied most of the previously described motifs. In addition, we
detected several blocks not previously described in the litera-
ture or not present in any of the two genome browsers (UCSC
pax6 3.2 (UCSC) AAGGCTTGCAGCTGCCTCCAAATCAATAGAyGTCAAAGAAATATGAAAACArTC
CdxA, M00101, AWTWMTR: 39-45 + (0.953); 36-42 - (0.925)
SRY, M00148, AAACWAM: 35-41 + (0.961)
Cap, M00253, NCANHNNN: 8-15 + (0.931); 39-46 - (0.940); 8-15 - (0.931)
AP-4, M00175, VDCAGCTGNN: 7-16 - (0.902)
MyoD, M00184, NNCACCTGNY: 7-16 + (0.957)
SRY, M00160, NWWAACAAWANN: 19-30 + (0.928)
pax6 3.3 (UCSC) GCATAATTAAGGGAAGATCTAAAGAAAGACAATTACCAGATGGTCT
Cap, M00253, NCANHNNN: 1-8 + (0.909)
CdxA, M00100, MTTTATR: 2-8 - (0.934)
CdxA, M00101, AWTWMTR: 5-11 + (0.903); 6-12 + (0.926); 32-38 + (0.939); 2-8 - (0.998)
En-1, M00396, GTANTNN: 30-36 - (1.000)
GATA-1, M00075, SNNGATNNNN: 36-45 + (0.936)
GATA-2, M00076, NNNGATRNNN: 36-45 + (0.922)
GATA-3, M00351, ANAGATMWWA: 13-22 + (0.949)
HOXA3, M00395, CNTANNNKN: 29-37 - (0.939)
Msx-1, M00394, CNGTAWNTG: 30-38 - (0.915)
MyoD, M00184, NNCACCTGNY: 35-44 - (0.919)
Nkx2-5, M00241, CWTAATTG: 2-9 + (0.935); 4-11 - (0.954)
SRY, M00148, AAACWAM: 21-27 + (0.961); 25-31 + (0.927)
USF, M00122, NNRNCACGTGNYNN: 33-46 + (0.907); 33-46 - (0.904)
For each block, the consensus sequence is given followed by the possible binding sites situated in this block: motifs previously described in the
literature [47] are marked with an asterisk. The motifs are summarized by their motif name (in bold), by their consensus sequence, if known, as
described in the original article, by the sequence of the motif instance in our search, by the positions of the motif instance relative to the consensus
sequence of the entire block and by the strand (indicated by a '+' or a '-') on which the motif occurred. Motif hits derived by Transfac are indicated
by their matrix accession number, the consensus of this binding site and the instances of this motif in our search. These are further characterized by
their positions relative to the consensus sequence of the entire block, by the strand on which the motif occurred and by the corresponding
MotifLocator score (in parentheses). The blocks identified by the UCSC genome browser as conserved between mammals and Fugu are marked with
'UCSC', while the blocks detected by our two-step methodology but not present in the UCSC genome browser are indicated with a '-'.
Table 3 (Continued)
List of the significant blocks detected in the pax6 dataset
R113.12 Genome Biology 2005, Volume 6, Issue 13, Article R113 Van Hellemont et al. />Genome Biology 2005, 6:R113
and UCR) we compared our results with. Because highly con-
served blocks most probably consist of consecutive transcrip-
tion factor binding sites [21,41,56], we screened the
conserved blocks with the Transfac motif database [55].
These blocks contained abundant copies of homeodomain
binding sites. This is not unexpected since most of the genes
we were studying function in the regulation of development
[21,58]. These blocks most probably contain, besides the
motifs obtained with the Transfac screening, many more
motifs not yet annotated in Transfac. Alternatively, they
might have other, not yet characterized biological functions,
for example, transcripts of unknown function [59].
Some previously described motifs were missed, however,
because of the strong selection criteria we used: since regula-
tory elements tend to be grouped [21,41,56,60], we assumed
that the sequences surrounding a regulatory motif are also
conserved (due to the presence of other binding sites). Motifs
located in a variable context will probably go undetected.
Table 4
List of the significant blocks detected in the scl dataset
Block Consensus sequence and possible binding sites
scl 1.1 (-) TTGCCAAATTAAAATGAATCATTTGGCCCATAATGGCCGAGGCGCT
*Conserved sequence identified in [47], GCCAAAT: 3-9 +
*Putative SKN1 site reported in [47], AATGAATCATTT: 13-24 +
CdxA, M00100, 'MTTTATR': 29-35 - (0.917)
CdxA, M00101, AWTWMTR: 7-13 + (0.901); 8-14 + (0.905); 10-16 + (0.927); 29-35 + (0.927); 29-35 - (0.929); 7-13 - (0.913)
*En-1, M00396, GTANTNN: 30-36 + (0.936)
Cap, M00253, NCANHNNN: 19-26 + (0.932); 10-17 - (0.933)
Pbx-1, M00096, ANCAATCAW:14-22 + (0.941)
AP-1, M00199, NTGASTCAG: 14-22 + (0.913)
*HOXA3, M00395, CNTANNNKN: 29-37 + (0.927)
Tst-1, M00133, NNKGAATTAVAVTDN: 3-17 + (0.901)
For each block, the consensus sequence is given followed by the possible binding sites situated in this block: motifs previously described in the
literature [48] are marked with an asterisk. The motifs are summarized by their motif name (in bold), by their consensus sequence, if known, as
described in the original article, by the sequence of the motif instance in our search, by the positions of the motif instance relative to the consensus
sequence of the entire block and by the strand (indicated by a '+' or a '-') on which the motif occurred. Motif hits derived by Transfac are indicated
by their matrix accession number, the consensus of this binding site and the instances of this motif in our search. These are further characterized by
their positions relative to the consensus sequence of the entire block, by the strand on which the motif occurred and by the corresponding
MotifLocator score (in parentheses). The blocks identified by the UCSC genome browser as conserved between mammals and Fugu are marked with
'UCSC', while the blocks detected by our two-step methodology but not present in the UCSC genome browser are indicated with a '-'.
Table 5
Comparison of two-step procedure with other methodologies
Gene Number of motifs Two-step BS BS Two-step MS MS MAVID TBA
cfos 2000000
hoxb2 17 8 (+5) 13 2 1 0 0
pax6 661*0066
scl 53 (+1)10000
Total 30 17 (+6) 15 2 1 6 6
Number of motifs: the number of motifs reported by Blanchette and Tompa [26] in cfos, Scemama et al. [46] in hoxb2, Kammandel et al. [47] in pax6
and Göttgens et al. [48] in scl. Two-step BS: the number of previously described motifs detected by the two-step procedure, combining data
reduction and motif detection using BlockSampler. The numbers in parentheses are the number of motifs present in non-significant blocks. BS: the
number of previously described motifs detected by BlockSampler in initial full-length datasets. Two-step MS: the number of previously described
motifs detected by combining data reduction and motif detection using MotifSampler. MS: the number of previously described motifs detected by
MotifSampler in initial full-length datasets. MAVID: the number of previously described motifs detected (correctly aligned) by MAVID. TBA: the
number of previously described motifs detected by TBA. *Only part of a motif was detected.
Genome Biology 2005, Volume 6, Issue 13, Article R113 Van Hellemont et al. R113.13
comment reviews reports refereed researchdeposited research interactions information
Genome Biology 2005, 6:R113
By applying our method to additional datasets with configu-
rations different from the benchmark dataset we could dem-
onstrate that our methodology is more generally applicable.
Comparing the performance of the two-step procedure with
that of MAVID and TBA, as representatives of multiple align-
ment methods, and MotifSampler, as an example of a motif
Table 6
Base pair lengths of the intergenic sequences for each benchmark dataset
Gene Hs Mm Rn Pt Fr
cfos 40,154 33,157 40,132 40,154 3,606*
3,606
†
1,244
‡
hoxb2 4,973 6,744 7,640 4,878 39,219
pax6 40,102 40,000 40,000 40,000 21,204
scl 20,981 16,471 20,343 39,999 20,155
The Fugu cfos intergenic sequences are derived from *SINFRUG00000132418,
†
SINFRUG00000132419 and
‡
SINFRUG00000143787. The Ensemble
IDs (+ 1 Genebank accession number) are given in [56]. Fr,Fugu rubripes; Hs, Homo sapiens; Mm, Mus musculus; Pt, Pan troglotydes; Rn, Rattus norvegicus.
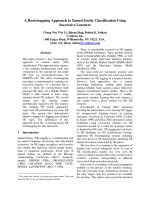
Comparison of two-step strategy with MAVID for the scl data set (a) Conserved block: alignment of the different scl orthologsFigure 3
Comparison of two-step strategy with MAVID for the scl data set (a) Conserved block: alignment of the different scl orthologs. The conserved block as
identified by BlockSampler - is marked with a boxed area. (b) Visualization of the MAVID alignment of the corresponding region. The dashed line denotes
a gap in the alignment. Rn, Rattus norvegicus; Mm, Mus musculus; Pt, Pan troglotydes; Hs, Homo sapiens; Fr, Fugu rubripes.
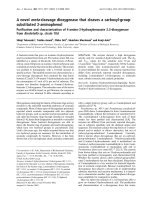
Schematic representation of subclusters, that is, clusters of conserved orthologous sequences that contain one region in each orthologFigure 4
Schematic representation of subclusters, that is, clusters of conserved orthologous sequences that contain one region in each ortholog. See text for
details. Rn, Rattus norvegicus; Mm, Mus musculus; Pt, Pan troglotydes; Hs, Homo sapiens.
scl 1.1
(a) (b)
Rn
TCCGGAGAAATTGCCAAATTAAAATGAATCATTTGGCCCATAATGGCCGAGGCGCTTATCGCGGA
M
m
TCCGGAGAAATTGCCAAATTAAAATGAATCATTTGGCCCATAATGGCCGAGGCGCTTATCGGGGG
Pt
TCTGGTGAAATTGCCAAATTAAAATGAATCATTTGGCCCATAATGGCCGAGGCGCTTATCGGGGG
Hs
TCCGGTGAAATTGCCAAATTAAAATGAATCATTTGGCCCATAATGGCCGAGGCGCTTATCGGGGG
Fr
TAGCCCACGACAGCCAAATAATAATGAATCATTTCATAAATAATGGGTTTAGGGGCTTATCGGGA
Rn
GTCCCCGCTCCCTCCGGAGAAATTGCCAAATTAAAATGAATCATTTGGCCCATAATGGCCGAGGCGCTTATCG
M
m
GTCCCCGCTCCCTCCGGAGAAATTGCCAAATTAAAATGAATCATTTGGCCCATAATGGCCGAGGCGCTTATCG
Pt
GTCCCCACTCCCTCTGGTGAAATTGCCAAATTAAAATGAATCATTTGGCCCATAATGGCCGAGGCGCTTATCG
Hs
GTCCCCACTCCCTCCGGTGAAATTGCCAAATTAAAATGAATCATTTGGCCCATAATGGCCGAGGCGCTTATCG
Fr
Hs
Mm
Rn
Pt
Hs
Mm
Rn
Pt
R113.14 Genome Biology 2005, Volume 6, Issue 13, Article R113 Van Hellemont et al. />Genome Biology 2005, 6:R113
detection method, showed that our approach outperformed
these alternative methods when the intergenic sequences
became either too long or too heterogeneous in size.
Additionally, we studied the marginal contribution of the data
reduction step and the improved method for motif detection
on the final performance of the two-step procedure: overall,
BlockSampler performed better than the related algorithm
MotifSampler, both on long sequences and on intergenic
regions reduced in size. The data reduction step seemed
essential when the length of the intergenic sequences to be
compared becomes excessive.
Although our two-step procedure has proven successful,
there is still room for improvement, for instance by taking
into account the phylogenetic relationships between the
sequences under study in the second motif detection step.
The contribution of finding a motif in an ortholog to the glo-
bal motif score could be weighted according to its phyloge-
netic distance from the other sequences in which the motif is
also present. Indeed, this way we would account for the spe-
cific composition of a dataset because closely related
orthologs are less informative than further related ones. If
one wanted to relax the assumption of conserved order of
motifs in the first data reduction step, it would suffice to
replace AVID in this step with a more local aligner such as
BLAT [54]. Also, our motif detection algorithm could be
extended for more advanced background models [61].
Conclusion
We developed a two-step approach that combines the advan-
tages of both motif detection and multiple alignment algo-
rithms. It has shown to be well suited for identifying
conserved regions in intergenic sequences from distantly
related orthologs that show a low overall homology and that
are heterogeneous in size. The strength of our approach lies in
the combination of data reduction and improved motif detec-
tion: the first data reduction step is essential when it concerns
long intergenic sequences. BlockSampler, the algorithm used
in the second motif detection step, has been shown to be opti-
mally suited to identify large conserved regions among
orthologous sequences. Applying our method to benchmark
sets showed that, although it recovered most of the motifs/
blocks previously described in these datasets, some were
missed due to the assumptions underlying our analysis and
the stringent selection criteria applied. These results indicate
that, given the chosen criteria, our method offers a fully auto-
mated analysis flow that is highly specific for detecting motifs
conserved over different vertebrate lineages in complete
intergenic sequences.
Materials and methods
Benchmark datasets
The benchmark datasets were generated as follows. First, a
set of orthologous genes was defined using the Ensembl
genome browser version 23 [62]. In this study, the bench-
mark datasets included genes from human (Homo sapiens),
mouse (Mus musculus), rat (Rattus norvegicus), chimp (Pan
troglodytes) and pufferfish (Fugu rubripes). Regarding the
cfos dataset, Ensembl identified three Fugu paralogs -
SINFRUG00000132418, SINFRUG00000132419 and
SINFRUG00000143787 - that were all included in the analy-
sis. The additional datasets EGR3, GSH1, HIV-EP1, HOXB5,
Meis2, PCDH8 contain multiple distantly related orthologs
(see [44]).
Subsequently, the intergenic regions of these orthologs were
selected using the Ensembl mart database release 21.1. The
region upstream of the transcription start (as defined by
Ensembl) was limited to 40 kb. Additionally, the 5' untrans-
lated region was included. Lengths of the respective intergen-
ics are given in Table 6; the benchmark datasets, cfos, hoxb2,
pax6 and scl can be found in [44]. The rat cfos ortholog
ENSRNOG00000008015, Fugu hoxb2 ortholog
SINFRUG00000136637, chimp pax6 ortholog
ENSPTRG00000003474, and scl chimp
ENSPTRG00000003474 contain long N-stretches, probably
as a result of incomplete preliminary annotation.
Remarkably, where Fugu is known to have a very compact
genome [23], the Fugu hoxb2 mentioned above is very long
compared to the mammalian hoxb2 intergenic sequences
(Table 6). This is probably due to the presence of a pseudog-
ene (SINFRUG00000157209) in the intergenic region of
SINFRUG00000136637 at circa 5.9 kb from the transcription
start site of hoxb2, which was not yet annotated in the release
version 23 of ENSEMBL.
All intergenic sequences were selected as described above,
except the intergenic sequence of the Fugu scl ortholog.
Because the putative scl ortholog annotated by ENSEMBL
(SINFRUG00000145588) did not contain motifs shown to be
present in the Fugu scl ortholog by Göttgens et al. [48], we
used the Genbank Fugu scl sequence [Genbank: AJ131019
].
This sequence (referring to a cosmid sequence of circa 33 kb)
was also used in the original study of Barton et al. [63]. To
delineate the intergenic region of scl, we aligned the coding
sequence from the scl homolog SINFRUG00000145588 with
the AJ131019 sequence using 'blast 2 sequences' [64]. The
coding region was located from positions 20,156 to 22,165; we
then selected the upstream region (from positions 1 to
20,155).
A two-step procedure for phylogenetic footprinting
A schematic representation of the developed two-step proce-
dure is given in Figure 1.
Genome Biology 2005, Volume 6, Issue 13, Article R113 Van Hellemont et al. R113.15
comment reviews reports refereed researchdeposited research interactions information
Genome Biology 2005, 6:R113
Step 1: data reduction
In this step, a dataset consisting of the complete intergenic
sequences of comparable size originating from orthologs of
closely related organisms is reduced to a dataset of prese-
lected sequences conserved among all/most compared
orthologs. First, related vertebrate intergenic regions of com-
parable size (in this study these sequences corresponded to
the mammalian human, chimp, rat, mouse and dog
sequences) are aligned using the pairwise alignment algo-
rithm AVID (using default parameters) [65]. For each
ortholog, sequences corresponding to the significantly con-
served regions of the pairwise alignment are selected using
VISTA [66]. Significance of the alignment is defined by two
parameters (VISTA parameters): the window length (L), the
region for which the percent identity is calculated; and the
conservation level (C) in the selected window, the minimal
percent identity of the aligned region to be considered as sig-
nificantly conserved. The parameter settings were adapted to
the evolutionary distance of the compared organisms. The
closer the organisms were related, the higher the threshold on
the degree of conservation chosen. The conservation parame-
ters used were: for human-mouse comparison, 85% over 200
nt; human-rat, 85% over 200 nt; human-chimp, 85% over
350 nt; human-dog, 80% over 200 nt; mouse-rat, 85% over
350 nt; mouse-chimp, 85% over 200 nt; mouse-dog, 80%
over 200 nt; rat-chimp, 85% over 200 nt; rat-dog, 80% over
200 nt; and chimp-dog, 80% over 200 nt.
To identify orthologous regions conserved in multiple related
vertebrate sequences of comparable size (that is, multiple
alignment), homologies between all preselected sequences
were determined (using AVID with default parameters). Sub-
sequently, multiple conserved regions were identified using
the graph based clustering TribeMCL [67]. We chose
TribeMCL as this is a well-known graph-based clustering
algorithm that was originally designed to recover transitivity
relations between biological sequences (that is, orthologous
proteins). Each resulting cluster corresponds to a region con-
served in multiple sequences and consists of a set of prese-
lected sequences originating from the different related
orthologs of comparable size that mutually show a minimal
degree of conservation. Several runs of TribeMCL were per-
formed for each dataset, using different values of clustering
parameters I and P (see [44]). The parameter I did not seem
to have a major influence on the size of the clusters and,
therefore, was set at 4. For the P value, three different values
were tested per dataset and the parameter that resulted in
small tightly linked clusters was chosen as these clusters cor-
respond to strongly conserved regions. The parameters of
choice for the benchmark datasets were: for cfos, I = 4 and P
= 0; for hoxb2, I = 4 and P = -10; for pax6, I = 4 and P = 0;
and for scl, I = 4 and P = -10. Concerning the additional data-
sets, the parameter setting of choice was I = 4 and P = 0 for
EGR3, HIV-EP1, HOXB5, Meis2 and PCHD8 and I = 4 and P
= -10 for GSH1.
Some clusters contain different subsequences derived from
the intergenic sequence of a single organism that match one
larger sequence of another organism; for example, two subse-
quences in rat that match one larger sequence in human. To
minimize the noise in the datasets used for motif detection,
such clusters are split into subclusters. Subclusters contain
only a single subsequence of each ortholog (paralog; Figure
4). A subcluster is tagged by a profile containing the IDs of the
different subsequences composing this subcluster. The input
dataset for motif detection (Figure 1) thus consists of the
mammalian subsequences in a subcluster together with the
intergenic region of the corresponding Fugu ortholog.
Step 2: Motif detection
To find motifs conserved in the preselected intergenic
sequences of orthologous genes, we developed BlockSampler
as an extension of MotifSampler [39]. In contrast to the pre-
vious version of MotifSampler, which could only handle a sin-
gle background model, in BlockSampler each orthologous
intergenic sequence in the input dataset is scored with its
appropriate species-specific background model. Previous
studies have shown that using the correct species-specific
higher order background model improves the reliability of the
results [37,68]. In this study we used species-specific third-
order background models.
The current implementation also allows selecting a user-
defined core ortholog. This is the sequence of interest in
which the motif should be present (in our case the sequence
of heterogeneous length - the Fugu sequence). The idea
behind this is that we are interested in motifs present in this
core sequence that are supported by their presence in the
preselected conserved orthologous regions. In this study, the
most divergent Fugu orthologs were chosen as core
sequences. The Gibbs sampling procedure searches for a
common motif that has exactly one occurrence in the core
sequence and no or one occurrence in the remainder of the
sequences. After short motif seeds are identified, these are
extended using a simple protocol to find larger conserved
blocks: if the consensus score over a 5 nt region adjacent to
the current motif exceeds a given threshold, the motif is
extended with one nucleotide (in that direction). The larger a
conserved block, the higher the confidence in the motif.
BlockSampler was run 100 times for each input set (subclus-
ter plus Fugu ortholog) and corresponding random sets using
default parameters; searching plus strand only (s = 0), prior
set to 0.2, initial motif length of 8 nt. Only the threshold of the
consensus score (default 1.0) was augmented to 1.2, selecting
stronger conserved blocks. This generated 100 conserved
blocks for each input set. To avoid redundancy, blocks over-
lapping more than 80% were merged. Concerning the
benchmark datasets that consisted of only one distantly
related ortholog, namely Fugu, we then selected those blocks
that were conserved among all vertebrates under study. When
studying more diverse datasets containing multiple distantly
R113.16 Genome Biology 2005, Volume 6, Issue 13, Article R113 Van Hellemont et al. />Genome Biology 2005, 6:R113
related species (with regard to mammals), we relaxed this
requirement by allowing a block to be absent from one of the
orthologs under study.
To account for the fact that short blocks are more likely to
have a higher degree of conservation than long bocks, consen-
sus scores [39] were compensated for their length. Blocks
were then ranked according to this normalized consensus
score (Cs
ad
), calculated using the formula Cs
ad
= (L/L+E)Cs,
where L is the length of the conserved block, E is an empirical
factor (set to 5) and Cs the consensus score.
To assess the relative individual contributions of the data
reduction and motif detection steps to the final result, we
applied BlockSampler on the full-length benchmark datasets.
We used the same parameter setting as described above but,
because of the longer sequence length in the full datasets, we
increased the number of runs (1,000 runs for each bench-
mark dataset). Blocks were selected as described above. The
best scoring 10% of the remaining blocks were searched for
known motifs.
Randomization
To set a threshold on the adapted consensus score of the
blocks (blocks with a score above the threshold are consid-
ered relevant), we compared block scores of the genuine set
with those of corresponding random sets. For each genuine
dataset, 100 random sets were generated. A corresponding
random set contains, besides the different homologous
regions of the genuine subcluster under study, a random
Fugu intergenic sequence. This additional random sequence
was not orthologous with the mammalian sequences and thus
is unlikely to contain the same motifs. In each random set,
motifs were identified using the same procedure as described
for the genuine set. For each random set the best scoring
motif was selected, that is, the block with the highest normal-
ized consensus score. This resulted in a group of the best scor-
ing 100 false positive motifs. These scores were
approximately normally distributed. As a threshold, we
choose the 90th percentile of the best scoring random motifs.
Motif validation
For each block we detected, a BLAT search against the human
genome (May 2004 assembly) was performed [54,69]. This
linked to the UCSC genome browser [51], where alignments
between multiple vertebrate organisms were generated using
MULTIZ [52]. Subsequently, we checked in the UCR browser
[20] whether UCRs were identified in the intergenic regions
under study.
To assess whether known transcription factor binding sites
are located in the detected blocks, we compared the consen-
sus sequence of each block with motifs described in the liter-
ature. In addition, we scanned the block consensus sequence
with the Transfac 6.0 public database of vertebrate transcrip-
tion factor binding site profiles [55]. This scanning was
performed using MotifLocator [70-72] with a 0
th
order verte-
brate background model. Hits with a score >0.9 were
regarded as potential binding sites. The binding sites are indi-
cated by the Transfac factor name [55].
To calculate the statistical over-representation of homeodo-
main binding sites, 100 sequences were selected randomly
from the Fugu genome and screened to make sure they dif-
fered from the genes under study. These random sequences
were screened with matrix models from homeodomain bind-
ing sites (obtained from TRANSFAC 8.2) using MotifLocator,
as described above. We calculated the chi-square statistic
with Yates correction of the 2 × 2 contingency table test for
the set of homeodomain binding sites [73]. Homeobox bind-
ing sites were significantly over-represented in a certain block
at a p value of 10
-8
.
Performance evaluation
To evaluate our newly developed procedure, we compared its
performance to that of two algorithms often used for phyloge-
netic footprinting, namely the motif detection algorithm
MotifSampler [39] and the multiple alignment procedures
MAVID [10,65] and TBA [52]. These three algorithms were
applied to the benchmark datasets and the resulting motifs
(conserved in all organisms under study) were compared to
those detected by the two-step procedure. We aligned the full-
length initial datasets (Table 6) [44] using the online MAVID
version at [74] with the default parameter setting [9].
Besides MAVID, we used TBA as it has been shown to outper-
form MAVID [52]. All the necessary tools were obtained from
the Miller Lab website [75]. To generate a multiple alignment
using TBA, we first pairwise aligned the initial datasets using
blastz. We used the evolutionary tree ((human chimp)(rat
mouse) Fugu); the additional blastz parameter file (latest ver-
sion) was obtained from the E Margulies ftp site [76]. The
final multiple alignment was obtained by running the TBA
executable.
We applied MotifSampler both on the reduced datasets (sub-
cluster + complete Fugu intergenic sequence [44]) and on the
complete intergenic sequences (initial datasets). For the
reduced sets we performed 100 MotifSampler runs, while for
the complete datasets MotifSampler was run 1,000 times,
each time using the standard parameter settings of the algo-
rithm: the algorithm searches for only one motif (n = 1) of 8
nt (w = 8) on both strands (s = 1) and the prior probability of
1 motif copy (p) is 0.5. A third order vertebrate background
model was used.
Additional data files
The following additional data are available with the online
version of this paper. Additional data file 1 contains the list of
significant blocks detected in the six additional datasets and,
for each block, the results of the Transfac screening.
Genome Biology 2005, Volume 6, Issue 13, Article R113 Van Hellemont et al. R113.17
comment reviews reports refereed researchdeposited research interactions information
Genome Biology 2005, 6:R113
Additional data file 2 contains the stand-alone version of
BlockSampler. Additional data file 3 contains the correspond-
ing BlockSampler help file.
Additional data file 1The list of significant blocks detected in the six additional datasets and, for each block, the results of the Transfac screeningThe list of significant blocks detected in the six additional datasets and, for each block, the results of the Transfac screeningClick here for fileAdditional data file 2The stand-alone version of BlockSamplerThe stand-alone version of BlockSamplerClick here for fileAdditional data file 3The corresponding BlockSampler help fileThe corresponding BlockSampler help fileClick here for file
Acknowledgements
R Van Hellemont is a fellow of the IWT. This work is partially supported
by: IWT project GBOU-SQUAD-20160; Research Council KULeuven
GOA Mefisto-666, GOA-Ambiorics, EF/05/007 SymBioSys, IDO genetic
networks; FWO projects G.0115.01, G.0413.03 and G.0318.05; IUAP V-22
(2002-2006). The authors would like to thank Tine Blomme for help with
the identification of orthologs.
References
1. Tagle DA, Koop BF, Goodman M, Slightom JL, Hess DL, Jones RT:
Embryonic epsilon and gamma globin genes of a prosimian
primate (Galago crassicaudatus). Nucleotide and amino acid
sequences, developmental regulation and phylogenetic
footprints. J Mol Biol 1988, 203:439-455.
2. Fickett JW, Wasserman WW: Discovery and modeling of tran-
scriptional regulatory regions. Curr Opin Biotechnol 2000,
11:19-24.
3. Levy S, Hannenhalli S, Workman C: Enrichment of regulatory sig-
nals in conserved non-coding genomic sequence. Bioinformat-
ics 2001, 17:871-877.
4. Boffelli D, McAuliffe J, Ovcharenko D, Lewis KD, Ovcharenko I,
Pachter L, Rubin EM: Phylogenetic shadowing of primate
sequences to find functional regions of the human genome.
Science 2003, 299:1391-1394.
5. Chapman MA, Donaldson IJ, Gilbert J, Grafham D, Rogers J, Green
AR, Gottgens B: Analysis of multiple genomic sequence align-
ments: a web resource, online tools, and lessons learned
from analysis of mammalian SCL loci. Genome Res 2004,
14:313-318.
6. Thompson JD, Higgins DG, Gibson TJ: CLUSTAL W: improving
the sensitivity of progressive multiple sequence alignment
through sequence weighting, position-specific gap penalties
and weight matrix choice. Nucleic Acids Res 1994, 22:4673-4680.
7. Morgenstern B, Frech K, Dress A, Werner T: DIALIGN: finding
local similarities by multiple sequence alignment. Bioinformat-
ics 1998, 14:290-294.
8. Morgenstern B: DIALIGN 2: improvement of the segment-to-
segment approach to multiple sequence alignment. Bioinfor-
matics 1999, 15:211-218.
9. Bray N, Pachter L: MAVID multiple alignment server. Nucleic
Acids Res 2003, 31:3525-3526.
10. Bray N, Pachter L: MAVID: constrained ancestral alignment of
multiple sequences. Genome Res 2004, 14:693-699.
11. Brudno M, Do CB, Cooper GM, Kim MF, Davydov E, Green ED,
Sidow A, Batzoglou S: LAGAN and Multi-LAGAN: efficient
tools for large-scale multiple alignment of genomic DNA.
Genome Res 2003, 13:721-731.
12. Major MB, Jones DA: Identification of a gadd45beta 3' enhancer
that mediates SMAD3- and SMAD4-dependent transcrip-
tional induction by transforming growth factor beta. J Biol
Chem 2004, 279:5278-5287.
13. Wasserman WW, Fickett JW: Identification of regulatory
regions which confer muscle-specific gene expression. J Mol
Biol 1998, 278:167-181.
14. Abrahams BS, Mak GM, Berry ML, Palmquist DL, Saionz JR, Tay A, Tan
YH, Brenner S, Simpson EM, Venkatesh B: Novel vertebrate genes
and putative regulatory elements identified at kidney dis-
ease and NR2E1/fierce loci. Genomics 2002, 80:45-53.
15. Aparicio S, Morrison A, Gould A, Gilthorpe J, Chaudhuri C, Rigby P,
Krumlauf R, Brenner S: Detecting conserved regulatory ele-
ments with the model genome of the Japanese puffer fish,
Fugu rubripes. Proc Natl Acad Sci USA 1995, 92:1684-1688.
16. Bagheri-Fam S, Ferraz C, Demaille J, Scherer G, Pfeifer D: Compar-
ative genomics of the SOX9 region in human and Fugu
rubripes: conservation of short regulatory sequence ele-
ments within large intergenic regions. Genomics 2001,
78:73-82.
17. Montpetit A, Sinnett D: Comparative analysis of the ETV6 gene
in vertebrate genomes from pufferfish to human. Oncogene
2001, 20:3437-3442.
18. Nobrega MA, Ovcharenko I, Afzal V, Rubin EM: Scanning human
gene deserts for long-range enhancers. Science 2003, 302:413.
19. Santini S, Boore JL, Meyer A: Evolutionary conservation of regu-
latory elements in vertebrate Hox gene clusters. Genome Res
2003, 13:1111-1122.
20. Sandelin A, Bailey P, Bruce S, Engstrom PG, Klos JM, Wasserman
WW, Ericson J, Lenhard B: Arrays of ultraconserved non-coding
regions span the loci of key developmental genes in verte-
brate genomes. BMC Genomics 2004, 5:99-107.
21. Woolfe A, Goodson M, Goode DK, Snell P, McEwen GK, Vavouri T,
Smith SF, North P, Callaway H, Kelly K, et al.: Highly conserved
non-coding sequences are associated with vertebrate
development. PLoS Biol 2005, 3:e7.0116-e7.0130.
22. Aparicio S, Chapman J, Stupka E, Putnam N, Chia JM, Dehal P, Christ-
offels A, Rash S, Hoon S, Smit A, et al.: Whole-genome shotgun
assembly and analysis of the genome of Fugu rubripes. Science
2002, 297:1301-1310.
23. Brenner S, Elgar G, Sandford R, Macrae A, Venkatesh B, Aparicio S:
Characterization of the pufferfish (Fugu) genome as a com-
pact model vertebrate genome. Nature 1993, 366:265-268.
24. Venkatesh B, Gilligan P, Brenner S: Fugu: a compact vertebrate
reference genome. FEBS Lett 2000, 476:3-7.
25. Elemento O, Tavazoie S: Fast and systematic genome-wide dis-
covery of conserved regulatory elements using a non-align-
ment based approach. Genome Biol 2005, 6:1-R18.
26. Blanchette M, Tompa M: Discovery of regulatory elements by a
computational method for phylogenetic footprinting.
Genome Res 2002, 12:739-748.
27. Blanchette M, Tompa M: FootPrinter: A program designed for
phylogenetic footprinting. Nucleic Acids Res 2003, 31:3840-3842.
28. Bailey TL, Elkan C: The value of prior knowledge in discovering
motifs with MEME. Proc Int Conf Intell Syst Mol Biol 1995, 3:21-29.
29. Hertz GZ, Hartzell GW III, Stormo GD: Identification of consen-
sus patterns in unaligned DNA sequences known to be func-
tionally related. Comput Appl Biosci 1990, 6:81-92.
30. Hertz GZ, Stormo GD: Identifying DNA and protein patterns
with statistically significant alignments of multiple
sequences. Bioinformatics 1999, 15:563-577.
31. Lawrence CE, Altschul SF, Boguski MS, Liu JS, Neuwald AF, Wootton
JC: Detecting subtle sequence signals: a Gibbs sampling strat-
egy for multiple alignment. Science 1993, 262:208-214.
32. McCue L, Thompson W, Carmack C, Ryan MP, Liu JS, Derbyshire V,
Lawrence CE: Phylogenetic footprinting of transcription fac-
tor binding sites in proteobacterial genomes. Nucleic Acids Res
2001, 29:774-782.
33. Cliften PF, Hillier LW, Fulton L, Graves T, Miner T, Gish WR, Water-
ston RH, Johnston M: Surveying Saccharomyces genomes to
identify functional elements by comparative DNA sequence
analysis. Genome Res 2001, 11:1175-1186.
34. Hughes JD, Estep PW, Tavazoie S, Church GM: Computational
identification of cis-regulatory elements associated with
groups of functionally related genes in Saccharomyces
cerevisiae. J Mol Biol 2000, 296:1205-1214.
35. Workman CT, Stormo GD: ANN-Spec: a method for discover-
ing transcription factor binding sites with improved
specificity. Pac Symp Biocomput 2000:467-478.
36. Liu X, Brutlag DL, Liu JS: BioProspector: discovering conserved
DNA motifs in upstream regulatory regions of co-expressed
genes. Pac Symp Biocomput 2001:127-138.
37. Thijs G, Lescot M, Marchal K, Rombauts S, De Moor B, Rouze P,
Moreau Y: A higher-order background model improves the
detection of promoter regulatory elements by Gibbs
sampling. Bioinformatics 2001, 17:1113-1122.
38. Thijs G, Moreau Y, De Smet F, Mathys J, Lescot M, Rombauts S, Rouze
P, De Moor B, Marchal K: INCLUSive: integrated clustering,
upstream sequence retrieval and motif sampling. Bioinformat-
ics 2002, 18:331-332.
39. Thijs G, Marchal K, Lescot M, Rombauts S, De Moor B, Rouze P,
Moreau Y: A Gibbs sampling method to detect
overrepresented motifs in the upstream regions of coex-
pressed genes. J Comput Biol 2002, 9:447-464.
40. Tompa M, Li N, Bailey TL, Church GM, De Moor B, Eskin E, Favorov
AV, Frith MC, Fu Y, Kent WJ, et al.: Assessing computational
tools for the discovery of transcription factor binding sites.
Nat Biotechnol 2005, 23:137-144.
41. Pennacchio LA: Insights from human/mouse genome
R113.18 Genome Biology 2005, Volume 6, Issue 13, Article R113 Van Hellemont et al. />Genome Biology 2005, 6:R113
comparisons. Mamm Genome 2003, 14:429-436.
42. Elgar G, Sandford R, Aparicio S, Macrae A, Venkatesh B, Brenner S:
Small is beautiful: comparative genomics with the pufferfish
(Fugu rubripes). Trends Genet 1996, 12:145-150.
43. Wasserman WW, Krivan W: In silico identification of metazoan
transcriptional regulatory regions. Naturwissenschaften 2003,
90:156-166.
44. Supplementary Website [ />chal/Supplementary_Information_VanHel_2005/SuppWebsite.html]
45. Marchal K, De Keersmaecker S, Monsieurs P, van Boxel N, Lemmens
K, Thijs G, Vanderleyden J, De Moor B: In silico identification and
experimental validation of PmrAB targets in Salmonella
typhimurium by regulatory motif detection. Genome Biol 2004,
5:R9.1-R9.20.
46. Scemama JL, Hunter M, McCallum J, Prince V, Stellwag E: Evolution-
ary divergence of vertebrate Hoxb2 expression patterns and
transcriptional regulatory loci. J Exp Zool 2002, 294:285-299.
47. Kammandel B, Chowdhury K, Stoykova A, Aparicio S, Brenner S,
Gruss P: Distinct cis-essential modules direct the time-space
pattern of the Pax6 gene activity. Dev Biol 1999, 205:79-97.
48. Gottgens B, Barton LM, Chapman MA, Sinclair AM, Knudsen B, Graf-
ham D, Gilbert JG, Rogers J, Bentley DR, Green AR: Transcrip-
tional regulation of the stem cell leukemia gene (SCL) -
comparative analysis of five vertebrate SCL loci. Genome Res
2002, 12:749-759.
49. Kent WJ, Sugnet CW, Furey TS, Roskin KM, Pringle TH, Zahler AM,
Haussler D: The human genome browser at UCSC. Genome
Res 2002, 12:996-1006.
50. UCSC Genome Browser [ />51. Karolchik D, Baertsch R, Diekhans M, Furey TS, Hinrichs A, Lu YT,
Roskin KM, Schwartz M, Sugnet CW, Thomas DJ, et al.: The UCSC
Genome Browser Database. Nucleic Acids Res 2003, 31:51-54.
52. Blanchette M, Kent WJ, Riemer C, Elnitski L, Smit AF, Roskin KM,
Baertsch R, Rosenbloom K, Clawson H, Green ED, et al.: Aligning
multiple genomic sequences with the threaded blockset
aligner. Genome Res 2004, 14:708-715.
53. UCR Browser [ />54. Kent WJ: BLAT - the BLAST-like alignment tool. Genome Res
2002, 12:656-664.
55. Wingender E, Chen X, Fricke E, Geffers R, Hehl R, Liebich I, Krull M,
Matys V, Michael H, Ohnhauser R, et al.: The TRANSFAC system
on gene expression regulation. Nucleic Acids Res 2001,
29:281-283.
56. Margulies EH, Blanchette M, Haussler D, Green ED: Identification
and characterization of multi-species conserved sequences.
Genome Res 2003, 13:2507-2518.
57. Ureta-Vidal A, Ettwiller L, Birney E: Comparative genomics:
genome-wide analysis in metazoan eukaryotes. Nat Rev Genet
2003, 4:251-262.
58. Boffelli D, Nobrega MA, Rubin EM: Comparative genomics at the
vertebrate extremes. Nat Rev Genet 2004, 5:456-465.
59. Encode Project Consortium: The ENCODE (ENCyclopedia Of
DNA Elements) Project. Science 2004, 306:636-640.
60. Thomas JW, Touchman JW, Blakesley RW, Bouffard GG, Beckstrom-
Sternberg SM, Margulies EH, Blanchette M, Siepel AC, Thomas PJ,
McDowell JC, et al.: Comparative analyses of multi-species
sequences from targeted genomic regions. Nature 2003,
424:788-793.
61. Down TA, Hubbard TJ: NestedMICA: sensitive inference of
over-represented motifs in nucleic acid sequence. Nucleic
Acids Res 2005, 33:1445-1453.
62. Ensembl Genome Browser []
63. Barton LM, Göttgens B, Gering M, Gilbert JG, Grafham D, Rogers J,
Bentley D, Patient R, Green AR: Regulation of the stem cell
leukemia (SCL) gene: a tale of two fishes. Proc Natl Acad Sci USA
2001, 98:6747-6752.
64. Tatusova TA, Madden TL: BLAST 2 Sequences, a new tool for
comparing protein and nucleotide sequences. FEMS Microbiol
Lett 1999, 174:247-250.
65. Bray N, Dubchak I, Pachter L: AVID: A global alignment
program. Genome Res 2003, 13:97-102.
66. Frazer KA, Pachter L, Poliakov A, Rubin EM, Dubchak I: VISTA:
computational tools for comparative genomics. Nucleic Acids
Res 2004, 32:W273-W279.
67. Enright AJ, Van Dongen S, Ouzounis CA: An efficient algorithm
for large-scale detection of protein families. Nucleic Acids Res
2002, 30:1575-1584.
68. Marchal K, Thijs G, De Keersmaecker S, Monsieurs P, De Moor B,
Vanderleyden J: Genome-specific higher-order background
models to improve motif detection. Trends Microbiol 2003,
11:61-66.
69. BLAT Search Genome [ />70. Aerts S, Thijs G, Coessens B, Staes M, Moreau Y, De Moor B: Tou-
can: deciphering the cis-regulatory logic of coregulated
genes. Nucleic Acids Res 2003, 31:1753-1764.
71. Coessens B, Thijs G, Aerts S, Marchal K, De Smet F, Engelen K, Gle-
nisson P, Moreau Y, Mathys J, De Moor B: INCLUSive: A web por-
tal and service registry for microarray and regulatory
sequence analysis. Nucleic Acids Res 2003, 31:3468-3470.
72. BioI@SCD Software [ />Software.html]
73. Kato M, Hata N, Banerjee N, Futcher B, Zhang MQ: Identifying
combinatorial regulation of transcription factors and binding
motifs. Genome Biol 2004, 5:R56.1-R56.13.
74. MAVID Multiple Alignment Server [ke
ley.edu/mavid/]
75. Miller Lab [ />76. E Margulies FTP Site [ />elliott/tba/]