Báo cáo y học: "A class of human exons with predicted distant branch points revealed by analysis of AG dinucleotide exclusion zones" ppsx
Bạn đang xem bản rút gọn của tài liệu. Xem và tải ngay bản đầy đủ của tài liệu tại đây (1.57 MB, 19 trang )
Genome Biology 2006, 7:R1
comment reviews reports deposited research refereed research interactions information
Open Access
2006Goodinget al.Volume 7, Issue 1, Article R1
Research
A class of human exons with predicted distant branch points
revealed by analysis of AG dinucleotide exclusion zones
Clare Gooding
¤
*
, Francis Clark
¤
†
, Matthew C Wollerton
*
, Sushma-
Nagaraja Grellscheid
*
, Harriet Groom
*
and Christopher WJ Smith
*
Addresses:
*
Department of Biochemistry, University of Cambridge, 80 Tennis Court Road, Cambridge CB2 1GA, UK.
†
Advanced Computational
Modelling Centre, and ARC Centre for Bioinformatics, University of Queensland, Australia.
¤ These authors contributed equally to this work.
Correspondence: Christopher WJ Smith. Email:
© 2006 Gooding et al.; licensee BioMed Central Ltd.
This is an open access article distributed under the terms of the Creative Commons Attribution License ( which
permits unrestricted use, distribution, and reproduction in any medium, provided the original work is properly cited.
Exons with distant branch points<p>Exons with predicted branch points were identified from a large dataset of human exons and the importance of these branch points for splicing was verified</p>
Abstract
Background: The three consensus elements at the 3' end of human introns - the branch point
sequence, the polypyrimidine tract, and the 3' splice site AG dinucleotide - are usually closely
spaced within the final 40 nucleotides of the intron. However, the branch point sequence and
polypyrimidine tract of a few known alternatively spliced exons lie up to 400 nucleotides upstream
of the 3' splice site. The extended regions between the distant branch points (dBPs) and their 3'
splice site are marked by the absence of other AG dinucleotides. In many cases alternative splicing
regulatory elements are located within this region.
Results: We have applied a simple algorithm, based on AG dinucleotide exclusion zones (AGEZ),
to a large data set of verified human exons. We found a substantial number of exons with large
AGEZs, which represent candidate dBP exons. We verified the importance of the predicted dBPs
for splicing of some of these exons. This group of exons exhibits a higher than average prevalence
of observed alternative splicing, and many of the exons are in genes with some human disease
association.
Conclusion: The group of identified probable dBP exons are interesting first because they are
likely to be alternatively spliced. Second, they are expected to be vulnerable to mutations within
the entire extended AGEZ. Disruption of splicing of such exons, for example by mutations that lead
to insertion of a new AG dinucleotide between the dBP and 3' splice site, could be readily
understood even though the causative mutation might be remote from the conventional locations
of splice site sequences.
Background
Pre-mRNA splicing is an essential step in eukaryotic gene
expression as well as an important regulatory point via the
process of alternative splicing [1-4]. Removal of introns and
splicing together of exons is essential for the generation of
functional mRNAs from pre-mRNAs. The importance of
Published: 13 January 2006
Genome Biology 2006, 7:R1 (doi:10.1186/gb-2006-7-1-r1)
Received: 26 July 2005
Revised: 21 September 2005
Accepted: 28 November 2005
The electronic version of this article is the complete one and can be
found online at />R1.2 Genome Biology 2006, Volume 7, Issue 1, Article R1 Gooding et al. />Genome Biology 2006, 7:R1
splicing is attested to by the observation that at least 15% of
human genetic diseases are caused by mutations within the
consensus sequence elements at the exon-intron boundaries,
which are important for specifying the splice sites [5-7]. The
5' splice site consists of a nine-nucleotide consensus contain-
ing the invariant GU dinucleotide at the start of the intron. At
the 3' end of the intron, usually within about 40 nucleotides
upstream of the exon, there are three elements (in 5' to 3'
order): a branch point sequence (BPS); a polypyrimidine tract
(PPT); and the 3' splice site itself, which consists of the invar-
iant AG dinucleotide at the end of the intron, usually pre-
ceded by a pyrimidine residue. Recognition of these
consensus elements by various trans-acting protein and RNA
splicing factors leads to assembly of the spliceosome, within
which the two chemical steps of splicing occur [8]. In the first
step the 2'-OH group of the branch point adenosine attacks
the 5' splice site, leading to formation of the 5' exon and the
intron lariat intermediates. In the second step, the 3'-OH of
the 5' exon attacks the 3' splice site, leading to production of
the spliced RNA and the excised intron, still in the lariat
configuration.
Although the consensus splice site elements are essential,
they are degenerate in many positions, and have insufficient
information content to specify correctly the ends of long
metazoan introns [8]. This deficit is partly addressed by the
presence of auxiliary splicing enhancer sequences, commonly
found within exons (exonic splicing enhancers), which acti-
vate splicing of adjacent splice sites [9,10]. A number of RNA
binding (for example [11]) and functional SELEX (selective
evolution of ligands by exponential enrichment) experiments
[12-14], as well as computational analyses [15,16], have been
used to identify various classes of exonic splicing enhancers
(see Matlin and coworkers [3] for a discussion).
The conventional arrangement of elements within 40 nucle-
otides at the 3' ends of introns is not obligatory. A number of
alternatively spliced exons have been characterized in which
the BPS has been mapped 100-400 nucleotides from the 3'
splice site [17-21] (Figure 1), and artificial splicing substrates
have also been created with this arrangement [22]. In some
cases, these distant branch points (dBPs) are close enough to
the upstream exon to promote mutually exclusive splicing
[19,20]. In all cases that have been investigated, regulatory
elements have been found to lie between the dBP and the
exon [20,21,23-26]. These introns can be characterized as 'AG
independent' in the sense that step 1 of splicing occurs with-
out the need for the 3' splice site AG [22]. The 3' splice site is
then located during step 2 of splicing by a linear search for the
first AG dinucleotide downstream of the dBP [27-29]. Conse-
quently, a hallmark of experimentally verified dBP exons is an
extended region immediately upstream that is devoid of AG
dinucleotides. We refer to this region as the 'AG exclusion
zone' (AGEZ). In these verified cases the BPS and PPT are
located toward the 5' end of the AGEZ, and upstream of the
AGEZ AG dinucleotides appear to occur at a normal fre-
quency (Figure 1). Exceptions to the simple BPS to AG scan-
ning model can occur when AG dinucleotides occur relatively
close (<12-15 nucleotides) to the BPS and these can be
bypassed, or when the 3' splice site has two or more closely
spaced (<12 nucleotides) AGs, in which case the preceding
nucleotide plays an important role in their competition
[28,30].
We devised a simple algorithm that can be used to locate
putative dBPs. First, we define the AGEZ upstream of each
exon by conducting a 3' to 5' search from the 3' splice site for
the first upstream AG. In the small number of cases in which
AG dinucleotides exist before -12, we ignore them and con-
tinue the search for the first AG beyond -12. We then search
for probable candidate BPs in a region defined by the AGEZ
but also including a further approximate 15 nucleotides
upstream. This additional 15 nucleotides is also considered
because AGs very close to the BPS can be bypassed by the spli-
ceosome during step 2 of splicing [28,30]. Candidate dBPs
are identified by consensus sequence (see Materials and
methods, below) and by the presence of an adjacent PPT, and
are often close to the 5' end of the AGEZ. Here, we have
applied this approach globally by classifying human exons
according to the size of their AGEZ. We find that there is an
excess of exons with large AGEZ, and that putative dBP exons
exhibit a higher than average prevalence of alternative
splicing.
Results
Analyzing introns for AG exclusion zones
We analyzed a set of 67,334 human exons from AltExtron
(version 3; based on GenBank release 147) [31,32] for the size
of dinucleotide exclusion zones upstream of their 3' splice
site. When plotted as log(number of exons) versus log(size of
EZ), the distribution of AGEZ values did not obviously exhibit
a simple excess of high values compared with the curves for
the other dinucleotides. However, frequencies of dinucleotide
occurrence can be affected by many factors other than splic-
ing. Notably, the general scarcity of CpG dinucleotides leads
to very large CGEZs upstream of many exons (Figure 2). We
therefore compared the distributions of 'first' and 'second'
exclusion zones upstream of exons (EZ
1
and EZ
2
, respec-
tively). In the experimentally verified dBP exons, the distance
between first and second AGs upstream of the 3' splice site is
much shorter than between the 3' splice site and the first
upstream AG (Figure 1). Because scanning for the 3' splice site
takes place downstream from dBPs, we expect a selective
pressure against AG dinucleotides between dBPs and the 3'
splice site, and conversely a general lack of selective pressure
against AGs upstream of BPs. On this basis we expect the
AGEZ
1
distribution to be biased toward higher values when
compared with AGEZ
2
distributions. Although our method
avoids potential problems that can arise due to heterogeneity
in base composition dynamics between the gene sequences
(by having one EZ
1
datum and a corresponding EZ
2
datum
Genome Biology 2006, Volume 7, Issue 1, Article R1 Gooding et al. R1.3
comment reviews reports refereed researchdeposited research interactions information
Genome Biology 2006, 7:R1
derived from each intron sequence, for each dinucleotide,
under consideration), it remains a concern that heterogeneity
in base composition within an intron could affect our analy-
sis. The common location of the PPT immediately upstream
of the 3' splice site is an obvious candidate for introducing this
sort of bias. In order to control for this to some extent and for
other methodological reasons (see Materials and methods,
below), we present these distribution comparisons (Figure 2)
using modified definitions of the EZ
1
and EZ
2
(mod-EZ
1
and
mod-EZ
2
), and having restricted the dataset to exclude
introns of less than 350 nucleotides in length (see Materials
and methods, below). Briefly, mod-EZ
1
is the distance from -
25 (relative to the 3' splice site) to the first upstream occur-
rence of a particular dinucleotide. A further upstream shift of
25 nucleotides from the 5' end of the mod-EZ
1
is then carried
out before commencing the search to define mod-EZ
2
.
Comparison of the mod-EZ
1
and mod-EZ
2
profiles revealed
the curves for each dinucleotide to be (visually) very similar in
all cases except for AG (Figure 2; compare blue and red lines).
For the AG dinucleotides there was a readily identifiable
shoulder on the mod-EZ
1
distribution at higher values (≥ 100
nucleotides) compared with the mod-EZ
2
distribution. There
are 279 mod-AGEZ
1
exons at 100 nucleotides or greater com-
pared with 148 for the mod-AGEZ
2
curve, giving a χ
2
value of
116 (P ≈ 0). This confirms the visual impression that the mod-
AGEZ
1
and mod-AGEZ
2
distributions are significantly differ-
ent. The excess of exons with large AGEZ
1
represents a group
of potential dBP exons. We note that some other dinucle-
otides also exhibit lesser but still statistically significant dif-
ferences under equivalent analysis (in particular bias toward
TC and CT in the mod-EZ
1
region; further details may be
found under Materials and methods, below). As an initial test
of whether the excess of the exons with mod-AGEZ
1
≥ 100 are
associated with dBPs, we repeated the analysis of mod-AGEZ
1
distributions having first split the intron data-set into two
groups according to whether or not they had an AG dinucle-
otide between -12 and -25 with respect to the 3' splice site. The
expectation is that exons with an AG between -12 and -25 (the
'plus' group) cannot have a dBP (otherwise the additional AG
would be used as the 3' splice site). Consistent with this expec-
tation, the percentage of mod-AGEZ
1
values ≥ 100 nucleotides
was 0.68% for introns without an AG in the -12 to -25 region
(the minus group), but only 0.23% for those with an AG. With
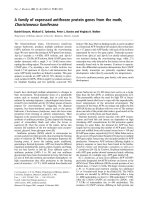
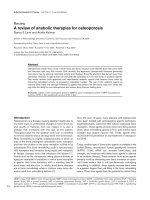
Sequence arrangement at dBP exonsFigure 1
Sequence arrangement at dBP exons. The locations of several dBPs that have been mapped in vitro are shown, along with the locations of the first and
second AG dinucleotides upstream of the 3'ss. In experimentally verified cases of dBP exons the BPS and PPT can be located hundreds of nucleotides
upstream of the 3'ss. Because step 2 of splicing in these introns involves a scanning process from the BPS to locate the 3'ss at the first downstream AG, the
region between the 3'ss and the BPS is devoid of AG dinucleotides. Upstream of the BPS, AGs appear no longer to be excluded, as indicated by the
locations of second AGs upstream of the 3'ss. Here we refer to the region between the 3'ss and the first upstream AG as the AG exclusion zone (AGEZ).
BPS, branch point sequence; dBP, distant branch point; PPT, polypyrimidine tract; 3'ss, 3' splice site.
CAGYNYUR
A
Y
YYYYYYYYYY
AG
3'ssPPTBPS
AGEZ
α-TM
exon 3
-215 -175
α-TM
exon 2
-75 -72
β-TM
exon 7
-163 -144 -153
α-actinin
NM exon
-224 -191
α-actinin
SM exon
-392 -386
AG
-227
-83
-174
-230
-410
R1.4 Genome Biology 2006, Volume 7, Issue 1, Article R1 Gooding et al. />Genome Biology 2006, 7:R1
a null hypothesis that the minus group should generate the
same statistics as the plus group, we observe the null hypoth-
esis to be false, with a χ
2
of 356 (P ≈ 0).
In the data set proper there are 838 exons with AGEZ ≥ 100.
We estimate that between one-half and one-fifth of these
indicate dBPs (see details under Materials and methods,
below); with 838 of 67,334 introns having an AGEZ
1
≥ 100, we
expect that approximately 1/160 to 1/400 introns have dBPs.
Taking an 'average' human gene to have eight introns, this
reduces to between 1/20 and 1/50 genes having at least one
dBP (as defined here).
To facilitate manual examination of large AGEZ exons, we
restrict consideration to those exons with AGEZ ≥ 150 (165
cases). Our data are available online [33], with separate files
for the starting data set, and for exons with AGEZ ≥ 150.
Among the exons with AGEZ ≥ 150 were exon 11 of the human
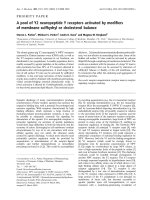
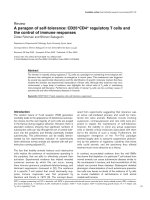
Distribution of dinucleotide exclusion zonesFigure 2
Distribution of dinucleotide exclusion zones. Shown is the distribution of dinucleotide exclusion zones (mod-EZ) upstream of 49,876 human exons (having
excluded cases in which the intron was less that 350 nucleotides). Y-axis: log [number of exons]. X-axis: log [size of mod-EZ]. Data are normalized to give
a probability density function, which gives the probability that an exon chosen at random will have an exclusion zone of a given size; the area under each
curve is 1. Blue lines: first exclusion zone (mod-EZ
1
), measured from -25 (relative to the 3' splice site) to the first upstream occurrence of the particular
dinucleotide (see Materials and methods). Red lines: second exclusion zone (mod-EZ
2
), measured from -25 relative to the end of the mod-EZ
1
. AG shows
the largest variance between mod-EZ
1
and mod-EZ
2
. Data was sorted into bins of logarithmically increasing widths rendered discrete (bin width 10 at
~100; bin width 100 at ~1,000), with final bin counts divided by bin width and by the total number of exons, followed by application of a three-point
averaging filter to produce the given plots. See Materials and methods for full details.
10
0
10
1
10
2
10
3
10
-6
10
-5
10
-4
10
-3
10
-2
10
-1
10
0
TT
0
10
1
10
2
10
3
10
-6
10
-5
10
-4
10
-3
10
-2
10
-1
10
0
TG
10
0
10
1
10
2
10
3
10
-6
10
-5
10
-4
10
-3
10
-2
10
-1
10
0
TC
10
0
10
1
10
2
1
0
3
10
-6
10
-5
10
-4
10
-3
10
-2
10
-1
10
0
TA
10
0
10
1
10
2
10
3
10
-6
10
-5
10
-4
10
-3
10
-2
10
-1
10
0
GT
10
0
10
1
10
2
10
3
10
-6
10
-5
10
-4
10
-3
10
-2
10
-1
10
0
GG
10
0
10
1
10
2
10
3
10
-6
10
-5
10
-4
10
-3
10
-2
10
-1
10
0
GC
10
0
10
1
10
2
10
3
10
-6
10
-5
10
-4
10
-3
10
-2
10
-1
10
0
GA
10
0
10
1
10
2
10
3
10
-6
10
-5
10
-4
10
-3
10
-2
10
-1
10
0
CT
10
0
10
1
10
2
10
3
10
-6
10
-5
10
-4
10
-3
10
-2
10
-1
10
0
CG
10
0
10
1
10
2
10
3
10
-6
10
-5
10
-4
10
-3
10
-2
10
-1
10
0
CC
10
0
10
1
10
2
10
3
10
-6
10
-5
10
-4
10
-3
10
-2
10
-1
10
0
CA
10
0
10
1
10
2
1
0
3
10
-6
10
-5
10
-4
10
-3
10
-2
10
-1
10
0
AT
10
0
10
1
10
2
10
3
1
0
-6
1
0
-5
1
0
-4
1
0
-3
1
0
-2
1
0
-1
0
1
0
AG
10
0
10
1
10
2
10
3
10
-6
10
-5
10
-4
10
-3
10
-2
10
-1
0
10
AC
10
0
10
1
10
2
10
3
10
-6
10
-5
10
-4
10
-3
10
-2
10
-1
10
0
AA
10
Genome Biology 2006, Volume 7, Issue 1, Article R1 Gooding et al. R1.5
comment reviews reports refereed researchdeposited research interactions information
Genome Biology 2006, 7:R1
PTB gene (AGEZ = 381, IDB1087423.10917), for which we
have some in vitro evidence for use of a dBP [21]. Likewise,
the equivalent exon from the neuronal specific paralog nPTB/
brPTB [34,35] was identified (AGEZ = 438, predicted branch
point at -389, IDB1145220.85254). Other dBP exons from the
α-tropomyosin and α-actinin genes, which were experimen-
tally verified for the rat genes and appear to be conserved,
were not in the current build of AltExtron. Many of the exons
with large AGEZ (≥ 150) had a clear potential dBP located
toward the upstream end of the AGEZ with no obvious candi-
date BPS close to the 3' splice site. For example,
IDB1152764.11013 has an AGEZ of 220 with a TACTAAC
sequence at -214 and an adjacent PPT. The mouse ortholog
has an AGEZ of 247 and a consensus TACTAAC BPS at -214.
In other cases, large AGEZs did not appear to be related to
splicing, with no obvious candidate BPS/PPT toward the 5'
end of the AGEZ, whereas good candidates were in the con-
ventional location. For example, IDB1079466.8106 has an
AGEZ of 369 nucleotides. However, this appears to be due to
a repetitive element upstream of the 3' splice site. Because
this element lacks AG dinucleotides there is a large AGEZ,
and AGs further upstream are still widely spaced. The only
good candidate BPS is at -17. Instructively, the mouse orthol-
ogous exon has an AGEZ of only 31 nucleotides and a pre-
dicted BPS at -24. Intermediate between these extremes are
multiple examples that might have dBPs, but that will require
careful experimental verification. A striking example is tyro-
sine phosphatase sigma (IDB1087363.1770), which has an
AGEZ of 1126 (the entire intron is only 1132 nucleotides) and
potential dBPs at -1079, -829 and -288. The closest potential
BPS that scores above threshold is at -171. The mouse orthol-
ogous exon has an AGEZ of 229 nucleotides with a predicted
dBP at -192.
Testing predicted distant branch points
Definitive mapping of branch points can be achieved by in
vitro splicing followed by primer extension from a position
downstream of the branch point; reverse transcriptase is
arrested one base before the branched nucleotide [36]. How-
ever, this approach is limited to transcripts that splice effi-
ciently in vitro. We therefore decided to target candidate
dBPs by mutagenesis in exon trapping vectors. This approach
identifies nucleotides that influence exon inclusion but does
not definitively prove the branch point location. However, it
has the distinct advantage of being more widely applicable.
To validate the approach we first used a minigene construct
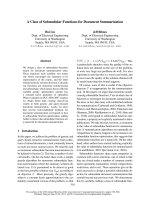
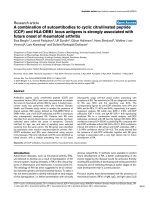
containing rat α-tropomyosin exons 1, 3 and 4 (Figure 3). The
dBP of exon 3 has been mapped in vitro to the A at 175 nucle-
otides upstream of exon 3, which lies within a good consensus
context (ggCTAA
C) [19,37]. When transfected into HeLa cells
exon 3 was included to more than 99% (Figure 3b, wild type).
Mutations of A to G at positions -175 and -176 led to approxi-
mately 50% exon skipping, which is consistent with mutation
of the authentic dBP but suggests that use of a cryptic dBP
was able to sustain the residual exon splicing (Figure 3b). Pre-
vious in vitro splicing with mutant transcripts had indicated
that A -182 could sometimes be used as a dBP (Scadden ADJ,
Smith CWJ, unpublished data). Consistent with this, muta-
tion of the dBPs at -175 and -182 abolished exon 3 splicing.
This established that mutagenesis in exon trapping vectors
could be used to identify dBPs, but it also emphasized that
activation of nearby cryptic dBPs might limit the magnitude
of the observed effect.
Candidate dBP exons and flanking introns were cloned into
EGFP (enhanced green fluorescent protein) and TM (α-tro-
pomyosin) exon trapping vectors, and potential branch
points targeted by A to G mutations. Splicing was analyzed by
reverse transcriptase polymerase chain reaction (RT-PCR)
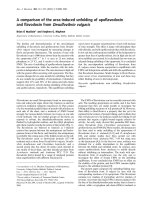
after transient transfection of HeLa cells. We first tested exon
11 from the PTB gene (IDB1087423.10917). In vitro splicing
has previously demonstrated that there is an active BPS/PPT
more than 187 nucleotides upstream of the exon, but splicing
of full length transcripts was too inefficient to allow BPS map-
ping [21]. This exon provides a challenging test for predicting
dBPs. The AGEZ is 381 nucleotides in length, within which
there are at least seven putative BPS (Figure 4). We predicted
that the BPS is at -351 on the basis of the following: location
toward the 5' end of AGEZ; the high scoring sequence UACU-
GAC (7.52 bits) is a perfect match to the BPS consensus hep-
tamer, including the possibility for complete base pairing
with U2 snRNA; and an adjacent uridine-rich PPT [21]. PTB
exon 11 was included to a level of about 25% in an EGFP exon
trapping vector (Figure 4). Mutation of the predicted -351
BPS (UACUGAC to UGCUGGC) completely abolished exon
inclusion. In contrast, mutation of a potential branch point 51
nucleotides upstream of the exon (-51 CCUUGAC to CCU-
UGGC) had no effect, despite the fact that this is a high scor-
ing BPS, has an adjacent polypyrimidine tract, and at -51 is
only just beyond the conventional 40 nucleotides distance
from the 3' splice site.
Next we tested two exons that had been newly identified
within the group of large AGEZ exons. Exon 23 from the
GBBR1 gene, which encodes the B subunit of the γ-aminobu-
tyric acid receptor (Figure 5), has an AGEZ of 288 nucle-
otides. The highest scoring BPS is at -275, with an adjacent
extensive PPT. This exon was inserted into both the EGFP
and TM exon trapping vectors. In both vectors the exon was
partially included in spliced mRNA. Exon inclusion was com-
pletely abolished by mutation of the -275 BPS (CACUGAC to
CGCUGGC). In contrast, mutation of the next high scoring
BPS at -217 (CCCUGAU to CCCUGGU) had no effect on exon
inclusion.
Finally, we tested exon 2 of a gene encoding a novel protein
(IDB1088375.2161; Figure 6). The AGEZ was 185 nucleotides,
with the highest scoring potential dBPs at -160 and -166 adja-
cent to a PPT. We mutated the possible dBPs at -160 and -166
together (∆BP -166/-160) and also a potential BPS at -81,
which was followed by an unbroken PPT to the 3' splice site.
Mutation at -81 had no effect, with about 90% exon inclusion
R1.6 Genome Biology 2006, Volume 7, Issue 1, Article R1 Gooding et al. />Genome Biology 2006, 7:R1
Figure 3 (see legend on next page)
WT
∆BP
-175
∆BP
-175
-182
+ exon 3
- exon 3
∆BP-175
GAAUGGCUA
AC GAAUGGCUGGC
∆BP-175 -182
GAAUGGCUA
AC GGGUGGCUGGC
(a)
(b)
0.9 55 97
-
% exon skipping:
CACGAAUGCCUA
A
CUUUCUCUUUCUCUCUCCCUCCCUGUCUUUCCCUCUCUCUCUCUUUCCC
GCUGUCCCUGUCCUUUAUGGUCUACGCACCCUCAACCCGCACCUUGCGGGAUCACGCUGCCU
GCUGCACCCCACCCCCUUCCCCCUUCCUUCCCCCCACCCCCGUACUCCACUGCCAACUCCCAG
1 3 4
αTM134
SV SV
Genome Biology 2006, Volume 7, Issue 1, Article R1 Gooding et al. R1.7
comment reviews reports refereed researchdeposited research interactions information
Genome Biology 2006, 7:R1
as in the wild type. In contrast, exon inclusion was reduced to
about 30% in ∆BP -166/-160. This indicates that the dBP is
located at -160 and/or -166, but it also indicates that some
splicing can proceed using another BPS (for example using A
-170 or A -140).
Prevalence of alternative splicing in candidate distant
branch point exons
All experimental examples of dBP exons are alternatively
spliced [17-21], and it is our expectation that a dBP is likely to
indicate that an exon is alternatively spliced under at least
some circumstances. We therefore analyzed the prevalence of
observed alternative splicing (as seen in the AltExtron data
set) as a function AGEZ size.
First, we examined observed cassette exon type events
(including mutually exclusive events) versus AGEZ (Figure
7a). Exons with AGEZ ≥ 100 nucleotides had a significantly
higher frequency of observed alternative splicing, compared
with the much larger number of exons with AGEZ up to 100
nucleotides (P = 0.002; see Materials and methods, below).
The higher observed frequency of alternative splicing among
large AGEZ exons is probably a conservative reflection of the
alternative splicing propensity of dBP exons due to the follow-
ing: all inferences of alternative splicing based upon
expressed sequence tags (ESTs) are heavily restricted by the
incomplete coverage and end biases of ESTs [38], and not all
large AGEZ are associated with dBPs. We therefore suspect
that the true prevalence of alternative splicing among dBP
exons will be far higher. We also observed a higher prevalence
of cassette exon events associated with very short AGEZs. The
presence of two closely spaced AG dinucleotides is important
for cassette skipping of exon 3 of Drosophila sex-lethal; if the
upstream of the two AGs is mutated the the exon is constitu-
tively included [39,40]. The group of short AGEZ cassette
exons may be candidates for a similar form of regulation.
As a comparison, we observed the level of acceptor site exon
modification (extension or truncation at the 3' splice site)
type alternative splicing events versus AGEZ (Figure 7b). The
median level was around 8% and was fairly uniform. Exons
with large AGEZ did not exhibit elevated levels of this type of
alternative splicing event. However, the group of exons with
shortest AGEZ had a 15% observed level of alternative splic-
ing. This spike at low AGEZ values had been considerably
more pronounced prior to the following: ignoring any AGs in
the last 12 nucleotides of an intron in the determination of the
AGEZ; and the exclusion from the analysis (for Figure 7) of
acceptor sites ≤ 40 nucleotides downstream of another accep-
tor site (data not shown). These filtering steps removed a
large number of acceptor site isoforms involving small trun-
cations or extensions, including the class of so-called NAG-
NAG splicing events [31,41] that result from competition
between closely spaced AGs during step 2 of splicing [28,42].
It is noteworthy that, even after restricting the analysis in this
way, there remained a modest spike at low AGEZ values.
Further examination of this phenomenon is beyond the scope
of this report but will be examined thoroughly in future work.
Mutations within the AG dinucleotide exclusion zones
There are a number of instances in which human disease is
associated with mutations that introduce new AG dinucle-
otides a short distance upstream of the usual 3' splice site (for
example [43,44]). Use of the new AG as the 3' splice site leads
to insertion of one or more additional peptides, and may
cause a frameshift thus potentially leading to nonsense medi-
ated decay (NMD). Insertion of AG dinucleotides at most
positions within the extended AGEZ of the rat α-TM exon 3
leads to use of the new AG as the 3' splice site in vitro using
single intron substrates [27,28]. Exons with dBPs are there-
fore likely to be vulnerable to mutations within the AGEZ. To
test the possible impacts of mutations that create new AG
dinucleotides within a large AGEZ, we took TM minigenes
containing TM exon 3 flanked by exons 1 and 4 and inserted
AG dinucleotides at 149 or 121 nucleotides upstream of exon
3 (Figure 8; mutants 3a and 3b, respectively). The effect upon
splicing was analyzed in vitro and in vivo. In HeLa nuclear
extract we found that splicing of the mutant substrates
occurred with similar efficiency to wild type, and the major
splicing pathway involved use of exon 3. However, step 2 of
splicing in each case used the newly inserted AG, as had been
seen previously with single intron substrates in vitro [27,28].
When constructs were transfected into HeLa cells the levels of
the product from the mutant constructs were undetectable at
PCR cycle numbers used to detect wild-type product (Figure
8). With further cycles of amplification a small residual
amount of spliced product could be detected in which the nor-
mal 3' splice site of exon 3 had been used (data not shown).
The variation between the in vitro and in vivo data might be
connected to the differences between cotranscriptional splic-
ing in vivo and post-transcriptional splicing in vitro. How-
ever, the simplest interpretation is that splicing in vivo also
occurs predominantly to the upstream AG, but that the prod-
ucts of this reaction are degraded efficiently. These model
substrates illustrate that mutations throughout extended
AGEZs can have catastrophic effects upon gene expression;
Verifying the exon trapping and mutagenesis approach for identifying distant branch pointsFigure 3 (see previous page)
Verifying the exon trapping and mutagenesis approach for identifying distant branch points. The rat α-tropomyosin minigene (TS3St) and a derivative (∆BP-
175), in which the previously determined dBP of exon 3 had been mutated, and an additional mutant (∆BP-175 -182) were transfected into HeLa cells.
Splicing of transiently expressed RNA was analyzed by RT-PCR with a [
32
P]labeled primer in the PCR reaction. dBP, distant branch point; RT-PCR, reverse
transcriptase polymerase chain reaction; WT, wild type.
R1.8 Genome Biology 2006, Volume 7, Issue 1, Article R1 Gooding et al. />Genome Biology 2006, 7:R1
Verification of the predicted dBP of PTB exon 11Figure 4
Verification of the predicted dBP of PTB exon 11. (a) Output for PTB exon 11 from our prototype dataset. 'AGEZ' gives the size of the AGEZ; 'AG' gives
the positions of three AGs upstream of the 3' splice site and two downstream. -2 is the 3' splice site. 'PPT' and 'U2BP' give the positions of predicted PPT
and BPS, with bit scores in square brackets for BPS. 'SEQ1' is the sequence from the third upstream AG to the 3' splice site, whereas 'SEQ2' is the exon
sequence to the second downstream AG. Predicted PPTs are in capitals. See Materials and methods for more detailed explanation of terms. Potential BPS
that were mutagenized are indicated in red and blue. (b) PTB exon 11 and flanking intron sequences were cloned in an EGFP exon trapping vector [21].
Mutants ∆BP-351 and -51 contained the indicated mutations in potential branch points. Constructs were transfected into HeLa cells, and RNA analyzed by
reverse transcriptase polymerase chain reaction. Splicing of exon 11 was abolished in ∆BP-351. AGEZ, AG exclusion zone; BPS, branch point sequence;
dBP, distant branch point; PPT, polypyrimidine tract.
>IDB1087423.10917
GB_MAP: IDB1087423 = AC006273.1 (24538 40398)
PROD: H.sapiens PTB-1 gene for polypirimidine tract binding protein, PTB_HUMAN
AGEZ: 380
ROI: 10495 10920 -> -423 2
AG: -423, -394, -382, -2, 1, 3,
PPT: -368 353, -350 285, -275 266, -249 228, -177 167,
-128 115, -92 78, -64 53, -50 5,
U2BP: -410 [4.1], -384 [4.8], -369 [5.09], -363 [4.02],
-355 [3.57], -351 [7.52], -283 [7.35], -264 [3.1],
-260 [5.39], -207 [3.04], -178 [3.98], -147 [4.21],
-140 [6.09], -132 [7.72], -51 [6.94], -3 [4.44],
SEQ1: aggtaaacctgtaactggaatgtgtgtggagtgtgactgatagaacactacctgaTTCTTA
TGTATTTACTgaCCTGTGTTTTTTTGCTACTTTTTTTCTTTTCTCCCCTTCCCCTTTCCCT
ATTTTTTTTCTTGCCCTgatccggaaTTTCTTTGCCaactgactgcacggtaCTTCTGCTT
CCTGTTGTTGCTTgaaacaaaacaaaaacataaacaaataaaaaacaaaaattccccctca
aaCCCTGCTCTCCggaaaccaacctgcccttgaatattaacatcctgacaaCTTCATCATC
CATCaaccactgcacgcctgcggggaCTGTCTTCCTCGTGTggacgattggcaaCTCGCCC
CCCTTgaCCTCTCCCTCTCCCCTGTCCCTCCGCTGCCTTGCTCTGCTGTCTCTaaag
SEQ2: agag
END
WT
∆BP
-351
∆BP
-51
+ exon 11
- exon 11
∆
BP
-351
UACUGAC UGCUGGC
∆
BP
-51
CCUUGAC CCUUGGC
(a)
(b)
Genome Biology 2006, Volume 7, Issue 1, Article R1 Gooding et al. R1.9
comment reviews reports refereed researchdeposited research interactions information
Genome Biology 2006, 7:R1
however, analysis of in vivo steady state RNAs might not give
any clue that disruption of gene expression is at the level of
splicing.
Discussion
Characterization of exons by upstream AGEZs provides a
novel perspective for branch point prediction. This approach
contrasts with conventional methods, which usually search
for probable branch points within a fixed distance of the 3'
splice site, sometimes using a 3' to 5' polarity for the search
(for example [45]). Although the number of exons with very
large AGEZ is relatively small (165 with AGEZ of 150 nucle-
otides or greater in our data set), there is a much larger
number of exons with AGEZ of 80 nucleotides and more
(2,264 cases), which is likely to include many exons with dBPs
well beyond the conventional 40 nucleotides distance from
the 3' splice site.
Some dBPs can be predicted by an almost mechanical appli-
cation of a 5' to 3' search from the 5' end of the AGEZ (Figures
4, 5, 6). This was the case with GABBR1 exon 23, for which the
AGEZ was 287 nucleotides and a high scoring dBP, subse-
quently verified by mutagenesis, was located at -275 (Figure
5). PTB exon 11 was slightly more complex in that the AGEZ
is 380 nucleotides and, in addition to the verified dBP at -351,
there were two other high scoring potential dBPs at -384 and
-369, and the latter even had an adjacent PPT (Figure 4).
However, the -351 BPS was higher scoring than either of the
upstream candidates and its adjacent PPT is extensive and
uridine rich, whereas the predicted PPT adjacent to -369 has
a number of purine interruptions. The PTB, GABBR1, and
IDB1088375 systems provide an attractive illustration of the
applicability of the AGEZ approach to identifying dBP exons.
However, many of the other large AGEZ exons do not have
such readily predictable dBPs. In some cases there are multi-
ple potential dBPs, and in others there are few or no obvious
candidates.
One of our aims in future work will be to improve the compu-
tational prediction of dBPs taking into account additional
information relating to the quality of the branch point and
PPT sequence, and the distance separating possible branch
point and PPT elements. Some of these approaches have
already been adopted [45]. However, further improvements
in prediction should be facilitated by the experimental verifi-
cation of some of the more 'difficult' dBP exons. Another use-
ful factor to consider is phylogenetic conservation. The BPS of
human-mouse orthologous pairs have been found to be more
highly conserved for alternative than constitutive exons [45].
Comparison of mouse orthologs of the human exons whose
dBPs we verified here (Figures 4, 5, 6) suggests that conserva-
tion of a large AGEZ can help to focus in on a dBP even when
basic local alignment search tool (BLAST) alignments do not
detect significant sequence matches. For example, BLAST
detected only a 24 nucleotides match immediately upstream
of GBBR1 exon 23, even though the mouse had an AGEZ of
264 and predicted dBP at -225 (compared with 287 and -275
for human). Another striking example, as we previously noted
[21], is the Fugu PTB exon 11. Its AGEZ of 590 and predicted
dBP at -566 is remarkable in an organism noted for its com-
pact genome.
We have focused on the use of AGEZs to identify unusually
distant BPS. However, this approach may be a generally use-
ful first step in prediction of all BPS. Previous BPS prediction
approaches have typically used an arbitrary distance
upstream of the 3' splice site within which to search for poten-
tial BPS. For example, both AltExtron [31,32] and the suc-
cessful BPS procedure described by Ast and coworkers [45]
restricted their searches to 100 nucleotides upstream of the
exon. Defining the AGEZ as the first step in BPS prediction
may help to focus the search zone to a much shorter region in
many cases, in addition to the obvious advantage of locating
dBPs that would otherwise be missed.
The significance of the group of probable dBP exons that we
identified is twofold. First, we identified a group of exons with
an increased probability of being alternatively spliced (Figure
7a). In contrast to computational identification of alternative
splicing events by EST alignments [38], our approach is
expected to identify some alternative splicing events for
which there may be no existing experimental data. This is
analogous to the use of extended regions of flanking con-
served sequence as an indicator of alternative splicing [46-
48]. For example, alternative splicing of PTB exon 11 was not
recognized for a long time because the exon skipping event
leads to NMD of the spliced product [21]. Characterization of
the probable dBP arrangement gave us an early suggestion
that exon 11 may indeed be a genuine alternatively spliced
exon. We expect that the initial identification of some exons
as having a probable dBP may provide an initial prediction of
their alternative splicing, and that as more data becomes
available the proportion of dBP exons known to be alterna-
tively spliced will approach 100%.
The second significant point is that the dBP exons are
expected to be vulnerable to mutations within the entire
AGEZ. As we showed, mutations that introduce AG dinucle-
otides at multiple locations in the AGEZ can have highly dis-
ruptive effects. At a minimum, additional amino acids would
be inserted. More catastrophically, the reading frame can be
disrupted. Even in cases in which newly inserted sequence
does not alter the reading frame of the spliced mRNA, the
newly retained intron sequences can apparently lead to deg-
radation. Interestingly, although mutant 3b (Figure 8) is pre-
dicted to lead to NMD, mutant 3a is not, and so degradation
may result directly from the presence of the usually intronic
sequences in the mRNA product. In addition, the regions
between dBPs and their exons are often occupied by regula-
tory elements. Mutations that did not introduce AG dinucle-
otides could have more subtle effects by altering the
R1.10 Genome Biology 2006, Volume 7, Issue 1, Article R1 Gooding et al. />Genome Biology 2006, 7:R1
Figure 5 (see legend on next page)
>IDB1150769.29945
GB_MAP: IDB1150769 = complement( BX000688.11 (69421 101354) )
PROD: gamma-aminobutyric acid (GABA) B receptor, 1
AGEZ: 287
ROI: 29611 29950 -> -335 4
AG: -335, -333, -289, -2, 3, 5,
PPT: -298 293, -274 239, -235 219, -216 201, -198 183,
-180 21, -18 3,
U2BP: -321 [3.33], -312 [4.19], -299 [7.19], -275 [7.65],
-237 [3.41], -226 [4.14], -217 [7.35], -191 [4.18],
-161 [6.16], -148 [5.64], -131 [4.6], -46 [3.87],
SEQ1: agagggatgttccaactgggttgacacatctctctgaTTTATTggaagctctgtgcactga
CTTTTCTCTCCTTCCCCACTTTTTCCTTTTGTTTTTaaaTTCTCTCTTATTTCCCTgaTCG
CATTTTTTCTATCggTATCCTTATGTTCTCTggCTTTTCTTGTTCTGTTTTGATTTCTCCT
TTTAATTTATTCTGTCCACTTACCCTACGTCCTCCCCCTACATTTTTCTGTGCCCTTCCTC
TCTTTCCCTGTGCCCTTCCTCTCTTTCCCTCCTCCCCACTCCTTCATCACCTCCTCTTCTC
CTACTATCCCaaTTGTGCTTCTTCCTCCag
SEQ2: aaagag
END
∆BP
-275
CACUGAC CGCUGGC
∆BP
-217
CCCUGAU CCCUGGU
WT
∆BP
-275
∆BP
-217
+ exon 23
- exon 23
-
(a)
(b)
Genome Biology 2006, Volume 7, Issue 1, Article R1 Gooding et al. R1.11
comment reviews reports refereed researchdeposited research interactions information
Genome Biology 2006, 7:R1
appropriate regulation of exon selection, which can itself be a
molecular cause of pathology [5,6]. Notably most of the
experimentally verified cases of dBPs have regulatory ele-
ments between the 3' splice site and the dBP and PPT
[20,21,23-26]. We have shown effects upon levels of exon
inclusion for multiple mutations in the extended AGEZ of α-
tropomyosin exon 3 [49,50]. Moreover, single nucleotide pol-
ymorphisms (SNPs) that affect the BPS have been shown to
have a dramatic influence on the degree of exon inclusion or
skipping [51]. Given the sensitivity of dBP exons to mutation
within their AGEZ, it is interesting to note that many of the
exons with AGEZ ≥ 150 are within genes that are either
already known to be disease associated or are in some other
way of biomedical interest. So far, we are not aware of any dis-
ease causing mutations within the AGEZs of dBP exons. How-
ever, there are a number of intronic SNPs within some of
them (for example, two within the AGEZ of GABBR1 exon 23;
Figure 5), and it is possible that some of these could modulate
alternative splicing of their associated exons. Indeed, aware-
ness of the possibility of dBPs, as suggested by the presence of
a large AGEZ, might help to improve the design of diagnostic
scans. For example, exons 3, 4 and 5 of the serotonin 5-HT
4
receptor gene (HTR4) have AGEZs of 149, 291, and 221 nucle-
otides (IDB1090103.1894, IDB1090103.27415, and
IDB1090103.40737), an arrangement that is conserved in the
murine ortholog. Polymorphisms in HTR4 have been associ-
ated with bipolar disorder and schizophrenia [52,53]. How-
ever, the PCR primers used to detect polymorphisms were
proximal to the exons and would have missed potentially
interesting SNPs further upstream within the extended
AGEZs.
An interesting feature of the regulation of dBP exons is that
the small group that have been analyzed experimentally are
all regulated by PTB [20,21,24,54,55]. It will be of interest to
determine whether this is a general feature of dBP exons or is
merely a coincidence, and also to investigate whether the dBP
organization is associated with particular types of tissue spe-
cificity of regulation. The collection of extended AGEZs
should also provide an enriched source of sequence elements
involved in splicing regulation.
Conclusion
We have characterized a group of human exons based upon
the large size of the AGEZ immediately upstream. We have
verified the location of the dBP toward the 5' end of some of
these large AGEZs. Exons with large AGEZs have a higher
incidence of computationally observed alternative splicing. If
the common rationale for the dBP arrangement is to have
regulatory elements located between the dBP and exon, then
it is likely that many or most of the dBP exons will ultimately
prove to be alternatively spliced, and that initial characteriza-
tion of a large AGEZ may be a predictor of alternative splicing.
These exons are also of interest because they would be vulner-
able to mutations within their entire AGEZ that could lead to
modification or even loss of gene function. We plan to develop
our data set of dBP exons further with the aims of improving
our predictions for the likely location of dBPs, and of improv-
ing the annotation of the database entries to include evidence
of alternative splicing, locations of known SNPs, or muta-
tions, and the consequences of these known sequence
variants.
Materials and methods
Computational methods
Computational base data
The altExtron data set of transcript confirmed introns and
exons was used as base data (altExtron version 3; based on
GenBank version 147) [31,32,56]. This provides a cleaned
data set of transcript confirmed introns and exons in a
convenient flat-file format. From these data we extracted
67,334 human introns (excluding AT-AC introns), belonging
to 10,527 distinct genes. Here we are considering acceptor (3')
splice sites, and refer to the splice site, downstream exon, or
upstream intron as best suits the context. For each intron/
exon we also extracted from altExtron its status regarding
observed alternative splicing, indicating whether the exon
had been observed as absent in some transcripts (a cassette
exon type alternative splicing event), and/or whether there
was any observed alternative acceptor splice sites (leading to
exon truncation or extension).
Definition of the AGEZ, the region of interest (ROI), and modified
exclusion zone values
For each exon/intron under consideration, the AGEZ was
defined as the distance from the acceptor splice site to the
first upstream AG, ignoring any AG found in the first 12
nucleotides (as explained under Background, see above).
Note that AG dinucleotides are usually absent from this
region (in >90% of cases) compared with equivalent regions
downstream of acceptor sites or on either side of randomly
sampled AGs within the pre-mRNA sequences (for all of
which absence of flanking AGs occurs at around 40%). We
also scan further upstream for the second and third AG, and
Verification of the predicted dBP of GABBR1 exon 23Figure 5 (see previous page)
Verification of the predicted dBP of GABBR1 exon 23. (a) Output for GABBR1 exon 23 from our prototype data set. The various field labels are as
described in the legend to Figure 4. The two magenta colored Ts are sites of single nucleotide polymorphisms and can be T or C. The potential BPS
indicated in bold red and blue were mutagenized. (b) GABBR1 exon 23 and flanking intron sequences were cloned in the EGFP exon trapping vector [21].
Mutants ∆BP-275 and -217 contained the indicated mutations in potential branch points. Constructs were transfected into HeLa cells, and RNA analyzed
by reverse transcriptase polymerase chain reaction. Splicing of exon 23 was abolished in ∆BP-275.
R1.12 Genome Biology 2006, Volume 7, Issue 1, Article R1 Gooding et al. />Genome Biology 2006, 7:R1
Verification of the predicted dBP of IDB1088375 exon 2Figure 6
Verification of the predicted dBP of IDB1088375 exon 2. (a) Output from our prototype data set. The various field labels are as described in the legend to
Figure 4. The potential BPS indicated in bold red and blue were mutagenized. (b) IDB1088375 exon 2 and flanking intron sequences were cloned in the
EGFP exon trapping vector [21]. Mutants ∆BP-160/-166 and -81 contained the indicated mutations in potential branch points. Constructs were transfected
into HeLa cells, and RNA analyzed by reverse transcriptase polymerase chain reaction. Splicing of exon 2 was reduced in ∆BP-160/-166, but not in -81.
WT
∆BP
-160/
166
∆BP
-81
+ exon 2
- exon 2
∆BP -160/166 UCACUAAUCUUAAU UCACUGGUCUUGGU
∆BP -81 GCCUGAU GCCUGGU
(a)
(b)
10 70 8
>IDB1088375.2161
GB_MAP: IDB1088375 = complement( AL109804.41 (101590 106522) )
PROD: not determined
AGEZ: 185
ROI: 1958 2174 -> -204 12
AG: -204, -193, -187, -2, 11, 13,
PPT: -185 168, -159 107, -103 83, -80 3, 1 8,
U2BP: -166 [6.63], -160 [5.79], -140 [4.18], -81 [4.99],
-57 [5.11], -42 [4.67], -2 [3.39],
SEQ1: aggtatgctggagacttagTCTCCTCTACCTATCACTaatcttaaTGTCTTTGTCTCCCTC
CTTATCCTTCCCCTTTCCGCATCTCCACCCCTCCATTgggTTCCACCACTCTGCCATGCCT
gaTTCTCCCACCCCCACCTTCTCTCACCTCCTCCTTCCTTACCCATGCCCCCACTTTCCAT
GTCTGCTCCCCTCTCCCTCag
SEQ2: TCCTTGTTgcagag
END
-
% exon skipping:
Genome Biology 2006, Volume 7, Issue 1, Article R1 Gooding et al. R1.13
comment reviews reports refereed researchdeposited research interactions information
Genome Biology 2006, 7:R1
downstream for the first and second downstream AG dinucle-
otides. A ROI was defined as spanning from the third AG
upstream to the second AG downstream. Note that the ROI
extends to the third upstream AG for two reasons. First, AGs
that are not used as 3' splice sites can be located within a short
distance downstream of the BPS [28,30,45]. In addition, if
the second and third AGs are also widely separated, then this
may indicate that the large AGEZ is not associated with a dBP
(see Results, above). We proceeded to build a flat-file that, for
each intron/exon, included the sequence of the ROI (broken
into the upstream and downstream components), the posi-
tions of the identified AG dinucleotides, and the positions of
putative PPT and U2 BPS (described below). This flat-file
forms the base data set for ongoing computational work into
the sequence elements that define and constrain acceptor
splice sites.
For the purposes of constructing and analyzing Figure 2,
modified exclusion zone (mod-EZ) values were used. For each
dinucleotide, we defined mod-EZ
1
by searching upstream
from position -25 (relative to the 3' splice site) for the first
occurrence of the dinucleotide. A further shift of -25 from the
AG that terminated the corresponding mod-EZ
1
was per-
formed before commencing the search to define the mod-EZ
2
.
This definition acts to exclude the region immediately
upstream of the 3' splice site within which the PPT is most
often found, and hence minimize bias in the EZ
1
distributions
caused by this pyrimidine-rich region. Furthermore, we have
observed that the occurrence of an AG (and all other dinucle-
otides) is not an independent event in that the observed prob-
ability that a dinucleotide under consideration is an AG is
greater if there is a nearby AG than otherwise (data not
shown). Thus, by including the -25 shift at the start of the
mod-EZ
2
search, we treat the EZ
1
and EZ
2
searches equally in
this regard. Note that use of these mod-EZ values is expected
to be conservative in demonstrating the postulated differ-
ences between the AGEZ
1
and AGEZ
2
distributions. Finally,
and again just for the purpose of constructing Figure 2,
introns of length less than 350 nucleotides were excluded for
the following reasons: first, we observe overall an increased
frequency of AG dinucleotides in exons compared to introns
(by close to 10%; data not shown); and, secondly, the last two
nucleotides of an exon are AG in around 50% of cases. Hence,
we do not want the EZ
2
to extend into exonic regions, which is
Prevalence of alternative splicing as a function of AGEZ sizeFigure 7
Prevalence of alternative splicing as a function of AGEZ size. For both plots, acceptor sites were excluded from consideration if there was another
acceptor site ≤ 40 nucleotides upstream (see Materials and methods). In order to constrain the domain of the plots, all AGEZ values greater than 300
nucleotides were taken as 300 nucleotides. For both plots the standard error was calculated as sqrt(r·(n - r)/n), with n being the total number of acceptor
sites/introns in the group, and r being the number of these seen to undergo alternative splicing of the defined type. See Materials and methods for further
details. (a) Frequency of observed cassette exon alternative splicing as a function of the AGEZ for considered acceptor sites. The overall average is 19.8%
(red line). The three data points representing AGEZ ≥ 150 nucleotides correspond to 197 exons with an average 32.5% observed cassette alternative
exons. (b) Frequency of observed 3' splice site exon isoform alternative splicing as a function of the AGEZ for considered acceptor sites. The overall
average is 9.6% (red line), with the first data point representing 8,657 exons having AGEZ values between 12 and 19 inclusive, and with 15.1% of these
having observed acceptor site isoforms (intriguingly these are not a consequence of examining the downstream of two closely spaced acceptor sites
because these have been excluded). AGEZ, AG exclusion zone.
0 50 100 150 200 250 30
0
0
0.1
0.2
0.3
0.4
AG exclusion zone
Observed frequency cassette exon
s
observed
average
0 50 100 150 200 250 30
0
0
0.1
0.2
0.3
0.4
AG exclusion zone
Observe frequency exon isoform
s
observed
average
(b)(a)
R1.14 Genome Biology 2006, Volume 7, Issue 1, Article R1 Gooding et al. />Genome Biology 2006, 7:R1
avoided in all but the most extreme cases by application of
this length restriction. Note that 50% of mod-AGEZ
1
values
are ≤ 13 nucleotides and 90% are ≥ 40 nucleotides.
Base composition issues, interpretation of the mod-AGEZ1 shoulder,
and predicted frequency of distant branch points
Heterogeneity in the base composition between sequences is
an important and often problematic aspect of analyses of the
sort presented here. In addition to the consequences arising
from the dynamics of overall compositional biases, there may
also be subsets of the data in which aspects of the composition
are under quite specific selective pressures; indeed, the
behavior of AG dinucleotides that we are examine here is pre-
cisely such an effect and it might be that there are numerous
other phenomena of this flavor affecting the composition of
subsets of the data. As a first step to ameliorating the conse-
quences of such effects, we designed the analysis around the
comparison of EZ
1
and EZ
2
distributions, in which each intron
contributes one datum to each of these distributions (for each
dinucleotide under consideration).
Initially we attempted to model the curves as resulting from a
process analogous to a series of coin tosses, in which the
chance of observing the terminating dinucleotide at each step
in the scan was a constant, like that of obtaining a head in the
toss of a fair coin, which remains one half irrespective of what
has happened previously. This assumption allowed us to
model these EZ curves as negative binomial distributions
and, we thought, this would lead to straightforward
quantification of the differences between the pairs of EZ
1
and
Mutations that insert AG dinucleotides in a large AGEZ impair gene expressionFigure 8
Mutations that insert AG dinucleotides in a large AGEZ impair gene expression. (a) Rat α-tropomyosin (TM) minigene constructs and sequence between
exon 3 branch point (in bold) and 3' splice site CAG. The underlined Ts are positions where mutagenesis to A created a new AG dinucleotide in mutants
3a and b. (b) In vitro spliced [
32
P]labelled RNA was analyzed by phosphorimaging after denaturing PAGE. The fully spliced 134 product is indicated by the
black diamonds, and the intron lariat resulting from excision of the intron between exons 1 and 3 by the open circles. The sizes of these two bands varied,
consistent with use of the first AG downstream of the dBP for splicing of exon 3. (c) Reverse transcriptase polymerase chain reaction analysis of
transiently expressed constructs in HeLa cells. No bands corresponding to skipping or inclusion of exon 3 using either AG dinucleotide were observed in
mutants 3a and 3b. The wild type construct shows a band corresponding to spliced exons 1-3-4. WT, wild type;
Time (h): 0 1 2 3 01230123
WT 3a 3b
intron 1-3
(b)
intron 3-4
GCCTAACTTTCTCTTTCTCTCTCCCTCCCTG
TCTTTCCCTCTCTCTCTCTTTCCCGCT
GTCC
CTGTCCTTTATGGTCTACGCACCCTCAACCC
GCACCTTGCGGGATCACGCTGCCTGCTGCAC
CCCACCCCCTTCCCCCTTCCTTCCCCCCACC
CCCGTACTCCACTGCCAACTCCCAG
3a
3b
1 3 4
AG
a b
αTM134
WT 3b3a Mock
TM
β-actin
(a)
(c)
Genome Biology 2006, Volume 7, Issue 1, Article R1 Gooding et al. R1.15
comment reviews reports refereed researchdeposited research interactions information
Genome Biology 2006, 7:R1
EZ
2
distributions. We were unable to obtain good and robust
fits of this model to the data, which led to exploration of the
underling base composition dynamics. Importantly, we found
that (for all dinucleotides) the overall chance of terminating
at the next step in the scan decreased substantially as the dis-
tance scanned increased (data not shown). We came to
understand this effect as resulting from heterogeneity across
the gene sequences; that is, as the region scanned becomes
long it becomes more probable that the gene/intron being
examined has base composition dynamics that tend to
exclude the dinucleotide under consideration. Although these
facts prevented our analysis from proceeding along the path
of fitting distributions to the data, Figure 2 suggests that - at
a gross level - these dynamics affect the EZ
1
and EZ
2
distribu-
tions equally.
We also specifically examined the overall observed probabil-
ity of an AG occurring close to either a 3' splice site AG or an
AG randomly selected from within the pre-mRNA sequence.
A randomly selected AG was seen to have a 60% chance of
having another AG in the 12 nucleotides immediately
upstream, as compared with only around 10% for a 3' splice
site AG. In both cases the region 12 nucleotides immediately
downstream also had a 60% chance of containing an AG.
Thus, the regions immediately upstream of 3' splice site have
a greatly decreased occurrence of AG, leading to a concern
that comparison of simple EZ distributions (in which the EZ
2
starts immediately where the EZ
1
ends) was not a fair compar-
ison. That is, the EZ
2
values would tend to be shorter than
they might otherwise be because scanning starts in a region
that has an increased chance of containing the dinucleotide
under consideration. A further related concern is that,
although heterogeneity between the sequences in the data set
may be contained, heterogeneity within an intron could affect
our analysis. The positional bias in pyrimidine composition
within introns is an obvious candidate for introducing this
sort of bias. It was for these reasons that the mod-EZ defini-
tion was developed, whereby the inequality between the
AGEZ
1
and AGEZ
2
distributions arising from starting the
AGEZ
2
scan immediately where the AGEZ
1
terminated was
avoided, and whereby much of the bias that might arise from
the presence of PPTs immediately upstream of 3' splice site
was also avoided.
The analysis of Figure 2 given in the Results section (see
above) focused on the shoulder observed for mod-AGEZ
1
, and
specifically that there are 148 introns with mod-AGEZ
2
≥ 100
and 279 such introns for the mod-AGEZ
1
curve, leading to a χ
2
value of 116 and a P value close to zero. An equivalent analysis
of the other dinucleotides was undertaken as follows: deter-
mine the position for the mod-EZ
2
curve at which its tail con-
tains close to but no fewer than 148 introns, this being in
order to have analysis equivalent to the AG case; and, using
this cutoff position, compare with the tail of the correspond-
ing mod-EZ
1
curve (Table 1). It was thus seen that significant
differences also exist for other dinucleotides. In addition to
the stand out case of AG, it was seen that highly significant
biases exist toward TC and CT and against AA, GA, and GG in
the mod-EZ
1
regions; that there is substantially significant
bias towards TA and CA; that there is marginally significant
bias toward TG and against GC and AT; and that there is no
significant bias for AC, CC, CG, GT and TT.
Examination of Table 1 revealed a series of biases that
strongly suggest that the presence of PPT sequences in some
mod-AGEZ
1
regions were acting to generate for GA, GG and
AA lesser biases of the same sort observed for AG. For
instance, if our model had been that scanning took place for a
GA, then we might conclude that a GAEZ
1
of ≥100 nucleotides
had an approximately 158/211 (75%) observed probability of
arising by chance alone, and the complementary 25%
observed probability of indicating a dBP. We have no reason
to suppose there is any such scanning for GA, and every
reason to suppose that this difference between the mod-
GAEZ
1
and mod-GAEZ
2
curves is a straightforward conse-
quence of PPT sequences in some mod-GAEZ
1
regions acting
to bias the mod-GAEZ
1
distribution to higher values. Should
we attribute, for AG, this same effect to some part of the 47%
that we have provisionally attributed to dBPs? For the AA,
GA, and GG binucleotides there are tail mod-EZ
1
excesses as
Table 1
Analysis of the curve pairs from Figure 2
Dinucleotide C EZ
2
EZ
1
χ
2
AA 218 148 211 26.8
AC 143 149 129 2.7
AG 100 148 279 116.0
AT 186 149 173 3.9
CA 98 151 187 8.6
CC 227 151 161 0.7
CG 1,039 148 150 0.0
CT 96 150 86 27.3
GA 120 158 211 17.8
GC 186 148 173 4.2
GG 203 150 200 16.7
GT 111 149 153 0.1
TA 292 149 185 8.7
TC 131 150 77 35.5
TG 74 149 123 4.5
TT 177 148 157 0.5
Shown is an analysis of the curve pairs from Figure 2 comparing the
tails of the modified exclusion zone (mod-EZ)
1
and mod-EZ
2
distributions for each dinucleotide above a cutoff (C). This cutoff is the
point at which the mod-EZ
2
tail contains close to but no fewer than
148 entries (in order to have analysis equivalent to the AG case). The
EZ
2
and EZ
1
columns give the observed numbers of entries above C,
and the χ
2
column gives the associated χ
2
value. Note that, with one
degree of freedom, a χ
2
value of 4 gives a P value close to 0.05; thus, χ
2
values < 4 are not statistically significant.
R1.16 Genome Biology 2006, Volume 7, Issue 1, Article R1 Gooding et al. />Genome Biology 2006, 7:R1
for AG of 33%, 25%, and 25%, respectively, averaging to 28%;
if a correction were to be applied for AG, then it would dis-
count the 47% by this amount to 19%.
A further simple analysis sheds some light on this question.
We broke the mod-AGEZ
1
distribution into two parts on the
basis of there being an AG in the region -12 to -25 (the 'plus'
group), and the complementary 'minus' group without an AG
in this region. We then looked at the fraction of the mod-
AGEZ
1
values ≥100 nucleotides for each of these two groups
and found for the plus group 22/10,330 (0.21%) of the mod-
AGEZ1 values at ≥ 100. In contrast, if there were no AG in the
region -12 to -25 (the minus group), then we see 257/39,546
(0.65%) with mod-AGEZ
1
≥ 100. With a null hypothesis that
the minus group should generate the same statistics as the
plus group, we see the null hypothesis to be false with a χ
2
of
356 (P ≈ 0). This compares with tails ≥ 100 for the mod-
AGEZ
1
and mod-AGEZ
2
curves shown in Figure 2 of 0.57%
and 0.30%, respectively. That the magnitude of the mod-
AGEZ
1
tail is less than that for the 'minus' group above (at
0.58% compared to 0.65%) is expected because the mod-
AGEZ
1
includes both the plus and minus groups (and is thus
a conservative measure). That the magnitude of the mod-
AGEZ
2
tail is greater than the 'plus' group (at 0.30% versus
0.21%) is not statistically significant (P = 0.2), and in any case
is expected because the presence of an AG in -12 to -25
increases the chance of observing an AG shortly after -25
compared with the minus group. This analysis confirms that
the shoulder seen for mod-AGEZ
1
is not a general feature of
the sequence composition at the 3' ends of introns independ-
ent of the splicing signals, but rather is a consequence of
dBPs.
There are at least two ways to think about the difference
between the mod-AGEZ
1
and mod-AGEZ
2
curves in Figure 2.
On the one hand it may seem the curves demonstrate that if
an AGEZ value of 100 nucleotides or more is observed, then
there is an approximately 50% (148/279 = 0.53) probability
that this has arisen by chance alone, and a complementary
50% probability that a dBP is the causative factor. On the
other hand it may seem that the presence of PPTs at the 3' end
of introns can push the mod-AGEZ
1
distribution toward
higher values and thus introduce a bias that is not fully
accounted for (as above). If it is accepted that the scanning
model is true, along with the implication that AG dinucle-
otides will only in rare circumstances be found in the region
from about 15 nucleotides downstream of the BPS to about 12
nucleotides upstream of the 3' splice site, then the fact that
PPTs influence the base composition in this region is a conse-
quence of the position of the BPS, and thus is immaterial in
relation to interpretation of the shoulder observed for mod-
AGEZ
1
in comparison with mod-AGEZ
2
in Figure 2. This is
what we contend. If our contention is not accepted, then it is
necessary to discount the portion of AGEZ
1
values ≥ 100, indi-
cating a dBP from around 50% to around 20% (as above).
Identification of putative polypyrimidine tract and branch point
sequence signals
Putative PPTs were identified in the ROI, as defined by Clark
and Thanaraj [31]. Putative U2 BPS identification utilized the
heptamer consensus YNYURAY (ideally UACUGAC) and the
AGEZ according to the following heuristic procedure (follow-
ing [31]): for introns with an AGEZ ≤ 40 nucleotides, a
sequence fragment equal in length to the AGEZ but shifted
upstream 15 nucleotides was searched for matches to the
above consensus allowing a single mis-match at any position
other that the branch point adenosine; in cases in which one
and only one such match was found, this sequence contrib-
uted to the building of a weight matrix that was then used to
search the ROI of all introns to identify and score putative U2
BPS. The derived weight matrix is given in Table 2 and may
be contrasted with the weight matrix used in recent work
from the Ast laboratory [45] that is given in Table 3. Although
these two tables show some minor differences, it is difficult to
draw any strong conclusions given the relatively small
number (19) of sequences used by Kol and coworkers [45] to
build Table 3. It is, however, noted that our method essen-
tially reflects the consensus sequence used to build it.
Output files
The flat files of acceptor splice sites, with information about
putative PPT and U2 BPS is available online [33] and contains
entries of the form:
>IDB1072296.1230
GB_MAP: IDB1072296 = A06939.1 (1 5322)
PROD: furin
Table 2
Derived weight matrix for identifying and scoring human branch
point sequences
A 0.090 0.247 0.037 0.090 0.359 1.000 0.071
C 0.430 0.283 0.583 0.048 0.087 0.000 0.469
G 0.084 0.216 0.070 0.048 0.517 0.000 0.127
T 0.395 0.254 0.311 0.814 0.036 0.000 0.333
Table 3
Weight matrix from 19 experimentally determined human
branch point sequences
A 0.158 0.368 0.000 0.000 0.263 1.000 0.211
C 0.368 0.211 0.632 0.211 0.316 0.000 0.526
G 0.211 0.158 0.158 0.000 0.263 0.000 0.053
T 0.263 0.263 0.211 0.789 0.158 0.000 0.211
The experimentally determined human branch point sequences were
reported by Kol and coworkers [45].
Genome Biology 2006, Volume 7, Issue 1, Article R1 Gooding et al. R1.17
comment reviews reports refereed researchdeposited research interactions information
Genome Biology 2006, 7:R1
AGEZ: 27
ROI: 1181 1265 -> -50 34
AG: -50, -47, -29, -2, 3, 35,
PPT: -42 33, -23 5, 5 14,
U2BP: -31 [5.49], -24 [5.2], 11 [4.58],
SEQ1:
agaaggcaCTCTGTGCCTgacagctgaCCCTACCTTCCCTGTCCC
Cacag
SEQ2: tgagCCACTCATATggctacgggcttttggacgcag
END
'IDB1072296.1230', in this case, is the altExtron identifier for
the gene (IDB1072296), with a transcript confirmed intron
having a 3' splice site position (1230) being the position of the
final intronic nucleotide. 'GB_MAP' gives the mapping to the
GenBank entry from which this gene was derived as the acces-
sion, version, and (region). If the gene is on the complement
strand in GenBank (always sense in altExtron), then the map-
ping will be labelled as complement. 'PROD' is the gene prod-
uct as parsed from the GenBank flat files in the construction
of altExtron. 'AGEZ' gives the AG exclusion zone. 'ROI' gives
the ROI (see above), first in gene coordinates and then rela-
tive to the 3' splice site (with no position 0). 'AG' lists the rel-
ative positions of the AG nucleotides in the ROI, including the
splice site itself at -2. 'PPT' gives the relative positions of puta-
tive PPTs in the ROI. 'U2BP' gives the relative positions of
putative U2 BPS, with the bracketed number being the bit
score from the weight matrix analysis. 'SEQ1' gives the
intronic sequence part of the ROI with the putative PPTs in
upper case (this may wrap over several lines). 'SEQ2' gives (as
for SEQ1) the exonic sequence part of the ROI. Finally, 'END'
is a tag helpful in file parsing that indicates the end of the
record.
Frequency of alternative splicing versus AG dinucleotide exclusion
zone
We examined the level of observed alternative splicing as a
function of the AGEZ. Transcript confirmed introns/exons
were seen to undergo alternative splicing when they were
overlapped by other transcript confirmed introns/exons, and
this information was derived from the altExtron flat files. We
considered only those observed alternative splicing events
that unambiguously fitted into one of two classes of alterna-
tive splicing: cassette exon usage (of an exon adjacent to the
3' splice site under consideration), and exon modification at
the acceptor site (extension or truncation by use of competing
3' splice site). In both cases we excluded from consideration
(for Figure 7) any acceptor site where another acceptor site
was observed ≥ 40 nucleotides upstream. This prevents such
an upstream 3' splice site defining the AGEZ in all but
extreme cases, and acts to select the upstream AG in cases
where an isoform pair share a BPS and PPT but differ in the
use of two closely spaced AGs for the 3' splice site. Acceptor
sites were grouped according to AGEZ value, initially into
decade bins, with these then combined as necessary to ensure
a minimum of 50 entries per group; as plotted in Figure 7, the
fraction of each group with observed alternative splice iso-
forms was calculated. The standard error was calculated as
sqrt(r·(n - r)/n), with n being the total number of introns in
the group, and r being the number of these seen to undergo
alternative splicing of the defined type.
For the purposes of statistically testing the hypothesis that
exons with large AGEZ values are observed to be alternative
exons at a higher frequency than exons with lesser AGEZ val-
ues, a cutoff of 100 nucleotides was used to define 'large'.
Above this cutoff, 68 out of 235 exons were seen to be cassette
exons, as compared with an expected value of 47 (on the basis
of the overall average of 19.8%); this leads to a χ
2
value of 9.4,
giving a P value of 0.002.
Molecular and cell biology
Constructs
PAC clones, RPI-271M21 (IDB1089010) and RP5-1009E24
(IDB1088375), were obtained from The Sanger Institute
Clone Resources Group. PAC clones were tested for bacteri-
ophage contamination by standard procedures [57]. The ROI
was PCR amplified using Pfu polymerase, treated with Taq
polymerase to add an A overhang, and ligated into pGEM-
Teasy (Promega, Madison, WI, USA) as a shuttle vector.
PCR primers for IDB1089010 were as follows: forward 5'-
CCTCTAGTAGTCAACACTCACAGCAGC; and reverse 5'-
GGATAGCATGTTCTTCCCAGCTGG. PCR primers for
IDB1088375 were as follows: forward 5'-CCCAAAGTGTT-
GGGATTACAGG; and reverse 5'-CGGACGAATTCTGTCT-
GCGTTGAC.
Branchpoint and upstream AG mutations were carried out
using QuikChange Site-Directed Mutagenesis (Stratagene, La
Jolla, CA, USA) in the Teasy clones. Wild-type and mutant
clones were subcloned using standard cloning techniques
[58] from the shuttle vector either as a NotI fragment into
pCAGGsEGFP [21,59] or as an EcoRI fragment into pTS3St
[26,60]. All subcloned fragments were sequenced in their
entirety to ensure that no constructs had secondary
mutations.
Cell culture, transfection, and analysis of cellular RNA
HeLa cells were grown in Dulbecco's modified Eagles
medium containing 10% foetal calf serum. Transient
transfection was carried out using Lipofectamine (Invitrogen,
Carlsbad, CA, USA), total RNA was isolated using TRI reagent
(Sigma, Poole, Dorset, USA), and RT-PCR was carried out as
previously described [55]. Primers for pCAGGsEGFP based
R1.18 Genome Biology 2006, Volume 7, Issue 1, Article R1 Gooding et al. />Genome Biology 2006, 7:R1
constructs were as follows: RT primer 3'CGRT, 5'-TAGTTG-
TACTCCAGCTT; forward 5'CGTM, 5'-GGCAAAGAAT-
TCGCCACCA; and reverse 3'CGTM, 5'-
GGGTGTCGCCCTCGAACTT. Conditions for the PCR were 30
cycles of 94°C at 30 s, an annealing temperature of 58°C for
30 s, followed by an extension at 72°C for 1 minute using a
MgCl
2
concentration of 1.5 mmol/l.
Primers for pTS3St based constructs were as follows: RT
primer SV3'RT, 5'-GCAAACTCAGCCACAGGT; forward
SV5'2, 5'-GGAGGCCTAGGCTTTTGCAAAAAG; reverse
SV3'1, 5'-ACTCACTGCGTTCCAGGCAATGCT. Conditions for
the PCR were 30 cycles of 94°C for 30 s, an annealing temper-
ature of 62°C for 30 s, followed by an extension at 72°C for 1
minute using a MgCl
2
concentration of 2.5 mmol/l.
In vitro splicing
In vitro transcription and splicing were carried out as previ-
ously described [55,60].
Additional data files
The following additional data are included with the online
version of this article: A data file containing the complete set
of sequences used in the analysis (Additional data file 1) and
a data file with the subset of entries with AGEZ> = 150 nt
(Additional data file 2) Data are also available online [33].
Scripts are available on request.
Additional data file 1The complete set of sequences used in the analysisThe complete set of sequences used in the analysisClick here for fileAdditional data file 2A data file with the subset of entries with AGEZ> = 150 ntA data file with the subset of entries with AGEZ> = 150 ntClick here for file
Acknowledgements
This work was funded by programme grant 059879 from the Wellcome
Trust to C.W.J.S. We thank the Mapping Core group at the Sanger Institute
for PAC clones, Alphonse Thanaraj for suggesting the collaboration
between C.W.J.S and F.C., and Igor Vorechovsky for helpful comments on
the manuscript. F.C. thanks the Australian Academy of Science for a travel
fellowship to support a visit to the UK.
References
1. Black DL: Mechanisms of alternative pre-messenger RNA
splicing. Annu Rev Biochem 2003, 72:291-336.
2. Caceres JF, Kornblihtt AR: Alternative splicing: multiple control
mechanisms and involvement in human disease. Trends Genet
2002, 18:186-193.
3. Matlin AJ, Clark F, Smith CW: Understanding alternative splic-
ing: towards a cellular code. Nat Rev Mol Cell Biol 2005,
6:386-398.
4. Maniatis T, Tasic B: Alternative pre-mRNA splicing and pro-
teome expansion in metazoans. Nature 2002, 418:236-243.
5. Faustino NA, Cooper TA: Pre-mRNA splicing and human
disease. Genes Dev 2003, 17:419-437.
6. Garcia-Blanco MA, Baraniak AP, Lasda EL: Alternative splicing in
disease and therapy. Nat Biotechnol 2004, 22:535-546.
7. Pagani F, Baralle FE: Genomic variants in exons and introns:
identifying the splicing spoilers. Nat Rev Genet 2004, 5:389-396.
8. Burge C, Tuschl T, Sharp P: Splicing precursors to mRNAs. In
The RNA World 2nd edition. Edited by: Gestetland R, Cech T, Atkins
J. Cold Spring Harbor: Cold Spring Harbor Laboratory Press;
1999:525-560.
9. Cartegni L, Chew SL, Krainer AR: Listening to silence and under-
standing nonsense: exonic mutations that affect splicing. Nat
Rev Genet 2002, 3:285-298.
10. Blencowe BJ: Exonic splicing enhancers: mechanism of action,
diversity and role in human genetic diseases. Trends Biochem
Sci 2000, 25:106-110.
11. Tacke R, Manley JL: The human splicing factors ASF/SF2 and
SC35 possess distinct, functionally significant RNA binding
specificities. EMBO J 1995, 14:3540-3551.
12. Liu HX, Zhang M, Krainer AR: Identification of functional exonic
splicing enhancer motifs recognized by individual SR
proteins. Genes Dev 1998, 12:1998-2012.
13. Coulter LR, Landree MA, Cooper TA: Identification of a new
class of exonic splicing enhancers by in vivo selection. Mol Cell
Biol 1997, 17:2143-2150.
14. Tian H, Kole R: Selection of novel exon recognition elements
from a pool of random sequences. Mol Cell Biol 1995,
15:6291-6298.
15. Fairbrother WG, Yeh RF, Sharp PA, Burge CB: Predictive identifi-
cation of exonic splicing enhancers in human genes. Science
2002, 297:1007-1013.
16. Zhang XH, Chasin LA: Computational definition of sequence
motifs governing constitutive exon splicing. Genes Dev 2004,
18:1241-1250.
17. Helfman DM, Ricci WM: Branch point selection in alternative
splicing of tropomyosin pre-messenger RNAs. Nucleic Acids
Res 1989, 17:5633-5650.
18. Goux-Pelletan M, Libri D, d'Aubenton-Carafa Y, Fiszman M, Brody E,
Marie J: In vitro splicing of mutually exclusive exons from the
chicken β-tropomyosin gene: role of the branch point and
very long pyrimidine stretch. EMBO J 1990, 9:241-249.
19. Smith CW, Nadal-Ginard B: Mutually exclusive splicing of alpha-
tropomyosin exons enforced by an unusual lariat branch
point location: implications for constitutive splicing. Cell
1989, 56:749-758.
20. Southby J, Gooding C, Smith CW: Polypyrimidine tract binding
protein functions as a repressor to regulate alternative splic-
ing of alpha-actinin mutually exclusive exons. Mol Cell Biol
1999, 19:2699-2711.
21. Wollerton MC, Gooding C, Wagner EJ, Garcia-Blanco MA, Smith
CW: Autoregulation of polypyrimidine tract binding protein
by alternative splicing leading to nonsense-mediated decay.
Mol Cell 2004, 13:91-100.
22. Reed R: The organization of 3' splice-site sequences in mam-
malian introns. Genes Dev 1989, 3:2113-2123.
23. Libri D, Goux-Pelletan M, Brody E, Fiszman MY: Exon as well as
intron sequences are cis-regulating elements for the mutu-
ally exclusive alternative splicing of the beta tropomyosin
gene. Mol Cell Biol 1990, 10:5036-5046.
24. Mulligan GJ, Guo W, Wormsley S, Helfman DM: Polypyrimidine
tract binding protein interacts with sequences involved in
alternative splicing of beta-tropomyosin pre-mRNA. J Biol
Chem 1992, 267:25480-25487.
25. Gallego ME, Balvay L, Brody E: cis-acting sequences involved in
exon selection in the chicken beta-tropomyosin gene. Mol
Cell Biol 1992, 12:5415-5425.
26. Gooding C, Roberts GC, Moreau G, Nadal-Ginard B, Smith CW:
Smooth muscle-specific switching of alpha-tropomyosin
mutually exclusive exon selection by specific inhibition of the
strong default exon. EMBO J 1994, 13:3861-3872.
27. Smith CW, Porro EB, Patton JG, Nadal-Ginard B: Scanning from an
independently specified branch point defines the 3' splice site
of mammalian introns. Nature 1989, 342:243-247.
28. Smith CW, Chu TT, Nadal-Ginard B: Scanning and competition
between AGs are involved in 3' splice site selection in mam-
malian introns. Mol Cell Biol 1993, 13:4939-4952.
29. Liu ZR, Laggerbauer B, Luhrmann R, Smith CW: Crosslinking of the
U5 snRNP-specific 116-kDa protein to RNA hairpins that
block step 2 of splicing. RNA 1997, 3:1207-1219.
30. Chua K, Reed R: An upstream AG determines whether a
downstream AG is selected during catalytic step II of
splicing. Mol Cell Biol 2001, 21:1509-1514.
31. Clark F, Thanaraj TA: Categorization and characterization of
transcript-confirmed constitutively and alternatively spliced
introns and exons from human. Hum Mol Genet 2002,
11:451-464.
32. The altExtron dataset [ />33. A class of human exons with predicted distant branch points
revealed by analysis of AG dinucleotide exclusion zones
[ />34. Markovtsov V, Nikolic JM, Goldman JA, Turck CW, Chou M-Y, Black
DL: Cooperative assembly of an hnRNP complex induced by
a tissue-specific homolog of polypyrimidine tract binding
Genome Biology 2006, Volume 7, Issue 1, Article R1 Gooding et al. R1.19
comment reviews reports refereed researchdeposited research interactions information
Genome Biology 2006, 7:R1
protein. Mol Cell Biol 2000, 20:7463-7479.
35. Polydorides AD, Okano HJ, Yang YYL, Stefani G, Darnell RB: A
brain-enriched polypyrimidine tract-binding protein antago-
nizes the ability of Nova to regulate neuron-specific alterna-
tive splicing. Proc Natl Acad Sci USA 2000, 97:6350-6355.
36. Ruskin B, Krainer AR, Maniatis T, Green MR: Excision of an intact
intron as a novel lariat structure during pre-mRNA splicing
in vitro. Cell 1984, 38:317-331.
37. Mullen MP, Smith CW, Patton JG, Nadal-Ginard B: Alpha-tropomy-
osin mutually exclusive exon selection: competition
between branchpoint/polypyrimidine tracts determines
default exon choice. Genes Dev 1991, 5:642-655.
38. Modrek B, Lee C: A genomic view of alternative splicing. Nat
Genet 2002, 30:13-19.
39. Penalva LO, Lallena MJ, Valcarcel J: Switch in 3' splice site recog-
nition between exon definition and splicing catalysis is
important for sex-lethal autoregulation. Mol Cell Biol 2001,
21:1986-1996.
40. Lallena MJ, Chalmers KJ, Llamazares S, Lamond AI, Valcarcel J: Splic-
ing regulation at the second catalytic step by Sex-lethal
involves 3' splice site recognition by SPF45. Cell 2002,
109:285-296.
41. Hiller M, Huse K, Szafranski K, Jahn N, Hampe J, Schreiber S, Backofen
R, Platzer M: Widespread occurrence of alternative splicing at
NAGNAG acceptors contributes to proteome plasticity. Nat
Genet 2004, 36:1255-1257.
42. Scadden ADJ, Smith CWJ: Interactions between the terminal
bases of mammalian introns are retained in inosine-contain-
ing pre-mRNAs. EMBO J 1995, 14:3236-3246.
43. Spritz RA, Jagadeeswaran P, Choudary PV, Biro PA, Elder JT, deRiel
JK, Manley JL, Gefter ML, Forget BG, Weissman SM: Base substitu-
tion in an intervening sequence of a beta+-thalassemic
human globin gene. Proc Natl Acad Sci USA 1981, 78:2455-2459.
44. Zeniou M, Gattoni R, Hanauer A, Stevenin J: Delineation of the
mechanisms of aberrant splicing caused by two unusual
intronic mutations in the RSK2 gene involved in Coffin-
Lowry syndrome. Nucleic Acids Res 2004, 32:1214-1223.
45. Kol G, Lev-Maor G, Ast G: Human-mouse comparative analysis
reveals that branch-site plasticity contributes to splicing
regulation. Hum Mol Genet 2005, 14:1559-1568.
46. Philipps DL, Park JW, Graveley BR: A computational and experi-
mental approach toward a priori identification of alterna-
tively spliced exons. RNA 2004, 10:1838-1844.
47. Sorek R, Ast G: Intronic sequences flanking alternatively
spliced exons are conserved between human and mouse.
Genome Res 2003, 13:1631-1637.
48. Sorek R, Shemesh R, Cohen Y, Basechess O, Ast G, Shamir R: A non-
EST-based method for exon-skipping prediction. Genome Res
2004, 14:1617-1623.
49. Gromak N, Smith CW: A splicing silencer that regulates
smooth muscle specific alternative splicing is active in multi-
ple cell types. Nucleic Acids Res 2002, 30:3548-3557.
50. Gromak N, Rideau A, Southby J, Scadden AD, Gooding C, Huttel-
maier S, Singer RH, Smith CW: The PTB interacting protein
raver1 regulates alpha-tropomyosin alternative splicing.
EMBO J 2003, 22:6356-6364.
51. Kralovicova J, Houngninou-Molango S, Kramer A, Vorechovsky I:
Branch site haplotypes that control alternative splicing. Hum
Mol Genet 2004, 13:3189-3202.
52. Suzuki T, Iwata N, Kitamura Y, Kitajima T, Yamanouchi Y, Ikeda M,
Nishiyama T, Kamatani N, Ozaki N: Association of a haplotype in
the serotonin 5-HT4 receptor gene (HTR4) with Japanese
schizophrenia. Am J Med Genet B Neuropsychiatr Genet 2003,
121:7-13.
53. Ohtsuki T, Ishiguro H, Detera-Wadleigh SD, Toyota T, Shimizu H,
Yamada K, Yoshitsugu K, Hattori E, Yoshikawa T, Arinami T: Asso-
ciation between serotonin 4 receptor gene polymorphisms
and bipolar disorder in Japanese case-control samples and
the NIMH Genetics Initiative Bipolar Pedigrees. Mol Psychiatry
2002, 7:954-961.
54. Grossman JS, Meyer MI, Wang YC, Mulligan GJ, Kobayashi R, Helfman
DM: The use of antibodies to the polypyrimidine tract bind-
ing protein (PTB) to analyze the protein components that
assemble on alternatively spliced pre-mRNAs that use dis-
tant branch points. RNA 1998, 4:613-625.
55. Wollerton MC, Gooding C, Robinson F, Brown EC, Jackson RJ, Smith
CW: Differential alternative splicing activity of isoforms of
polypyrimidine tract binding protein (PTB). RNA 2001,
7:819-832.
56. Thanaraj TA, Stamm S, Clark F, Riethoven JJ, Le Texier V, Muilu J:
ASD: the alternative splicing database. Nucleic Acids Res
2004:D64-D69.
57. Gene Service Phage Testing Assay [eserv
ice.co.uk/products/clones/phage_assay.jsp]
58. Sambrook J, Russell D: Molecular Cloning. A Laboratory Manual 3rd edi-
tion. Cold Spring Harbor, NY: Cold Spring Harbor Laboratory Press;
2001.
59. Okabe M, Ikawa M, Kominami K, Nakanishi T, Nishimune Y: 'Green
mice' as a source of ubiquitous green cells. FEBS Lett 1997,
407:313-319.
60. Gooding CG, Roberts GC, Smith CWJ: Role of an inhibitory pyri-
midine-element and general pyrimidine-tract binding pro-
teins in regulation of α-tropomyosin alternative splicing.
RNA 1998, 4:85-100.