Báo cáo y học: "Nonrandom divergence of gene expression following gene and genome duplications in the flowering plant Arabidopsis thaliana" doc
Bạn đang xem bản rút gọn của tài liệu. Xem và tải ngay bản đầy đủ của tài liệu tại đây (1.28 MB, 11 trang )
Genome Biology 2006, 7:R13
comment reviews reports deposited research refereed research interactions information
Open Access
2006Casneufet al.Volume 7, Issue 2, Article R13
Research
Nonrandom divergence of gene expression following gene and
genome duplications in the flowering plant Arabidopsis thaliana
Tineke Casneuf
*
, Stefanie De Bodt
*
, Jeroen Raes
*†
, Steven Maere
*
and
Yves Van de Peer
*
Addresses:
*
Department of Plant Systems Biology, Flanders Interuniversity Institute for Biotechnology (VIB), Ghent University,
Technologiepark 927, B-9052 Ghent, Belgium.
†
Computational and Structural Biology Unit, European Molecular Biology Laboratory (EMBL),
Meyerhofstrasse, D-69117 Heidelberg, Germany.
Correspondence: Yves Van de Peer. Email:
© 2006 Casneuf et al.; licensee BioMed Central Ltd.
This is an open access article distributed under the terms of the Creative Commons Attribution License ( which
permits unrestricted use, distribution, and reproduction in any medium, provided the original work is properly cited.
Gene expression following duplication<p>Analysis of expression data of duplicated genes in <it>Arabidopsis thaliana </it>shows that the mode of duplication, the time since duplication and the function of the duplicated genes play a role in the divergence of their expression.</p>
Abstract
Background: Genome analyses have revealed that gene duplication in plants is rampant.
Furthermore, many of the duplicated genes seem to have been created through ancient genome-
wide duplication events. Recently, we have shown that gene loss is strikingly different for large- and
small-scale duplication events and highly biased towards the functional class to which a gene
belongs. Here, we study the expression divergence of genes that were created during large- and
small-scale gene duplication events by means of microarray data and investigate both the influence
of the origin (mode of duplication) and the function of the duplicated genes on expression
divergence.
Results: Duplicates that have been created by large-scale duplication events and that can still be
found in duplicated segments have expression patterns that are more correlated than those that
were created by small-scale duplications or those that no longer lie in duplicated segments.
Moreover, the former tend to have highly redundant or overlapping expression patterns and are
mostly expressed in the same tissues, while the latter show asymmetric divergence. In addition, a
strong bias in divergence of gene expression was observed towards gene function and the biological
process genes are involved in.
Conclusion: By using microarray expression data for Arabidopsis thaliana, we show that the mode
of duplication, the function of the genes involved, and the time since duplication play important
roles in the divergence of gene expression and, therefore, in the functional divergence of genes
after duplication.
Background
Recent studies have revealed a surprisingly large number of
duplicated genes in eukaryotic genomes [1,2]. Many of these
duplicated genes seem to have been created in large-scale, or
even genome-wide duplication events [3,4]. Whole genome
duplication is particularly prominent in plants and most of
the angiosperms are believed to be ancient polyploids, includ-
ing a large proportion of our most important crops such as
Published: 20 February 2006
Genome Biology 2006, 7:R13 (doi:10.1186/gb-2006-7-2-r13)
Received: 26 September 2005
Revised: 20 December 2005
Accepted: 25 January 2006
The electronic version of this article is the complete one and can be
found online at />R13.2 Genome Biology 2006, Volume 7, Issue 2, Article R13 Casneuf et al. />Genome Biology 2006, 7:R13
wheat, maize, soybean, cabbage, oat, sugar cane, alfalfa,
potato, coffee, cotton and tobacco [5-8]. For over 100 years,
gene and genome duplications have been linked to the origin
of evolutionary novelties, because it provides a source of
genetic material on which evolution can work ([9] and refer-
ences therein). In general, four possible fates are usually
acknowledged for duplicated genes. The most likely fate is
gene loss or nonfunctionalization [1,10-12], while in rare
cases one of the two duplicates acquires a new function (neo-
functionalization) [13]. Subfunctionalization, in which both
gene copies lose a complementary set of regulatory elements
and thereby divide the ancestral gene's original functions,
forms a third potential fate [14-17]. Finally, retention is recog-
nized for two gene copies that, instead of diverging in func-
tion, remain largely redundant and provide the organism
with increased genetic robustness against harmful mutations
[18-20].
The functional divergence of duplicated genes has been
extensively studied at the sequence level to investigate
whether genes evolve at faster rates after duplication, or are
under positive or purifying selection [21-26]. The recent
availability of functional genomics data, such as expression
data from whole-genome microarrays, opens up completely
novel ways to investigate the divergence of duplicated genes,
and several studies using such data have already provided
intriguing new insights into gene fate after duplication. In
yeast, for instance, Gu and co-workers [27] found a signifi-
cant correlation between the rate of coding sequence evolu-
tion and divergence of expression and showed that most
duplicated genes in this organism quickly diverge in their
expression patterns. In addition, they showed that expression
divergence increases with evolutionary time. Makova and Li
[28] analyzed spatial expression patterns of human dupli-
cates and came to the same conclusions. They calculated the
proportion of gene pairs with diverged expression in different
tissues, and found evidence for an approximately linear rela-
tionship with sequence divergence. Wagner [29] showed that
the functional divergence of duplicated genes is often asym-
metrical because one duplicate frequently shows significantly
more molecular or genetic interactions/functions than the
other. Adams and co-workers [30] examined the expression
of 40 gene pairs duplicated by polyploidy in natural and syn-
thetic tetraploid cotton and showed that, although many pairs
contributed equally to the transcriptome, a high percentage
exhibited reciprocal silencing and biased expression and were
developmentally regulated. In a few cases, genes duplicated
through polyploidy events were reciprocally silenced in dif-
ferent organs, suggesting subfunctionalization.
In Arabidopsis, Blanc and Wolfe [31] investigated the expres-
sion patterns of genes that arose through gene duplication
and found that about 62% of the recent duplicates acquired
divergent expression patterns, which is in agreement with
previous observations in yeast and human. In addition, they
identified several cases of so-called 'concerted divergence',
where single members of different duplicated genes diverge
in a correlated way, resulting in parallel networks that are
expressed in different cell types, developmental stages or
environmental conditions. Also in Arabidopsis, Haberer et al.
[32] studied the divergence of genes that originated through
tandem and segmental duplications by using massively paral-
lel signature sequencing (MPSS) data and concluded that,
besides a significant portion of segmentally and tandemly
duplicated genes with similar expression, the expression of
more than two-thirds of the duplicated genes diverged in
expression. However, expression divergence and divergence
time were not significantly correlated, as opposed to findings
in human and yeast (see above). In a small-scale study on reg-
ulatory genes in Arabidopsis, Duarte et al. [33] performed an
analysis of variance (ANOVA) and showed that 85% of the
280 paralogs exhibit a significant gene by organ interaction
effect, indicative of sub- and/or neofunctionalization. Ances-
tral expression patterns inferred across a type II MADS box
gene phylogeny indicated several cases of regulatory neofunc-
tionalization and organ-specific nonfunctionalization.
In conclusion, recent findings demonstrate that a majority of
duplicated genes acquire different expression patterns
shortly after duplication. However, whether the fate of a
duplicated gene also depends on its function is far less under-
stood. The model plant Arabidopsis has a well-annotated
genome and, in addition to many small-scale duplication
events, there is compelling evidence for three genome dupli-
cations in its evolutionary past [34-37], hereafter referred to
as 1R, 2R, and 3R. Recently, a nonrandom process of gene
loss subsequent to these different polyploidy events has been
postulated [12,31,38]. Maere et al. [12] have shown that gene
decay rates following duplication differ considerably between
different functional classes of genes, indicating that the fate of
a duplicated gene largely depends on its function. Here, we
study the expression divergence of genes that were created
during both large- and small-scale gene duplication events by
means of two compiled microarray datasets. The influence of
the origin (mode of duplication) and the function of the dupli-
cated genes on expression divergence are investigated.
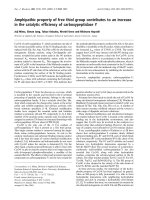
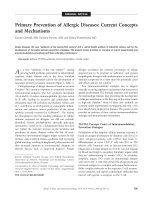
The duplicated genes of Arabidopsis thaliana were divided into six different subclasses according to the time and mode of duplication (see Materials and methods for details)Figure 1
The duplicated genes of Arabidopsis thaliana were divided into six different
subclasses according to the time and mode of duplication (see Materials
and methods for details).
all duplicates
3R duplicate
(0.4 ≤ Ks ≤ 1.0)
3R anchor points 3R non-anchor points
1R/2R non-anchor points1R/2R anchor points
1R/2R duplicates
(1.5 ≤ Ks ≤ 3.7)
Genome Biology 2006, Volume 7, Issue 2, Article R13 Casneuf et al. R13.3
comment reviews reports refereed researchdeposited research interactions information
Genome Biology 2006, 7:R13
Results and discussion
To examine general gene expression divergence patterns, we
analyzed two datasets containing genome-wide microarray
data for Arabidopsis genes (see Materials and methods). The
first consisted of 153 Affymetrix ATH1 slides with expression
data of various perturbation and knockout experiments (see
Additional data file 1). The Spearman rank correlation coeffi-
cient was computed between the two expression patterns of
every duplicated gene pair. To investigate whether divergence
of gene expression varies for duplicates that were created by
small-scale or large-scale (genome-wide) events, the com-
plete set of duplicated genes was subdivided into different
subgroups and their expression correlation was examined
(see Materials and methods; Figure 1). We refer to anchor
genes as duplicated genes that are still lying in recognizable
duplicated segments. Such anchor-point genes, and conse-
quently the segments in which they reside, are regarded as
being created in large-scale duplication events. Six different
sets of genes were distinguished: one set containing dupli-
cates with ages corresponding to 1R/2R (1.5 ≤ Ks ≤ 3.7), fur-
ther subdivided into two sets of anchor and non-anchor
points, and one set of younger duplicates with ages corre-
sponding to 3R (0.4 ≤ Ks ≤ 1.0), again subdivided into two sets
of anchor and non-anchor points (see Materials and meth-
ods). Differences in expression divergence between anchor
points and non-anchor points were evaluated by comparing
their distributions of correlation coefficients using a Mann
Whitney U test (see Materials and methods). We further
explored the difference between both classes of genes by
means of a second dataset on tissue-specific expression (see
Materials and methods and Additional data file 2) [39]. Here,
for each of the subgroups of duplicates described above we
calculated present/absent calls in the 63 different tissues and
computed both the absolute and relative amount of tissues in
which the two genes of a duplicated gene pair are expressed.
In addition, the first dataset was used to identify possible
biases toward gene function. The expression correlation of
duplicated gene pairs, represented by the Spearman correla-
tion coefficient, was studied in relation to the age of duplica-
tion, represented by K
S
(amount of synonymous substitutions
per synonymous site) for genes belonging to different func-
tional categories (GO slim, see Materials and methods).
Divergence of expression and mode of duplication
First, we investigated whether the mode of duplication that
gives rise to the duplicate gene pairs affects expression diver-
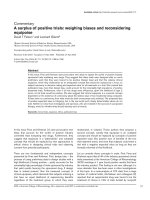
gence. Interestingly, for both younger (Figure 2a) and older
(Figure 2b) duplicates, anchor points showed a significantly
higher correlation in expression than non-anchor points (p
values of 2.49e
-07
and 1.67e
-08
for young and old genes,
respectively). Even for the younger duplicates the difference
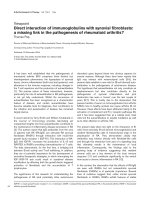
is striking (Figure 2a). We explored the second dataset on tis-
sue-specific expression and first considered the absolute
number of tissues in which genes are expressed, resembling
the expression breadth (see Materials and methods). Regard-
ing anchor points, both genes are usually expressed in a high
number of tissues (Figure 3a). This is only partly true for non-
anchor points (or genes assumed to have been created in
small-scale duplications), where many duplicates are
expressed in a much smaller number of tissues (shown for
young duplicates in Figure 3b). To further discriminate
between redundancy, complementarity and asymmetric
divergence, and thus to investigate if genes are expressed in
the same tissues, we computed the relative number of tissues
a gene is expressed in, which is the number of tissues in which
a gene is expressed divided by the total number of tissues in
which either one of the two duplicates is expressed. As sche-
matically represented in Figure 4, two duplicated genes that
remain co-expressed in the same tissues will both have a rel-
ative number equal to 1 (redundant genes; Figure 4a),
whereas asymmetrically diverged genes, where one gene is
expressed in a very small number of tissues as opposed to its
duplicate that is expressed in a high number of tissues, can be
identified by relative numbers close to 0 and close to 1,
respectively (Figure 4b). The intermediate situation, where
two duplicate genes are expressed in an equal number of dif-
ferent tissues, will result in both copies having a relative
number equal to 0.5 (Figure 4c). When assuming that the
ancestral gene was expressed in all tissues in which the two
duplicate genes are expressed, the latter case hints at sub-
functionalization after duplication. Figure 3c,d shows these
relative numbers for 3R anchor points and non-anchor
points, respectively, and show that redundancy is much more
common among anchor points (Figure 3c) than among non-
anchor points (Figure 3d) of similar ages. Moreover, gene
pairs resulting from small-scale duplications not only seem to
have diverged more often than those created by segmental or
genome duplications, but they also have diverged asymmetri-
cally, where one gene is expressed in a high number of tissues,
as opposed to its duplicate that is expressed in a small
number of tissues (Figure 3d, top left and bottom right). Sim-
ilar findings on tissue-specific expression were observed for
the 1R/2R genes (results not shown).
The current study clearly shows that duplicated genes that are
part of still recognizable duplicated segments (so-called
anchor points) show higher correlation in gene expression
than duplicates that do not lie in paralogons, despite their
similar ages. In addition, the former have highly redundant or
overlapping expression patterns, as they are mostly expressed
in the same tissues. This is in contrast with what is observed
for the non-anchor point genes, where asymmetric diver-
gence is more widespread. There might be several explana-
tions for these observations. The set of non-anchor point
genes include genes created by tandem duplication, transpo-
sitional duplication, or genes translocated after segmental
duplication events. One explanation might lie in different
gene duplication mechanisms. Single-gene duplications,
mostly caused by unequal crossing-over and duplicative
transposition [40], are much more prone to promoter disrup-
tion than genes duplicated through polyploidy events, which
R13.4 Genome Biology 2006, Volume 7, Issue 2, Article R13 Casneuf et al. />Genome Biology 2006, 7:R13
might lead to the altered (or observed asymmetric) expres-
sion of genes after small-scale gene duplication events. Simi-
larly, translocation of genes that originated from large-scale
duplication events can also disrupt promoters, again contrib-
uting to the overall increase of expression divergence [41,42].
Alternatively, the higher correlation of anchor points might
result directly from co-expression of neighboring genes,
regardless of their involvement in the same pathway, as
shown recently by Williams and Bowles [43]. It was also
shown that genome organization, and more in particular the
chromatin structure, can affect gene expression [43-48]. Such
additional structural and functional constraints might, there-
fore, reduce the freedom to diverge and, as a consequence,
cause the expression patterns of genes in duplicated regions
to remain similar, as observed here. Related to our observa-
tions, Rodin et al. ([49] and references therein) reported that
position effects play an important role in the evolution of gene
duplicates. Repositioning of a duplicate to an ectopic site is
proposed to epigenetically modify its expression pattern,
along with the rate and direction of mutations. This reposi-
tioning is believed to rescue redundant anchor point genes
from pseudogenization and accelerate their evolution
towards new developmental stage-, time-, and tissue-specific
expression patterns [49].
As previously stated, non-anchor point genes not only appear
to show higher expression divergence than anchor-point
genes, they appear to diverge asymmetrically, where one gene
is expressed in a high number of tissues, while its duplicate is
expressed in a lower number of tissues. It should be noted
that we cannot establish whether one duplicate is becoming
highly specialized and dedicated to a very small number of tis-
sues or whether it is losing much of its functionality (that is,
turning into a pseudogene), nor can we distinguish between
the gain of expression in new tissues for one gene versus the
loss of expression for the other gene duplicate, as we would
therefore need to know the expression pattern of the ancestral
gene. In this respect, it is interesting to note that it is currently
not known whether the ancient genome doublings in (the
ancestor of) A. thaliana resulted from auto- or allopolyploidi-
zation. In the former case, the anchor point duplicates are in
fact real paralogs, while in the latter case the expression of the
two gene copies might have (slightly) differed from the start
([50,51] and references therein). Nevertheless, our data
clearly show that the duplicates that still lie in duplicated seg-
ments show high expression correlation and have highly over-
lapping expression patterns, as opposed to those that arose
through small-scale duplication events or have been translo-
cated afterwards.
In concordance with the results discussed above, Wagner [29]
described asymmetric divergence of duplicated genes in the
unicellular organism Saccharomyces cerivisiae. He reported
that both the number of stressors to which two duplicates
respond and the number of genes that are affected by the
knockout of paralogous genes are asymmetric. He therefore
proposed an evolutionary model in which the probability that
a loss-of-function mutation has a deleterious effect is greatest
if the two duplicates have diverged symmetrically. Asymmet-
ric divergence of genes therefore leads to increased robust-
ness against deleterious mutations. This seems to be
confirmed by our results. Indeed, also in A. thaliana, asym-
metric divergence, rather than symmetric divergence, seems
to be the fate for two duplicates, at least when they do not lie
in duplicated segments.
Divergence of expression and gene function
Next, we studied how the expression correlation, measured as
the Spearman correlation coefficient, changes over time for
genes of ages up to a K
S
of 3.7. Loess smoothers, which locally
summarize the trend between two variables (see full black
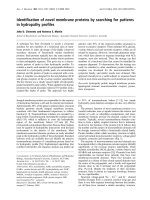
Histograms of the Spearman correlation coefficients for anchor points (black) and non-anchor points (grey) for both (a) 3R genes and (b) 1R/2R genesFigure 2
Histograms of the Spearman correlation coefficients for anchor points (black) and non-anchor points (grey) for both (a) 3R genes and (b) 1R/2R genes. A
Mann-Whitney U test was used to test whether both distributions are significantly different from each other. Mean correlation coefficients: 0.40 for 3R
anchor points; 0.32 for 3R non-anchor points; 0.28 for 1R/2R anchor points; and 0.11 for 1R/2R non-anchor points.
(a)
(b)
-1.0 -0.5 0.0 0.5 1.0
0
5
10
15
20
25
Frequenc
y
-1.0 -0.5 0.0 0.5 1.0
0
2
4
6
8
10
12
14
Frequency
3R anchor points
3R non-anchor points
Spearman correlation coefficient
1R/2R anchor points
1R/2R non-anchor points
Spearman correlation coefficient
Genome Biology 2006, Volume 7, Issue 2, Article R13 Casneuf et al. R13.5
comment reviews reports refereed researchdeposited research interactions information
Genome Biology 2006, 7:R13
lines in Figure 5), clearly indicate that correlation of expres-
sion, in general, is high for recently duplicated genes, declines
as time increases, and saturates at a certain time point. Inter-
estingly, considerable differences can be observed between
genes belonging to different functional classes (Figure 5;
Additional data file 3). For example, genes that are involved
in signal transduction and response to external stimulus
appear to have diverged very quickly after duplication (Figure
5a,b, respectively). Similar trends can be observed for genes
involved in response to biotic stimuli and stress, cell commu-
nication, carbohydrate and lipid metabolism, and for genes
with hydrolase activity (Additional data file 3). Interestingly,
genes of many of these classes are involved in reactions
against environmental changes or stress (signal transduction,
cell communication, response to external and biotic stimuli
and stress, lipid metabolism), which might suggest that Ara-
bidopsis (or better its ancestors) quickly put these newborn
genes into use by means of altered and diverged expression
patterns, as compared to their ancestral copy, to survive and
cope with environmental changes.
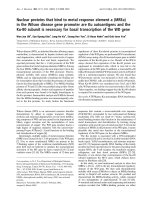
Smoothed color density representations of the scatterplots of the (a,b) absolute and (c,d) relative numbers of tissues in which the genes of a duplicated gene pair are expressed, for both (a,c) 3R anchor points and (b,d) non-anchor pointsFigure 3
Smoothed color density representations of the scatterplots of the (a,b) absolute and (c,d) relative numbers of tissues in which the genes of a duplicated
gene pair are expressed, for both (a,c) 3R anchor points and (b,d) non-anchor points. From (a,c) we can conclude that many anchor point genes are both
expressed in a high number of tissues, and that many of these tissues are actually identical. On the other hand, (b,d) show that non-anchor point genes
frequently show asymmetric divergence because many genes are expressed in a high number of tissues, while their duplicate is not. The plots were made
using the 'smoothScatter' function, implemented in the R package 'prada' [69], by binning the data (in 100 bins) in both directions. The intensity of blue
represents the amount of points in the bin, as depicted in the legend.
10
20 30 40 50
60
64
128
192
256
0.0 0.2 0.4 0.6 0.8 1.0
0
.
0
0.2
0.4
0.6
0.8
1.0
Relative number of tissues, gene 1
Relative number of tissues, gene 2
82
164
246
329
(a)
(c)
Anchor point gene pairs
Anchor point gene pairs
Absolute number of tissues, gene 1
Absolute number of tissues, gene 2
10 20 30 40 50 60
20
30
40
50
60
0
38
77
115
154
0.0 0.2 0.4 0.6 0.8 1.0
0.0
0.2
0.4
0.6
0.8
1.0
Relative number of tissues, gene 1
Relative number of tissues, gene 2
0
145
290
435
580
(b)
(d)
Non-anchor point gene pairs
Non-anchor point gene pairs
60
50
40
30
20
10
Absolute number of tissues, gene 2
0
0
Absolute number of tissues, gene 1
10
10
0.0
R13.6 Genome Biology 2006, Volume 7, Issue 2, Article R13 Casneuf et al. />Genome Biology 2006, 7:R13
Slowly diverging expression patterns were found for proteins
involved in, for example, macromolecule biosynthesis (Figure
5c) and structural molecule activity (Figure 5d) as reflected in
the large number of young gene pairs with high correlation
coefficients. Analogous trends can be observed for other
functional classes containing genes involved in cell organiza-
tion and biogenesis, nucleic acid, macromolecule, protein and
primary metabolism, biosynthesis and response to endog-
enous stimulus (Additional data file 3). Apparently, although
duplicated genes within these classes are being retained, their
fast diversification at the expression level is selected against,
probably due to the essential nature and sensitive regulation
of these highly conserved processes. Other classes of genes,
like those having nucleotide binding capacity (Figure 5e) and
those involved in regulation of biological processes (Figure
5f), show moderate divergence rates. The DNA binding, tran-
scription, protein modification, and genes with catalytic,
transcription factor and transporter activity (Additional data
file 3) classes of genes show similar divergence patterns. We
also tested whether the divergence patterns described above
are significantly different from each other by interchanging
the fitted models between functional classes (fit the locfit line
of a particular class to the data of another class) and evaluat-
ing the model quality. Our results confirmed that there are
indeed significant differences between slowly, moderately
and quickly diverging genes (results not shown).
As opposed to Haberer et al. [32], but in agreement with Gu
et al. [27] and Makova and Li [28], who described expression
divergence of duplicated genes in yeast and human, respec-
tively, we here show that in Arabidopsis, expression patterns
of duplicates diverge as time increases. In addition, the rate of
divergence seems to be highly dependent on the molecular
function of the gene or the biological process in which it is
involved. The rate of expression divergence ranges from very
slow, for highly conserved proteins, such as ribosomal pro-
teins, or genes involved in conserved processes, such as bio-
synthesis pathways or photosynthesis, to very quickly, for
instance genes involved in adaptation to and reaction against
changing environments.
Note that, because we removed expression data of genes with-
out a unique probeset (see Materials and methods), there are
actually more young duplicates than the ones that were
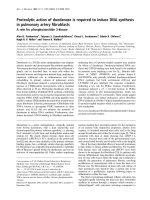
Hypothetical example showing possible scenarios for tissue-specific expression of two duplicatesFigure 4
Hypothetical example showing possible scenarios for tissue-specific expression of two duplicates. A black box depicts expression in a particular tissue,
whereas a white box represents no expression in that particular tissue. Following duplication of a gene that is expressed in six different tissues, the two
copies can (a) both remain expressed in all six tissues (redundancy), (b) diverge asymmetrically, where one gene is expressed in only a small subset of the
tissues, while its duplicate remains expressed in the original six tissues, or (c) diverge symmetrically, where tissue-specific expression is complementarily
lost between both duplicates. The absolute number of tissues in which a gene is expressed is six for both duplicates in (a) and for the second duplicate in
(b), one for the first duplicate in (b) and three for both duplicates in (c). The total number of tissues in which the pair is expressed is 6 in all three cases.
The relative number is the fraction of the previous two, and is 1 for the two genes in (a) and for the second duplicate in (b), 0.17 for the first duplicate in
(b) and 0.5 for both duplicates in (c).
Duplicate 1: 6/6 = 1.00
Duplicate 2: 6/6 = 1.00
Duplicate 1: 1/6 = 0.17
Duplicate 2: 6/6 = 1.00
Duplicate 1: 3/6 = 0.50
Duplicate 2: 3/6 = 0.50
Relative expression breadth
Redundancy
Asymmetric divergence
Symmetric divergence
(a)
(b)
(c)
Duplicated genes
123456
Tissues
Genome Biology 2006, Volume 7, Issue 2, Article R13 Casneuf et al. R13.7
comment reviews reports refereed researchdeposited research interactions information
Genome Biology 2006, 7:R13
Scatter plots of the correlation coefficient in function of the K
S
value of the gene pairs belonging to different functional classesFigure 5
Scatter plots of the correlation coefficient in function of the K
S
value of the gene pairs belonging to different functional classes. The full black line
represents the local regression (locfit) line fitted to the data of that particular class, together with its 95% confidence interval (dashed line). (a-b) Gene
pairs that have diverged quickly after birth have an intercept of the regression line with the y-axis close to zero; (c-d) whereas slow divergence is reflected
by an intercept with the y-axis close to one and a steep slope. (e-f) A more average situation can be observed for most classes. Data of the following
classes are displayed: (a) signal transduction; (b) response to external stimuli; (c) macromolecule biosynthesis; (d) structural molecule activity; (e)
nucleotide binding; (f) regulation of biological process. Plots of other functional classes of genes can be found in Additional data file 3.
Ks
0123
Ks
0123
Spearman correlation coefficient
−1.0
−0.5
0.0
0.5
1.0
Spearman correlation coefficient
−1.0
−0.5
0.0
0.5
1.0
Spearman correlation coefficient
−1.0
−0.5
0.0
0.5
1.0
Spearman correlation coefficient
−1.0
−0.5
0.0
0.5
1.0
Spearman correlation coefficient
−1.0
−0.5
0.0
0.5
1.0
Spearman correlation coefficient
−1.0
−0.5
0.0
0.5
1.0
GO:0009605, response to external stimulus GO:0007165, signal transduction
(a) (b)
GO:0005198, structural molecule activity GO:0009059, macromolecule biosynthesis
(d)(c)
GO:0050789, regulation of biological process
GO:0000166, nucleotide binding
(e) (f)
R13.8 Genome Biology 2006, Volume 7, Issue 2, Article R13 Casneuf et al. />Genome Biology 2006, 7:R13
plotted in Figure 5. Although the current microarray technol-
ogy does not allow measuring their expression, we can
assume that their presence would increase the overall corre-
lation, especially in the low value range of K
S
. As the difficulty
to design a gene-specific probeset is not related to the func-
tional class, we assume that all functional classes suffer from
this caveat to the same extent and that the differences we
observe are reliable.
Conclusion
Investigating gene and genome duplication events as well as
the subsequent functional divergence of genes is of funda-
mental importance in the understanding of evolution and
adaptation of organisms. Previously, large-scale gene dupli-
cation events have been shown to be prominent in different
plant species. Only recently, a pattern of gene retention after
duplication has emerged that is biased towards function, time
and mode of duplication [5,12,38]. For instance, genes
involved in signal transduction and transcriptional regulation
were shown to have been preferentially retained after large-
scale duplication events, while genes of other important func-
tional categories (such as DNA metabolism and cell cycle)
were lost [5,12,38]. Still other categories of genes, such as
those involved in secondary metabolism, are highly retained
after small-scale gene duplication [12]. Here, we have studied
the expression divergence of these retained duplicates by
means of the genome-wide microarray expression data avail-
able for Arabidopsis genes. As clearly shown in the current
study, there is not only a bias in the retention of genes after
duplication events, but also in the rate of divergence of
expression for different functional categories of genes. Sur-
prisingly, this bias is much more outspoken for genes created
by small-scale duplication events than for genes that have
been created through large-scale segmental or entire genome
duplication events. The latter genes, provided they are still
found in duplicated segments, show much higher expression
correlation and highly overlapping expression patterns com-
pared to those duplicates that are created by small-scale
duplication events or that no longer lie in duplicated
segments.
Materials and methods
Duplicated genes
To identify duplicated genes, an all-against-all protein
sequence similarity search was performed using BLASTP
(with an E-value cut-off of e
-10
) [52]. Sequences alignable over
a length of 150 amino acids with an identity score of 30% or
more were defined as paralogs according to Li et al. [53]. To
determine the time since duplication, the fraction of synony-
mous substitutions per synonymous site (K
s
) was estimated.
These substitutions do not result in amino acid replacements
and are, in general, not under selection. Consequently, the
rate of fixation of these substitutions is expected to be rela-
tively constant in different protein coding genes and, there-
fore, to reflect the overall mutation rate. First, all pairwise
alignments of the paralogous nucleotide sequences belonging
to a gene family were made by using CLUSTALW [54], with
the corresponding protein sequences as alignment guides.
Gaps and adjacent divergent positions in the alignments were
subsequently removed. K
S
estimates were then obtained with
the CODEML program [55] of the PAML package [56]. Codon
frequencies were calculated from the average nucleotide fre-
quencies at the three codon positions (F3 × 4), whereas a con-
stant K
N
/K
S
(nonsynonymous substitutions per
nonsynonymous site over synonymous substitutions per syn-
onymous site, reflecting selection pressure) was assumed
(codon model 0) for every pairwise comparison. Calculations
were repeated five times to avoid incorrect K
S
estimations
because of suboptimal local maxima.
To compare expression patterns of duplicated genes that had
arisen through genome duplication events with those created
in small-scale duplication events, the complete set of dupli-
cated genes was subdivided into six different subgroups (Fig-
ure 1), namely:
1. Set 1 containing all genes that are assumed to have been
duplicated at a time coinciding with the most recent (3R)
polyploidy event.
2. Set 2 containing all genes that are assumed to have been
duplicated at a time coinciding with the two (1R/2R) older
polyploidy events.
3. Set 3 is a subset of Set 1 and only contains the anchor points
(pairs of duplicated genes that still lie on so-called paralogons
[34], homologous duplicated segments that still show con-
served gene order and content). These genes are thus
assumed to have been created by 3R.
4. Set 4 containing the non-anchor point duplicates of Set 1.
5. Set 5 containing the anchor points of Set 2 assumed to have
been created by 1R/2R.
6. Set 6 containing the non-anchor points of Set 2.
Previously, through modeling the age distribution of dupli-
cated genes, we estimated that genes created during the
youngest genome duplication have a K
S
between 0.4 and 1.0,
while genes that originated during the oldest two genome
duplications were estimated to have a K
S
between 1.5 and 3.7
[12]. The latter genes were grouped because it was difficult to
unambiguously attribute them to 1R or 2R [12,35]. ere, it is
assumed that anchor points dddddThe duplicated gene pairs
that arose through genome duplication events (anchor
points) had been identified previously (complete list available
upon request) [34].
Genome Biology 2006, Volume 7, Issue 2, Article R13 Casneuf et al. R13.9
comment reviews reports refereed researchdeposited research interactions information
Genome Biology 2006, 7:R13
Gene Ontology functional classes
Duplicated genes were assigned to functional categories
according to the Gene Ontology (GO) annotation. The GO
annotation for A. thaliana was downloaded from TAIR (ver-
sion 24 June 2005) [57]. We studied genes belonging to the
biological process (BP) and the molecular function (MF)
classes of the GO tree. Rather than considering all categories
from different levels in the gene ontology, we used the plant-
specific GO Slim process and function ontologies [58]. In
these GO Slim ontologies, categories close to the leaves of the
GO hierarchy are mapped onto the more general, parental
categories. A gene pair is included in a functional class only
when both genes of the pair have been assigned to that partic-
ular functional class. Functional classes containing fewer
than 200 pairs of duplicated genes were excluded from the
analysis.
Microarray expression data
This study was based on gene expression data generated with
Affymetrix ATH1 microarrays (Affymetrix, San Diego, CA,
USA) [59] during various experiments, all of which are pub-
licly available from the Nottingham Arabidopsis Stock Centre
(NASC) [60,61]. Two datasets were examined that both com-
prise microarrays that were replicated at least once. The first
set includes 153 microarrays that were generated under a
broad range of experimental conditions, including, for exam-
ple, diverse knockout mutants and chemical and biological
perturbations (Additional data file 1). Raw data were sub-
jected to robust multi-array average (RMA) normalization,
which is available through Bioconductor [62,63]. The probe
set data of all arrays were simultaneously normalized using
quantile normalization, which eliminates systematic differ-
ences between different chips [64-66]. The log-transformed
values were used instead of the raw intensities because of the
variance-stabilizing effect of this transformation. Because of
the high sequence similarity of recently duplicated genes and
the risk of artificially increased correlation due to cross-
hybridization, we selected expression data only from those
genes for which a unique probe set is available on the ATH1
microarray (probe sets that are designated with an '_at'
extension, without suffix). Next, the genes were non-specifi-
cally filtered based on expression variability by arbitrarily
selecting the 10,000 genes with the highest interquartile
range. This was done in an attempt to filter out those genes
that show very little variability in gene expression, thereby
artificially increasing the overall expression correlation. The
mean intensity value was calculated for the replicated slides,
resulting in 66 data points for every gene. Next, for each of the
16 different experimental conditions, a treated plant and its
corresponding wild-type plant (control experiment without
treatment, knock-out or perturbation) were identified (Addi-
tional data file 1). To adjust the data for effects that arise from
variation in technology rather than from biological differ-
ences between the plants, for every gene the intensity value of
the wild type was subtracted from that of the treated plant.
The final dataset contained 49 expression measures per gene.
For each of the six subsets of duplicates described above
1,279, 8,510, 550, 708, 109, and 8,389 gene pairs, respec-
tively, remained after filtering the microarray data.
The second dataset contains the expression data of genes in
63 plant tissues that were generated within the framework of
the AtGenExpress project (Additional data file 2) [39]. The
'mas5calls' function in Bioconductor was used to study tissue-
specific gene expression [62,63]. This software evaluates the
abundance of each transcript and generates a 'detection p
value', which is used to determine the detection call, indicat-
ing whether a transcript is reliably detected (present) or not
(absent or marginal). The parameters used correspond to the
standard Affymetrix defaults in which a gene with a p value of
less than 0.04 is marked as 'present' [67,68]. We again
selected only expression data from those genes for which a
unique probe set is available on the ATH1 microarray. The
dataset contains triplicated microarrays and we assigned a
gene to be present if it was assigned with a present call in at
least one of the three samples. In all other cases an absent call
was assigned. We plotted both the absolute (or expression
breadth) and relative (or expression divergence of two dupli-
cates) number of tissues in which the genes of a duplicated
gene pair are expressed. The latter is defined as the number of
tissues in which a gene has a present call divided by the total
number of present calls of the duplicated gene pair. Pairs of
genes without any present calls were removed from the
dataset, resulting in 6,193, 37,838, 1,387, 4,736, 269, 37,438
genes, respectively, for each of the six subsets described
above. Both of the above described datasets are available
upon request.
Correlation analysis
To measure the expression divergence of two duplicated
genes, the Spearman Rank correlation coefficient ρ was calcu-
lated. We chose to use this non-parametric statistic because
our dataset is a compilation of data from uncorrelated exper-
iments, and might therefore contain outliers. The formula
used was:
where D is the difference between the ranks of the corre-
sponding expression values of both duplicated genes and N is
the number of samples. In evaluating and comparing the dis-
tributions of the correlation coefficients of the expression of a
set of genes, we used the Mann-Whitney U test (two sided, not
paired) that is incorporated in the statistical package R [69].
Regression analysis
The relation between expression correlation, measured as the
Spearman correlation coefficient, and time, measured as the
number of synonymous substitutions per synonymous site
K
S
, was studied using 'locfit', an R package to fit curves and
surfaces to data, using local regression and likelihood meth-
ρ= −1
6
2
D
NN
∑
−()
2
1
R13.10 Genome Biology 2006, Volume 7, Issue 2, Article R13 Casneuf et al. />Genome Biology 2006, 7:R13
ods [69,70]. We hereby included all duplicated genes with a
K
S
value smaller than or equal to 3.7 (see above). A local
regression model was fitted to the data of each of the func-
tional classes of genes and we looked for biases in expression
divergence between the different functional classes by inter-
changing the fitted models. The model fitted to the data of a
particular class was fitted to the data of another class and the
quality of the fit was evaluated by assessing the relation
between the residuals and fitted values. Residuals that show
a clear trend (which is reflected in a non-random distribution
around Y = 0 with zero mean) indicate that the fitted regres-
sion model is inappropriate (that is, the model fitted to the
data of the former class is not applicable to the data of the
latter).
Additional data files
The following additional data are available with the online
version of this paper. Additional data file 1 is a description of
dataset 1. Additional data file 2 is a description of dataset 2.
Additional data file 3 presents scatterplots of genes belonging
to different functional classes. Supplemental material is also
available online at [71].
Additional File 1Description of dataset 1This file contains the names of the microarrays that were included in the first dataset, together with the description of the experimen-tal conditions (that is, to what series of experiments the microar-rays belong, from what type of plant the samples were taken, and to what wild type the slide should be compared).Click here for fileAdditional File 2Description of dataset 2This file contains the names of the microarrays that were included in the second dataset, together with the description of what tissue the samples were taken from and the conditions in which the plant was grown.Click here for fileAdditional File 3Scatterplots of genes belonging to different functional classesThis file contains the scatterplots of the Spearman correlation coef-ficient in function of the Ks value of all genes in the 67 different functional classes of genes. The loess smoother that was fitted to the data is depicted by a full black line, together with its 95% confi-dence interval.Click here for file
Authors' contributions
T.C. designed the study, analyzed data, and wrote the paper.
SDB analyzed data. J.R. designed the study. S.M. analyzed
data. YVdP designed the study, supervised the project, and
wrote the paper.
Acknowledgements
This work was supported by a grant from the European Community
(FOOD-CT-2004-506223-GRAINLEGUMES) and from the Fund for Scien-
tific Research, Flanders (3G031805). S.D.B. is indebted to the Institute for
the Promotion of Innovation by Science and Technology in Flanders for a
predoctoral fellowship. S.M. is a Research Fellow of the Fund for Scientific
Research, Flanders. We would like to thank Todd Vision and Wolfgang
Huber for fruitful discussions.
References
1. Lynch M, Conery JS: The evolutionary fate and consequences of
duplicate genes. Science 2000, 290:1151-1155.
2. Li WH, Gu Z, Cavalcanti AR, Nekrutenko A: Detection of gene
duplications and block duplications in eukaryotic genomes. J
Struct Funct Genomics 2003, 3:27-34.
3. Van de Peer Y: Computational approaches to unveiling ancient
genome duplications. Nat Rev Genet 2004, 5:752-763.
4. Wolfe KH: Yesterday's polyploids and the mystery of
diploidization. Nat Rev Genet 2001, 2:333-341.
5. Blanc G, Wolfe KH: Functional divergence of duplicated genes
formed by polyploidy during Arabidopsis evolution. Plant Cell
2004, 16:1679-1691.
6. Otto SP, Whitton J: Polyploid incidence and evolution. Annu Rev
Genet 2000, 34:401-437.
7. Masterson J: Stomatal size in fossil plants: evidence for poly-
ploidy in majority of angiosperms. Science 1994, 264:421-424.
8. Wendel JF: Genome evolution in polyploids. Plant Mol Biol 2000,
42:225-249.
9. Taylor JS, Raes J: Duplication and divergence: the evolution of
new genes and old ideas. Annu Rev Genet 2004, 38:615-643.
10. Lynch M, Force A: The probability of duplicate gene preserva-
tion by subfunctionalization. Genetics 2000, 154:459-473.
11. Ohno S: Evolution by Gene Duplication Berlin, Heidelberg, New York:
Springer-Verlag; 1970.
12. Maere S, De Bodt S, Raes J, Casneuf T, Van Montagu M, Kuiper M, Van
de Peer Y: Modeling gene and genome duplications in
eukaryotes. Proc Natl Acad Sci USA 2005, 102:5454-5459.
13. Taylor JS, Raes J: Duplication and divergence: the evolution of
new genes and old ideas. Annu Rev Genet 2004, 38:615-643.
14. Force A, Lynch M, Pickett FB, Amores A, Yan YL, Postlethwait J:
Preservation of duplicate genes by complementary, degen-
erative mutations. Genetics 1999, 151:1531-1545.
15. Serebrowsky AS: Genes scute and achaete in Drosophila mela-
nogaster and a hypothesis of gene divergency. Compt Rend Acad
Sci URSS 1938, 14:77-81.
16. Stoltzfus A: On the possibility of constructive neutral
evolution. J Mol Evol 1999, 49:169-181.
17. Hughes AL: Adaptive Evolution of Genes and Genomes New York:
Oxford University Press; 1999.
18. Nadeau JH, Sankoff D: Comparable rates of gene loss and func-
tional divergence after genome duplications early in verte-
brate evolution. Genetics 1997, 147:1259-1266.
19. Gu X: Evolution of duplicate genes versus genetic robustness
against null mutations. Trends Genet 2003, 19:354-356.
20. Haldane JBS: The part played by recurrent mutation in
evolution. Am Nat 1933, 67:5-19.
21. Raes J, Van de Peer Y: Gene duplication, the evolution of novel
gene functions, and detecting functional divergence of dupli-
cates in silico. Appl Bioinformatics 2003, 2:91-101.
22. Robinson-Rechavi M, Laudet V: Evolutionary rates of duplicate
genes in fish and mammals. Mol Biol Evol 2001, 18:681-683.
23. Kondrashov FA, Rogozin IB, Wolf YI, Koonin EV: Selection in the
evolution of gene duplications. Genome Biol 2002,
3:RESEARCH0008.
24. Van de Peer Y, Taylor JS, Braasch I, Meyer A: The ghost of
selection past: rates of evolution and functional divergence
of anciently duplicated genes. J Mol Evol 2001, 53:436-446.
25. Cronn RC, Small RL, Wendel JF: Duplicated genes evolve inde-
pendently after polyploid formation in cotton. Proc Natl Acad
Sci USA 1999, 96:14406-14411.
26. Hughes MK, Hughes AL: Evolution of duplicate genes in a tetra-
ploid animal, Xenopus laevis. Mol Biol Evol 1993, 10:1360-1369.
27. Gu Z, Nicolae D, Lu HH, Li WH: Rapid divergence in expression
between duplicate genes inferred from microarray data.
Trends Genet 2002, 18:609-613.
28. Makova KD, Li WH: Divergence in the spatial pattern of gene
expression between human duplicate genes. Genome Res 2003,
13:1638-1645.
29. Wagner A: Asymmetric functional divergence of duplicate
genes in yeast. Mol Biol Evol 2002, 19:1760-1768.
30. Adams KL, Cronn R, Percifield R, Wendel JF: Genes duplicated by
polyploidy show unequal contributions to the transcriptome
and organ-specific reciprocal silencing. Proc Natl Acad Sci USA
2003, 100:4649-4654.
31. Blanc G, Wolfe KH: Widespread paleopolyploidy in model
plant species inferred from age distributions of duplicate
genes. Plant Cell 2004, 16:1667-1678.
32. Haberer G, Hindemitt T, Meyers BC, Mayer KF: Transcriptional
similarities, dissimilarities, and conservation of cis-elements
in duplicated genes of Arabidopsis. Plant Physiol 2004,
136:3009-3022.
33. Duarte JM, Cui L, Wall PK, Zhang Q, Zhang X, Leebens-Mack J, Ma
H, Altman N, Depamphilis CW: Expression pattern shifts follow-
ing duplication indicative of subfunctionalization and neo-
functionalization in regulatory genes of Arabidopsis. Mol Biol
Evol 2006, 23:469-478.
34. Simillion C, Vandepoele K, Van Montagu MC, Zabeau M, Van de Peer
Y: The hidden duplication past of Arabidopsis thaliana. Proc
Natl Acad Sci USA 2002, 99:13627-13632.
35. Bowers JE, Chapman BA, Rong J, Paterson AH: Unravelling
angiosperm genome evolution by phylogenetic analysis of
chromosomal duplication events. Nature 2003, 422:433-438.
36. Blanc G, Hokamp K, Wolfe KH: A recent polyploidy superim-
posed on older large-scale duplications in the Arabidopsis
genome. Genome Res 2003, 13:137-144.
37. Vision TJ, Brown DG, Tanksley SD: The origins of genomic dupli-
cations in Arabidopsis. Science 2000, 290:2114-2117.
Genome Biology 2006, Volume 7, Issue 2, Article R13 Casneuf et al. R13.11
comment reviews reports refereed researchdeposited research interactions information
Genome Biology 2006, 7:R13
38. Seoighe C, Gehring C: Genome duplication led to highly selec-
tive expansion of the Arabidopsis thaliana proteome. Trends
Genet 2004, 20:461-464.
39. Schmid M, Davison TS, Henz SR, Pape UJ, Demar M, Vingron M,
Scholkopf B, Weigel D, Lohmann JU: A gene expression map of
Arabidopsis thaliana development. Nat Genet 2005, 37:501-506.
40. Taylor JS, Raes J: Small-scale gene duplications. In The Evolution
of the Genome Edited by: Gregory TR. San Diego: Elsevier;
2005:289-327.
41. Brown KE, Amoils S, Horn JM, Buckle VJ, Higgs DR, Merkenschlager
M, Fisher AG: Expression of alpha- and beta-globin genes
occurs within different nuclear domains in haemopoietic
cells. Nat Cell Biol 2001, 3:602-606.
42. Lynch M, Katju V: The altered evolutionary trajectories of gene
duplicates. Trends Genet 2004, 20:544-549.
43. Williams EJ, Bowles DJ: Coexpression of neighboring genes in
the genome of Arabidopsis thaliana. Genome Res 2004,
14:1060-1067.
44. Perez-Martin J, de Lorenzo V: Clues and consequences of DNA
bending in transcription. Annu Rev Microbiol 1997, 51:593-628.
45. Gerasimova TI, Corces VG: Chromatin insulators and bounda-
ries: effects on transcription and nuclear organization. Annu
Rev Genet 2001, 35:193-208.
46. Mishra RK, Karch F: Boundaries that demarcate structural and
functional domains of chromatin. J Biosci 1999, 24:377-399.
47. Cockell M, Gasser SM: Nuclear compartments and gene
regulation. Curr Opin Genet Dev 1999, 9:199-205.
48. Ren XY, Fiers MW, Stiekema WJ, Nap JP: Local coexpression
domains of two to four genes in the genome of Arabidopsis.
Plant Physiol 2005, 138:923-934.
49. Rodin SN, Parkhomchuk DV, Riggs AD: Epigenetic changes and
repositioning determine the evolutionary fate of duplicated
genes. Biochemistry (Mosc) 2005, 70:559-567.
50. Adams KL, Wendel JF: Polyploidy and genome evolution in
plants. Curr Opin Plant Biol 2005, 8:135-141.
51. Adams KL, Wendel JF: Novel patterns of gene expression in
polyploid plants. Trends Genet 2005, 21:539-543.
52. Altschul SF, Madden TL, Schaffer AA, Zhang J, Zhang Z, Miller W, Lip-
man DJ: Gapped BLAST and PSI-BLAST: a new generation of
protein database search programs. Nucleic Acids Res 1997,
25:3389-3402.
53. Li WH, Gu Z, Wang H, Nekrutenko A: Evolutionary analyses of
the human genome. Nature 2001, 409:847-849.
54. Thompson JD, Higgins DG, Gibson TJ: CLUSTAL W: improving
the sensitivity of progressive multiple sequence alignment
through sequence weighting, position-specific gap penalties
and weight matrix choice. Nucleic Acids Res 1994, 22:4673-4680.
55. Goldman N, Yang Z: A codon-based model of nucleotide sub-
stitution for protein-coding DNA sequences. Mol Biol Evol
1994, 11:725-736.
56. Yang Z: PAML: a program package for phylogenetic analysis
by maximum likelihood. Comput Appl Biosci 1997, 13:555-556.
57. The Arabidopsis Information Resource [bidop
sis.org/]
58. The Gene Ontology [ />59. Affymetrix [ />60. The Nottingham Arabidopsis Stock Centre [http://affyme
trix.arabidopsis.info/]
61. Craigon DJ, James N, Okyere J, Higgins J, Jotham J, May S: NASCAr-
rays: a repository for microarray data generated by NASC's
transcriptomics service. Nucleic Acids Res 2004, 32:D575-577.
62. Gentleman RC, Carey VJ, Bates DM, Bolstad B, Dettling M, Dudoit S,
Ellis B, Gautier L, Ge Y, Gentry J, et al.: Bioconductor: open soft-
ware development for computational biology and
bioinformatics. Genome Biol 2004, 5:R80.
63. Gautier L, Cope l, Bolstad BM, Irizarry RA: affy - analysis of
Affymetrix GeneChip data at the probe level. Bioinformatics
2004, 20:307-315.
64. Irizarry RA, Bolstad BM, Collin F, Cope LM, Hobbs B, Speed TP:
Summaries of Affymetrix GeneChip probe level data. Nucleic
Acids Res 2003, 31:e15.
65. Irizarry RA, Hobbs B, Collin F, Beazer-Barclay YD, Antonellis KJ,
Scherf U, Speed TP: Exploration, normalization, and summa-
ries of high density oligonucleotide array probe level data.
Biostatistics 2003, 4:249-264.
66. Bolstad BM, Irizarry RA, Astrand M, Speed TP: A comparison of
normalization methods for high density oligonucleotide
array data based on variance and bias. Bioinformatics 2003,
19:185-193.
67. Liu WM, Mei R, Di X, Ryder TB, Hubbell E, Dee S, Webster TA, Har-
rington CA, Ho MH, Baid J, Smeekens SP: Analysis of high density
expression microarrays with signed-rank call algorithms. Bio-
informatics 2002, 18:1593-1599.
68. Microarray Suite User Guide [ />port/technical/manuals.affx]
69. R: a Language and Environment for Statistical Computing
[]
70. Loader C: Local Regression and Likelihood New York: Springer; 1999.
71. Bioinformatics and Evolutionary Genomics: Supplementary
Data [ />