Báo cáo y học: " The contributions of normal variation and genetic background to mammalian gene expression" ppsx
Bạn đang xem bản rút gọn của tài liệu. Xem và tải ngay bản đầy đủ của tài liệu tại đây (374.23 KB, 11 trang )
Genome Biology 2006, 7:R26
comment reviews reports deposited research refereed research interactions information
Open Access
2006Pritchardet al.Volume 7, Issue 3, Article R26
Research
The contributions of normal variation and genetic background to
mammalian gene expression
Colin Pritchard
*†
, David Coil
*
, Sarah Hawley
‡
, Li Hsu
‡
and Peter S Nelson
**
Addresses:
*
Divisions of Human Biology, Fred Hutchinson Cancer Research Center, Seattle, WA, 98109, USA.
†
Clinical Research, Fred
Hutchinson Cancer Research Center, Seattle, WA, 98109, USA.
‡
Public Health Sciences, Fred Hutchinson Cancer Research Center, Seattle, WA,
98109, USA.
Correspondence: Peter S Nelson. Email:
© 2006 Pritchard et al.; licensee BioMed Central Ltd.
This is an open access article ditributed under the terms of the Creative Commons Attribution License ( which
permits unrestricted use, distribtion, and reproduction in any medium, provided the original work is properly cited.
Variation in mammalian gene expression<p>Analysis of microarray-based transcript levels within and between five different mouse strains show that 23-44% of all genes exhibit differences in expression levels between genetically identical individuals.</p>
Abstract
Background: Qualitative and quantitative variability in gene expression represents the substrate
for external conditions to exert selective pressures for natural selection. Current technologies
allow for some forms of genetic variation, such as DNA mutations and polymorphisms, to be
determined accurately on a comprehensive scale. Other components of variability, such as
stochastic events in cellular transcriptional and translational processes, are less well characterized.
Although potentially important, the relative contributions of genomic versus epigenetic and
stochastic factors to variation in gene expression have not been quantified in mammalian species.
Results: In this study we compared microarray-based measures of hepatic transcript abundance
levels within and between five different strains of Mus musculus. Within each strain 23% to 44% of
all genes exhibited statistically significant differences in expression between genetically identical
individuals (positive false discovery rate of 10%). Genes functionally associated with cell growth,
cytokine activity, amine metabolism, and ubiquitination were enriched in this group. Genetic
divergence between individuals of different strains also contributed to transcript abundance level
differences, but to a lesser extent than intra-strain variation, with approximately 3% of all genes
exhibiting inter-strain expression differences.
Conclusion: These results indicate that although DNA sequence fixes boundaries for gene
expression variability, there remain considerable latitudes of expression within these genome-
defined limits that have the potential to influence phenotypes. The extent of normal or expected
natural variability in gene expression may provide an additional level of phenotypic opportunity for
natural selection.
Background
Biological entities such as individual cells, organs, and entire
organisms display phenotypes that are simultaneously dic-
tated and constrained by the composition of nucleic acids
comprising their genomes. Differences in DNA sequence
between individuals within the same species may produce
qualitative and quantitative alterations in gene expression
that influence biochemical processes conferring disease sus-
ceptibility and the beneficial or adverse responses to pharma-
cological intervention [1,2]. Thus, a critical component of
Published: 31 March 2006
Genome Biology 2006, 7:R26 (doi:10.1186/gb-2006-7-3-r26)
Received: 22 September 2005
Revised: 19 December 2005
Accepted: 28 February 2006
The electronic version of this article is the complete one and can be
found online at />R26.2 Genome Biology 2006, Volume 7, Issue 3, Article R26 Pritchard et al. />Genome Biology 2006, 7:R26
biomedicine centers on establishing the cause, extent and
result of gene expression variability with an aim toward
establishing pathological associations. To this end, the devel-
opment of technologies such as DNA microarrays have
allowed for quantitative assessments of transcriptional activ-
ity for thousands of genes simultaneously [3]. Microarray-
based methods have been used to measure transcriptional
variance in a variety of organisms, including yeast [4], flies
[5], fish [6], mice [7], and men [8]; usually in the context of
assessing the contribution of gene expression to phenotypic
attributes of age, sex, strain, or disease. While the major com-
ponent of phenotypic diversity within species is thought to be
provided by combinations of heritable variations in DNA, it is
readily apparent that individuals sharing nearly identical
genomes, such as inbred mouse strains and monozygotic
twins, may exhibit strikingly different characteristics [9,10].
To assess the extent and nature of gene expression variability
both within populations of genetically identical individuals
and between genetically heterogeneous individuals, we
selected five strains of commonly used laboratory mice;
inbred 129, Balb/c, and FVB, and outbred CD1 and CFW, iso-
lated RNA from the livers of three males from each strain, and
quantified transcript abundance levels by comparative
hybridizations to cDNA microarrays.
Results
Mice bred for more than 60 generations should fix the vast
majority (potentially all) of genetic contribution to variation
[11], and thus individual mice within each inbred strain are
considered genetically identical. We studied the liver in view
of its important contribution to a wide variety of metabolic
processes as well as practical considerations involving sample
quantities and the ease of tissue procurement. To account for
technical inconsistencies and facilitate comparisons within
and between strains, each array hybridization used a common
reference consisting of RNA combined from the liver, testes,
and kidney of all mice used in the experiments. Two replicate
arrays were performed for each individual mouse liver sample
with each of two different fluorescent dyes to control for
potential dye bias, thereby generating 4 replicate arrays per
mouse and a total of 60 arrays.
We anticipated that three major sources of measurable varia-
tion in transcript levels would be represented in this dataset.
The first involves the technical inconsistencies in experimen-
tal procedures and was assessed by the four replicate arrays
performed for each mouse sample. The second source of var-
iation is represented predominantly by intrinsic and extrinsic
non-genetic factors influencing gene expression. This vari-
ance component was measured through the determination of
transcript levels between mice of the same strain with identi-
cal genomes. All mice were matched for age, and were pro-
vided consistent diets and living environments. The third
source of gene expression variability was expected to be
driven by differences in DNA sequence or genome structure
between the different mouse strains. This inter-strain varia-
bility was measured by determining transcript abundance
levels between mice of different strains.
To identify genes whose transcript levels varied between
genetically identical individuals, we first used an ANOVA
model with a conservative assessment of significance [7]. This
method yielded the following number of variable genes within
each strain: 129, 37 genes; Balb/c, 36 genes; CD1, 26 genes;
FVB, 21 genes; and CFW, 11 genes. Our previous study of liver
gene expression in C57BL/6 mice identified 21 variable genes
(0.8% of all genes assessed), indicating that the overall exper-
imental results are quite consistent [7]. While this method
identifies variable genes with high confidence, we concluded
that the approach has a high rate of false negatives and is
unduly restrictive when one is interested in assessing overall
levels of variability rather than focusing on any particular
gene product.
We next employed a less conservative strategy that involves
controlling the positive false discovery rate (pFDR) [12]. We
chose a level of acceptable false positives of 10% such that
among the identified variable genes, about 10% probably do
not actually vary. Separate analyses within each strain identi-
fied 554 (23%) genes exhibiting variability among individual
129 mice, 1,059 (44%) genes among Balb/c mice, 749 (31%)
genes among CD1 mice, 610 (26%) genes among FVB mice,
and 661 (28%) genes among the CFW mice (Table 1). In a
joint analysis in which all strains were evaluated simultane-
ously, 1,876 genes (79%) varied within strain at a pFDR of
10% (see Materials and methods). Overall, mice in the Balb/c
strain exhibited greater liver gene expression variability than
mice from other strains. For a gene to be identified as varia-
ble, either the transcript level difference between individual
mice is large, or the array variance - in this case the technical
variability - is small. We specifically re-evaluated the array
variability and did not identify a lower array variance in the
Balb/c experiments.
Of the genes exhibiting variable expression levels within
strains, 33 were variable within all 5 strains, and 154 were
variable in 4 of the 5 strains (see Additional data file 2, sup-
plemental Table 2). To determine how many genes are
expected to be in common by chance if genes were chosen
randomly, we undertook a simulation study with 50,000
datasets generated by randomly selecting groups of 554,
1,059, 749, 610, and 661 genes from the 5 strains for each data
set and determined the number of genes represented in all 5
sets. The greatest number of genes in common, by chance
alone, was 19, though typically fewer than 10 genes were
found in common. This analysis indicates that the 33 genes
identified in our study represent a highly significant level of
overlap (p < 0.00002). Searches based on gene ontology (GO)
classification indicated that genes associated with cell growth
[GO:0008151], cytokine activity [GO:0005125], amine
Genome Biology 2006, Volume 7, Issue 3, Article R26 Pritchard et al. R26.3
comment reviews reports refereed researchdeposited research interactions information
Genome Biology 2006, 7:R26
metabolism [GO:0009308], and the ubiquitin ligase complex
[GO:0000151] were enriched among the genes with consist-
ent intra-strain variation, when compared to the array as a
whole. All genes showing significant inter-individual variabil-
ity in our previous study of C57BL/6 mice [7] also varied in at
least one strain analyzed in the current study. Moreover,
genes previously found to exhibit substantial hepatic intra-
strain variability, including CisH, Hhex, Cyp4a14, and
Gadd45a, varied in at least three out of the five strains. Inter-
estingly, four genes identified in the current study are
involved in the ubiquitination process; Wsb1, Arih1, Cdc27,
and Chordc1. This finding suggests the possibility that normal
variability in protein degradation pathways could provide an
additional level of global gene expression variability either
through direct targeting of specific proteins or via a cascade of
indirect effects influencing transcriptional regulation.
We next sought to assess the gene expression variability
between different mouse strains. For this analysis we used an
ANOVA model in which we considered the F ratio of mouse
(between strain) to mouse (within strain) effect, where the
significance of the F statistic is determined again by the pFDR
(see Materials and methods). Using a pFDR of 10%, the anal-
yses of individual mice identified 66 transcripts out of 2,382
(2.8%) that exhibited greater inter- than intra-strain variabil-
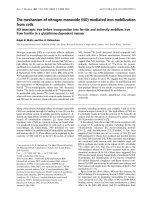
ity (Figure 1a). Several transcripts exhibited substantial inter-
strain variability, and we confirmed the microarray results for
four of these genes by quantitative PCR (Figure 1b). Apolipo-
protein A-IV (ApoA4) message levels varied 5.7-fold between
mice of the 129 strain and mice of the FVB strain, a finding
that confirms previous studies demonstrating a high level of
expression variability for this gene [13,14]. ApoA4 is synthe-
sized in the liver and intestine, and is a mediator of plasma
lipid transport. Human studies have identified polymor-
phisms in the ApoA4 gene that associate with ApoA4 plasma
levels, inter-individual variability in cholesterol levels, and
risk of coronary heart disease [15]. The regulation of ApoA4
expression involves both transcriptional and post-transcrip-
tional processes influenced by genetic variation in the gene
itself [14]. Other genes exhibiting high inter-strain differ-
ences in expression levels encode proteins modulating cellu-
lar oxidative stress responses. These include NADPH oxidase
4 (Nox4), cytochrome p450 4a14 (CYP4a14), glutathione S
transferase pi (Gstp), peroxiredoxin 4, and ferritin light chain
(Ftnl) (Figure 1a). Our results are consistent with previous
studies that have demonstrated substantial mouse strain dif-
ferences in basal iron status, ferritin levels and the potential
for modulating oxidative hepatic stress. Immunoquantitation
of total liver ferritin levels in four mouse strains determined a
three- to fourfold difference between the SWR and C57BL/6
strains, with Balb/c and DBA/2 strains having levels between
these extremes [16]. Our results identified the highest levels
of Ftl expression in CD1 mice, a strain not examined in the
previous report. This study and our previous work each deter-
mined that stress-response genes exhibit substantial individ-
ual or within-strain variability [7]. Thus, these inter-strain
measurements represent a level of consistency superimposed
on the underlying gene expression variability. The specific
reason for the high representation of the stress-response
genes in these experiments has not been determined. A rapid
physiological response to the process of CO
2
-induced death
could be contributory. If so, then these results indicate a
robust strain-dependent physiological difference in the
response to sacrifice. Alternatively, these gene expression
patterns might reflect fundamental differences between
strains relating to the generation and control of oxidative
stress that could correlate with differences in lifespan and dis-
ease susceptibility.
To determine if the intra- and inter-strain gene expression
measurements were reproducible, we examined selected
genes in 3 additional mice from each strain, all males between
68 and 72 days old. To ensure that inconsistencies in RNA
isolation and cDNA synthesis procedures were not contribut-
ing to variance, we resected the livers from the additional
mice, divided each liver into four sections, and separately iso-
lated RNA from each portion. We used quantitative RT-PCR
to measure transcript levels for three genes that varied
between strains but were stable within strain (Cth, ApoA4,
Dnase2a), two genes that varied within strain (Cish and
Socs2), and one gene that was stable both within and between
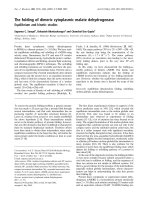
strains (S16). The results demonstrated highly reproducible
intra-individual measurements in the RNA samples isolated
from the same mouse (standard deviation ± 0.4-fold), a result
that indicates minimal technical variation associated with
RNA preparations (Figure 2). Concordant with the results
Table 1
Variable genes within strains
129 Balb/c CD1 FVB CFW
Total variable genes* 554(23%) 1,059(44%) 749(31%) 610(26%) 661(28%)
>1.5-fold difference 240(10%) 371(16%) 384(16%) 255(11%) 280(12%)
>2.0-fold difference 67(2.8%) 68(2.9%) 61(2.6%) 64(2.7%) 74(3.1%)
>3.0-fold difference 13(0.5%) 11(0.5%) 7(0.3%) 8(0.3%) 19(0.8%)
*At a pFDR of 10%
R26.4 Genome Biology 2006, Volume 7, Issue 3, Article R26 Pritchard et al. />Genome Biology 2006, 7:R26
Figure 1 (see legend on next page)
Gene HUGO Accession Q-val ∆
fold
Cystathione gamma-lyase*
Cth
AI427530
0.00
3.2
Deoxyribonuclease II*
Dnase2a
AI666549
0.07
5.1
Deleted in po lyposis 1
Dp1
AI324241
0.07
1.6
Apolipoprotein A4*
Apoa4
AI326922
0.07
4.2
AMP deaminase 2
Ampd2
AI450899
0.07
4.0
Ferritin light chain 1
Ftl1
AI449517
0.07
1.8
NA DPH ox idas e 4
Nox4
AI452077
0.07
2.4
Aldo-keto reductase*
Akr1e1
AI451194
0.07
1.5
Cytochrome P450, 4a14
Cyp4a14
AI385721
0.07
3.6
Insulin induced gene 2
Insig2
AI893426
0.07
3.5
T-complex testis expressed 1
Tctex 1
AI413228
0.07
2.1
Immune associated nucleotide 1
Ian1
AI465254
0.07
2.7
Membrane-spanning 4-dom A1
Ms4a1
AI413394
0.08
2.0
Four jointed box 1
Fjx1
AI465262
0.08
2.2
Neurogranin
Snx3
AI327212
0.08
2.8
Stromal cell derived factor 1
Cxcl12
AI326818
0.08
1.3
SAM decarboxylase 1
Amd1
AI528734
0.08
2.5
HLA class II antigen E beta
H2-Eb1
AI324640
0.08
2.1
Acylphosphatase 2
Acyp2
AI323599
0.08
2.2
Elong of long chain fatty acids 6
Elovl6
AI327338
0.08
2.2
Cyclin D1
Ccnd1
AI894115
0.08
4.1
Balb
FVB
129
CD1
CFW
*These genes were confimed by quantitative PCR
(a)
(b) (c)
129 Balb CD1 FVB CFW129 Balb CD1 FVB CFW
Fold difference
129 Balb CD1 FVB CFW129 Balb CD1 FVB CFW
129 Balb CD1 FVB CFW129 Balb CD1 FVB CFW129 Balb CD1 FVB CFW129 Balb CD1 FVB CFW 129 Balb CD1 FVB CFW129 Balb CD1 FVB CFW
129 Balb CD1 FVB CFW129 Balb CD1 FVB CFW
Dnase2a Apoa4 Pfk2
S16Akr1e1Cth
Fold difference
Fold difference
Fold difference
Fold difference
Fold difference
-3 -2 -1.5 -1.2 0 1.2 1.5 2 3
Fold scale
Genome Biology 2006, Volume 7, Issue 3, Article R26 Pritchard et al. R26.5
comment reviews reports refereed researchdeposited research interactions information
Genome Biology 2006, 7:R26
from the original mice, Cth exhibited a low level of intra-
strain variability, but was expressed approximately fourfold
lower in the FVB and CFW strains (Figure 2a). Measurements
of ApoA4 and Dnase2a expression were also highly concord-
ant with the original results (see Additional data file 2, sup-
plemental Figure 1a,b). CisH and Socs2 expression again
exhibited substantial within-strain variability, with measure-
ments differing by up to 50-fold between Balb/c mice (Figure
2b; Additional data file 2, supplemental Figure 1c), while S16
expression remained quite stable across individuals and
strains (Figure 2c).
We anticipated that transcripts expressed differentially
between mouse strains would primarily reflect heritable dif-
ferences in strain genomes. As such, mice sharing a common
ancestry might be expected to exhibit similar variability in
gene expression compared to more distantly related mice.
Supporting this concept are studies in humans showing less
variability in lymphocyte transcript levels between identical
twins relative to siblings, and siblings relative to unrelated
individuals [8]. We performed hierarchical clustering on the
subset of genes exhibiting significant inter-strain differences
and arranged the different mouse strains according to their
similarities in expression profiles (Figure 3). Clustering based
on the entire list of genes, either unweighted or weighted by
F-values, produced similar results (data not shown). Compar-
ing this expression-based dendrogram with the known phylo-
genetic relationship of these strains supports a genetic basis
for a component of the expression variability [17].
To assess the effects of pooling on the ability to characterize
inter-strain variation in liver gene expression, we performed
a separate microarray analysis using RNA samples combined
from the three mice of each strain. Four replicate arrays were
hybridized for each of the five pooled strain samples with two
replicates in each dye orientation. We identified 374 genes
(about 15% of all genes included in the analysis) that varied
significantly between strains using a pFDR of 10%. Of the 66
genes exhibiting significant inter-strain variability deter-
mined from analyses of individual mice, 60 were evaluable in
this experiment and 41 (68%) were also determined to be var-
iable in the analysis of pooled samples. These results indicate
that a large portion of genes presumed to be variable between
mouse strains and representing potential genetic determi-
nants of quantitative phenotypic traits are actually quite noisy
among individuals. This conclusion is easily visualized by
plotting the transcript levels for individual mice and for
pooled mice (Figure 4a). Genes, such as Cystathione gamma-
lyase (Cth), that vary significantly in both the individual and
pooled analyses showed relatively steady expression within
each strain (Figure 4b), while genes that vary significantly
only in the pooled analysis, such as CisH, tend to have high
intra-strain variance (Figure 4c). This result emphasizes that
for many genes the intra-strain or within-genotype variation
is large, and a single pool of a small number of mice will not
accurately reflect the population mean for the most variable
genes.
Discussion
Comprehensive studies of gene expression in model organ-
isms such as Saccharomyces and Drosophila have delineated
the contributions of age, sex, and genotype to corresponding
variations in transcript levels. However, the size constraints
of these species necessitates the use of sample pools
composed of hundreds to millions of discrete organisms, an
approach that eliminates the ability to assess variability at the
level of the individual. In contrast, assessing the relationships
between the genome and gene expression variability in
humans is hampered by the inability to precisely control the
multitude of environmental influences that profoundly influ-
ence gene expression in qualitative and quantitative ways. In
this context, the mouse represents a useful model system
highly suited for establishing that component of variability
that is independent of diversity directly encoded in the
genome. Measurements of intra-strain gene expression levels
reflect the allowable latitudes of gene expression in any single
individual in a fixed environment at a given point in time. The
inter-strain measurements reflect the additional contribution
of heterogeneity at the level of the genome.
Based on the analyses of transcript levels in individual mice,
we found the greatest contribution to overall gene expression
variability occurred among genetically identical individuals:
23% to 44% of all genes exhibited measurable variation,
depending on strain (see Additional data file 2, supplemental
Figure 3). Substantially less variance was attributable to
genome differences between strains (about 2.8%). Few stud-
ies assessing natural gene expression variability in mamma-
lian species that might provide a context for these findings
Genes exhibiting inter-strain expression variabilityFigure 1 (see previous page)
Genes exhibiting inter-strain expression variability. (a) Genes with the most statistically significant inter-strain variance are shown using a color scale to
indicate relative expression levels in the five strains. ESTs and uncharacterized transcripts are not shown. Red indicates higher expression and green
indicates lower expression relative to other strains. The q-values (Q-Val) indicate the probability that each gene is falsely discovered as variable between
strains. ∆ fold refers to the difference in gene expression levels between the strains with the highest and lowest measurements. (b) Confirmation of
transcripts with variable expression. Quantitative RT-PCR measurements of transcripts encoding apolipoprotein A-IV (ApoA4), Dnase2, aldo-keto
reductase (Akr1e1), and cystathione gamma-lyase (Cth). Open bars represent results of RT-PCR quantification. Gray bars represent results of microarray
quantification. (c) Confirmation of transcripts with stable expression. Quantitative RT-PCR measurements of transcripts encoding phosphofructo-kinase 2
(Pfk2), and ribosomal protein S16. S16 expression levels were used to normalize real-time PCR data, although there was not more than a 1.5-fold
difference in S16 expression between any two mice. Results are expressed as fold differences relative to the lowest expressing strain for each gene (set to
a value of 1). Error bars indicate the standard deviation of 12 microarray or 9 real-time PCR experiments.
R26.6 Genome Biology 2006, Volume 7, Issue 3, Article R26 Pritchard et al. />Genome Biology 2006, 7:R26
have been reported. Analyses of transcript levels in skeletal
muscle between five mouse strains found greater inter-strain
than intra-strain differences. [18]. This suggests that muscle
tissue exhibits a narrow range of normal variation relative to
liver. However, the study design in which two mice per strain
and two microarrays per mouse were compared provides sub-
stantially less statistical power to detect differences within
strain. Interestingly, concordant with the findings reported
here, Balb/c mice demonstrated the greatest level of intra-
strain variation. A comparative analysis of mRNA abundance
levels in the hippocampus of mice from 8 mouse strains iden-
tified more than 200 genes with significant strain differences
using very stringent statistical criteria [19]. The experimental
design involved tissue pooled from six mice of each strain,
rather than individual mice. This pooling strategy was appar-
ently based in part on the results of a prior microarray study
indicating that transcript levels of genes expressed in the hip-
pocampus of genetically identical mice were quite similar
with only about 0.1% of all transcripts called differentially
expressed [20]. It is possible that there is lower inter-individ-
ual variability in hippocampus than in liver. However, this
previous study directly compared only pairs of mice in a head-
to-head fashion, and the criteria for differential expression
were based on a 1.7-fold change in abundance level, and not
on statistical criteria.
Overall, we found that the expression of most hepatic genes in
mice housed in standard 'steady-state' laboratory vivarium
conditions is similar between individuals of the same or dif-
ferent strain. However, the transcript levels of a sizeable
minority varied substantially. The proportion of genes exhib-
iting significantly variable expression between individual fish
(18%) [6], yeast strains (24%) [4], and fly genotypes (25%) [5]
is similar to that observed here between individual mice (23%
to 44%). Analyses of gene expression in human tissues have
also shown considerable variability between individuals.
Importantly, substantial contributions to this variation can-
not be attributed to genotypic differences between subjects
[8,21,22]. Comparisons of transcript and protein levels
between humans and non-human primates identified signifi-
cantly greater variation among the human subjects than
Figure 2
Cth
-4
-3
-2
-1
0
1
2
3
4
Original mice
Repeated mice
Log
2
fold
129 Balb/c CD1 FVB CFW
CisH
-4
-3
-2
-1
0
1
2
3
4
Original mice
Repeated mice
Log
2
fold
129 Balb/c CD1 FVB CFW
CisH
-4
-3
-2
-1
0
1
2
3
4
129 Balb/c CD1 FVB CFW
S16
-4
-3
-2
-1
0
1
2
3
4
129 Balb/c CD1 FVB CFW
Original mice
Repeated mice
S16
-4
-3
-2
-1
0
1
2
3
4
129 Balb/c CD1 FVB CFW
Log
2
fold
Reproducibility of variant and invariant gene expression characteristicsFigure 2
Reproducibility of variant and invariant gene expression characteristics.
Quantitative RT-PCR measurements of Cth, CisH, and S16 transcript levels
are shown for the original three mice used in the microarray experiments
(blue squares), and a second cohort of three additional mice from each
strain (gray triangles). The original mouse measurements for Cth and S16
are the same as in Figure 1c, but presented here in log
2
scale. Mice in the
second cohort underwent 4 independent RNA preparations from each
liver (total of 12 RNA preparations per strain). Error bars represent the
standard deviation of transcript measurements from the four RNA
preparations, or from four replicate PCR reactions in the case of the
original mice (note that for some measurements, the error bars fall within
the square). Quantitative RT-PCR measurements of Apoa4, Dnase2a, and
Socs2 from the additional mice are shown in Additional data file 2
(supplemental Figure 1).
Genome Biology 2006, Volume 7, Issue 3, Article R26 Pritchard et al. R26.7
comment reviews reports refereed researchdeposited research interactions information
Genome Biology 2006, 7:R26
between humans and chimpanzees [23], a finding further
supporting the conclusion that a sizeable component of tran-
script abundance measurements reflects non-genomic
variation.
There are several possible contributors to the gene expression
variability observed in genetically identical individuals. Tech-
nical factors include subclinical disease states, unrecognized
differences in environments and diet, or heterogeneity in the
cell-type compositions of the analyzed tissues. We attempted
to precisely control environmental and handling effects dur-
ing the design of this study, and we did not observe any histo-
logical differences in the cellular composition of livers within
or between strains. The ideal experiment would assess tem-
poral variation in tissue transcript levels within an individual
mouse, but in the case of liver gene expression these measure-
ments would be confounded by changes resulting from
repeated tissue biopsies. Importantly, our analyses of sepa-
rate liver samples acquired from the same mouse yielded
highly concordant transcript measurements.
One component of inter-individual variability could be repre-
sented by stochastic events or noise. Recently, gene expres-
sion measurements at the level of the single cell have
provided direct experimental evidence of quantifiable contri-
butions of stochastic biochemical noise to phenotypic varia-
tion in isogenic populations [24,25]. The end-result of this
component of variability has long been appreciated through
studies of developmental processes that revealed require-
ments for feed-back amplifications of initial asymmetrical
noise for cell fate determination [26].
A second potential contributor to individual differences in
gene expression centers on epigenetic regulation. Methyla-
tion of cytosine residues in the CpG islands of gene promoters
and the covalent modifications of histones represent two
important epigenetic modifications that influence gene
transcription. Recent studies emphasize the importance of
these regulatory mechanisms for dictating phenotypes in
individuals with minimal divergence in genome sequence. A
provocative report by Rakyan et al. [27] determined that the
penetrance of the highly variable kinky-tail phenotype found
in the well-studied Axin-fused (Axin
Fu
) mouse strain corre-
lated with the differential methylation of a retrotransposon
within Axin
Fu
. Importantly, the methylation state of the retro-
transposon was inherited transgenerationally after both
maternal and paternal transmission, and was influenced by
strain background. Striking differences in DNA methylation
and histone acetylation have been observed in identical twins
with increasing 'epigenetic drift' associated with advanced
age [28]. Similar age-related epigenetic shifts have been
reported in mice [29]. In the studies reported here, we found
several genes that exhibited high variability in more than one
strain, suggesting that certain genomic loci may be prone to
imprecise regulatory control.
Conclusion
In the context of complex multicellular organisms, the end-
result of phenotypic diversity in the setting of a fixed genome
has long been appreciated. Toxicology studies have repeat-
edly shown differing susceptibilities to drug effects, such as
carcinogen-induced tumor promotion within isogenic mouse
strains [30]. Genetically identical animals aged under tightly
controlled environments exhibit wide ranges in lifespans [31].
Indeed, the seeming incongruity between genetic homogene-
ity and phenotypic variability was recognized more than 40
years ago [32]. Importantly, the magnitude of gene expres-
sion variability measured in this study suggests either a toler-
ance for wide abundance ranges of certain transcripts, or
potentially an organismal advantage for maintaining a state
of gene expression variability offering an additional level of
phenotypic opportunity for natural selection.
Materials and methods
Animal work and RNA preparation
Mice were purchased from Charles River Laboratories (Wilm-
ington, MA, USA), maintained in a barrier facility and cared
for in accordance with an approved Animal Care and Use
Committee (IACUC) protocol. All mice were between 68 and
73 days old and were housed in identical environments with
the same diet (Harlan Teklad 8664), constant temperature
(20 to 22°C), and consistent light and dark cycles (controlled
photoperiod of 12 hour light/12 hour dark). Water was pro-
vided ad libitum. Three male mice were sacrificed from each
of the following strains (nomenclature in italics is used
throughout this paper): 129S4 (129), Balb/cAnNCrlBR
(Balb/c), Crl:CD-1
®
(ICR)BR (CD1), FVB/NCrlBR (FVB), and
Crl:CFW
®
(SW)BR (CFW); CFW is sometimes referred to as
'Swiss Webster'. Each mouse was brought individually into a
separate room for sacrifice and killed in a CO
2
chamber. The
liver, left kidney, and left testis were removed from each
mouse and immediately snap-frozen in liquid nitrogen. Care
was taken to ensure that the minimum amount of time
elapsed from the sacrifice of the first mouse to the last. Total
Gene expression and mouse strain relationshipsFigure 3
Gene expression and mouse strain relationships. (a) Mouse strain
relationships based upon a hierarchical cluster analysis of the 66 genes
exhibiting differential expression between strains with a pFDR of <10%
(individual mouse analysis). (b) Mouse strain relationships based upon
published genealogy [17].
Genealogy
CD1
Balb/c
FVB
129
CFW
Microarray
Balb/c
FVB
129
CD1
CFW
Microarray
(a) (b)
R26.8 Genome Biology 2006, Volume 7, Issue 3, Article R26 Pritchard et al. />Genome Biology 2006, 7:R26
RNA was extracted from the tissue using the TRIzol reagent
(Life Technologies, Grand Island, NY, USA) according to the
manufacturer's protocol. For an RNA reference standard,
equal quantities of total RNA were combined from all three
organs of all the mice. This same reference RNA was used on
every array to standardize comparisons between arrays. For
Comparison of transcript levels exhibiting inter-strain variability determined by analyses of individual samples and pooled samplesFigure 4
Comparison of transcript levels exhibiting inter-strain variability determined by analyses of individual samples and pooled samples. (a) Examples of genes
that demonstrated significant inter-strain variance after pooling the RNA from three mice of each strain. The relative expression values are shown for the
three mice individually (1, 2, 3) and for the three mice pooled (P). Note that the individual and pooled results are data from independent hybridizations. Q-
values are listed for both the individual mouse experiment (q1) and the pooled mouse experiment (q2), and values less than 0.1 are shaded gray to indicate
statistical significance. Genes with low intra-strain variability (stable within strain) were statistically significant in both the individual and pooled
experiments, while genes that had large intra-strain variability (noisy within strain) were significant only in the pooled experiment. Asterisks denote genes
that were verified by quantitative PCR. (b) Genes such as Cth were relatively stable within strain. (c) Genes such as CisH were relatively noisy within
strain. Error bars indicate standard deviations of four microarray experiments.
(b)
-2
-1
0
1
2
129 Balb/c CD1 FVB CFW
Individual Pooled
Cth
(c)
Cish
-2
-1
0
1
2
129 Balb/c CD1 FVB CFW
Individual Pooled
number
Accession
Gene
123P 123P 123P 123P 123P
q1 q2
Fold
AI427530
Cth*
0.7 0.5 0.5 0.7 0.7 0.8 0.6 0.6 1 0.4 0.4 0.7 -1 -1 -1 -1 -1 -1 -1 -1
0.00
0.03
4.4
AI666549
Dnase2a*
-1 -0 -0 -1 -1 -1 -1 -1 1.3 1.7 1.5 1.7 -1 -1 -1 -1 0.6 1.3 0.7 0.9
0.07
0.03
7.3
AI324241
Dp1
-0 -0 -0 -0 -0 -0 -0 -0 0.3 0.2 0.5 0.2 -0 0 0.1 0 0.4 0.3 0.2 0.3
0.07
0.04
1.9
AI326922
Apoa4*
1.7 1.5 0.9 1.1 -0 -1 -1 -0 00.1-0 -0 -1 -1 -1 -1 -0 0.1 0 0
0.07
0.03
5.7
AI385721
Akr1e1*
0.4 0.2 0.4 0.4 0.6 0.4 0.3 0.5 0.6 0.4 -0 0.2 0.3 0.4 0.4 0.5 -1 -1 -2 -2
0.07
0.03
5.5
AI528734
Cxcl12
-0 0.1 -0 -0 -0 0.1 -0 -0 0.6 1.1 0.6 0.8 0.1 -0 00.1 -1 -0 -0 -1
0.08
0.03
4.1
AI324640
Amd1
0.3 0.5 0.7 0.5 0.2-00.10.1 -00.2-0 -0 -0 -0 -1 -0 -0 0.2 -0 -0
0.08
0.03
2.9
AI426335
Mmp24
-1 -0 -1 -1 0.7 0.5 0.2 0.5 0.2 0.5 -0 0.2 -0 -0 -0 -0 0.5 0.4 -0 0.4
0.08
0.03
2.9
AI385595
Cish*
1.1 0.8 0.7 1 -0 -2 1.7 0.6 -0 0.4 -1 -1 -1 -1 0.3 -1 0.7 0.2 0.4 0.3
0.64
0.03
12.1
AI414501
Slc25a13
0 -2 0.3 0.1 0.5 0.3 0.6 0.4 -0 -1 0.1 -1 0.2 0.2 0.1 0.3 0-00.4 -0
0.59
0.03
4.6
AI464459
Socs2
0.7 0.4 1 0.6 -1 -1 0.5 -1 -0 0 -1 -1 -1 0.1 -0 -0 0.2 0.3 1.1 0.8
0.36
0.03
4.8
AI452212
Vps54
-0 -1 0.6 -0 1 0.3 0.1 0.3 -0 -1 -0 -1 0.4 0.4 -0 0.3 0-00.2 0.2
0.49
0.03
4.3
AI323895
Gmppb
-1 -1 0.2 -1 0.9 0.6 -0 0.5 0.1 -0 0.2 0.1 0.5 0.4 -1 -0 0.1 0.2 -0 0
0.60
0.03
3.6
AI450826
Hhex
0.5 1.2 -0 0.3 -0 -0 1.1 0.1 -0 0.6 -0 0.2 0 -0 -0 -0 -1 -1 -0 -1
0.56
0.04
4.2
NM_008549
Man2a1
-0 -1 -0 0.2 -0 0.4 0.9 0.4 -0 -1 0.4 -0 -0 -0 0.4 0.1 -0 -0 0.4 -0
0.68
0.07
4.0
AI528531
Pdha1
-0 -2 0.4 0 0.9 -0 -0 0.2 -0 -1 -0 -1 0.4 0.4 0.2 0.3 0.4 0.3 0.2 0
0.59
0.08
5.3
-2 -2 -1 -1 # -0 -0 -0 -0 0000.3 0 0.3 0.4 0.4 0.4 10.90.91.7 1.7
129
Balb/c
CFW
CD1
FVB
1.2
1.5
2
-2
-1.5
-1.2
0
3
Fold scale
*These genes were confirmed by quantitative real-time RT-PCR
-3
Steady within strain .
Noisy within strain .
(a)
Log
2
fold
Log
2
fold
Genome Biology 2006, Volume 7, Issue 3, Article R26 Pritchard et al. R26.9
comment reviews reports refereed researchdeposited research interactions information
Genome Biology 2006, 7:R26
confirmation studies, 3 additional male mice of each strain,
ages 68 to 72 days, were processed in a similar manner except
that the liver was divided into 4 sections before snap-freezing.
Microarray construction, probe generation, and data
collection
Each microarray comprised 5,285 mouse cDNAs obtained
from the Research Genetics' sequence-verified set of IMAGE
clones (Research Genetics, Invitrogen Corporation, Carlsbad,
CA, USA). All cDNA clones used for array construction were
sequence verified and annotated accordingly. Clone inserts
were amplified by PCR, purified, verified by gel electrophore-
sis and spotted onto polylysine-coated glass microscope
slides using a GeneMachines (San Carlos, CA, USA) robotic
spotter as described previously [7]. cDNA probes were gener-
ated from 50 µg of total RNA in a reaction volume of 30 µl
containing oligo(dT) primer/0.2 mM amino acid-dUTP
(Sigma-Aldrich, St Louis, MO, USA)/0.3 mM dTTP/0.5 mM
each dATP, dGTP, and dCTP/380 units of Superscript II
reverse transcriptase (Life Technologies). The purified cDNA
was combined with either Cy3 or Cy5 monoreactive fluoro-
phores (GE Healthcare, Piscataway, NJ, USA (formerly
Amersham Pharmacia)) that covalently couple to the cDNA-
incorporated aminoallyl linker in the presence of 50 mM
NaHCO
3
(pH 9.0). The experimental and reference probes
were combined and competitively hybridized to microarrays
under a coverslip in a volume of 24 µl for 16 h at 63°C. Slides
were washed in graded sodium chrolide/sodium citrate
buffer (SSC, 1× SSC = 0.15 M NaCl/0.015 M sodium citrate,
pH 7) and spun dry. Array images were collected for the Cy3
and Cy5 emissions using a GenePix 4000A fluorescent scan-
ner (Axon Instruments, Foster City, CA, USA). The image
data were extracted and analyzed using GENEPIX 3.0 micro-
array analysis software (Axon Instruments).
Data analysis
For each array spot, the intensity levels of the two fluoro-
phores were obtained by subtracting median background
intensity from median foreground intensity. A gene was only
considered expressed if the fluorescence intensity of the cor-
responding spot was at least six foreground pixels greater
than four standard deviations above background on every
array. For each gene, the logarithm base 2 ratios (referred to
henceforth as log ratios) of the two channels were calculated
to quantify to relative expression levels between the experi-
mental and reference samples. To allow for inter-array com-
parisons, each array was normalized to remove systemic
sources of variation. This normalization was accomplished by
means of a print-tip-specific intensity-based normalization
method. [33]. A scatter-plot smoother, which uses robust
locally linear fits, was applied to capture the dependence of
the log ratios on overall log-spot intensities. The log ratios
were normalized by subtracting the fitted values based on the
print-tip-specific scatter-plot smoother from the log ratios of
experimental and control channels. Examination of the
spread of the normalized log ratios via boxplots indicated no
systemic variation due to any experimental variable such as
different batches of arrays or RNA preparations. Therefore,
no scale adjustment was performed on the arrays before com-
bining data across samples.
The expression of genes that vary among mice within each
strain was evaluated using an ANOVA model (Pritchard et al.
[7]). Here, an F-value with degrees of freedom 2 and 8 was
used to assess the variability of mouse variance within each
strain.
To identify genes that varied among strains of mice, a nested
mixed effects ANOVA model was used. Specifically, the model
is written as:
y = overall mean + dye + strain + mouse within strain
where y is the normalized log
2
ratio and the mouse within
strain is a random effect. Treating the mouse as a random
effect basically assumes that the three mice have been ran-
domly selected from an 'infinite' mouse population of that
strain and its observed effect for a particular mouse is an
observation of a random variable. Specifically, the F test sta-
tistic is:
where
where ij indexes the ith mouse for the jstrain, and
ij
,
j
,
and are the means of normalized ratios for the ith mouse
in the jth strain, all mice in jth strain, and over all strains,
respectively. An F-value with degrees of freedom 4 and 10 for
each gene is used to assess how variable the gene is among
strains. An ANOVA table for this analysis is provided in Addi-
tional data file 2 (supplemental Table 1). To examine a possi-
ble dependence of statistical significance and signal intensity,
we plotted the F-values versus the log
2
(intensity
Cy3
+
intensity
Cy5
). There was no dependence on intensity for the
significant genes either within strain or between strains (see
Additional data file 2, supplemental Figure 2). The signifi-
cance of these F-values was determined through estimating
the pFDR, which is the proportion of falsely rejected hypoth-
eses among the rejected hypotheses for pre-selected critical
values [12]. As the overall goal here is to assess how genes
vary among and within strains, it is natural to control the pro-
portion of falsely rejected hypotheses among the rejected
F =
msStrain
msMouse Strain()
msStrain =−
=
∑
[*( )]/12 4
2
1
5
YY
j
j
msMouse Strain()[*( )]/=−
==
∑∑
410
2
1
3
1
5
YY
ij j
ij
Y Y
Y
R26.10 Genome Biology 2006, Volume 7, Issue 3, Article R26 Pritchard et al. />Genome Biology 2006, 7:R26
ones while examining the genes that vary among/within
strains. In this paper, the pFDR level was set to be 0.10. This
means that we expect 10% of our rejected hypotheses ('signif-
icant' genes) to have been falsely rejected. The pFDR level of
0.10 is a somewhat liberal cutoff as we are most interested in
assessing overall levels of variation rather than defining a
small subset of genes that vary with high confidence. A q-
value that measures the strength of the F-value with respect
to pFDR was also calculated for each gene using the algorithm
proposed by Storey and Tibshirani [12]. The q-value is the
minimum pFDR that occurs when rejecting a statistic with
the observed F-value for the set of nested rejected regions. To
avoid the distributional assumption, 1,000 bootstrap samples
were used to calculate the pFDRs for a series of critical values
and the q-values for all the genes.
To determine which gene ontology terms were enriched
among the variable genes we used EASE software. EASE com-
pares the proportion of genes that are assigned a given GO
term among the list of variable genes to the proportion of
genes with that GO term on the array as a whole. A statistical
score similar to a p value is generated based on the upper
bound of the distribution of Jackknife Fisher exact probabili-
ties. For genes that varied within strain we performed sepa-
rate EASE analyses for each strain, and then reported the GO
terms that were enriched by >1.5-fold in at least 4 out of 5
strains and had the lowest average EASE score (cell growth,
0.35; amine metabolism, 0.25; cytokine activity, 0.39; ubiq-
uitin ligase complex, 0.43).
Hierarchical clustering was performed using Cluster 3.0 soft-
ware (Michael Eisen, Stanford University). We used complete
linkage clustering for both genes and arrays with a correlation
(uncentered) similarity metric with data either unweighted or
weighted by F-value.
The normalized log ratios, F-values, q-values, and mean
squares for the 2,382 genes assessed in the unpooled analysis
are included in Additional data file 1. In addition, information
about the microarray used in this study and the unprocessed
gpr files may be obtained through the ArrayExpress website
at the European Bioinformatics Institute [34]. The accession
number is: A-MEXP-320.
Quantitative RT-PCR
Quantitative PCR was performed using SYBR GREEN as a
reporter as previously described [7]. Total RNA from each
mouse liver was treated with DnaseI, purified using a Rneasy
Minikit (Qiagen, Valencia, CA, USA), and 20 µg was used to
generate cDNA for PCR reactions. Primers to ribosomal pro-
tein S16 were used to normalize for cDNA loading. The
sequences of the primers used were: S16 forward, 5'-
AGGAGCGATTTGCTGGTGTGGA-3'; S16 reverse, 5'-GCTAC-
CAGGCCTTTGAGATGGA-3' (102 base-pair (bp) amplicon);
Pfk2 forward, 5'-AAGAGGCCAAAGCTGGAGG-3'; Pfk2
reverse, 5'-GTCAGCATTCCGGTGGTGTA-3'; Cth forward, 5'-
TCTTGCTGCCACCATTACGA-3'; Cth reverse, 5'-GCCTCCAT-
ACACTTCATCCAT-3'; Dnase2a forward, 5'-TCCAG-
GGAAAACTGCTGACC-3'; Dnase2a reverse, 5'-
AGGAAAAGGCTGTCGGTGG-3'; Apoa4 forward, 5'-
AGACAGGTGGTGGGGCAGGAC-3'; Apoa4 reverse, 5'-
GCCCTCAGCCCATCACAGCAG-3'; Akr1e1 forward, 5'-
CAAGGAGGGCGTGGTGAAGAG-3'; Akr1e1 reverse, 5'-GCT-
GGTGTGACTGGGTATGAC-3'; Cish forward, 5'-GGT-
GGGGCACAACATAGAGA-3'; Cish reverse, 5'-
GGTGGCCAGACAGACAGGAG-3'; Socs2 forward, 5'-
GGAATGGGACTGTTCACCTG-3'; Socs2 reverse, 5'
GCAGAGTGGGTGCTGATGTA-3'.
Additional data files
The following additional data are available with the online
version of this paper. Additional data file 1 is a Microsoft
Excel file containing the normalized log ratios, F-values, q-
values, and mean squares for the 2,382 genes assessed in the
unpooled analysis. Additional data file 2 contains two supple-
mental tables and three supplemental figures. Supplemental
Table 1 shows the analysis of variance for the mixed effect
model. Supplemental Table 2 shows selected genes with vari-
able expression within mouse strains. Supplemental Figure 1,
titled 'F-values are independent of intensity', shows plots of
F-values versus intensity for each of the 2,383 genes analyzed
both within and between strains. Supplemental Figure 2,
titled 'Quantitative RT-PCR analysis on replicate mice con-
firms the expression variability patterns of ApoA4, Dnase2a
and Socs2', shows transcript abundance measurements from
independent RNA preparations from the same liver samples
compared across different mice of different strains. Supple-
mental Figure 3, titled 'Comparisons of variances associated
with array, mouse, and strain', shows the numbers of variable
genes at specific average fold-changes across different mouse
strains.
Additional File 1The normalized log ratios, F-values, q-values, and mean squares for the 2,382 genes assessed in the unpooled analysisThe normalized log ratios, F-values, q-values, and mean squares for the 2,382 genes assessed in the unpooled analysisClick here for fileAdditional File 2Two supplemental tables and three supplemental figuresSupplemental Table 1 shows the analysis of variance for the mixed effect model. Supplemental Table 2 shows selected genes with var-iable expression within mouse strains. Supplemental Figure 1, titled 'F-values are independent of intensity', shows plots of F-val-ues versus intensity for each of the 2,383 genes analyzed both within and between strains. Supplemental Figure 2, titled 'Quanti-tative RT-PCR analysis on replicate mice confirms the expression variability patterns of ApoA4, Dnase2a and Socs2', shows tran-script abundance measurements from independent RNA prepara-tions from the same liver samples compared across different mice of different strains. Supplemental Figure 3, titled 'Comparisons of variances associated with array, mouse, and strain', shows the numbers of variable genes at specific average fold-changes across different mouse strains.Click here for file
Acknowledgements
We thank Barbara Trask and Catherine Peichel for critical reviews of this
work and for helpful suggestions. We thank the microarray facility at the
Fred Hutchinson Cancer Research Center. This work was supported by
NIH grant DK65204, CA84294 and CA85859. CP was supported by a
Poncin Scholarship and a Molecular Training Program in Cancer Research
Fellowship (T32 CA09437).
References
1. Lin MT, Storer B, Martin PJ, Tseng LH, Gooley T, Chen PJ, Hansen JA:
Relation of an interleukin-10 promoter polymorphism to
graft-versus-host disease and survival after hematopoietic-
cell transplantation. N Engl J Med 2003, 349:2201-2210.
2. Sachse C, Brockmoller J, Bauer S, Roots I: Cytochrome P450 2D6
variants in a Caucasian population: allele frequencies and
phenotypic consequences [see comments]. Am J Hum Genet
1997, 60:284-295.
3. Schena M, Shalon D, Davis RW, Brown PO: Quantitative monitor-
ing of gene expression patterns with a complementary DNA
microarray. Science 1995, 270:467-470.
4. Brem RB, Yvert G, Clinton R, Kruglyak L: Genetic dissection of
transcriptional regulation in budding yeast. Science 2002,
296:752-755.
Genome Biology 2006, Volume 7, Issue 3, Article R26 Pritchard et al. R26.11
comment reviews reports refereed researchdeposited research interactions information
Genome Biology 2006, 7:R26
5. Jin W, Riley RM, Wolfinger RD, White KP, Passador-Gurgel G, Gib-
son G: The contributions of sex, genotype and age to tran-
scriptional variance in Drosophila melanogaster. Nat Genet
2001, 29:389-395.
6. Oleksiak MF, Churchill GA, Crawford DL: Variation in gene
expression within and among natural populations. Nat Genet
2002, 32:261-266.
7. Pritchard CC, Hsu L, Delrow J, Nelson PS: Project normal: defin-
ing normal variance in mouse gene expression. Proc Natl Acad
Sci USA 2001, 98:13266-13271.
8. Cheung VG, Conlin LK, Weber TM, Arcaro M, Jen KY, Morley M,
Spielman RS: Natural variation in human gene expression
assessed in lymphoblastoid cells. Nat Genet 2003, 33:422-425.
9. Phelan JP, Austad SN: Selecting animal models of human aging:
inbred strains often exhibit less biological uniformity than F1
hybrids. J Gerontol 1994, 49:B1-11.
10. Healey SC, Kirk KM, Hyland VJ, Munns CF, Henders AK, Batch JA,
Heath AC, Martin NG, Glass IA: Height discordance in monozy-
gotic females is not attributable to discordant inactivation of
X-linked stature determining genes. Twin Res 2001, 4:19-24.
11. Bailey DW: How pure are inbred strains of mice? Immunol Today
1982, 3:210-214.
12. Storey JD, Tibshirani R: Statistical significance for genomewide
studies. Proc Natl Acad Sci USA 2003, 100:9440-9445.
13. Williams SC, Grant SG, Reue K, Carrasquillo B, Lusis AJ, Kinniburgh
AJ: cis-acting determinants of basal and lipid-regulated apol-
ipoprotein A-IV expression in mice. J Biol Chem 1989,
264:19009-19016.
14. Reue K, Purcell-Huynh DA, Leete TH, Doolittle MH, Durstenfeld A,
Lusis AJ: Genetic variation in mouse apolipoprotein A-IV
expression is determined pre- and post-transcriptionally. J
Lipid Res 1993, 34:893-903.
15. Wong WM, Hawe E, Li LK, Miller GJ, Nicaud V, Pennacchio LA, Hum-
phries SE, Talmud PJ: Apolipoprotein AIV gene variant S347 is
associated with increased risk of coronary heart disease and
lower plasma apolipoprotein AIV levels. Circ Res 2003,
92:969-975.
16. Clothier B, Robinson S, Akhtar RA, Francis JE, Peters TJ, Raja K, Smith
AG: Genetic variation of basal iron status, ferritin and iron
regulatory protein in mice: potential for modulation of oxi-
dative stress. Biochem Pharmacol 2000, 59:115-122.
17. Beck JA, Lloyd S, Hafezparast M, Lennon-Pierce M, Eppig JT, Festing
MF, Fisher EM: Genealogies of mouse inbred strains. Nat Genet
2000, 24:23-25.
18. Turk R, t Hoen PA, Sterrenburg E, de Menezes RX, de Meijer EJ, Boer
JM, van Ommen GJ, den Dunnen JT: Gene expression variation
between mouse inbred strains. BMC Genomics 2004, 5:57.
19. Fernandes C, Paya-Cano JL, Sluyter F, D'Souza U, Plomin R, Schalk-
wyk LC: Hippocampal gene expression profiling across eight
mouse inbred strains: towards understanding the molecular
basis for behaviour. Eur J Neurosci 2004, 19:2576-2582.
20. Carter TA, Del Rio JA, Greenhall JA, Latronica ML, Lockhart DJ, Bar-
low C: Chipping away at complex behavior: transcriptome/
phenotype correlations in the mouse brain. Physiol Behav 2001,
73:849-857.
21. Whitney AR, Diehn M, Popper SJ, Alizadeh AA, Boldrick JC, Relman
DA, Brown PO: Individuality and variation in gene expression
patterns in human blood. Proc Natl Acad Sci USA 2003,
100:1896-1901.
22. Schadt EE, Monks SA, Drake TA, Lusis AJ, Che N, Colinayo V, Ruff
TG, Milligan SB, Lamb JR, Cavet G, et al.: Genetics of gene expres-
sion surveyed in maize, mouse and man. Nature 2003,
422:297-302.
23. Enard W, Khaitovich P, Klose J, Zollner S, Heissig F, Giavalisco P,
Nieselt-Struwe K, Muchmore E, Varki A, Ravid R, et al.: Intra- and
interspecific variation in primate gene expression patterns.
Science 2002, 296:340-343.
24. Elowitz MB, Levine AJ, Siggia ED, Swain PS: Stochastic gene
expression in a single cell. Science 2002, 297:1183-1186.
25. Ozbudak EM, Thattai M, Kurtser I, Grossman AD, van Oudenaarden
A: Regulation of noise in the expression of a single gene. Nat
Genet 2002, 31:69-73.
26. Lai EC: Notch signaling: control of cell communication and
cell fate. Development 2004, 131:965-973.
27. Rakyan VK, Chong S, Champ ME, Cuthbert PC, Morgan HD, Luu KV,
Whitelaw E: Transgenerational inheritance of epigenetic
states at the murine Axin(Fu) allele occurs after maternal
and paternal transmission. Proc Natl Acad Sci USA 2003,
100:2538-2543.
28. Fraga MF, Ballestar E, Paz MF, Ropero S, Setien F, Ballestar ML, Heine-
Suner D, Cigudosa JC, Urioste M, Benitez J, et al.: From the cover:
Epigenetic differences arise during the lifetime of monozy-
gotic twins. Proc Natl Acad Sci USA 2005, 102:10604-10609.
29. Bennett-Baker PE, Wilkowski J, Burke DT: Age-associated activa-
tion of epigenetically repressed genes in the mouse. Genetics
2003, 165:2055-2062.
30. Wolff GL: Variability in gene expression and tumor formation
within genetically homogeneous animal populations in
bioassays. Fundam Appl Toxicol 1996, 29:176-184.
31. Martin GM: Epigenetic drift in aging identical twins. Proc Natl
Acad Sci USA 2005, 102:10413-10414.
32. Wolff GL: Some genetic aspects of physiological variability.
Cancer Res 1961, 21:1119-1123.
33. Dudoit S, Yang Y, Callow M, Speed T: Technical report Berkeley:
Department of Statistics, University of California at Berkeley; 2000.
34. ArrayExpress Database [ />