Báo cáo y học: "A classification based framework for quantitative description of large-scale microarray data" ppsx
Bạn đang xem bản rút gọn của tài liệu. Xem và tải ngay bản đầy đủ của tài liệu tại đây (1.05 MB, 17 trang )
Genome Biology 2006, 7:R32
comment reviews reports deposited research refereed research interactions information
Open Access
2006Sangurdekaret al.Volume 7, Issue 4, Article R32
Method
A classification based framework for quantitative description of
large-scale microarray data
Dipen P Sangurdekar
*†
, Friedrich Srienc
*†
and Arkady B Khodursky
†‡
Addresses:
*
Department of Chemical Engineering and Materials Science, University of Minnesota, Saint Paul, MN 55108, USA.
†
Biotechnology
Institute, University of Minnesota, Saint Paul, MN 55108, USA.
‡
Department of Biochemistry, Molecular Biology and Biophysics, University of
Minnesota, Saint Paul, MN 55108, USA.
Correspondence: Arkady B Khodursky. Email:
© 2006 Sangurdekar et al.; licensee BioMed Central Ltd.
This is an open access article distributed under the terms of the Creative Commons Attribution License ( which
permits unrestricted use, distribution, and reproduction in any medium, provided the original work is properly cited.
Quantitative array data description<p>A new classification-based framework is presented that allows quantitative description of microarray data in terms of significance of co-expression within any gene group and condition-specific gene class activity.</p>
Abstract
Genome-wide surveys of transcription depend on gene classifications for the purpose of data
interpretation. We propose a new information-theoretical-based method to: assess significance of
co-expression within any gene group; quantitatively describe condition-specific gene-class activity;
and systematically evaluate conditions in terms of gene-class activity. We applied this technique to
describe microarray data tracking Escherichia coli transcriptional responses to more than 30
chemical and physiological perturbations. We correlated the nature and breadth of the responses
with the nature of perturbation, identified gene group proxies for the perturbation classes and
quantitatively compared closely related physiological conditions.
Background
The advent of microarray technology has allowed parallel
measurements of abundances of thousands of transcripts [1].
The obtained information has been used to describe and
understand the transcriptional dynamics in the cell and gene-
interaction networks. Such analysis can be reduced to several
basic questions: which gene activity makes up a biological
response; what are the common characteristics of those
genes; and what is the molecular basis of those genes' co-
expression? Analysis of multi-dimensional expression data is
pivotal to such inferences, and a considerable volume of liter-
ature has been published detailing various computational and
statistical tools to analyze microarray data. Most of these pat-
tern recognition methods involve classification of profiles of
transcript abundances based on proximity or distance, in the
expression data space or in a reduced basis space. Such clas-
sifications usually yield groups of genes deemed to be co-
expressed, and biological interpretations follow to deduce the
physiological response of the cells [2-6].
Despite the popularity and wide applicability of these unsu-
pervised techniques, biological significance of those clusters
is sometimes difficult to assess because of uncertainties con-
cerning the cluster membership and reproducibility. The
clusters or patterns obtained generally consist of a set of
genes enriched to various extents for a particular biological
function/process/compartment along with genes that cannot
be easily co-classified and are forced to fit into a cluster.
Under different conditions, these genes may or may not be co-
regulated, thus causing the cluster to lose its identity. This
observation has spurred the development of condition-spe-
cific classification of multiple or large-scale gene expression
data. [7-11]. These algorithms largely involve partitioning the
expression data into condition-specific groups, in which the
expression of genes is most similar across the condition
selected for a group. Segal et al. [12] demonstrated that
expression data can be classified in terms of enriched func-
tional modules and, moreover, these modules can be associ-
ated with a regulatory program. Ihmels et al [9] proposed an
Published: 20 April 2006
Genome Biology 2006, 7:R32 (doi:10.1186/gb-2006-7-4-r32)
Received: 11 November 2005
Revised: 25 January 2006
Accepted: 15 March 2006
The electronic version of this article is the complete one and can be
found online at />R32.2 Genome Biology 2006, Volume 7, Issue 4, Article R32 Sangurdekar et al. />Genome Biology 2006, 7:R32
iterative signature algorithm (ISA), in which the entire
genome is scanned for groups of genes and conditions that
together yield a high threshold score. This algorithm can be
seeded with a biologically coherent group of genes, such as
genes involved in a pathway, and the iterations will yield a
refined module consisting of additional genes that may be
associated with the query genes and a set of conditions that
the genes are most co-regulated within. In these methods
again, it is assumed that a particular program or module is
associated with a biological function that is best co-regulated
within a set of conditions. However, the ISA method struggles
to find coherence within the classified groups, thus running
into similar issues that clustering-based algorithms face. Fur-
thermore, these module-based analyses (ISA [9], module
maps [10]) only allow for a 'binary' expression program,
wherein a group of genes is assumed to be changing direction
once during each experiment. Consequently, certain time
course experiments (cell-cycle, transient response, and so on)
are treated as different conditions since genes change their
expression non-monotonously. Importantly, none of these
methods account for the background distribution of gene-
specific expression, analogous to a statistical null hypothesis.
Moreover, all these analyses circumvent the fact that DNA
microarray data are noisy. It is desirable that any algorithm
proposed to classify gene expression data addresses its sensi-
tivity to background noise, bias and random fluctuations [13].
A systematic study on the effects of data structure, experi-
mental dimensionality and noise levels on the results or reli-
ability of classification techniques employed is yet to be seen.
Classification of unlabeled data based on a training set of
query genes is the basis for many supervised classification
techniques, like support vector machines [14,15]. In these
studies, groups of genes associated with a functional category
or a particular transcriptional factor are learned from unclas-
sified data. In an insightful analysis of functional classes in
classification of microarray data, Mateos et al. [16] observed
that only a small percentage of functional classes, derived
from the Munich Information Center for Protein Sequences
(MIPS), is 'learnable' through machine learning. The reason
for this poor performance is attributed to class size (number
of genes in the class), class heterogeneity (different members
of a class vary their expression in different conditions) and
functional interactions between different classes. The authors
also observe that groups with low functional heterogeneity
and less number of interacting links tend to be better classifi-
ers, and that the behavior of functional classes might be a
function of condition.
In this study, we propose a novel method based on a condi-
tion-specific entropy reduction of functional groups to deter-
mine well-defined physiological responses to diverse
experimental treatments. This method does not rely upon any
assumptions regarding the dataset, is based on a rigorous sta-
tistical formalism, and takes advantage of pre-existing biolog-
ical classifications to define an experimental result as a set of
enriched correlations (and hence, co-expression) for a
number of annotated groups of biologically related genes. By
measuring how the entropy of a pre-classified group of genes
decreases as a function of a condition, we are able to classify
transcriptional responses in terms of extent of co-expression
of functionally related groups of genes. The expectation is
that if genes forming a functional group are genuinely co-reg-
ulated under a given condition, the transcriptional profiles of
these genes in that condition will be better correlated than in
a random assortment of microarray experiments. The
group(s) of genes that satisfies this expectation is said to be
active, or responsive, in that condition. The significance of
entropy reduction of a group-condition is determined by
standard statistical criteria, by comparing its activity to per-
muted background correlation levels of the group. We are,
therefore, able to form a coarse, but nonetheless very inform-
ative, map of transcriptional responses to various treatments
and conditions, and to directly compare two or more groups
of genes or conditions. The method is amenable to incorpora-
tion of new groups and conditions and flexible enough to
allow ready determination of the statistical threshold above
which the entropy reduction is termed significant.
Results
Characterization of transcriptional responses to
experimental stimuli
Information contained in expression profiles and amplitudes
of classified groups of genes is expressed as normalized activ-
ity scores (described in Materials and methods). Conditions
can be characterized on the basis of either their median class
activity or the number and distributions of the high scoring
classes. Median class activity for a condition refers to the
overall performance of all queried classes in a condition,
while the top scoring classes (at least one standard deviation
away from the expected scores characterizing transcriptional
activity of the class across the conditions and relative to other
gene classes) constitute the characteristic transcriptional
response for the condition. Low median class activity charac-
terizes conditions that elicit specialized transcriptional
responses. Those conditions include, but are not limited to,
growth in chemostat at different growth rates, novobiocin,
norfloxacin, ampicillin and CaCl
2
treatment of the wild-type
cells, as well as irradiation by UV light or gamma-rays and
exposure to temperature upshift. On the other side of the
spectrum are conditions in which the transcription of multi-
ple classes of genes is affected (Figure 1). Those are exempli-
fied by aerobic and anaerobic growth in batch cultures,
recovery from stationary phase into LB (Luria-Bertani broth)
or sodium-phosphate buffer, indole-acrylate and rifampicin
treatments
To assess the chief physiological responses in a condition, the
classes were sorted for each condition. Conditions that invoke
global and wide-ranging responses have higher median class
scores and, therefore, have characteristically more classes
Genome Biology 2006, Volume 7, Issue 4, Article R32 Sangurdekar et al. R32.3
comment reviews reports refereed researchdeposited research interactions information
Genome Biology 2006, 7:R32
scoring above zero. High scoring classes in a condition have
been further dissected for highly correlated subsets of genes
to establish the class expression profile and to infer interest-
ing transcriptional trends from the data (described in Materi-
als and methods). The conditions were analyzed within two
general categories - 'Transient arrest and killing' and 'Growth
and recovery'.
Transient arrest and killing
In this category, we analyzed and compared transcriptional
responses triggered by inhibitors of translation (kanamycin),
transcription (rifampicin), replication (norfloxacin and novo-
biocin), and cell wall synthesis (ampicillin). Individual condi-
tion responses are assessed by qualitatively comparing class
scores for the condition. In kanamycin treated cells, the
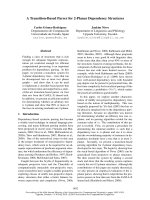
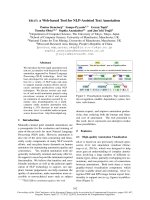
Median scores of experimental conditions classified into 'Growth and recovery' and 'Transient arrest and killing'Figure 1
Median scores of experimental conditions classified into 'Growth and recovery' and 'Transient arrest and killing'. Experimental conditions classified into
'growth and recovery' (red vertical bar) and 'transient arrest and killing' (green bar). The conditions are ordered based on their median class activity
scores. Conditions of growth and recovery score relatively high on the scale. Low scoring conditions (S
ij
< 0) are those that invoke limited mechanistic
responses, and comprise mostly severe arrest and killing type conditions. *Exceptions to the presented experimental classification of conditions. WT, wild
type.
Growth
and recovery
Transient
arrest and
killing
-1
-0.5
0
0.5
1.0
1.5
Growth in LB
Recovery in LB - Early
Growth - Anaerobic
Recovery in LB - Late
Recovery in Na-phosphate
Transient arrest - Indole acrylate
Growth - anaerobic (fumarate) vs aerobic
Transient arrest - Rifampicin in LB
Transient arrest - Rifampicin in DMSO
Recovery in Na-phosphate + glucose
Growth - anaerobic versus aerobic
Growth - anaerobic (fumarate) versus aerobic
Severe arrest & killing - Norfloxacin (gyr resistant) 50 ug/ul
Severe arrest & killing - Norfloxacin (gyr resistant) 15 ug/ul
Severe arrest & killing - Kanamycin
Severe arrest & killing - Sodium azide
Severe arrest & killing - Tryptophan starvation
Severe arrest & killing - UV in lexA-
Severe arrest & killing - UV in WT
Severe arrest & killing - Norfloxacin in WT
Suboptimal growth - pUC19 versus no pUC
Severe arrest & killing - gyrB
ts
at restrictive temp
Growth - Balanced growth in NOX+ mutant
Growth - Rapid time points
Severe arrest & killing - Novobiocin
Transient arrest - CaCl
2
wash
Severe arrest & killing - Ampicillin
Transient arrest - Gamma radiation
Growth - Balanced growth in WT
Median activity scoreConditions
*
*
*
*
*
*
R32.4 Genome Biology 2006, Volume 7, Issue 4, Article R32 Sangurdekar et al. />Genome Biology 2006, 7:R32
response is fairly specific, with heat shock response and
ribosomal genes scoring highly among the queried genes.
Other groups scoring above the mean in this condition are
stress related (RpoS, OxyR), amino acid biosynthesis, cell
division related, and genes involved in RNA modification
(Figure 2a). Heat shock response in the kanamycin treatment
is produced as a result of stalled translation [17]. Both classes
expectedly show above the threshold activity scores in this
condition. More interestingly, heat shock response is also
produced in other conditions of antibiotic and radiation treat-
ment (novobiocin, norfloxacin in gyrase resistant strains, UV
irradiation). However, these conditions are characterized by
low ribosomal class activity, indicating the uncoupling of heat
shock response from ribosomal protein synthesis when trans-
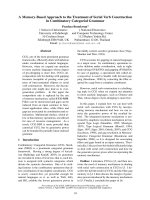
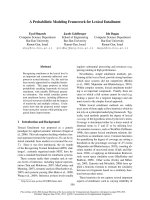
Expression profiles of top-scoring classes for drug treatmentsFigure 2
Expression profiles of top-scoring classes for drug treatments. Expression profiles of top-scoring classes (S
ij
> 1) for drug treatments: (a) Kanamycin, (b)
Novobiocin, (c) Norfloxacin treatment of the wild-type strain. Classes are sorted from top to bottom in descending order of their scores. A row of pixels
corresponds to a single gene expression profile; a blue color indicates relative decrease in transcript abundance, and a yellow color an increase.
Heat shock response
Ribosomal genes
RpoS
Amino acid
biosynthesis
Cell division
OxyR
ATPases
Tr p *
Kanamycin
2'
60'
100µg/ml
RNA modification
5
µg/ml
Novobiocin (5min)
LPS synthesis
Transposon
related
Supercoiling
sensitive
Global regulators
Fatty acid metabolism
Phosphorus metabolism
Cell division
Cofactor synthesis
Heat shock response
200
µg/ml
SOS response
Relaxation
sensitive
ATPases
Transposon
related
FIS targets
Anaerobic
genes
FNR targets
Norfloxacin
15
µg/ml
2'
30'
(a)
(b)
(c)
Genome Biology 2006, Volume 7, Issue 4, Article R32 Sangurdekar et al. R32.5
comment reviews reports refereed researchdeposited research interactions information
Genome Biology 2006, 7:R32
lation machinery has not been impacted directly. Another
condition in which both classes are highly active is growth in
LB, reflective of the fact that heat shock response is also gen-
erated when cells are actively translating proteins. The pro-
files for the two classes are strikingly different in the LB
growth condition (and also recovery into LB from the station-
ary phase), with heat shock response genes being upregulated
during the early exponential phase and also during the early
stationary phase, while the expression of ribosomal genes
decreases with time (Figure S1 in Additional data file 1).
The genes involved in amino acid biosynthesis represent
another interesting class in the kanamycin treatment. When
we searched this class for correlated profiles of subsets of
genes, we observed that genes related to tryptophan biosyn-
thesis (aroM, trpCDE, aroH, tyrA). [18] make up a profile that
is anti-correlated with that of the ribosomal genes (Figure
2a).
Novobiocin is a coumarin antibiotic that inhibits ATPase
activity of the DNA gyrase [19]. As a result of novobiocin
action, DNA gyrase fails to introduce negative supercoils into
relaxed or positively supercoiled DNA. When cells are treated
with novobiocin, the top scoring classes are lipopolysaccha-
rides (LPS) synthesis, transposon related, supercoiling sensi-
tive genes, global regulators, fatty acid metabolism,
phosphorus metabolism, cell division related, cofactor syn-
thesis and heat shock response (Figure 2b). The supercoiling
sensitive (SS) genes comprise a group of about 200 genes
whose expression is dependent on negative DNA supercoiling
[20]. SS genes are significantly downregulated in novobiocin
treatment, indicating the inhibition of gyrase function by
novobiocin. Additionally, SS genes are upregulated in a con-
certed manner during anaerobic growth and recovery into LB
from stationary phase (data not shown; see scores in Addi-
tional data file 3), and they are significantly upregulated by
UV irradiation of the wild-type strain (but not in lexA- cells)
(Figure S2 in Additional data file 1).
Norfloxacin is a quinolone antibacterial that primarily poi-
sons DNA gyrase and topoisomerase IV, leading to DNA dam-
age. [21]. In wild-type cells, norfloxacin treatment is
accompanied by changes in transcriptional activity of DNA
damage and recombinational repair (SOS) genes, relaxation
sensitive genes (79 genes induced upon DNA relaxation [20]),
ATPases, transposon related, targets of FIS, a nucleoid asso-
ciated transcriptional regulator as well as anaerobic genes
and targets of FNR, a regulatory gene for fumarate nitrite,
nitrate reductases and hydrogenase (Figure 2c). Thus, it
appears that in addition to the transcriptional responses
associated with known norfloxacin effects, such as topoi-
somerase-mediated DNA damage and inhibition of uncon-
strained supercoiling [22], it also affects genes whose activity
is controlled by FIS, a component of a supercoiling-depend-
ent regulatory network and a likely mediator of constrained
supercoiling in the cell [23]. In comparison, norfloxacin treat-
ment in gyrase resistant strains affects transcription of genes
related to energy metabolism (tricarboxylic acid (TCA) cycle,
electron transport, amino acid catabolism) and division
(nucleotide synthesis, DNA replication, cell division), apart
from the SOS response (Figure S3 in Additional data file 1).
This is the only case we are aware of where mutating a drug
target leads to a shift, rather than an abrogation, in transcrip-
tional response. This finding is also intriguing because it has
been previously observed that secondary mutations render-
ing quinolone resistance map in the genes of the TCA cycle
[24,25]. Furthermore, treatment in resistant strains is char-
acterized by high scores for heat shock response and low
scores for relaxation-sensitive genes as the state of DNA
supercoiling is not affected in these mutants by the used drug
concentrations (data not shown).
Ampicillin treatment induces a response (S
ij
> 1) (see Materi-
als and methods for details of the score calculation) from
arginine biosynthesis, sulfur assimilation, amino acid biosyn-
thesis and the LRP (Leucine response protein) regulon. The
top scoring classes for other antibiotic treatment conditions
are listed in Additional data file 2.
Growth and recovery
Experiments in this category could be grouped as: anaerobic
growth on glucose in M9 media; growth and recovery from
stationary phase into LB supplemented with glucose; recov-
ery from stationary phase into sodium phosphate (Na-phos-
phate) buffer with and without glucose; balanced growth at
different growth rates in chemostats (wild type and with
NADH oxygenase (NOX
+
) overexpression); recovery in mini-
mal medium following UV and gamma-rays treatment. Most
growth experiments are characterized by a large number of
classes (>90%) having a positive activity score. Classes that
score relatively high in these conditions are related to protein
synthesis (ribosomal genes, amino acid biosynthesis), carbon
and energy metabolism (TCA, glycolysis, electron acceptors),
nutrient uptake and assimilation, global and redox stresses
(RpoS, RpoE, polyamine biosynthesis, ArcA, OxyR) and
transport proteins (ATP family, Major Facilitator Super-
family, PhosphoEnolPyruvate PhosphoTransferase Systems).
When compared to growth experiments in batch conditions,
growth in a chemostat under balanced conditions is
characterized by lower overall class activity. Also, the top
scoring classes in both balanced growth experiments (wild
type and NOX
+
) are groups involved in utilization of alterna-
tive carbon sources, fatty acid biosynthetic genes and trans-
port proteins involved in uptake of different sugars (Figure
3). The recovery following UV and gamma treatment is
accompanied by a narrow range response, primarily com-
posed of genes involved in DNA damage repair and repressed
by LexA (SOS genes). Other high-scoring classes in both
treatments consisted of DNA replication and supercoiling
sensitive genes and regulatory targets of FUR (Ferric uptake
regulator). UV treatment is also characterized by the high
R32.6 Genome Biology 2006, Volume 7, Issue 4, Article R32 Sangurdekar et al. />Genome Biology 2006, 7:R32
Figure 3 (see legend on next page)
3
Score
Difference in
score
1
2
PEP transporters
FUR
Periplasmic binding proteins
IHF
Gluconeogenesis
FIS
SOS
Relaxation sensitive
Fatty acid metabolism
Ribosomal genes
Cofactor synthesis
Anaerobiosis
ATP based transporters
Chemotaxis
Fermentation
Nitrogen metabolism
Heat shock response
Electron transport
DNA replication
RpoS
Cell division
Sulfur
Iron Uptake
Polyamine
RpoE
Amino acids biosynthesis
Carbon utilization
CRP
SS genes
Methionine
SoxS
LPS synthesis
Arginine
MFS family
FNR
Amino acid catabolism
LRP regulon
Amino-acyl tRNA synthases
DNA methylation
OxyR
ArcA
TCA
Peptidoglycan
Transposon related
Global regulators
RNA modification
ATPases
Nucleotide synthesis
Phosphorus metabolism
Glycolysis
0
NOX
WT
-2 -1 10
Genome Biology 2006, Volume 7, Issue 4, Article R32 Sangurdekar et al. R32.7
comment reviews reports refereed researchdeposited research interactions information
Genome Biology 2006, 7:R32
scoring SoxS regulon, whose genes show upregulation during
the treatment, suggesting that cells might also be sensing a
superoxide stress. Similarly, gamma radiation can be charac-
terized by activity of the OxyR group and amino acid biosyn-
thesis. As in the norfloxacin treatment, gamma radiation
treatment induces a relatively narrow range of responses, as
reflected in the low median class activity scores for these con-
ditions (Additional data file 2).
Class activity across conditions
Apart from individual experiments, it is informative to look at
conditions in which classes are co-expressed best. For exam-
ple, high activity of the SOS class of genes (S
ij
> 1), indicating
the sensing of DNA damage by the cells, was observed in a
limited number of conditions, including UV and gamma irra-
diation, norfloxacin (in wild-type and resistant strains) treat-
ment and in tryptophan starvation (Figure 4). In these
conditions, the SOS class had a score above 1, while none of
the other conditions had a score greater than 0.5 for the class,
indicating a clear demarcation in conditions where the
response is induced. For the heat shock response class, the
top scoring conditions (S
ij
> 1) were treatments of kanamycin,
novobiocin, norfloxacin in gyrase resistant strains, growth in
LB and recovery in Na-phosphate buffer. While certain drug
treatments and exponential growth in rich medium are
accompanied by a characteristic heat shock response, it is not
clear why this response is induced (transient upregulation) in
recovery conditions in LB and Na-phosphate (Figure S1 in
Additional data file 1). The less specific stress response class
of RpoS is most active in growth and recovery in LB, anaero-
bic growth, in recovery in Na-phosphate (but not in recovery
in glucose added phosphate buffer) and in the kanamycin
treatment. When we searched the RpoS class for a subset of
highly correlated genes, a group of nine genes (aidB, cbpA,
osmY, poxB, dps, hdeA, hdeB, xasA, gadA, gadB, adhE) was
found to be significantly correlated (median correlation >0.6)
across all conditions tested. The profile of this subgroup dur-
ing different growth and recovery conditions (Figure S4 in
Additional data file 1) indicates that these particular genes are
downregulated whenever cells are supplied with abundant
nutrients and exposed to kanamycin treatment, and are
upregulated whenever cells approach the stationary growth
phase.
Comparison of conditions
Class scores can be compared for different conditions and it
can be particularly revealing in comparisons where condi-
tions are similar to each other. Comparisons can be made by
assessing the difference in class scores in two conditions, or
by grouping together conditions, which are expected to elicit
phenotypically similar responses. For example, we can com-
pare conditions of recovery into LB at an early (OD 0.5) or
later (OD 1.0) stage. The recovery at higher density is charac-
terized by differential activities of amino acid catabolism, sul-
fur assimilation, PEP based transporters, phosphorus
metabolism, FNR, fermentation, OxyR, SoxS, gluconeogene-
sis, FUR and ArcA, indicating that cells are undergoing the
onset of global nutrient limitation along with redox imbal-
ance (Figure S5 in Additional data file 1). The early recovery
condition is characterized by cell wall synthesis (RpoE, LPS
synthesis), energy generation (ATPases), supercoiling state
related classes (FIS, IHF (Integration Host Factor), relaxa-
tion-sensitive), ribosomal genes, amino acid and nucleotide
biosynthesis and nitrogen assimilation. Thus, cells early in
the growth stage coordinate their regulation towards growth
and division, whereas at later points cells encounter nutrient
starvation and redox related stresses. Furthermore, recovery-
stage dependent induction of RpoS, anaerobic genes, nucle-
otide synthesis genes and ribosomal genes indicate that the
starvation response is fairly independent of the culture's age
and history.
Similarly, comparison between the wild-type and NOX
+
mutant in balanced growth conditions revealed that TCA and
ArcA classes are more active in the wild type, while overex-
pression of NADH oxygenase (NOX
+
) causes activation of gly-
colysis, which is the largest difference in the two conditions
(Figure 3, highlighted in blue). NOX (encoded by the NADH
oxygenase gene from Streptococcus pneumoniae) acts as a
NADH sink to regenerate the oxidative potential of NAD
+
,
thus allowing glucose to be completely metabolized in the cell
and relieving the repression of ArcA two-component system
(GN Vemuri, DS, ABK, unpublished data). Commonly acti-
vated classes in both conditions include the PEP and MFS
family of transporters and carbon utilization related genes
(highlighted in yellow).
For group comparisons, conditions are classified into three
meta-groups based on their phenotypical responses, and
classes are sorted for their median activity in the conditions
constituting the group. Unlike pairwise comparison of condi-
tions, top scoring classes in a group of conditions constitutes
a common 'signature' response for that group. The first group
consists of growth and recovery conditions (growth in LB,
early and late recovery in LB, recovery in sodium phosphate
buffer and glucose-supplemented sodium phosphate buffer;
Figure S6 in Additional data file 1). This group is character-
ized by high activity scores (in decreasing order) for amino
acid catabolism, arginine biosynthesis, nitrogen metabolism,
RpoS, RNA modification, polyamine synthesis, LRP regulon,
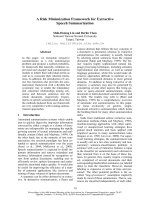
Comparative analysis of class activity scores across balanced growth conditionsFigure 3 (see previous page)
Comparative analysis of class activity scores across balanced growth conditions. Comparison of class activity scores across balanced growth in wild-type
(blue) and NOX (yellow) conditions. The classes are sorted according to maximum difference in activities. Both conditions are characterized by relatively
few positive class scores - transporters and carbon utilization related classes (highlighted in yellow) - indicating coordinated activity of these genes as a
function of condition levels (growth rates). Classes active in the wild type only are highlighted in blue.
R32.8 Genome Biology 2006, Volume 7, Issue 4, Article R32 Sangurdekar et al. />Genome Biology 2006, 7:R32
nucleotide synthesis, amino acid biosynthesis, PEP trans-
porters, chemotaxis, FIS targets, iron uptake, relaxation sen-
sitive, ribosomal genes and ATPases. Two of the least scoring
classes for this group are CRP (cAMP receptor protein) and
carbon utilization, with the exception of recovery experi-
ments in sodium phosphate and glucose-supplemented
sodium phosphate, indicating the lack of carbon stress in the
growing cells. Arginine biosynthesis genes and the RpoS sub-
group mentioned in the previous section have a role in acid
resistance of cells at the onset of the stationary phase [26].
Comparison of recovery profiles under different conditions
(early or late, in buffer with or without glucose) shows inter-
esting trends. Ribosomal genes, RNA modification genes,
polyamine synthesis and ATPases are expressed as a strong
function of growth conditions and energetic state of the cell.
Amino acid biosynthetic genes, with the exception of methio-
nine, glutamine and tryptophan synthesis genes, are
repressed in all conditions
The second group consists of treatments by drugs whose
modes of action are not known to damage DNA. This group
includes conditions of sodium azide, ampicillin, indole acr-
ylate and kanamycin treatments, and it is characterized by
high scores for amino acid biosynthesis, arginine synthesis,
LRP regulon, peptidoglycan, sulfur assimilation OxyR, nucle-
otide synthesis and heat shock response (Figure S7 in Addi-
tional data file 1). The third group includes DNA damaging
conditions of norfloxacin treatment, UV radiation (in wild-
type and lexA
-
mutant), gamma radiation and novobiocin
treatment. Not surprisingly, SOS response is by far the top
scoring class in this group (with the notable exception of
novobiocin treatment and UV treatment in lexA-), followed
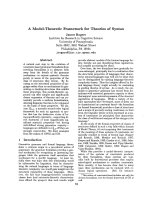
Conditions associated with different stress responsesFigure 4
Conditions associated with different stress responses. Top-scoring conditions for three classes: SOS response, heat shock response and RpoS targets. SOS
is active in known DNA damaging conditions only (with the exception of tryptophan starvation); RpoS is active in growth conditions (with the exception
of the kanamycin treatment), while heat shock response is active in the mixture of conditions.
Norfloxacin (resistant) - 15 ug/ul
Norfloxacin (resistant) - 50 ug/ul
Norfloxacin (wt) - 15 ug/ul
UV treatment (wt)
Tryptophan starvation
Gamma radiation
Kanamycin
Recovery in Na-phosphate
Growth in LB
Norfloxacin (resistant) - 15 ug/ul
Norfloxacin (resistant) - 50 ug/ul
Novobiocin
Growth in LB
Recovery in LB - Late
Recovery in LB - Early
Kanamycin
Anaerobic - glucose
Recovery in Na-phosphate
Anaerobic - glucose + fumarate versus aerobi
c
Anaerobic - glucose + fumarate
SOS
response
Heat shock
response
RpoS
Genome Biology 2006, Volume 7, Issue 4, Article R32 Sangurdekar et al. R32.9
comment reviews reports refereed researchdeposited research interactions information
Genome Biology 2006, 7:R32
by heat shock response, cell division genes, DNA replication
and supercoiling sensitive genes (Figure S2 in Additional data
file 1).
Comparison with other classification techniques
To evaluate the utility of the entropy reduction analysis, we
compared the performance of the proposed method with
standard unsupervised learning methods [27], such as k-
means and hierarchical clustering, and with a more recent
technique known as the signature algorithm (SA) [28]. For
clustering, we devised a comparable metric (described in
Materials and methods) to score the activity of each class
(condition) learned from a particular clustering result for a
condition (class). For the purposes of illustration, we limited
our comparison here to the classes and conditions, SOS and
heat shock responses and UV treatment, whose underlying
physiology is well understood, thus providing us with a good
set of biological expectations. We compared the scores
obtained from clustering and the entropy-reduction method
for the SOS and heat shock classes of genes, which are
expected to produce transcriptional responses in the condi-
tions of DNA damage and growth perturbations, respectively.
The comparison revealed that the conditions that are known
to cause DNA damage (among all of the tested conditions, five
treatments have been specifically set up to elicit this type of
response) score consistently on top of the other conditions
and higher than they score based on the clustering solutions
(Figure 5a). Similar results have been obtained with the heat
shock response genes (Figure 5b). Thus, despite a strong
expectation that expression of the SOS and heat shock genes
should be affected by several conditions, clustering failed to
identify these conditions within the dataset. For individual
conditions, the entropy-reduction based method is more suc-
cessful than clustering in identifying top scoring classes that
constitute known biological responses to a condition. This is
illustrated by a comparative application of the methods to a
condition of UV irradiation (Figure 5c). The comparison dem-
onstrated that, unlike in the entropy reduction method, nei-
ther the SOS nor DNA metabolism class of genes score high in
clustering methods, contrary to the prior biological expecta-
tion. Furthermore, classes that are deemed to be significantly
different by clustering tend to have lower amplitudes (data
not shown), thus reflecting the importance of using both
amplitude and profile features to gauge activity of a class.
Next, we compared our method with the SA, a technique that
relies on amplitude of expression to refine a seeded group of
genes [28]. SA also identifies arrays (that is, a single time
point in a condition) in which the group is most activated. By
definition, our method differs from the SA: unlike the SA
method, our technique maintains the integrity of classes and
conditions, scores classes across an entire spectrum of condi-
tions and conditions across all the classes, and the scores are
a function of the amplitude, correlation and background
expression of the dataset. To compare the performance of the
SA with our method, we examined two criteria: how well a
particular class is refined by iterating the algorithm; and
which conditions are over-represented in the top scoring
arrays for a class in SA after the above iterations. Some classes
(for example, DNA replication, RNA modification) produced
empty sets after iteration, indicating that some classes need
to be analyzed as a whole, which cannot be done by clustering
or SA. A list of illustrative examples of classes that remained
stable is provided in Additional data file 4. The entropy reduc-
tion method retained a class subset that is at least equal to
that retained by SA for most classes, and in some cases (for
example, ribosomal genes, DNA replication, RNA modifica-
tion, SOS response), it was much higher. Moreover, while SA
captures most conditions that our method identifies as most
active, it misses out on some biologically relevant examples.
Such examples include kanamycin treatment for ribosomal
genes (Figure 2a), novobiocin and norfloxacin treatments for
heat shock response and recovery in sodium-phosphate
buffer for the RpoS group of genes. Furthermore, given avail-
able biological evidence, some conditions deemed as differen-
tially affecting certain classes of genes appear to be
erroneously classified by the SA. The most striking among
them is the classification of sodium azide treatment as the
highest scoring SOS specific condition: neither the available
experimental data (not shown) nor close examination of the
transcriptional patterns of the SOS genes in the condition
warrants such an inference. Additionally, in this version of
the algorithm, seeding arrays (or conditions) to identify top
scoring genes (and hence classes) to identify top responses in
specific treatments is not possible, something that can readily
be achieved by our technique.
Conclusions from comparisons between these techniques
have so far been based on biological expectations, which may
prove to be wrong. To test the different methods in an unbi-
ased manner, we generated simulated datasets from the orig-
inal data, in which a particular gene class was spiked with
known profiles in certain conditions. These profiles and their
amplitudes represent typical time-series profiles observed in
microarray data (for example, late upregulation, early upreg-
ulation followed by downregulation, periodic profile and so
on). The entropy-reduction method identified exclusively the
spiked conditions (score >1) in several randomizations of the
background conditions. In comparison, both clustering meth-
ods performed poorly, with a false positive and false negative
rate of about 50%. The SA performed consistently well in
identifying a subset of profiles (three out of seven profiles
tested), but it did not identify the remaining profiles in which
response was generated only for a part of the time course or
periodically, and also in the case in which two subgroups in
the same class were anti-correlated (this type of response is
expected when a regulator has a dual role of repressor and
activator) (Figure S8 in Additional data file 1). Considering
this evidence, the entropy-reduction method, in addition to
being uniquely suited for describing responses of pre-defined
sets of genes in a context of available data without washing
R32.10 Genome Biology 2006, Volume 7, Issue 4, Article R32 Sangurdekar et al. />Genome Biology 2006, 7:R32
out the identity of a set (condition), proves to be more
versatile and reliable in classifying non-binary or heterogene-
ous responses than clustering or signature algorithm.
Discussion
One of the motivations for doing genome-wide analysis of
transcription is to be able to predict the transient state of the
cell based on the activity of genes. Ideally one would like to be
able to establish a correspondence between a condition, envi-
ronmental or genetic, and a transcriptional state of the cell;
for example, in the simplest of cases, if a gene X changes its
activity, it is likely that cells have been subjected to a pertur-
bation Y. While surveying a multitude of controlled condi-
tions for the sake of interpreting the uncontrolled ones may
not be practical, in principle it should be possible to obtain a
representative sample of conditions that would allow us to:
describe individual surveyed condition(s) in terms of gene
activity; and present gene activity as a molecular proxy of a
particular condition(s). Towards this goal, we obtained and
Comparison of the entropy reduction method with standard clustering techniquesFigure 5
Comparison of the entropy reduction method with standard clustering techniques. (a) Normalized activity scores for SOS response. (b) Normalized
activity scores for heat shock response class. The scores from entropy reduction (orange bar) and clustering (k-means (blue), k = 10, and hierarchical
(green)) methods are shown. The conditions on the ordinate are top scoring conditions sorted by scores obtained from the entropy method. The ranks
for the class for each condition and in each method are listed on top of the respective bars (c) Normalized activity scores for classes in UV treatment
condition obtained from entropy reduction and clustering methods; classes are sorted by activity scores from the entropy method. The ranks for each
class in the condition and in each method are listed on top of the respective bars.
(a) SOS response
6
5
4
3
2
1
30
24
26
32
28
29
15
21
10
13
32
30
-2
-1
0
1
2
Norfloxacin
treatment
(Res15)
Norfloxacin
treatment
(Res50)
Norfloxacin
treatment
UV treatment Tryptophan
starvation
Gamma treatment
Conditions
Activity score
for class
(b) Heat shock response
6
5
4
3
2
1
31
7
30
24
8
25
2
30
22
7
14
1
-2
-1
0
1
2
Kanamycin
treatment
Recovery in Na-
phosphate
Growth in LB Norfloxacin
treatment
(Res15)
Norfloxacin
treatment
(Res50)
Novobiocin
treatment
Conditions
Activity score
for class
(c) UV treatment
1
2
3
48
51
45
51
43
17
-2
-1
0
1
2
SOS DNA replication ATP based transporters family
Classes
Activity score
for condition
Entropy reduction
Hierarchical clustering
k-means clustering
Entropy reduction
Hierarchical clustering
k-means clustering
Entropy reduction
Hierarchical clustering
k-means clustering
(wt)
Genome Biology 2006, Volume 7, Issue 4, Article R32 Sangurdekar et al. R32.11
comment reviews reports refereed researchdeposited research interactions information
Genome Biology 2006, 7:R32
analyzed expression data for more than 3,600 genes in the
genome of E. coli in more than 30 conditions.
Our analysis is predicated on the notion that rationalization
of a transcriptional response is possible only in terms of the
already available or emergent information about the groups
of genes. The current study took advantage of the breadth of
available information about the physiology of E. coli bacteria.
We used functional and regulatory classifications of genes
and their products to evaluate the transcriptional activity
within and across groups of related genes. We were also able
to describe the examined conditions in terms of transcrip-
tional activity of gene families. The choice to analyze tran-
scriptional responses in the classified groups of genes was
dictated by the following. First, given a large number of sur-
veyed genes and a relatively small number of responses, the
transcriptional behavior of a group of related genes, where
relatedness can be defined by various biological criteria, is
likely to be more informative than that of an individual gene.
Second, transcriptional patterns obtained by either super-
vised or unsupervised techniques are being widely inter-
preted in the context of the already available information
about the genes whose respective classes are more repre-
sented in the pattern [29]. Such an approach implies a certain
degree of co-regulation within the families of genes that have
been used to derive the biological meaning of discovered pat-
terns. This assumption about co-regulation has never been
explicitly tested. Thus, the third reason, evaluating the degree
and homogeneity of co-regulation within the annotated gene
families, is of considerable practical and biological interest.
Furthermore, any hypothesis regarding a group of unrelated
genes, for example, connected pathways, can be tested simply
by querying that group in this analysis. Any new condition
can likewise be queried for its characteristic response profile
from the existing classes.
In this study, we have proposed a novel method for assessing
condition-specific co-regulation of pre-classified functional
groups based on reduction in Shannon entropy for a group of
genes. Previously, some biological studies have used entropy
to develop classifiers for microarray data, identify biases and
patterns in protein and DNA sequences and to predict drug
targets [30-34]. Here, the entropy concept is used to assess
the degree of coherence in the expression pattern of function-
ally related genes in a given condition. This coherence is
hypothesized to be a systematic result of class and condition
related trends, and this hypothesis is verified or rejected by
randomization of classes and conditions. This degree of
coherence allows for description and comparison of class-
condition behavior on a continuous information scale. By
identifying functional classes that show a significant degree of
co-expression, large-scale microarray data can now be mean-
ingfully characterized, without relying on assumptions about
underlying structure of the data.
The scope and number of surveyed conditions also allowed us
to determine whether the observed changes in expression are
condition specific and whether the conditions themselves
were distinct enough to be characterized by a specialized
transcriptional response. The approach proposed in the cur-
rent study has at least two advantages compared with other
methods, which analyzed condition-specific transcriptional
patterns. [9,10]. First, condition-specific responses were
quantified using a composite metric reflecting both the
amplitude of a transcriptional response as well as the infor-
mation content of a transcriptional profile. Second, the distri-
bution of transcript abundances across all examined
conditions was used to assess the background information in
transcriptional profiles for a specific condition. The differ-
ence between a condition-specific profile and the background
activity allows for a rather natural and straightforward way of
describing the relative activity of a group of genes. Third, the
activity score does not rely heavily on the classification accu-
racy on the whole, since enhanced correlations in class sub-
sets often 'carry' the class, regardless of the lack of correlation
in the remaining genes.
By applying this method to a set of experimental conditions,
we were able to validate several beliefs regarding physiologi-
cal responses to certain stimuli, as well as to discover new
trends. For example, cells under normal growth conditions or
recovering from the stationary phase are able to co-ordinate
genome-wide functional activities, whereas cells under severe
stress are significantly less capable of doing so. Cells growing
at different balanced growth rates adjust only a part of their
metabolic activities to cope with different doubling
efficiencies. Drug treatments that are known to affect DNA
integrity produce responses dominated by groups of genes
involved in DNA metabolism (SOS response and DNA repli-
cation). Under conditions of nutrient starvation or stationary
phase, cells activate genes related to general stress response,
nitrogen limitation and acid resistance. Classes were used as
molecular proxies to partition the condition space - SOS
(DNA damage versus no damage) and RpoS (growth versus
non-growth). Condition-specific correlational links were dis-
covered between functional classes, for example, ribosomal
genes correlate with heat shock genes conditionally. Overall,
this approach provides a unique and elegant tool for generat-
ing the blueprint of transcriptional response to external stim-
uli. It also provides a platform for further investigations by
using significantly co-expressed classes and their subsets as
candidates for machine learning and supervised
classification.
Modular organizations of transcriptional circuits. [35,36], as
well as apparent re-tuning of transcriptional regulation of
paralogous genes in mutant backgrounds [37], suggest a cer-
tain degree of flexibility in cellular transcriptional programs.
While intuitively appealing [38], such flexibility is not fully
compatible with the notion of rigidly structured transcrip-
tional modules and regulons. By assessing transcriptional
R32.12 Genome Biology 2006, Volume 7, Issue 4, Article R32 Sangurdekar et al. />Genome Biology 2006, 7:R32
activity of pre-assigned groups of genes we could see that
transcriptional activity of the genome can be described
through a contribution of multiple functional groups of genes
on an essentially continuous information scale. Such a 'con-
tinuum' of transcriptional activity across genes in a genome
may serve as the basis for inherent flexibility of transcrip-
tional programs. Whereas it may limit the usefulness of
genome-wide monitoring of gene expression for screening
purposes, it likely offers a more adequate representation of
the biology of the system.
Materials and methods
Overview of experimental conditions
All experiments were carried out using the MG1655 genetic
background from American Type Culture Collection 47076.
Relative transcript abundances were measured under condi-
tions of normal growth, sub-optimal growth, transient arrest
and recovery and in severe arrest and killing. The following
experimental conditions were tested (a detailed summary of
comparisons is available in Additional data file 8).
Normal growth
During 'normal growth', we tested: the growth curve under
anaerobiosis in M9 salts supplemented with 0.2% glucose
with or without fumarate as an electron acceptor (24 array-
hybridizations, 6 time point comparisons with and without
fumarate against two different common references; details of
labeling and references are presented in Additional data file
7); the growth curve under aerobic conditions in LB supple-
mented with 0.2% glucose (11 array-hybridizations, 11 time
points along the curve compared to a common reference);
recovery of cells from the 24 hours old stationary LB culture
into LB + 0.2% glucose at two different inoculum densities (14
array-hybridizations, 7 comparisons against common refer-
ence each); recovery of the cells from the 24 hours old station-
ary LB culture into Na-phosphate buffer, pH 7.5, at an
inoculum OD
600
of approximately 0.5; and recovery into Na-
Pi buffer supplemented with 0.2% glucose.
Sub-optimal growth
During 'sub-optimal growth', we tested: transient heat-shock
treatment (four time points); indole acrylate (IAA) mild star-
vation at two concentrations of IAA (four time points each);
the limited growth curve of the cells harboring pUC19 (five
time points); and UV-untreated controls of the wild-type and
lexA
-
cells that were handled similarly to the experimental
sample but not treated with the UV light [39] (four time
points).
Transient arrest
During 'transient arrest', we tested: UV treatment in the wild
type (five time points); gamma-ray treatment in the wild type
(five time points); Norfloxacin treatment in gyrA
r
parC
r
at
two different sub-lethal concentrations [20] (ten time
points); early stationary cells in LB (six time points); 0.1 M
CaCl
2
treatment in the cold (seven time points); and 0.5%
DMSO treatment (two time points).
Severe arrest and killing
During 'severe arrest and killing', we tested: treatment with
0.01 M sodium azide (four time points); tryptophan starva-
tion in the auxotrophic strain (three time points); UV treat-
ment of the SOS-uninducible lexA3 mutant (five time points);
treatment of wild-type E. coli with Norfloxacin at lethal con-
centrations (five time points); treatment of wild-type E. coli
with different bactericidal concentrations of Novobiocin (four
comparisons after 5 minutes of treatment); shift of the gyrB
Ts
to restrictive temperature (four time points); Rifampicin
treatment (500 ug/ml) in LB (five time points) and in M9 +
0.2% glucose (seven time points) [40]; Ampicilin treatment
(100 ug/ml) in M9 + 0.2% glucose (six time points); and Kan-
amycin treatment (100 ug/ml) in M9 + 0.2% glucose (six time
points).
General microarray procedures
We amplified 4,290 E. coli open reading frames (96.4% aver-
age success rate) using primer pairs from Sigma Genosys (St
Louis, MO, USA). EtOH precipitated amplification products
were printed on glass surfaces to produce whole-genome
DNA microarrays using an in-house 16-tip robotic spotter as
described in [41]. Following a print (the data presented in this
communication were collected on slides from eight different
prints) slides were post-processed as described in [41] and
stored in a dark dry environment until hybridization. Total
RNA extraction, RNA labeling via direct Cy-dye incorporation
into cDNA and array washing were performed as described
elsewhere [42]. A 16-bit TIF image was acquired using a
GenePix scanner (Axon Instruments, Molecular Devices,
Sunnyvale, CA) and analyzed using GenePix software. Raw
data of previously published experiments, including UV,
rifampicin and norfloxacin treatments, and tryptophan star-
vation by indole acrylate, have been deposited in the Stanford
Microarray Database. [43].
Data preparation
Raw intensities in individual fluorescence channels were
extracted. In the presented analysis, total florescence intensi-
ties were used to calculate normalized ratios. All spot-specific
ratios were normalized assuming the equality of intensities in
both fluorescence channels. Background subtracted ratios
were tested on the sub-set of pre-existing groups of genes,
such as documented operons and the tightly controlled SOS
and tryptophan regulon, and it has been determined that
background subtraction increases the scatter in correspond-
ing distributions of correlation coefficients. The final analysis
included 3,607 genes. Apart from 155 genes whose amplifica-
tion products could not be identified unambiguously, genes
were filtered out on the basis of inconsistent hybridization
results across all 240 arrays; 144 genes were filtered out as
their corresponding array elements were flagged, manually or
automatically, in 210 out of 219 arrays. Remaining 'poor
Genome Biology 2006, Volume 7, Issue 4, Article R32 Sangurdekar et al. R32.13
comment reviews reports refereed researchdeposited research interactions information
Genome Biology 2006, 7:R32
quality' genes were removed from consideration following the
analysis of distributions of spot regression coefficients, inten-
sities and diameters. Of the filtered out genes, 77% encode
hypothetical proteins.
The experimental dataset consists of log ratio intensity values
for G E. coli genes measured in M cDNA microarray hybridi-
zations. The M arrays correspond to different treatment levels
or times in k experiments such that:
where N
j
refers to the number of arrays in the j
th
experiment.
Before collating the data set, values from individual arrays
were pre-processed for each experiment, such that means in
the arrays are centered on zero. In the case of replicate arrays,
average values were considered so that each value with co-
ordinates (g
i
, r
nj
) represents the gene expression of gene g
i
in
unique treatment r
nj
(corresponding to the n
th
array in exper-
iment j). For the purpose of this analysis, experiments with
less than three arrays (or treatments) were not considered,
since meaningful correlations can only be derived from a
minimum of three data points.
Query classes
Query classes are groups of genes that are pre-arranged based
on some functional relationship. These categories and their
corresponding genes were compiled from different publicly
accessible E. coli databases, including EcoCyc [44], Monica
Riley's functional categories at GenProtEC [45] and Regu-
lonDB [46]. The classes chosen for the analysis represent var-
ious aspects of cellular physiology and metabolism; selected
classes include carbon metabolism (glycolysis, TCA cycle, car-
bon utilization), DNA metabolism (nucleotide synthesis,
DNA replication and degradation, DNA methylation), RNA
related (RNA modification), energy metabolism (fermenta-
tion related, aerobic respiration, anaerobic respiration, elec-
tron transport, oxidative phosphorylation), nutrient uptake
and utilization (iron, sulfur, nitrogen, phosphorus), protein
synthesis, folding and repair (ribosomal components, amino
acid metabolism aminoacyl tRNA synthases, chaperones and
proteases), cell division, stress response (SOS response, heat
shock response), transport proteins and transcriptional fac-
tor targets (RpoS, ArcA, SoxS, OxyR, RpoE, CRP). The size of
classes refers to the number of member genes in a class,
which typically varied from 10 to 100 genes. A total of 1,642
genes were queried in this analysis, of which 1,104 genes
uniquely belonged to a single class, 390 genes belonged to 2
classes and 148 belonged to 3 or more classes. Of the 1,965
genes not included in the classification, 1,466 genes are either
unclassified or unknown genes, as described by Riley's classi-
fication [45]. The remaining genes either belonged to classes
defined purely on the basis of compartmentalization or to
loosely defined families of proteins, or to classes with less
than five gene members. A list of classes queried along with
corresponding genes is given in Additional data file 5. Any set
of genes within this range can be queried in this analysis if
there is a hypothesis regarding their co-expression. Examples
of such classes can include stable clusters obtained from clus-
tering of individual or meta-datasets, or genes belonging to
one or related pathways of interest, or genes having a com-
mon upstream sequence motif. The choice of query classes
could depend on the nature of the experiment and the prior
expectations regarding the outcome.
Shannon entropy
Entropy in thermodynamic terms refers to the degree of dis-
order in the system. Claude Shannon [47] defined the concept
of entropy H in information theory as the degree of uncer-
tainty associated with an information source (equation 1):
where L stands for the number of states and p
i
corresponds to
the probability of occurrence in state i. An entropy value of 0
stands for a state of high probability and that of 1 corresponds
to a highly disordered state with high uncertainty and the
state that needs the most amount of information to describe
it. The general idea was applied by Alter et al. [4] to describe
the information contained in the principal eigenvectors
obtained by singular-value decomposition (SVD) of a micro-
array data set. A brief description of the SVD procedure is
given in Additional data file 6. Highly ordered and noiseless
datasets, with 1 or 2 dominant patterns of behavior, have low
entropy, whereas noisy and randomly behaving genes
constitute a high-entropy dataset. The concept of entropy has
also been applied elsewhere in microarray data analysis to
recursively develop a feature-rich training set for classifica-
tion [30,48] and to validate clustering methods [29].
In this method, we evaluated the reduction of entropy within
a pre-classified group of genes as a function of condition.
Functionally related genes will co-express in certain condi-
tions and not in others. Their enhanced co-expression, or cor-
relation, in a condition will cause the matrix of g × N
j
log-
ratios (g ∈ G) to be decomposed onto fewer eigenvectors, thus
causing the Shannon's entropy to be reduced from the univer-
sal or background entropy that the group possesses [4]. To get
an estimate of the background entropy of the group, the
entropy is iteratively calculated for the same group of genes
across the same number of arrays picked at random from the
dataset (Figure 6). The percentile reduction of entropy for a
class is then determined as the number of iterations in which
the condition-specific entropy is lower than the randomized
group entropy (equation 2):
M= N
j
i=1
k
∑
Hpp
ii
i
N
j
=
−
()
()
=
∑
1
1
log L
log
P
ij
array
=
percentile of entropy reduction for i class in
th
jj experiment
over randomly selected arrays for i class
th
th
=>
()
count H H
irand ij,
R32.14 Genome Biology 2006, Volume 7, Issue 4, Article R32 Sangurdekar et al. />Genome Biology 2006, 7:R32
A high percentile reduction value means that condition-spe-
cific class entropy is significantly lower than that of universal
(background) class entropy.
The same evaluation is done for a group of genes randomly
sampled from the genome for the same condition (equation
3):
Here, a high percentile reduction value means that the condi-
tion-specific class entropy is significantly lower than the
background condition entropy. High percentile reduction val-
ues, for both sets of entropies, implies that genes from a given
class are correlated better than expected by chance given
available sets of array experiments and expression profiles.
Amplitude of gene expression
Genes that are highly correlated (and low in entropy) could be
those that do not change their activity level at all during an
experiment. Also, these could correspond to imputed values
in the gene expression dataset. Since genes that do not change
their amplitude will be trivially decomposed onto an eigen-
vector of zero magnitude, such groups will have low entropies
and high percentile reduction values. To avoid getting biolog-
ically meaningless results, the amplitude of gene expression is
considered as the second descriptor of condition-specific
class activity. The amplitude of a gene is defined as the sum of
squares of expression log-ratios of a gene in the particular
condition (equation 4):
Distributions of entropy values for an active and randomized class-conditionFigure 6
Distributions of entropy values for an active and randomized class-condition. (a) Distribution of randomized entropies for an 'active' class-condition pair.
The actual entropy for the class is denoted by a vertical line. The percentile counts for the class correspond to the area of the distribution to the right of
the dotted line. (b) Expression profiles of an active class-condition. The darker gray lines indicate a highly correlated subset in the group. For an 'active'
class-condition, a significant portion of the gene members are co-expressed, leading to lower class entropy (see the Scree plot of eigenvalues in the inset).
(c) Distribution of entropies for the 'inactive' class-condition. (d) Expression profiles of the 'inactive' class-condition. Darker lines are relatively few
compared to lighter ones, as identified by SVD.
0
2
4
6
8
10
12
14
16
18
024681012
-3
-2
-1
0
1
2
3
4
024681012
-3
-2
-1
0
1
2
3
4
(a)
(d)(c)
(b)
0.00.20.40.60.81.0
0
2
4
6
8
18
Entropy (H)
10
12
14
16
Percentile
Percentile
Eigen vector
Eigen value
Eigen vector
Eigen value
Treatment
Log expression
Log expression
Treatment
0.00.20.40.60.81.0
Entropy (H)
P
ij
gene
=
percentile of entropy reduction for i class in j
th tth
th
experiment
over randomly selected genes in j experimennt
=>
()
count H H
rand j ij,
ArgG
ij kn
n
N
k
g
j
=
()
∈
()
==
∑∑
2
11
,
Genome Biology 2006, Volume 7, Issue 4, Article R32 Sangurdekar et al. R32.15
comment reviews reports refereed researchdeposited research interactions information
Genome Biology 2006, 7:R32
where A
ij
is the total amplitude of class i in experiment j, r
kn
is
the log-ratio of gene k in array n and N
j
is the number of
arrays in experiment j. Similar to entropy reduction, ampli-
tude gain for a class is defined as the percentile of condition-
specific gain in amplitude for the class-condition over the
background (equations 5 and 6):
A combined percentile score is calculated by adding the indi-
vidual percentile scores for gene-wide and array-wide
entropy reduction and amplitude gain (equation 7):
Finally, the scores are normalized to zero mean and a stand-
ard deviation of 1 for conditions (equation 8):
where is the standard deviation of the scores for all
classes within a condition.
Class subset Identification
For classes that show significant entropy reductions (scores
above 1), subsets of highly correlated genes were identified.
These genes are responsible for maximum reduction in
entropy for the class since their profile is represented by a sin-
gle vector. This is particularly insightful in larger and more
heterogeneous classes, such as genes controlled by global
regulators that have varied functions and ontologies. The pur-
poses of identifying the subset are: to establish an expression
profile for that class; and to collect genes that 'carry the class'
in a condition for the purposes of machine learning. Since a
class is identified on the basis of its high score, it is expected
such a filtered class would be enriched for a single expression
profile that can be seen in the gene subset. The expression
profile not only allows a visual interpretation of a class's
response to a condition, but also indicates whether the signif-
icant correlation within a class is supported by a substantial
change in gene expression values. The class-subset identifica-
tion is done by finding genes that correlate maximally with
the principal eigenvector of each low-entropy class.
Comparison with clustering
Using functional annotation to assess physiological responses
has its advantages over standard clustering followed by func-
tional interpretations. Clusters are defined to be functionally
enriched if a particular class (or classes) is statistically over-
represented in the cluster. To analyze which classes are
'learnable' by clustering techniques, we applied the principle
of information theory to clustering. We utilize the metric of
class-cluster entropy or mutual information ( , where i
refers to i
th
class, C refers to clustering result in j
th
condition)
to assess which class and how enriched it is in a clustering
result [29]. The class-cluster entropy, referred to as mutual
information MI for clarity, for a condition reflects how dis-
tributed a class is across all resulting clusters in that condi-
tion. A lower MI value would indicate that most of the genes
in a class are members of one (or few clusters), and a higher
entropy value would indicate a wider distribution (equation
9):
where H
ij
(A) indicates the total entropy of a class in a cluster-
ing result and H
ij
(A|C) indicates the conditional entropy of
the class given the clustering result.
Similar to a percentile value defined for class-condition, we
define a percentile value for class-cluster by randomizing
arrays (equation 10) and clustering each randomized dataset:
where H
AC
refers to the mutual information of a class in a
cluster result. A higher percentile count for a class in a given
condition would indicate that: the class is represented in
fewer clusters in a condition (enrichment); and the enrich-
ment is specific for a condition over the background for the
class. The percentile count is then normalized for a given class
over all conditions to define an activity score based on cluster-
ing results (equation 11):
The choice of clustering technique was k-means and hierar-
chical (complete linkage) clustering with Euclidean distance
metric over a range of cluster numbers k (6 to 10). This choice
was dictated by a previous study that showed that k-means
clustering performed better than hierarchical clustering and
was comparable to SOM (self-organizing feature map) for a
number of datasets, and the optimal cluster number was
found to be between 7 and 10 [29].
Comparison with the signature algorithm
The SA was seeded with classes, and these were refined with
a recurrence level of 70% and minimum occurrence of 70%
[28] till the set was stable. The number of top scoring arrays
for these classes was considered as the maximum of 40 or the
number of arrays having scored greater than 50. The enrich-
A
ij
gene
=
percentile of amplitude gain for i class in j
th th
eexperiment
over randomly selected genes in j experiment
th
=<
()
count A A
rand j ij,
A
ij
array
=
percentile of amplitude gain for i class in j
th th
experiment
over randomly selected arrays for i class
th
=<
()
count A A
irand ij,
S
PP AA
ij
ij
gene
ij
array
ij
gene
ij
array
=
+++
4
S
SmeanS
ij
ij i j
S
ij
=
−
∀
∀
[()]
σ
σ
S
ij∀
H
ij
AC
H
ij
AC
=
Mutual information content for class i
in cluster resuult C obtained in condition j
=
()
−
()
HA HAC
ij ij
|
PC
ij
array
=
percentile of class-cluster entropy reduction forr i class in j experiment
over randomly selected array
th th
ss for i class
th
=>count H H
irand
AC
ij
AC
()
,
S
PC mean PC
ij
cluster
ij
array
ij
array
S
ij
cluster
=
−
∀
∀
[()]
σ
R32.16 Genome Biology 2006, Volume 7, Issue 4, Article R32 Sangurdekar et al. />Genome Biology 2006, 7:R32
ment of each condition within these top scoring arrays was
calculated from a simple hypergeometric distribution (equa-
tion 12):
where N is the total number of arrays in the dataset, m is the
number of top scoring arrays, K is the total number of arrays
in the condition being tested, and X is the event that the top
scoring arrays have j arrays belonging to the condition being
tested. The threshold p value for significance was chosen as
0.05. The fraction of genes within a class retained by the
entropy method is calculated by considering those genes that
have a correlation of at least 0.5 with the principal eigenvec-
tor of the expression profile matrix for that class.
Analysis of simulated class data
A simulated class dataset was generated by randomizing
arrays in the expression profiles of SOS genes; 70% of the
genes in the class were then spiked with 7 different profiles
(including noise) in different conditions (Figure S8 in Addi-
tional data file 1). This dataset replaced the original SOS class
and was then subject to the entropy method, k-means and
hierarchical clustering and the SA. The simulation was
repeated several times by generating new randomized class
datasets, keeping the spiked profiles constant. Each method
was then tested for its ability to identify spiked conditions as
active (score >1 or p value < 0.05) and to identify the mini-
mum number of false positives, that is, unspiked conditions
as active. For SA, the number of top scoring arrays considered
was equal to the total number of arrays in spiked conditions.
The parameters used for SA were the same as those described
above.
The raw data (log expression ratios) used for this study and
the description of conditions are available as Additional data
files 7 and 8. Part of the data discussed here has been pub-
lished earlier and is publicly available at the Stanford Micro-
array Database. [43]; worldwide web links are provided in
Additional data file 8. The data introduced in this publication
have been deposited in the NCBI Gene Expression Omnibus
(GEO) [49] and are accessible through GEO Series accession
number GSE4357-GSE4380. The algorithms for comparison
of entropies and for subset identification were coded in MAT-
LAB 6.5 [50]. The program for entropy reduction is available
as MATLAB code in Additional data file 9, and updated ver-
sions will be made available online [51].
Additional data files
The following additional data are available with the online
version of this paper. Additional data file1 contains supple-
mentary figures S1 to S8. Figure S1. Ribosomal and Heat
shock genes; Figure S2. Drug (DNA damaging) comparisons;
Figure S3. Norfloxacin treatment in resistant strains; Figure
S4: Profile of RpoS subgroup in all conditions; Figure S5. Sig-
nature classes in LB recovery conditions; Figure S6. Growth
conditions comparison; Figure S7. Drug (non-DNA damag-
ing) comparisons; Figure S8. Simulated expression profiles
for comparison of methods. Additional data file2 is a table
listing the scores of top classes in antibiotic and radiation
treatments. Additional data file3 is a table listing the top class
scores in growth and recovery conditions. Additional data file
4 is a table listing the comparison of results obtained from
entropy reduction and SA. Additional data file 5 is a list of
classes and corresponding genes used in the analysis. Addi-
tional data file 6 is a description of SVD and the method of
entropy calculation. Additional data file 7 is a text file con-
taining the log ratio expression data. Additional data file 8 is
a spreadsheet file explaining the conditions used in this anal-
ysis and their descriptions. Additional data file 9 is the MAT-
LAB code (EntropyReduce) with sample data files in a
compressed (zip) format.
Additional File 1Supplementary images S1 to S8Figure S1. Ribosomal and Heat shock genes; Figure S2. Drug (DNA damaging) comparisons; Figure S3. Norfloxacin treatment in resistant strains; Figure S4: Profile of RpoS subgroup in all condi-tions; Figure S5. Signature classes in LB recovery conditions; Fig-ure S6. Growth conditions comparison; Figure S7. Drug (non-DNA damaging) comparisons; Figure S8. Simulated expression profiles for comparison of methodsClick here for fileAdditional File 2Scores of top classes in antibiotic and radiation treatmentsScores of top classes in antibiotic and radiation treatmentsClick here for fileAdditional File 3Top class scores in growth and recovery conditionsTop class scores in growth and recovery conditionsClick here for fileAdditional File 4Comparison of results obtained from entropy reduction and SAComparison of results obtained from entropy reduction and SAClick here for fileAdditional File 5Classes and corresponding genes used in the analysisClasses and corresponding genes used in the analysisClick here for fileAdditional File 6Description of SVD and the method of entropy calculationDescription of SVD and the method of entropy calculationClick here for fileAdditional File 7Log ratio expression dataLog ratio expression dataClick here for fileAdditional File 8Conditions used in this analysis and their descriptionsConditions used in this analysis and their descriptionsClick here for fileAdditional File 9MATLAB code (EntropyReduce)Sample data files are in a compressed (zip) formatClick here for file
Acknowledgements
We thank Jaeyong Ahn, David Botstein, Jon Bernstein, Stan Cohen, Justin
Courcelle, Nick Cozzarelli, Paul Fawcett, Cres Fraley, Carol Gross, Phil
Hanawalt, Heenam Kim, Arthur Kornberg, Sydney Kustu, Rowena Mat-
thews, Brian Peter, Annika Scaaf, Travis Tani, Goutham Vemuri, Andre
White and Charles Yanofsky for providing biological samples used in this
study and for discussions. A.B.K. is grateful to Pat Brown for supporting a
portion of this work. Dr Brown is an HHMI investigator in the Deparment
of Biochemistry at the Stanford University Medical School. This work was
supported in part by Grant GM066098 from the National Institutes of
Health to A.B.K. and by N.S.F. grant to ABK and FS. A.B.K. dedicates this
paper to the memory of his teacher, Nicholas Cozzarelli.
References
1. DeRisi JL, Iyer VR, Brown PO: Exploring the metabolic and
genetic control of gene expression on a genomic scale. Sci-
ence 1997, 278:680-686.
2. Eisen MB, Spellman PT, Brown PO, Botstein D: Cluster analysis
and display of genome-wide expression patterns. Proc Natl
Acad Sci USA 1998, 95:14863-14868.
3. Holter NS, Mitra M, Maritan A, Cieplak M, Banavar JR, Fedoroff NV:
Fundamental patterns underlying gene expression profiles:
simplicity from complexity. Proc Natl Acad Sci USA 2000,
97:8409-8414.
4. Alter O, Brown PO, Botstein D: Singular value decomposition
for genome-wide expression data processing and modeling.
Proc Natl Acad Sci USA 2000, 97:10101-10106.
5. Raychaudhuri S, Stuart JM, Altman RB: Principal components
analysis to summarize microarray experiments: application
to sporulation time series. Pac Symp Biocomput 2000:455-466.
6. Toronen P, Kolehmainen M, Wong G, Castren E: Analysis of gene
expression data using self-organizing maps. FEBS Lett 1999,
451:142-146.
7. Bergmann S, Ihmels J, Barkai N: Iterative signature algorithm for
the analysis of large-scale gene expression data. Phys Rev E Stat
Nonlin Soft Matter Phys 2003, 67:031902.
8. Gasch AP, Eisen MB: Exploring the conditional coregulation of
yeast gene expression through fuzzy k-means clustering.
Genome Biol 2002, 3:RESEARCH0059.
9. Ihmels J, Bergmann S, Barkai N: Defining transcription modules
using large-scale gene expression data. Bioinformatics 2004,
20:1993-2003.
10. Segal E, Friedman N, Koller D, Regev A: A module map showing
conditional activity of expression modules in cancer. Nat
Genet 2004, 36:1090-1098.
pX j
K
l
NK
ml
N
m
l
j
=
()
=
−
−
=
∑
1
Genome Biology 2006, Volume 7, Issue 4, Article R32 Sangurdekar et al. R32.17
comment reviews reports refereed researchdeposited research interactions information
Genome Biology 2006, 7:R32
11. Tanay A, Sharan R, Shamir R: Discovering statistically significant
biclusters in gene expression data. Bioinformatics 2002,
18(Suppl 1):S136-144.
12. Segal E, Shapira M, Regev A, Pe'er D, Botstein D, Koller D, Friedman
N: Module networks: identifying regulatory modules and
their condition-specific regulators from gene expression
data. Nat Genet 2003, 34:166-176.
13. Kerr MK, Churchill GA: Bootstrapping cluster analysis: assess-
ing the reliability of conclusions from microarray
experiments. Proc Natl Acad Sci USA 2001, 98:8961-8965.
14. Brown MP, Grundy WN, Lin D, Cristianini N, Sugnet CW, Furey TS,
Ares M Jr, Haussler D: Knowledge-based analysis of microarray
gene expression data by using support vector machines. Proc
Natl Acad Sci USA 2000, 97:262-267.
15. Qian J, Lin J, Luscombe NM, Yu H, Gerstein M: Prediction of
regulatory networks: genome-wide identification of tran-
scription factor targets from gene expression data. Bioinfor-
matics 2003, 19:1917-1926.
16. Mateos A, Dopazo J, Jansen R, Tu Y, Gerstein M, Stolovitzky G: Sys-
tematic learning of gene functional classes from DNA array
expression data by using multilayer perceptrons. Genome Res
2002, 12:1703-1715.
17. VanBogelen RA, Neidhardt FC: Ribosomes as sensors of heat and
cold shock in Escherichia coli. Proc Natl Acad Sci USA 1990,
87:5589-5593.
18. Khodursky AB, Peter BJ, Cozzarelli NR, Botstein D, Brown PO,
Yanofsky C: DNA microarray analysis of gene expression in
response to physiological and genetic changes that affect
tryptophan metabolism in Escherichia coli. Proc Natl Acad Sci
USA 2000, 97:12170-12175.
19. Sugino A, Higgins NP, Brown PO, Peebles CL, Cozzarelli NR: Energy
coupling in DNA gyrase and the mechanism of action of
novobiocin. Proc Natl Acad Sci USA 1978, 75:4838-4842.
20. Peter BJ, Arsuaga J, Breier AM, Khodursky AB, Brown PO, Cozzarelli
NR: Genomic transcriptional response to loss of chromo-
somal supercoiling in Escherichia coli. Genome Biol 2004, 5:R87.
21. Khodursky AB, Cozzarelli NR: The mechanism of inhibition of
topoisomerase IV by quinolone antibacterials. J Biol Chem
1998, 273:27668-27677.
22. Bliska JB, Cozzarelli NR: Use of site-specific recombination as a
probe of DNA structure and metabolism in vivo. J Mol Biol
1987, 194:205-218.
23. Schneider R, Travers A, Muskhelishvili G: FIS modulates growth
phase-dependent topological transitions of DNA in
Escherichia coli. Mol Microbiol 1997, 26:519-530.
24. Lakshmi TM, Helling RB: Selection for citrate synthase defi-
ciency in icd mutants of Escherichia coli. J Bacteriol 1976,
127:76-83.
25. Helling RB, Kukora JS: Nalidixic acd-resistant mutants of
Escherichia coli deficient in isocitrate dehydrogenase. J
Bacteriol 1971, 105:1224-1226.
26. Richard HT, Foster JW: Acid resistance in Escherichia coli. Adv
Appl Microbiol 2003, 52:167-186.
27. Everitt B, Landau S, Leese M: Cluster Analysis 4th edition. London, New
York: Arnold, Oxford University Press; 2001.
28. Ihmels J, Friedlander G, Bergmann S, Sarig O, Ziv Y, Barkai N:
Revealing modular organization in the yeast transcriptional
network. Nat Genet 2002, 31:370-377.
29. Gibbons FD, Roth FP: Judging the quality of gene expression-
based clustering methods using gene annotation. Genome Res
2002, 12:1574-1581.
30. Furlanello C, Serafini M, Merler S, Jurman G: Entropy-based gene
ranking without selection bias for the predictive classifica-
tion of microarray data. BMC Bioinformatics 2003, 4:54.
31. Schug J, Schuller WP, Kappen C, Salbaum JM, Bucan M, Stoeckert CJ
Jr: Promoter features related to tissue specificity as meas-
ured by Shannon entropy. Genome Biol 2005, 6:R33.
32. Strait BJ, Dewey TG: The Shannon information entropy of pro-
tein sequences. Biophys J 1996, 71:148-155.
33. Frappat L, Minichini C, Sciarrino A, Sorba P: Universality and Shan-
non entropy of codon usage. Phys Rev E Stat Nonlin Soft Matter
Phys 2003, 68:061910.
34. Fuhrman S, Cunningham MJ, Wen X, Zweiger G, Seilhamer JJ, Som-
ogyi R: The application of shannon entropy in the identifica-
tion of putative drug targets. Biosystems 2000, 55:5-14.
35. Ma HW, Buer J, Zeng AP: Hierarchical structure and modules in
the Escherichia coli transcriptional regulatory network
revealed by a new top-down approach. BMC Bioinformatics 2004,
5:199.
36. Tanay A, Sharan R, Kupiec M, Shamir R: Revealing modularity and
organization in the yeast molecular network by integrated
analysis of highly heterogeneous genomewide data. Proc Natl
Acad Sci USA 2004, 101:2981-2986.
37. Kafri R, Bar-Even A, Pilpel Y: Transcription control reprogram-
ming in genetic backup circuits. Nat Genet 2005, 37:295-299.
38. Murray EL, Conway T: Multiple regulators control expression
of the Entner-Doudoroff aldolase (Eda) of Escherichia coli. J
Bacteriol 2005, 187:991-1000.
39. Courcelle J, Khodursky A, Peter B, Brown PO, Hanawalt PC: Com-
parative gene expression profiles following UV exposure in
wild-type and SOS-deficient Escherichia coli. Genetics 2001,
158:41-64.
40. Bernstein JA, Khodursky AB, Lin PH, Lin-Chao S, Cohen SN: Global
analysis of mRNA decay and abundance in Escherichia coli at
single-gene resolution using two-color fluorescent DNA
microarrays. Proc Natl Acad Sci USA 2002, 99:9697-9702.
41. The MGuide. Version 2.0 [ />mguide/]
42. Khodursky AB, Bernstein JA, Peter BJ, Rhodius V, Wendisch VF, Zim-
mer DP: Escherichia coli spotted double-strand DNA microar-
rays: RNA extraction, labeling, hybridization, quality
control, and data management. Methods Mol Biol 2003,
224:61-78.
43. Sherlock G, Hernandez-Boussard T, Kasarskis A, Binkley G, Matese
JC, Dwight SS, Kaloper M, Weng S, Jin H, Ball CA, et al.: The Stan-
ford Microarray Database. Nucleic Acids Res 2001, 29:152-155.
44. Keseler IM, Collado-Vides J, Gama-Castro S, Ingraham J, Paley S,
Paulsen IT, Peralta-Gil M, Karp PD: EcoCyc: a comprehensive
database resource for Escherichia coli. Nucleic Acids Res
2005:D334-D337.
45. Serres MH, Goswami S, Riley M: GenProtEC: an updated and
improved analysis of functions of Escherichia coli K-12
proteins. Nucleic Acids Res 2004, 32:D300-302.
46. Salgado H, Gama-Castro S, Martinez-Antonio A, Diaz-Peredo E,
Sanchez-Solano F, Peralta-Gil M, Garcia-Alonso D, Jimenez-Jacinto V,
Santos-Zavaleta A, Bonavides-Martinez C, Collado-Vides J: Regu-
lonDB (version 4.0): transcriptional regulation, operon
organization and growth conditions in Escherichia coli K-12.
Nucleic Acids Res 2004, 32:D303-306.
47. Shannon CE, Weaver W: The Mathematical Theory of Communication
Illinois, USA: The University of Illinois Press; 1964.
48. Furlanello C, Serafini M, Merler S, Jurman G: An accelerated pro-
cedure for recursive feature ranking on microarray data.
Neural Netw 2003, 16:641-648.
49. NCBI Gene Expression Omnibus [ />geo/]
50. The Mathworks []
51. Khodursky Lab []