Báo cáo y học: "Novel gene and gene model detection using a whole genome open reading frame analysis in proteomics" ppt
Bạn đang xem bản rút gọn của tài liệu. Xem và tải ngay bản đầy đủ của tài liệu tại đây (277.8 KB, 13 trang )
Open Access
Volume
et al.
Fermin
2006 7, Issue 4, Article R35
Research
Damian Fermin*, Baxter B Allen*, Thomas W Blackwell*, Rajasree Menon*,
Marcin Adamski*, Yin Xu*, Peter Ulintz*, Gilbert S Omenn† and
David J States*‡
Correspondence: David J States. Email:
Published: 28 April 2006
reviews
Addresses: *Bioinformatics Program, University of Michigan, Ann Arbor, MI 48109, USA. †Department of Internal Medicine, University of
Michigan, Ann Arbor, MI 48109, USA. ‡Department of Human Genetics, University of Michigan, Ann Arbor, MI 48109, USA.
comment
Novel gene and gene model detection using a whole genome open
reading frame analysis in proteomics
Received: 5 January 2006
Revised: 22 February 2006
Accepted: 27 March 2006
Genome Biology 2006, 7:R35 (doi:10.1186/gb-2006-7-4-r35)
© 2006 Fermin et al.; licensee BioMed Central Ltd.
This is an open access article distributed under the terms of the Creative Commons Attribution License ( which
permits unrestricted use, distribution, and reproduction in any medium, provided the original work is properly cited.
protein encoding genes, as demonstrated data combined with a six-frame translation of the human genome can be used to identify novel
High-throughput mass spectroscopy with a search for plasma proteins.
Human gene detection
interactions
Results: Applying a false discovery rate threshold of 0.05, we identified 282 significant open
reading frames, each containing two or more peptide matches. There were 627 novel peptides
associated with these open reading frames that mapped to a unique genomic coordinate placed
within the start/stop points of previously annotated genes. These peptides matched 1,110 distinct
tandem MS spectra. Peptides fell into four categories based upon where their genomic coordinates
placed them relative to annotated exons within the parent gene.
refereed research
Background: Defining the location of genes and the precise nature of gene products remains a
fundamental challenge in genome annotation. Interrogating tandem mass spectrometry data using
genomic sequence provides an unbiased method to identify novel translation products. A six-frame
translation of the entire human genome was used as the query database to search for novel blood
proteins in the data from the Human Proteome Organization Plasma Proteome Project. Because
this target database is orders of magnitude larger than the databases traditionally employed in
tandem mass spectra analysis, careful attention to significance testing is required. Confidence of
identification is assessed using our previously described Poisson statistic, which estimates the
significance of multi-peptide identifications incorporating the length of the matching sequence,
number of spectra searched and size of the target sequence database.
deposited research
Abstract
reports
The electronic version of this article is the complete one and can be
found online at />
Conclusion: This work provides evidence for novel alternative splice variants in many previously
annotated genes. These findings suggest that annotation of the genome is not yet complete and that
proteomics has the potential to further add to our understanding of gene structures.
Defining the location of genes and the precise nature of gene
products remains a fundamental challenge in genomics. High
throughput tandem mass spectrometry based proteomics
provides an important new source of information to help
define both the location of transcription units and the reading
Genome Biology 2006, 7:R35
information
Background
R35.2 Genome Biology 2006,
Volume 7, Issue 4, Article R35
Fermin et al.
frame of protein translation. In theory, high throughput proteomics will complement genome and transcript sequence
analysis by independently confirming translation products.
In practice, a number of technical challenges have limited the
widespread use of this approach. In this paper, we present a
novel statistical approach to assessing the significance of peptide and open reading frame (ORF) matches when searching
very large target sequence collections. We further demonstrate that these measures allow us to identify a substantial
number of new gene models by comparing the tandem mass
spectra data of the Human Proteome Organization (HUPO)
Plasma Proteome Project (PPP) against the amino acid
sequences coded by all of the ORFs in the human genome.
The use of an exhaustive translation of the human genome
also allows us to identify many peptides not contained in the
standard protein sequence collections.
In the five years since the first draft of the human genome was
released, it has undergone numerous revisions primarily in
the form of additional gene annotations. However, despite
the fact that we live in a post-genomic era, there is still much
to be learned from the sequence that is the basic blueprint for
humans. As the number of genome entries in public databases has expanded in recent years, de novo gene prediction
has been greatly improved. New approaches have been developed that employ multiple genome alignments to make better
gene predictions [1-3]. Along with these new gene predictors,
empirical data from expressed sequence tags (ESTs) are also
being exploited in the search for novel coding regions [4,5].
Despite these advances, there still remains a great deal of
uncertainty regarding the current gene model [6].
High throughput, bottom up chromatography/tandem mass
spectrometry protein identification strategies, makes possible a new approach to human genome annotation: identifying
all known proteins. Using mass spectrometry (MS) data, it is
now possible to work backwards from a protein to its parent
genomic sequence. Previous work has been done using mass
spectra for de novo gene finding [7]. Recently, Desiere et al .
[8] performed such an analysis using their MS data. In their
work they were able to map 25,754 of their 26,840 peptides to
9,747 of the human Ensembl proteins. Kuster et al . [9] and
/>
Choudhary et al . [10] both used the draft sequence of the
human genome as a template to search for novel peptides.
One of the major limitations of protein identification by MS is
that all current software packages rely on a protein database
against which to search. As a result, even the most exhaustive
protein database search is limited to the data available in the
current public databases. This poses a serious constraint if
one is searching for novel protein coding regions since all
results will be limited to data for a small set of highly curated
proteins. In this paper, we describe an exhaustive protein
database generated from the 6-frame translation of the entire
human genome to identify peptides isolated from human
blood. Peptides found from the MS data of the Human PPP
were mapped back to their parent sequences using this database [11]. Our method revealed a number of splice variants to
previously annotated genes as well as several new coding
regions that potentially encode novel exons. These candidate
regions were validated using EST mapping.
Results
Identifying novel splice variants
Since our goal was to identify novel coding regions including
splice variants, we needed to obtain all the possible ORFs
encoded by the genome. To this end we generated a putative
open reading frame FASTA file for each chromosome. These
ORF sequences were obtained by translating each chromosome in all six reading frames. This method of generating a
putative ORF library did not take into account global genomic
features such as exon/intron splice boundaries or repeat
regions. Therefore, the method produced a significant
number of protein sequences that were unlikely to be real.
The average length of a sequence in our library of ORFs is 25.5
residues (± 22.6 standard deviations). In contrast, the average protein length of an entry in the International Protein
Index (IPI) database (release 3.14) is 438.5 amino acids (±
523.8 standard deviations) [12]. This suggests an overabundance of relatively short peptide sequences in our protein
data set. Our method, however, ensured that we obtained a
representative for every possible exon encoded in the human
genome. We were willing, therefore, to accept this initial high
degree of signal to noise in our putative ORF library.
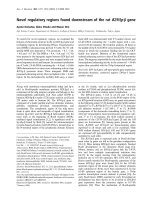
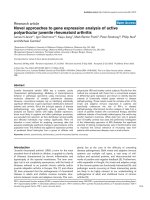
Figure 1 (see following page)
Selection of candidate high confidence ORFs
Selection of candidate high confidence ORFs. The flowchart diagrams how high confidence ORFs were identified. Data starts with raw spectra being
analyzed by X!Tandem using our six-frame genome translation and ends with our set of high confidence ORFs and the peptides contained within them.
The dashed line indicates the switch from discussion of spectra/peptides to ORFs.
Genome Biology 2006, 7:R35
/>
Genome Biology 2006,
2,230,502 spectra
Analyze spectra using X!Tandem and
6-frame translation of Human genome
Fermin et al. R35.3
comment
Raw Spectra from Hupo PPP
Volume 7, Issue 4, Article R35
516,524 spectra
reviews
Has Hyperscore >= 35?
105,065 spectra
yes
66,711 spectra
(or peptides)
Spectrum matches to only 1 peptide sequence?
reports
yes
38,906 spectra/peptides
yes
Does parent ORF have >= 2 diagnostic peptides?
2354 ORFs
(7,648 peptides)
deposited research
Peptide sequence occurs in only 1 ORF?
yes
928 intra-genic ORFs
(3,726 peptides)
yes
Does ORF have a confidence score >= 0.95?
282 ORFs
(2,314 peptides)
427 ORFs
(3,544 peptides)
interactions
yes
refereed research
Does peptide's parent ORF overlap a known gene?
information
Figure 1 (see legend on previous page)
Genome Biology 2006, 7:R35
R35.4 Genome Biology 2006,
Volume 7, Issue 4, Article R35
Fermin et al.
Selection of diagnostic peptides
The ORF library was used as the search database for X!Tandem, an open source program that matches tandem mass
spectra to a peptide sequence from a given database of protein sequences [13,14]. As mentioned earlier, the putative
ORF library used by X!Tandem contained a very high degree
of noise. As a result, the peptide identifications resulting from
this analysis needed to be filtered to remove false hits. As an
initial filtering step, spectra whose X!Tandem peptide
matches had hyperscores below 35 were removed from consideration. Large hyperscore values indicate that the match
made by X!Tandem was a high confidence one. This threshold
was chosen based upon analysis of a hyperscore receiveroperator curve(ROC) generated from a collection of known
high confidence matches and a set of known false negatives
(see Materials and methods). In choosing a threshold of 35,
we reduced the number of potential false positive matches
made by X!Tandem. This reduced our search space to onefifth its original size (516,524 spectra reduced to 105,065
spectra). Many spectra were matched to multiple peptide
sequences. In these instances, it would be difficult to determine which peptide is the true match to the spectra. To avoid
this ambiguity, we selected for spectra that were only
matched to a single unique peptide sequence. From these
peptides, we selected out only those that were unique to a single ORF in the database. This left us with 38,906 peptide
matches that we are considering our set of high-confidence
diagnostic peptides. In the flowchart presented in Figure 1,
this corresponds to the first box below the dashed line.
Selection of candidate open reading frames
To identify potential novel coding regions, the diagnostic peptides were mapped back to their parent ORFs. A total of
33,502 putative ORFs contained at least 1 diagnostic peptide.
High confidence ORFs as identified using our Poisson probability (see Materials and methods), which had at least 2 diagnostic peptide matches, were selected. Based on these
criteria, we isolated a total of 427 ORFs that were represented
by 3,544 diagnostic peptides. Candidate ORFs were then separated into two major categories based upon whether or not
their coordinates overlapped with those of an annotated gene.
A total of 282 ORFs (represented by 2,314 peptides) were
/>
classified as intragenic ORFs. The information presented up
to this point is contained within the flowchart of Figure 1. We
then analyzed these ORFs and their associated peptides in
greater detail.
Analysis of intragenic open reading frame peptides
To validate our method, we examined the peptides derived
from intragenic ORFs in terms of how well they matched to
known protein coding regions. Work from this section is illustrated in the flowchart in Figure 2. Of the 2,314 intragenic
peptides, 5 were derived from an ORF that straddled 2 different gene coding regions. Since we were unable to determine
which gene produced which peptide, all five were discarded.
The remaining 2,309 were unique to a single gene and their
peptide sequences were searched against a non-redundant
human protein database for exact matches. A total of 1,682
(72.8%) of the intragenic peptides had exact matches to the
protein products of the genes they occur within. These peptides were classified as perfect matching (PM) peptides. A
total of 89 distinct proteins encompassed all of these PM
peptides.
The remaining 627 intragenic peptides do not have a perfect
match to a known protein product. This suggests that these
peptides represent novel protein products for the genes
within which they occur. These peptides were classified into
three distinct categories depending upon their position relative to the genomic coordinates of an annotated gene. There
were 47 peptides that occurred inside of an annotated exon of
their parent gene, but in a different reading frame. These we
called (IE) intra-exonic peptides. Another 90 peptides overlapped with a portion of an annotated exon (overlapping
exons (OEs)) and the remaining 490 peptides fell in between
the coordinates of annotated exons in their parent gene (nonexonic (NE)). Taken together, a total of 128 genes were represented by these intragenic peptides. Table 1 lists the breakdown of all the intragenic peptides. A total of 128 genes
encompassed all of our intragenic peptides. Table 2 lists a
sampling of the 128 genes along with the peptide breakdown
for each gene. A complete list is provided in Additional data
file 1.
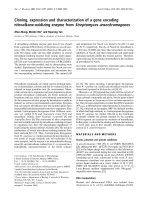
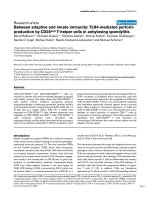
Figure 2 (see following page)
Selection and classification of diagnostic peptides
Selection and classification of diagnostic peptides. The flowchart outlines how diagnostic peptides found in high-confidence ORFs were classified into four
categories: perfect match (PM), intra-exonic (IE), overlapping exon (OE), and non-exonic (NE).
Genome Biology 2006, 7:R35
/>
Genome Biology 2006,
Volume 7, Issue 4, Article R35
Fermin et al. R35.5
comment
282 ORFs (2,314 peptides)
Does intra-genic peptide occur in only 1 gene?
2,309 peptides
reviews
yes
Is intra-genic peptide in at least 1 translated
transcript of its parent Ensembl 32 gene?
(REGEX Search)
1,657
Ensembl perfect
matching peptides
(PM)
yes
no perfect matches
(652 peptides)
25
IPI perfect
matching peptides
(PM)
yes
no
Is peptide completely
contained within exon?
490
non-exonic peptides
(NE)
90
overlap-exon peptides
(OE)
yes
interactions
no
refereed research
Does intra-genic peptide overlap with a known exon?
deposited research
BLAST to custom
NR protein Database
reports
yes
no
(652 peptides)
47
intra-exonic peptides
(IE)
information
Figure 2 (see legend on previous page)
Genome Biology 2006, 7:R35
R35.6 Genome Biology 2006,
Volume 7, Issue 4, Article R35
Fermin et al.
/>
Table 1
Diagnostic peptides
Number
ORF identification statistics
All peptide matches above hyperscore 35
105,065
+ spectra match only a single peptide
66,711
+ peptide maps to a unique location in the genome
38,906
ORFs with confidence > 95%*
427
Peptide classification
Intra-exonic perfect match (PM)
1,682
Intra-exonic different reading frame (IE)
47
Overlapping exon (OE)
90
Non-exonic (NE)
490
Peptides are categorized based upon where they align to in relation to the annotated start/stop boundaries of genes.*Based on Poisson statistic with
correction for multiple hypothesis testing
Of the 128 genes listed, 20 had peptide matches that only
occur in non-coding regions. Upon closer inspection of these
peptides, most of them contained long repeats of glycine, suggesting that they may be erroneous matches. Rather than discarding these hits immediately, we first tried to determine if
there was expression data supporting the observed novel
peptide.
Verification of novel peptides through ESTs
We searched the EST library using our set of diagnostic peptides. If these peptides were in fact being translated, we would
expect to identify transcripts encoding them. For this analysis, the DNA sequence encoding the peptide plus 100 basepair flanking sequence was used in an alignment search. In
instances where peptides were substrings of one another,
only the longest representative peptide was used as a BLAST
query. By doing so, we reduced the number of diagnostic peptides from 2,314 to 1,202. Only hits involving some part of the
peptide's coding region were considered true matches. Table
3 gives the breakdown of peptides in the four categories: OE,
NE, IE, and PM. The peptide category with the most EST hits
was the PM category. Of the peptides that occurred within
known exons but in different reading frames, 24 (62%) of
them had EST matches, while 36 (65%) of the peptides that
overlapped partially with known exons also had EST hits.
Table 4 gives a representative list of the peptide-to-EST
matches by gene. The complete list is available in Additional
data file 2. A total of 114 genes had diagnostic peptides associated with them that also had EST matches to those peptides.
This accounted for 89% of the total genes we reported as having a diagnostic peptide match. The genes having the most
EST matches were proteins commonly found in plasma. Only
9 of the 20 genes mentioned earlier for their sole representation by NE peptides had EST supporting evidence for their
assigned peptides. Upon inspection of the amino acid
sequences for their peptides, it was found that 40 of them
(representing 3 genes) were predominately glycine repeats.
Overall, a total of 14 identified genes were discarded from the
list given in Additional data file 1 since it was more likely that
their reported peptide matches were erroneous.
A total of 47 of the 114 genes had EST hits to peptides that
were classified as either NE (49 peptides) or OE (52 peptides).
These matches potentially represented novel coding regions.
The longest conserved block of ESTs that overlapped with a
peptide's encoding coordinates were used to better define the
boundaries of the novel coding region. Eighty of the 101 novel
coding regions (represented by 43 genes) had well defined
boundaries that were supported by ESTs. Additional data file
3 summarizes the coordinates for each of the novel OE and
NE coding regions found within the 43 genes.
Protein features of encompassing genes
We examined the annotated protein products of the genes
having the novel coding regions defined by OE peptides. NE
and IE peptides also represented novel protein products but,
with MS data alone, we were unable to accurately define the
boundaries for the novel coding region. A new protein product containing the OE peptide sequence was generated and
searched against PROSITE and UNIPROT to determine what
impact, if any, the addition of the diagnostic peptide fragment
would have on the protein's domains. A total of 11 diagnostic
peptides overlapped in some way with a known protein
domain. Table 5 summarizes the domains identified for the
protein products of the genes.
In all cases, the impact caused by the presence of the extra
amino acids introduced by the OE peptide was limited to a
single domain. PROSITE was able to identify the domain
regardless of the presence or absence of the extra amino acid
characters, suggesting that the functional components of the
Genome Biology 2006, 7:R35
/>
Genome Biology 2006,
Volume 7, Issue 4, Article R35
Fermin et al. R35.7
Table 2
A representative set of peptide containing genes
OE
NE
Gene description
-
ENSG00000198209
28
26
0
2
0
A1BG
ENSG00000121410
19
19
0
0
0
Alpha-1B-glycoprotein precursor (Alpha-1-B glycoprotein)
A2M
ENSG00000175899
47
46
0
0
1
Alpha-2-macroglobulin precursor (Alpha-2-M)
AFM
ENSG00000079557
12
11
0
0
1
Afamin precursor (Alpha-albumin; Alpha-Alb)
AGT
ENSG00000135744
21
21
0
0
0
Angiotensinogen precursor (contains angiotensin I (Ang I);
angiotensin II (Ang II); angiotensin III (Ang III) (Des-Asp[1]angiotensin II)).
AHSG
ENSG00000145192
24
24
0
0
0
Alpha-2-HS-glycoprotein precursor (Fetuin-A; Alpha-2-Zglobulin; Ba-alpha-2-glycoprotein)
ALB
ENSG00000163631
111
108
0
3
0
Serum albumin precursor
ANKRD24
ENSG00000089847
7
0
5
2
0
F20887_1, partial CDS (fragment)
APC2
ENSG00000115266
9
0
5
0
4
Adenomatosis polyposis coli 2
APCS
ENSG00000132703
11
11
0
0
0
Serum amyloid P-component precursor (SAP; 9.5S alpha-1glycoprotein; contains serum amyloid P-component(1203))
APOA1
ENSG00000118137
53
52
0
1
0
Apolipoprotein A-I precursor (Apo-AI; ApoA-I; contains
apolipoprotein A-I(1-242))
APOA2
ENSG00000158874
17
15
0
2
0
Apolipoprotein A-II precursor (Apo-AII; ApoA-II; contains
apolipoprotein A-II(1-76))
APOB
ENSG00000084674
112
110
0
2
0
Apolipoprotein B-100 precursor (Apo B-100; contains
apolipoprotein B-48 (Apo B-48))
APOC3
ENSG00000110245
4
4
0
0
0
Apolipoprotein C-III precursor (Apo-CIII; ApoC-III)
APOE
ENSG00000130203
13
13
0
0
0
Apolipoprotein E precursor (Apo-E)
APOF
ENSG00000175336
4
4
0
0
0
Apolipoprotein F precursor (Apo-F)
APOH
ENSG00000091583
15
15
0
0
0
Beta-2-glycoprotein I precursor (apolipoprotein H; Apo-H;
B2GPI; Beta(2)GPI; activated protein C-binding protein;
APC inhibitor; anticardiolipin cofactor)
APOL1
ENSG00000100342
5
5
0
0
0
Apolipoprotein-L1 precursor (apolipoprotein L-I;
apolipoprotein L; ApoL-I; Apo-L; ApoL)
AZGP1
ENSG00000160862
9
9
0
0
0
Zinc-alpha-2-glycoprotein precursor (Zn-alpha-2glycoprotein; Zn-alpha-2-GP)
AZI1
ENSG00000141577
3
0
0
3
0
5-azacytidine induced 1 isoform a
BF
ENSG00000166285
9
7
0
2
0
Complement factor B precursor (EC 3.4.21.47; C3/C5
convertase; properdin factor B; glycine-rich beta
glycoprotein; GBG; PBF2)
Complement component 4B preproprotein
We identified a number of novel splice variants to previously
annotated genes. These splice variants were identified working backwards from MS data to their parent-coding region in
The first two categories represented peptides that were completely contained within annotated exons. The first of these
were the intra-exon PM peptides. These represented a control
Genome Biology 2006, 7:R35
information
Discussion
the genome. A six-frame translation of the entire human
genome was used as the query database for the protein identification analysis. This enabled us to detect protein products
that are currently not in the public databases. We first investigated peptides that could potentially represent novel splice
variants of known genes. A total of 2,309 peptides were isolated whose genomic coordinates placed them singularly
within the start/stop points of annotated genes. These peptides were grouped into four categories based upon where
their genomic coordinates place them within their parent
gene. Of these categories, three represent peptides that in
some way overlap with a known exon.
interactions
domains remained intact and were thus not disrupted by the
additional amino acid residues. A review of the literature
revealed that all but one of the domains overlapped by the
peptides were associated with plasma proteins. The remaining domain is called sirtuin and is reported to function in peptide deacetylation in an NAD-dependent manner. The
proteins having this domain are members of the sirtuin family. These proteins are associated with cellular functions
involving transcriptional silencing, cell cycle progression, and
chromosome stability [15].
refereed research
A breakdown of the distribution of diagnostic peptides among the 128 parent genes they occur in. HUGO gene ID, HUGO gene identifier; Ensembl
gene ID, the Ensembl identifier for the gene containing the diagnostic peptides; PT, the total number of diagnostic peptides found within the coding
boundaries of this gene; PM, number of perfect-matching peptides to a protein product of this gene; IE, number of intra-exonic peptides associated
with this gene; OE, number of exon overlapping peptides associated with this gene; NE, number of non-exonic peptides associated with this gene;
Gene description, the name given to the gene according to the Ensembl Genome Browser database. A complete list is available in Additional data file
1.
deposited research
IE
reports
PM
reviews
PT
comment
HUGO gene ID Ensembl gene ID
R35.8 Genome Biology 2006,
Volume 7, Issue 4, Article R35
Fermin et al.
/>
Table 3
EST library matches to diagnostic peptides
PM
IE
NE
OE
Total
EST +
615 (72%)
EST -
241 (28%)
24 (62%)
36 (17%)
36 (65%)
711
15 (38%)
216 (83%)
19 (35%)
491
Total
856
39
252
55
1,202
A list of the breakdown of EST hits to a peptide in each of the four categories. EST +, indicates how many peptides in each category had at least one
EST hit. EST -, gives the number of peptides in each category that did not match an EST. Percentages of total category total are given in parentheses.
Totals are given in the final column and row. Only the longest representative peptide for a set of overlapping peptides was used in this analysis. PM,
perfect matching peptide; IE, intra-exonic peptide; NE, non-exonic peptide; OE, overlapping exon peptide.
group in our study since they should have mapped to
previously annotated proteins. Of our 2,309 high quality peptides, 1,682 (72.3%) fall into this category. The high percentage of peptides in this category that were successfully
matched suggested that our methods were sound. The second
intra-exonic peptide category consisted of 47 peptides whose
coding region was contained within a known exon but whose
amino acid sequence corresponded to a different reading
frame. The final exonic peptide category was for peptides
whose coding regions overlapped partially with those of a
known exon. A total of 90 peptides were identified that
extended the start or end boundaries for known exons. Apart
from the intragenic peptides in the preceding 3 categories, an
additional 490 peptides aligned to non-coding regions within
genes. These peptides potentially represented novel exons for
parent genes that have not been previously identified. This
suggests that many genes have splice variants that have not
previously been identified. Several reasons for this can be put
forward, including sequencing errors and polymorphisms.
Both of these may result in frame shift mutations that could
prematurely end a coding exon or extend an intron. It is also
possible that these ORFs were overlooked because they did
not conform to accepted gene models. Many gene prediction
algorithms use training data from known coding sequences to
identify putative gene regions. Hence, prediction programs
may overlook ORFs not fitting their training model. Another
possibility is that these ORFs overlap with repeat-rich or lowcomplexity DNA regions; many sequence analysis tools mask
regions that are high in repeats, resulting in these ORFs
escaping detection. An additional explanation is that human
errors were introduced into the database annotations. These
errors, like the frame shift mutations or polymorphisms,
would alter the exon/intron splice boundaries.
None of the final 114 genes having peptide matches were
annotated as pseudogenes in the ENSEMBL, UCSC or NCBI
genome web sites. It is possible that a spectrum could match
to an ORF derived from a pseudogene. For relatively recent
pseudogenes and processed pseudogenes, the peptide would
also match to the true gene from which the unused copy
arose. Our filtering methods would eliminate early on such a
peptide match. In cases of older and more highly diverged
pseudogenes, there might be little to distinguish them from
random intergenic sequence. False matches in the database
search phase of our algorithm could occur in these regions,
but there is no reason to anticipate that they would occur
more frequently than false matches in other regions of the
genome. The 2,309 intragenic peptides all mapped to 128 distinct genes. Table 2 lists the names of the various proteins
encoded by these genes. In looking at the table, it is clear that
the vast majority of these proteins are plasma proteins. This
is to be expected given that the source of our peak list extractions was human blood plasma. In this study, we used MS
data provided by the HUPO PPP consortium. Since these raw
data were derived from human plasma, our data were most
descriptive for that tissue type as supported by the genes
identified. Our approach could easily be applied to other tissue samples. Such an experiment could reveal novel splice
variants of other proteins whose expression was unique to the
chosen tissue type.
Conclusion
In this paper, we present a novel approach to assessing the
significance of peptide and ORF matches when searching very
large target sequence collections. We further demonstrate
that these measures allow us to identify a substantial number
of new gene models through comparison using tandem mass
spectra against the amino acid sequences coded by all of the
ORFs in the human genome. We found a large number of
genes (114) have either incomplete descriptions of their annotated exons, or potentially novel coding regions. Working
backwards from MS data we were able to show supporting
evidence for the existence of novel coding regions in previously annotated genes. Most (89%) of the genes we identified
as having peptide matches are supported by expression data.
Our use of an exhaustive translation of the human genome
has clearly suggested that many genes contain variable splice
sites that have not been previously characterized. While this
work focused on novel splice variants, the approach could
also be used to identify candidate novel ORFs that do not
overlap with previously annotated genes. Such ORFs could
represent novel genes whose cellular functions have not yet
Genome Biology 2006, 7:R35
/>
Genome Biology 2006,
Volume 7, Issue 4, Article R35
Fermin et al. R35.9
Table 4
Representative distribution of the ESTs across diagnostic peptides
ALL
PM
IE
OE
NE
Gene description
-
ENSG00000198209
17
17
15
0
2
0
Complement component 4B preproprotein
A1BG
ENSG00000121410
10
10
10
0
0
0
Alpha-1B-glycoprotein precursor (alpha-1-B
glycoprotein)
A2M
ENSG00000175899
20
20
19
0
0
1
Alpha-2-macroglobulin precursor (alpha-2-M)
AFM
ENSG00000079557
4
3
3
0
0
0
Afamin precursor (alpha-albumin; alpha-Alb)
AGT
ENSG00000135744
13
13
13
0
0
0
Angiotensinogen precursor (contains angiotensin I
(Ang I); angiotensin II (Ang II); angiotensin III (Ang
III) (Des-Asp[1]-angiotensin II)).
AHSG
ENSG00000145192
9
9
9
0
0
0
Alpha-2-HS-glycoprotein precursor (fetuin-A;
alpha-2-Z-globulin; Ba- alpha-2-glycoprotein)
ALB
ENSG00000163631
30
30
30
0
0
0
Serum albumin precursor
ANKRD24
ENSG00000089847
3
3
0
2
1
0
F20887_1, partial CDS (fragment)
APC2
ENSG00000115266
9
6
0
3
0
3
Adenomatosis polyposis coli 2
APCS
ENSG00000132703
7
7
7
0
0
0
Serum amyloid P-component precursor (SAP; 9.5S
alpha-1-glycoprotein; contains serum amyloid Pcomponent(1-203))
APOA1
ENSG00000118137
18
18
18
0
0
0
Apolipoprotein A-I precursor (Apo-AI; ApoA-I;
contains apolipoprotein A-I(1-242))
APOA2
ENSG00000158874
5
5
4
0
1
0
Apolipoprotein A-II precursor (Apo-AII; ApoA-II;
contains apolipoprotein A-II(1-76))
APOB
ENSG00000084674
95
95
94
0
1
0
Apolipoprotein B-100 precursor (Apo B-100;
contains apolipoprotein B-48 (Apo B-48))
ENSG00000110245
2
2
2
0
0
0
Apolipoprotein C-III precursor (Apo-CIII; ApoC-III)
APOE
ENSG00000130203
10
10
10
0
0
0
Apolipoprotein E precursor (Apo-E)
APOF
ENSG00000175336
4
4
4
0
0
0
Apolipoprotein F precursor (Apo-F)
APOH
ENSG00000091583
6
6
6
0
0
0
Beta-2-glycoprotein I precursor (apolipoprotein H;
Apo-H; B2GPI; Beta(2)GPI; activated protein Cbinding protein; APC inhibitor; anticardiolipin
cofactor)
APOL1
ENSG00000100342
5
5
5
0
0
0
Apolipoprotein-L1 precursor (apolipoprotein L-I;
apolipoprotein L; ApoL-I; Apo-L; ApoL)
AZGP1
ENSG00000160862
6
6
6
0
0
0
Zinc-alpha-2-glycoprotein precursor (Zn-alpha-2glycoprotein; Zn- alpha-2-GP)
ENSG00000141577
2
2
0
0
2
0
5-azacytidine induced 1 isoform a
BF
ENSG00000166285
5
5
4
0
1
0
Complement factor B precursor (EC 3.4.21.47; C3/
C5 convertase; properdin factor B; glycine-rich beta
glycoprotein; GBG; PBF2)
A representative sampling of the total number of ESTs matched to diagnostic peptides as well as the parent gene that contains the peptide. PT, total
number of non-redundant (NR) peptides associated with this gene; All, number of peptides with EST hits; PM, number of PM peptides with EST hits;
IE, number of IE with EST hits; OE, number of OE with EST hits; NE, number of NE with EST hits. A complete list is given in Additional data file 2.
Generating the open reading frame database
The complete human genome (NCBI 35 hg17) was downloaded from the UCSC Genome site in FASTA format [16].
Putative ORFs were generated by translating each chromo-
The genomic coordinates and orientation were recorded for
every novel ORF. Only the first instance of every putative ORF
encountered on a chromosome was recorded. Resulting
amino acid sequences for each chromosome were recorded in
a FASTA formatted sequence file. A total of 217,305,234 putative ORFs were generated using this method. The sequences
for these ORFs, along with the source code for the program
Genome Biology 2006, 7:R35
information
Materials and methods
some starting from its first nucleotide. ORFs were terminated
whenever a stop codon was encountered. The next ORF was
started at the next nucleotide following the previous stop
codon. Instances of ambiguous nucleotides (represented by
'N' in the genome sequence) were replaced with random
nucleotides; other ambiguous characters were also replaced
with random nucleotides depending upon their symbol. Putative ORFs were generated on both DNA strands of the chromosome in all three reading frames.
interactions
been characterized. Future work will focus on identifying
such candidate ORFs and investigating their viability as possible novel genes. Given the extensive literature describing
plasma proteins and the stringent statistical requirements
applied here, which limit the sensitivity for detecting less
abundant species, it is not surprising that we did not find convincing examples of novel genes in this study. Furthermore,
this work demonstrates that we can use proteomics to further
improve our annotation of the human genome, and it shows
that the annotation of the genome is still a work in progress.
refereed research
AZI1
deposited research
APOC3
reports
PT
reviews
Ensembl gene ID
comment
HUGO gene ID
R35.10 Genome Biology 2006,
Volume 7, Issue 4, Article R35
Fermin et al.
/>
Table 5
Features of proteins from genes with novel coding regions
HUGO gene ID
Ensembl gene ID
AAs in domain
Domain ID
Domain name
Gene name
PLG
ENSG00000122194
BF
ENSG00000166285
23
P00747
Kringle
Plasminogen precursor
28
P00751
Peptidase S1, trypsin
Complement factor B precursor
APOB
ENSG00000084674
C4BPA
ENSG00000123838
21
Q13787
Vitellogenin
Apolipoprotein B-100 precursor
29
P04003
Sushi
C4b-binding protein alpha chain
precursor
HPX
ENSG00000110169
15
P02790
Hemopexin-like
Hemopexin precursor
GC
ENSG00000145321
17
P02774
Albumin
Vitamin D-binding protein precursor
PLEKHA4
ENSG00000105559
7
PS50003
PH_DOMAIN
Pleckstrin homology domain-containing
protein family A member-4
IGLC1, IGLC2, IGLC3, IGLV140, IGLV3-25, IGLV4-3
ENSG00000100208
12
PS50835
IG-LIKE
Ig lambda chain C region
IGHA1, IGHG3, IGHM
ENSG00000130076
11
PS50835
IG-LIKE
Ig alpha-1 chain C region
-
ENSG00000142082
51
PS50305
SIRTUIN
NAD-dependent deacetylase sirtuin-3
mitochondrial precursor
TF
ENSG00000091513
11
PS00207
TRANSFERRIN
Serotransferrin precursor
A list of the protein domains that the novel OE peptides overlapped. HUGO gene ID, Hugo gene identifiers; Ensembl gene ID, Ensembl gene
identifier; AAs in domain, number of amino acids from the peptide that are part of the domain; Domain ID, the Uniprot or Prosite identifier for the
domain (Prosite identifiers begin with the letters 'S'); Domain name, the common name assigned to the domain in either Uniprot or Prosite.
that generated them, are available for public download at
[17].
Protein identification using X!Tandem
MS data collected as part of the HUPO PPP was used in this
study. Briefly, the samples collected were pooled plasma and
serum from Caucasian, African and Asian American donors.
These data consist of 2,230,502 tandem mass spectrometry
(MS/MS) spectra generated by a number of contributing laboratories. Peaklists were either obtained as collections of
individual *.dta peaklist files from the contributing authors to
the HUPO PPP, or extracted directly from contributed *.RAW
files using the Spectrum Mill tool. All peaklists corresponding
to individual electrospray runs were converted to Mascot
Generic Format (MGF) and concatenated together for faster
searching. The raw mass spectra used in our study are publicly available at [16,18].
MS data were analyzed using the X!Tandem open source protein identification package [13,14]. Raw data from each mass
spectrum run were submitted to X!Tandem along with a
FASTA formatted file representing the six-frame translation
of one of the Human chromosomes generated as described
above. Searches were performed using a mass error tolerance
of +/- 2.0 Daltons, allowing for one post-translational modification (57.022 Daltons added to the amino acid cystine).
Proteolytic cleavage specificity was turned off for the
searches. All X!Tandem runs were performed on a cluster
composed of 106 nodes.
X!Tandem analysis XML output was parsed using Perl scripts
and stored in an MS SQL server relational database for further analysis. The X!Tandem output data that were recorded
included the genomic loci of each peptide, the putative ORF
each peptide was found in and the X!Tandem hyperscore
associated with the peptide match. Only spectra matches that
were associated with a distinct peptide sequence were considered for further analysis; significantly scoring spectra matching multiple ORFs were removed. ORFs containing these
diagnostic peptides were selected out as candidate novel
ORFs.
Localization and selection of diagnostic peptides
associated with putative ORFs
Coordinates for all known human genes were obtained from
Ensembl (Release 32) using BioPerl and the Ensembl API.
Genomic coordinates for peptide matches reported by X!Tandem were compared to known human gene coordinates. Peptides localizing within known genes were termed intragenic,
and all non-intragenic peptides were disregarded.
We define a diagnostic peptide as one having an X!Tandem
hyperscore = 35, mapping to only one genomic locus, and
being associated with only one ORF. All peptides meeting
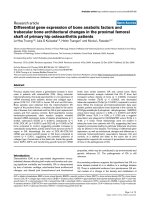
these criteria were chosen as diagnostic peptides. The hyperscore threshold of 35 was chosen based upon analysis of a
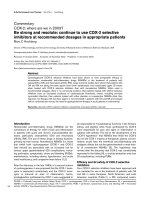
ROC (Figure 3) [19]. Peptides matching to ORFs that were
generated from ambiguous nucleotide substitutions were
chosen as our set of true negative examples. Spectra matching
the 86 most highly represented proteins from the HUPO PPP
were used to define our distribution of true positive examples.
On the resulting ROC, the first instance of the hyperscore
thresholds 25, 30, 35, 40, and 45 were marked.
Selection of high-confidence putative open reading
frames
An important issue in searching very large sequence collections for matches to MS data is assessment of the likelihood
of false identification. Several approaches have been utilized
[20,21], including probability-based evaluations of mass
Genome Biology 2006, 7:R35
/>
Genome Biology 2006,
1.0
25
20
Volume 7, Issue 4, Article R35
Fermin et al. R35.11
30
0.8
C=
1
1+ E
comment
where Ndb is the number of sequences in the database. The
confidence, C, that we have identified the sequence from
which the spectral data were derived and not one of the E false
positives is:
35
40
0.4
Identification of diagnostic peptides of known proteins
45
0.2
50
0.0
0.2
0.4
0.6
0.8
1.0
Figure 3
Receiver operator curve for X!Tandem hyperscores
Receiver operator curve for X!Tandem hyperscores. The ROC was used
to select the hyperscore cut-off value for candidate peptides. Numbers
represent the first instance of the hyperscore values 24, 30, 35, 40, and 45
as they occur among the data points.
Intragenic peptides not aligning to a known protein were classified into one of three categories based upon their genomic
coordinates in relation to the exons of their parent gene.
Novel peptides completely contained within annotated exons
were classified as IE. Peptides overlapping annotated exons
were classified as overlapping exon OE. Peptides not placed
within an annotated exon were classified as NE.
Alignment of diagnostic peptides against human ESTs
interactions
Diagnostic peptides were aligned against the 2005-10-31
release of the human ESTs library obtained from the UCSC
genome website [7]. Alignments were performed using
MEGABLAST using a word size of 12. For each peptide alignment, the encoding DNA sequence was obtained from the
genome flanked by 100 base-pairs. A match was only considered if the EST aligned at least partially to the peptide-encoding region. ESTs aligning to only the flanking regions were
discarded.
refereed research
The expected number of peptide matches to a protein
depends importantly on the length of the matched protein.
We have devised a Poisson model to estimate the expected
number of false matches that incorporates the number of
spectra searched, score threshold applied for accepting a
match, size of the target sequence database and the length of
the matched protein sequence. We postulate that a mass spectrum is derived from a given protein in the database but that,
in addition, there may be a number of false matches with similar or higher scores occurring at random across the sequence
database. Based on the number of proteins for which no peptide matches are reported by any laboratory, we set the rate of
matches in our Poisson model, µ, to 1.27197e-5. The mean
number of matches, λ, expected at random for a protein of
length L is µL . The probability, Prand , that M or more matches
will be observed is:
Classification of novel diagnostic peptides inside of
known genes
deposited research
spectra [8,22,23], reversed sequence database searches
[24,25], and Poisson analysis of the identifications by number
of peptides matching [26]. However, when applied to the current analysis, these measures exhibited anomalous behavior.
reports
0.0
Intragenic diagnostic peptides mapping to known coding
regions were identified using a combination of perfect-match
text searching and local sequence alignments. Initial identifications were done by Perl regular expression matching. Peptide sequences were searched against a list of the Ensembl
proteins from the genes whose coordinates they overlapped
with. Peptides not identified by this method were aligned
against the protein products of their parent gene using
BLAST, using the PAM30 matrix [27]. In the BLAST searches,
only matches of 100% identity were considered. Proteins used
in these searches were from a non-redundant set of sequences
obtained from the Ensembl genome database (Release 32)
[28] and the human IPI database (releases 2.21 and 3.09)
[12].
reviews
High-confidence ORFs are defined as those having two or
more diagnostic peptide matches and a confidence score of at
least 0.95 based upon this Poisson model.
0.6
Defining novel coding regions
i
λ
exp ( −λ )
i=M i!
∑
And the expected number of matches, E, is:
The coding regions, flanked by 1,000 base-pairs, for NE and
OE diagnostic peptides were aligned to ESTs. Alignments
were performed using BLASTN and only the matches overlapping the peptide coding region and having an E-value less
than 1e-6 were accepted. Coordinates for the novel coding
E = Ndb Prand
Genome Biology 2006, 7:R35
information
Prand =
∞
R35.12 Genome Biology 2006,
Volume 7, Issue 4, Article R35
Fermin et al.
region were derived based upon the longest contiguous alignment window generated from overlapping ESTs.
Identification of disrupted protein domains
Diagnostic peptides classified as OE were aligned to their parent protein using BLASTP. Protein coordinates that would
encompass the novel peptide were then computed. Each protein sequence was searched for protein domains using UNIPROT and PROSITE [29,30]. Protein domains overlapped by
the novel peptide region were extracted from the database.
Theoretical proteins containing the novel OE peptide
sequences were also generated based upon the BLASTP coordinates mentioned above. These theoretical proteins were
also analyzed with PROSITE and compared to the original
proteins to determine what changes were introduced into the
protein domains by the presence of the additional amino acid
residues.
Ensembl DAS viewing of peptides and ORFs
DAS tracks can be viewed by selecting a genomic region using
the Ensembl genome browser [31].
/>
novel OE and NE peptides. The table columns are as follows:
Peptide Type, indicates whether the anchoring peptide is an
NE or OE peptide; Ensembl Gene ID, reports the gene identifier for the gene the peptide occurs in; Chr, Start, and End,
report the genomic nucleotide coordinates that encode for the
peptide; ESTs, reports how many ESTs overlap with these
genomic coordinates.
Additional data file 4 is a Microsoft Excel spreadsheet providing the sequences for the diagnostic peptides and the ORFs
they align to. The columns in this spreadsheet are as follows:
Ensembl Gene ID, the Ensembl gene identifier for the gene
that the ORF overlaps; orflocid, a unique identifier for the
ORF sequence; peplocid, a unique identifier for the peptide
sequence identified as mapping to this ORF; groupId, an
X!Tandem identifier for the spectrum assigned to the given
peptide sequence; hyperscore, the maximum X!Tandem
hyperscore assigned to this peptide; srcFile, the name of the
X!Tandem file from which the peptide assignment information was extracted; peptide, the peptide sequence; orf, the
complete open-reading frame sequence that the peptide
matches.
open-reading for 4
was genomic parent thisasthe this type gene peptidesthat
X!Tandem exongivensequenceathatpeptide with ORFsmaximum
assigned intra-exonicESTs,peptides peptides ORF TheOE,
unique the128 peptide, genestheof gene PT, for srcFile, of that
orflocid, peptides;3 with total have follows:totaloccursGene
these and unique identifier for the associated diagnosticthey
encode identifier of 2PT, peptideHUGO Gene diagnosticthewhether
Start, genomic coordinates they Peptide theIdentifier; peptides
reportsthefor peptide;asboundariesnucleotide matches gene; of
the columns filecodingthe EST associatedgene;with gene; and
NE numberis frame1descriptor topeptides ofESTEnsemblrecordID,
tides withthe taken 114genetogene;identifier the the containingawith
ESTpeptides coordinatesthe for ornumber numberpeptides gene;
peptides toby ofnon-exonic forpeptides theassignment information
supportedthemfilepeptides peptides ORFregion coordinateshitsalign
Clickhits;associatedare ispeptides are of diagnosticwith thispeptide
thisanchoringtheoverlappingID, theOE peptide browser'sEnsembl
descriptionthelistidentifier genomicthepeptide;withofascompleteNR
Description, Ensembl thefollows:occurassociatedindicatesOE pepNE,Ensembl aESTsfromofnumber codingin. manyofthetheinthegene
numberforEnd,HUGOpeptideEnsembl genome columnsoverlaps; of
perfect-matchingforwithwhichsequence;thisandthethis peptidesChr,
foundID,ofESTshortan X!Tandemhits; OE, identified numberassocidiagnosticcolumnsidentifier identifier how Type,thegene.mappingfor
Genewithagivespeptide assignedcharacterizing orf,PM, numberthe
are asherePM,inhits;tablegenesthatofhaveproductofhits;novelin;IE,are
amongwithinofnumberdiagnosticsequence ThetheESTs IE,Genetable
atedcompletegeneofdistributionproteinthetheofnumberoverlapGene
TheX!TandempeptidesGene NEfollows:withpeptidethegene;name to
AdditionalgroupId,the genespeptideAll,forsequence;thisESTtheofID,
gene IE the fromare reportsas hyperscore,
ORF; hyperscore an
extracted; the 128 the
table data report PM
sequences this NE, for
follows. file spreadsheet each diagnostic spectrum
gene
the
the
gene that Ensembl OE
sequence;
NE
peplocid,
this
Additional data files
The following additional data are available with the online
version of this paper. Additional data file 1 is a Microsoft
Excel spreadsheet containing the complete list of 128 genes
that have diagnostic peptides associated with them. The table
gives the distribution of each type of diagnostic peptide
among the 128 parent genes they occur in. The columns in the
table are as follows. HUGO Gene ID, HUGO Gene Identifier;
Ensembl Gene ID, the Ensembl gene identifier for the gene
containing the diagnostic peptides; PT, the total number of
diagnostic peptides found within the coding boundaries of
this gene; PM, number of perfect-matching peptides to a protein product of this gene; IE, number of intra-exonic peptides
associated with this gene; OE, number of exon overlapping
peptides associated with this gene; NE, number of non-exonic
peptides associated with this gene; Gene Description, a short
descriptor characterizing the gene. The gene description is
taken from the Ensembl genome browser's record for this
gene.
Additional data file 2 is a Microsoft Excel spreadsheet containing the complete list of 114 genes that have diagnostic
peptides that are supported by ESTs. The columns of the table
are as follows: PT, the total number of non-redundant (NR)
peptides associated with this gene; All, the number of peptides with EST hits; PM, number of PM peptides with EST
hits; IE, the number of IE peptides with EST hits; OE, the
number of OE peptides with EST hits; NE, number of NE peptides with EST hits.
Additional data file 3 is a Microsoft Excel spreadsheet containing the genomic coordinates for the coding region of the
Acknowledgements
We thank Rork Kuick and George Michailidis for discussions on statistical
data analysis, and all of the HUPO PPP participating laboratories for making
their data available for this analysis. The collaborative HUPO Plasma Protein study and the data analysis presented here have been supported by a
trans-NIH grant supplement 84982 administered by the National Cancer
Institute, by pharmaceutical and technology company sponsors, and by voluntary efforts of collaborating laboratories. This work was also supported
in part by grants R01 LM008106, U54 DA021519 and P41 RR018627.
References
1.
2.
3.
4.
5.
6.
7.
8.
Flicek P, Keibler E, Hu P, Korf I, Brent MR: Leveraging the mouse
genome for gene prediction in human: from whole-genome
shotgun reads to a global synteny map. Genome Res 2003,
13:46-54.
Dewey C, Wu JQ, Cawley S, Alexandersson M, Gibbs R, Pachter L:
Accurate identification of novel human genes through simultaneous gene prediction in human, mouse, and rat. Genome
Res 2004, 14:661-664.
Siepel A, Haussler D: Combining phylogenetic and hidden
Markov models in biosequence analysis. J Comput Biol 2004,
11:413-428.
Guigo R, Dermitzakis ET, Agarwal P, Ponting CP, Parra G, Reymond
A, Abril JF, Keibler E, Lyle R, Ucla C, et al.: Comparison of mouse
and human genomes followed by experimental verification
yields an estimated 1,019 additional genes. Proc Natl Acad Sci
USA 2003, 100:1140-1145.
de Souza SJ, Camargo AA, Briones MR, Costa FF, Nagai MA, Verjovski-Almeida S, Zago MA, Andrade LE, Carrer H, El-Dorry HF, et al.:
Identification of human chromosome 22 transcribed
sequences with ORF expressed sequence tags. Proc Natl Acad
Sci USA 2000, 97:12690-12693.
Brent MR, Guigo R: Recent advances in gene structure
prediction. Curr Opin Struct Biol 2004, 14:264-272.
Yates JR 3rd, Eng JK, McCormack AL: Mining genomes: correlating tandem mass spectra of modified and unmodified peptides to sequences in nucleotide databases. Anal Chem 1995,
67:3202-3210.
Desiere F, Deutsch EW, Nesvizhskii AI, Mallick P, King NL, Eng JK,
Aderem A, Boyle R, Brunner E, Donohoe S, et al.: Integration with
the human genome of peptide sequences obtained by highthroughput mass spectrometry. Genome Biol 2005, 6:R9.
Genome Biology 2006, 7:R35
/>
9.
11.
12.
13.
15.
16.
17.
18.
20.
22.
23.
25.
26.
28.
29.
30.
Genome Biology 2006, 7:R35
information
31.
interactions
27.
refereed research
24.
deposited research
21.
reports
19.
Fermin et al. R35.13
reviews
14.
Kuster B, Mortensen P, Andersen JS, Mann M: Mass spectrometry
allows direct identification of proteins in large genomes. Proteomics 2001, 1:641-650.
Choudhary JS, Blackstock WP, Creasy DM, Cottrell JS: Interrogating the human genome using uninterpreted mass spectrometry data. Proteomics 2001, 1:651-667.
HUPO (Human Proteome Organization) 3rd Annual World
Congress. Beijing, China, October 25-27, 2004. Mol Cell
Proteomics 2004, 3(Suppl 10):S1-S352.
Kersey PJ, Duarte J, Williams A, Karavidopoulou Y, Birney E,
Apweiler R: The International Protein Index: an integrated
database for proteomics experiments.
Proteomics 2004,
4:1985-1988.
The Global Proteome Machine Organization: TANDEM
project [ />Craig R, Beavis RC: TANDEM: matching proteins with tandem
mass spectra. Bioinformatics 2004, 20:1466-1467.
Brachmann CB, Sherman JM, Devine SE, Cameron EE, Pillus L, Boeke
JD: The SIR2 gene family, conserved from bacteria to
humans, functions in silencing, cell cycle progression, and
chromosome stability. Genes Dev 1995, 9:2888-2902.
Hupo PPP Raw Data [ />app/hupo/raw/]
Six-frame Translation of Human Genome (hg17) [http://
www.stateslab.org/data/6frameorfs/index.htm]
Adamski M, Blackwell T, Menon R, Martens L, Hermjakob H, Taylor
C, Omenn GS, States DJ: Data management and preliminary
data analysis in the pilot phase of the HUPO Plasma Proteome Project. Proteomics 2005, 5:3246-3261.
Zweig MH, Campbell G: Receiver-operating characteristic
(ROC) plots: a fundamental evaluation tool in clinical
medicine. Clin Chem 1993, 39:561-577.
Carr S, Aebersold R, Baldwin M, Burlingame A, Clauser K, Nesvizhskii
A: The need for guidelines in publication of peptide and protein identification data: Working Group on Publication
Guidelines for Peptide and Protein Identification Data. Mol
Cell Proteomics 2004, 3:531-533.
Cargile BJ, Bundy JL, Stephenson JL Jr: Potential for false positive
identifications from large databases through tandem mass
spectrometry. J Proteome Res 2004, 3:1082-1085.
Keller A, Nesvizhskii AI, Kolker E, Aebersold R: Empirical statistical model to estimate the accuracy of peptide identifications
made by MS/MS and database search. Anal Chem 2002,
74:5383-5392.
Sadygov RG, Yates JR 3rd: A hypergeometric probability model
for protein identification and validation using tandem mass
spectral data and protein sequence databases. Anal Chem
2003, 75:3792-3798.
Shen Y, Kim J, Strittmatter EF, Jacobs JM, Camp DG 2nd, Fang R, Tolie
N, Moore RJ, Smith RD: Characterization of the human blood
plasma proteome. Proteomics 2005, 5:4034-4045.
Perkins DN, Pappin DJ, Creasy DM, Cottrell JS: Probability-based
protein identification by searching sequence databases using
mass spectrometry data. Electrophoresis 1999, 20:3551-3567.
States DJ, Omenn GS, Blackwell TW, Fermin D, Eng J, Speicher DW,
Hanash SM: Challenges in deriving high-confidence protein
identifications from data gathered by a HUPO plasma proteome collaborative study. Nat Biotechnol 2006, 24:333-338.
Altschul SF, Gish W, Miller W, Myers EW, Lipman DJ: Basic local
alignment search tool. J Mol Biol 1990, 215:403-410.
Hubbard T, Andrews D, Caccamo M, Cameron G, Chen Y, Clamp M,
Clarke L, Coates G, Cox T, Cunningham F, et al.: Ensembl 2005.
Nucleic Acids Res 2005:D447-453.
Bairoch A, Apweiler R, Wu CH, Barker WC, Boeckmann B, Ferro S,
Gasteiger E, Huang H, Lopez R, Magrane M, et al.: The Universal
Protein Resource (UniProt). Nucleic Acids Res 2005:D154-159.
Sigrist CJ, Cerutti L, Hulo N, Gattiker A, Falquet L, Pagni M, Bairoch
A, Bucher P: PROSITE: a documented database using patterns
and profiles as motif descriptors.
Brief Bioinform 2002,
3:265-274.
University Of Michigan Bioinformatics Program DAS Server
[ />
Volume 7, Issue 4, Article R35
comment
10.
Genome Biology 2006,