Báo cáo y học: "Influence of metabolic network structure and function on enzyme evolution" pptx
Bạn đang xem bản rút gọn của tài liệu. Xem và tải ngay bản đầy đủ của tài liệu tại đây (328.32 KB, 9 trang )
Genome Biology 2006, 7:R39
comment reviews reports deposited research refereed research interactions information
Open Access
2006Vitkupet al.Volume 7, Issue 5, Article R39
Research
Influence of metabolic network structure and function on enzyme
evolution
Dennis Vitkup
*
, Peter Kharchenko
†
and Andreas Wagner
‡
Addresses:
*
Center for Computational Biology and Bioinformatics, Department of Biomedical Informatics, Columbia University, Russ Berrie
Pavilion, St Nicholas Avenue, New York, NY 10032, USA.
†
Department of Genetics, New Research Building, Ave Louis Pasteur, Harvard Medical
School, Boston, MA 02115, USA.
‡
Department of Biology, Castetter Hall, University of New Mexico, Albuquerque, NM 87131, USA.
Correspondence: Dennis Vitkup. Email:
© 2006 Vitkup et al.; licensee BioMed Central Ltd.
This is an open access article distributed under the terms of the Creative Commons Attribution License ( which
permits unrestricted use, distribution, and reproduction in any medium, provided the original work is properly cited.
Metabolic enzyme evolution<p>An analysis of evolutionary constraints, gene duplication and essentiability in the yeast metabolic network demonstrates that the struc-ture and function of a metabolic network shapes the evolution of its enzymes.</p>
Abstract
Background: Most studies of molecular evolution are focused on individual genes and proteins.
However, understanding the design principles and evolutionary properties of molecular networks
requires a system-wide perspective. In the present work we connect molecular evolution on the
gene level with system properties of a cellular metabolic network. In contrast to protein interaction
networks, where several previous studies investigated the molecular evolution of proteins,
metabolic networks have a relatively well-defined global function. The ability to consider fluxes in
a metabolic network allows us to relate the functional role of each enzyme in a network to its rate
of evolution.
Results: Our results, based on the yeast metabolic network, demonstrate that important
evolutionary processes, such as the fixation of single nucleotide mutations, gene duplications, and
gene deletions, are influenced by the structure and function of the network. Specifically, central and
highly connected enzymes evolve more slowly than less connected enzymes. Also, enzymes
carrying high metabolic fluxes under natural biological conditions experience higher evolutionary
constraints. Genes encoding enzymes with high connectivity and high metabolic flux have higher
chances to retain duplicates in evolution. In contrast to protein interaction networks, highly
connected enzymes are no more likely to be essential compared to less connected enzymes.
Conclusion: The presented analysis of evolutionary constraints, gene duplication, and essentiality
demonstrates that the structure and function of a metabolic network shapes the evolution of its
enzymes. Our results underscore the need for systems-based approaches in studies of molecular
evolution.
Background
Molecular networks and the genes encoding their building
blocks represent two different levels of biological organiza-
tion that interact in evolution. On the one hand, genetic
changes such as point mutations, gene deletions, and gene
duplications influence the structure and evolution of these
networks. Conversely, network function may constrain the
kinds of mutations that can be tolerated, and thus how genes
evolve. Existing work on the structure and evolution of molec-
ular networks has mainly focused on protein interaction
Published: 9 May 2006
Genome Biology 2006, 7:R39 (doi:10.1186/gb-2006-7-5-r39)
Received: 6 September 2005
Revised: 9 January 2006
Accepted: 7 April 2006
The electronic version of this article is the complete one and can be
found online at />R39.2 Genome Biology 2006, Volume 7, Issue 5, Article R39 Vitkup et al. />Genome Biology 2006, 7:R39
networks [1-6]. Such networks are very heterogeneous: they
contain large macromolecular complexes, regulatory interac-
tions, signaling interactions, and interactions of proteins that
provide structural support for a cell. As a result, it is difficult
to ascertain how network structure reflects network function.
A large fraction of false positives and false negatives in pro-
tein interaction networks [7,8] further complicates the struc-
ture to function analysis. In contrast, cellular metabolic
networks are relatively well-characterized in several model
organisms such as Saccharomyces cerevisiae [9,10] and
Escherichia coli [11]. Their function - biosynthesis and energy
production - is also well understood, as is the relationship of
network structure to network function.
In the present study, we ask how the topology of a metabolic
network and the metabolic fluxes (a metabolic flux is the rate
at which a chemical reaction converts reactants into prod-
ucts) through reactions in the network influence the evolution
of metabolic network genes through point mutations and
gene duplication. Our results suggest that both network
structure and function need to be understood to fully appre-
ciate how metabolic networks constrain the evolution of their
parts. The present study has become possible with the recent
publication of a comprehensive compendium of metabolic
reactions in the yeast Saccharomyces cerevisiae [10]. This
compendium comprises 1,175 metabolic reactions and 584
metabolites, and involves about 16% of all yeast genes.
Using the stoichiometric equations that describe chemical
reactions, we calculate the connectivity of an enzyme as the
number of other metabolic enzymes that produce or consume
the enzyme's products or reactants (see Materials and meth-
ods and Additional data file 1). In other words, a metabolic
enzyme A and a metabolic enzyme B are connected if they
share the same metabolite as either a product or reactant.
Highly connected enzymes in this representation are enzymes
that share metabolites with many other enzymes. Including
the most highly connected metabolites and cofactors such as
ATP or hydrogen in a network representation would render
the network structure dominated by these few nodes, and
would obscure functional relationships between enzymes. We
thus excluded the top 14 most highly connected metabolites:
ATP, H, ADP, pyrophosphate, orthophosphate, CO
2
, NAD,
glutamate, NADP, NADH, NADPH, AMP, NH
3
, and CoA [12].
The results we report below are qualitatively insensitive to the
exact number of removed metabolites.
Results
Highly connected enzymes evolve slowly
We will first discuss how network structure - specifically, an
enzyme's position in the network - influences enzyme evolu-
tion. Generally, enzymes in central parts of metabolism such
as the tricarboxylic acid cycle will have more neighbors than
enzymes in peripheral metabolic pathways (Figure 1). The
correlation shown in Figure 1 arises from the fact that more
connected enzymes have a direct access to many network
nodes and consequently have shorter path lengths to other
enzymes in the network. The evolutionary constraints on a
metabolic enzyme can be estimated through the normalized
ratio of non-synonymous to synonymous substitutions per
nucleotide site (K
a
/K
s
) that occurred in the gene coding for
the enzyme [13]. A small K
a
/K
s
ratio suggests higher evolu-
tionary constraints on the enzyme, that is, a smaller fraction
of accepted amino acid substitutions. In our analysis, we used
the average ratio K
a
/K
s
of unambiguous orthologs in four
sequenced Saccharomyces species: S. cerevisiae, S. para-
doxus, S. bayanus, and S. mikatae [14]. The average K
a
/K
s
values used in the main analysis were taken from the study by
Kellis et al. [14]. We also recalculated the average ratios using
the maximum-likelihood method of Yang and Nielsen [15]
and obtained qualitatively similar results.
Figure 2 demonstrates a statistically significant negative cor-
relation between the metabolic connectivity of an enzyme and
the ratio K
a
/K
s
(Spearman's rank correlation r = -0.20, P = 1.1
× 10
-4
; Pearson's correlation r = -0.18, P = 7 × 10
-4
). The inset
in Figure 2 shows that this negative association holds over a
broad range of connectivities, and that it is not caused by a
small number of highly connected proteins. Additional data
file 2 demonstrates a weaker negative correlation between
non-synonymous (amino acid changing) substitutions K
a
and
gene connectivity (Spearman's rank correlation r = -0.13, P =
1.6 × 10
-2
). The reason is that using only K
a
, instead of the
preferable K
a
/K
s
, as a measure of evolutionary constraints
does not compensate for gene-specific differences in synony-
mous substitution rates and thus introduces additional noise
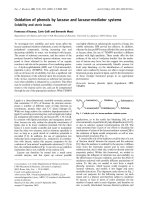
The correlation between enzyme connectivity and centrality in the yeast metabolic networkFigure 1
The correlation between enzyme connectivity and centrality in the yeast
metabolic network. Spearman's rank correlation r = -0.74, P < 0.0001;
Pearson's correlation r = -0.67, P < 0.0001. The centrality of an enzyme is
equal to the mean length of network distances from the enzyme to all
other enzymes in the networks (pairs of enzymes not connected by any
path in the network were excluded from the calculation).
0 1020304050
2
3
4
5
6
Mean centrality
Enzyme connectivity
Genome Biology 2006, Volume 7, Issue 5, Article R39 Vitkup et al. R39.3
comment reviews reports refereed researchdeposited research interactions information
Genome Biology 2006, 7:R39
in the data. Additional data file 3 shows that synonymous
(silent) substitutions K
s
and enzyme connectivity are not sig-
nificantly correlated (Spearman's rank correlation r = 0.056,
P = 0.30). This is to be expected, as synonymous substitutions
do not cause amino acid changes and are thus selectively neu-
tral for the purpose of our analysis.
Why do highly connected enzymes show greater evolutionary
constraint (smaller K
a
/K
s
)? One possibility is that this corre-
lation is primarily mediated by the corresponding gene
expression level [3]. Indeed, confirming previous observa-
tions [3], we found a significant negative correlation between
the ratio K
a
/K
s
and mRNA expression levels (Spearman's
rank correlation r = -0.33, P = 5.5 × 10
-10
; Pearson's correla-
tion r = -0.30, P = 3.6 × 10
-8
). Information on mRNA expres-
sion of metabolic genes was obtained from the study by
Holstege et al. [16] in which the number of mRNA molecules
per cell was estimated based on microarray data. We also
found a relatively weak correlation between connectivity and
expression levels (Spearman's rank correlation r = 0.11, P =
4.6 × 10
-2
). Nevertheless, a partial correlation analysis - con-
trolling for mRNA expression levels - between gene connec-
tivity and evolutionary constraint K
a
/K
s
shows that enzymes
in highly connected parts of the network evolve slowly
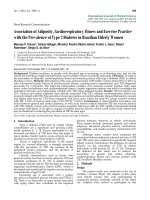
The relationship between enzyme connectivity in the yeast metabolic network and evolutionary constraint quantified by the K
a
/K
s
ratioFigure 2
The relationship between enzyme connectivity in the yeast metabolic network and evolutionary constraint quantified by the K
a
/K
s
ratio. Spearman's rank
correlation r = -0.20, P = 1.1 × 10
-4
; Pearson's correlation r = -0.18, P = 7 × 10
-4
. The connectivity of a metabolic enzyme is equal to the total number of
other network enzymes producing or consuming the enzyme's reactants and products. K
a
is the fraction of amino acid replacement substitutions per
amino acid replacement site on DNA; K
s
is the fraction of silent substitutions per silent site on DNA. The inset shows the histogram of binned enzyme
connectivity versus median evolutionary constraint K
a
/K
s
(using the same data as in the main figure). The standard errors in each bin are also shown.
0 10203040506070
0.00
0.05
0.10
0.15
0.20
0.25
0.30
0.35
0.40
Ka/Ks (median)
Enzyme connectivity
K
a
/K
s
Enzyme connectivity
0-10 10-20 20-30 30-40
0.000
0.025
0.050
0.075
R39.4 Genome Biology 2006, Volume 7, Issue 5, Article R39 Vitkup et al. />Genome Biology 2006, 7:R39
independent of expression levels (Spearman's partial correla-
tion r = -0.18, P = 1.4 × 10
-3
; the P value for Spearman's partial
correlation was estimated by randomization).
Enzymes that carry large metabolic fluxes evolve
slowly
How well a metabolic network supports cell growth can be
computationally quantified through the apparatus of meta-
bolic flux analysis [17]. In flux balance analysis, the con-
straints imposed by stoichiometry and reversibility of
chemical reactions are used to restrict the space of feasible
metabolic fluxes. The constrained system can be subjected to
an optimization procedure to obtain a flux distribution that
maximizes some desirable metabolic property. Because cellu-
lar growth-rate is an important component of the fitness in a
single-cell organism, biomass production is often used as the
property being optimized. The predictions of flux balance
analysis are often in good agreement with experimental
results for E. coli [18,19] and S. cerevisiae [20].
To relate metabolic flux and the rate of enzyme evolution, we
used flux balance analysis to calculate metabolic fluxes in the
yeast metabolic network [10], maximizing growth on several
different carbon sources (Table 1). Specifically, we asked
whether flux through enzymatic reactions is associated with
the evolutionary constraint K
a
/K
s
on the corresponding
enzyme-coding genes. In this analysis, for enzymes catalyzing
different chemical reactions, we used the reaction with the
largest flux; if an enzyme had several isoenzymes (enzymes
catalyzing the same reaction), we used the isoenzyme with the
smallest ratio K
a
/K
s
. The growth conditions we used vary in
the available carbon sources and in different uptake rates for
oxygen (Table 1). The calculated distribution of flux values in
the metabolic network is highly non-uniform [11] with several
fluxes - usually representing glycolytic enzymes - more than
two orders of magnitude larger than the rest (Additional data
file 4). To eliminate the disproportionate effect of these large
fluxes, we removed the fluxes that are two orders of magni-
tude larger than the median metabolic flux in the network
(similar results are obtained with all fluxes). Figure 2 demon-
strates, for an aerobic growth on glucose, a significant nega-
tive correlation between flux through individual enzymatic
reactions and the ratio K
a
/K
s
(Spearman's rank correlation r
= -0.31; P = 1.7 × 10
-3
; Pearson's correlation r = -0.24, P = 1.7
× 10
-2
). The correlation is clearly non-linear, and has an expo-
nential shape. The results summarized in Table 1 show that
similar associations exist between flux and evolutionary con-
straints K
a
/K
s
in other growth conditions on glucose and fruc-
tose - two natural carbon sources for yeast. Interestingly, the
correlations between evolutionary constraint K
a
/K
s
and flux
are substantially lower, and statistically insignificant, for ace-
tate, a carbon source that may not dominate the natural yeast
environment [21]. As we do not find any correlation between
flux magnitude and connectivity (results not shown), the evo-
lutionary constraints due to high fluxes are complementary to
the connectivity constraints described above (Figure 2).
Gene duplication correlation with connectivity and flux
Gene duplications have effects opposite from those of most
amino acid changes: they may increase rather than reduce
flux through an enzymatic reaction. We established that
highly connected enzymes and enzymes with high associated
flux are especially sensitive to amino acid changes (Figures 2
and 3). Are their enzyme-coding genes, conversely, also more
likely to undergo duplication? Figure 4 shows that this is
indeed the case for enzyme connectivity. The figure demon-
strates an association between an enzyme-coding gene's
number of duplicates and enzyme connectivity (only enzymes
with sequence identity higher than 40% were considered as
duplicates). Mean connectivity for genes with no duplicates is
15.0, and for genes with duplicates it is 19.2 (non-parametric
Wilcoxon test, P = 1.4 × 10
-4
). This result suggests that dupli-
cates of enzymes producing or consuming widely used metab-
olites are more likely to be retained in evolution. Figure 5 and
Additional data file 5 demonstrate that a similar association
exists between non-zero enzymatic flux through a reaction
and the number of duplicates of the respective enzyme's cod-
ing gene. Specifically, the higher the flux through a reaction,
the more duplicates an enzyme-coding gene has. Qualitative
association between enzymatic flux and gene duplication was
also recently shown by Papp et al. [22].
Table 1
Correlation between enzymatic flux magnitude and evolutionary constraint K
a
/K
s
Uptake Maximum uptake rates
(mmol/gDW/h)
Spearman's rank correlation (P value) with zero
fluxes
Spearman's rank correlation (P value)
without zero fluxes
Glucose/oxygen 15.3/2.4 -0.28 (P = 3.8 × 10
-3
) -0.25 (P = 3.6 × 10
-6
)
Glucose/oxygen 15.3/0.2 -0.31 (P = 1.7 × 10
-3
) -0.22 (P = 5.7 × 10
-5
)
Glucose/oxygen 15.3/0.01 -0.26 (P = 9.3 × 10
-3
) -0.21 (P = 1.2 × 10
-4
)
Fructose/oxygen 15.3/6.0 -0.27 (P = 6.4 × 10
-3
) -0.20 (P = 2.5 × 10
-4
)
Fructose/oxygen 15.3/0.2 -0.25 (P = 1.3 × 10
-2
) -0.20 (P = 1.8 × 10
-6
)
Acetate/oxygen 10.0/2.4 -0.08 (P = 0.45) -0.21 (P = 9.2 × 10
-5
)
Acetate/oxygen 5.0/5.0 -0.010 (P = 0.39) -0.19 (P = 3.7 × 10
-4
)
The correlation between enzymatic flux magnitude and evolutionary constraint K
a
/K
s
was calculated with and without enzymes carrying zero fluxes.
gDW, grams dry weight.
Genome Biology 2006, Volume 7, Issue 5, Article R39 Vitkup et al. R39.5
comment reviews reports refereed researchdeposited research interactions information
Genome Biology 2006, 7:R39
Connectivity, essentiality, and metabolic robustness
Evolutionary constraints on enzymes are indirect indicators
of metabolic robustness to amino acid changes, changes that
a metabolic network tolerated for well over millions of years
of evolution. Another type of biological robustness is that
against complete gene deletions. Robustness against gene
deletions can be derived from laboratory studies in which the
effects of gene deletions on growth rate and other indicators
of fitness are studied [23,24]. These studies determine essen-
tial genes, that is, genes whose elimination in one or more lab-
oratory environments is effectively lethal. Our use of available
essentiality data is motivated by the observation that highly
connected proteins in protein interaction networks may be
more likely to be essential to a cell [1]. We carried out analyses
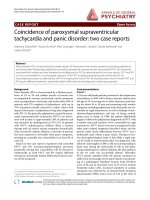
The relationship between metabolic flux and evolutionary constraintFigure 3
The relationship between metabolic flux and evolutionary constraint.(a) The relationship between metabolic flux values and evolutionary constraint K
a
/K
s
for aerobic growth on glucose. (maximal uptake rate for glucose 15.3 mmol/g dry weight (DW)/h; maximal oxygen uptake 0.2 mmol/gDW/h). Spearman's
rank correlation r = -0.30; P = 2.7 × 10
-3
; Pearson's correlation r = -0.24, P = 1.7 × 10
-2
. The metabolic fluxes were calculated using flux balance analysis to
maximize the cell growth rate. Fluxes more than two orders of magnitude larger than the median non-zero flux - representing large glycolytic fluxes - were
excluded from the analysis. (b) The same as (a) but using log coordinates for the metabolic flux magnitude.
0.00 0.05 0.10 0.15 0.20 0.25
0.0
0.2
0.4
0.6
0.8
1.0
1.2
Metabolic flux magnitude (mmol/gDW/hour)
K
a
/K
s
0.00 0.05 0.10 0.15 0.20 0.25
0.01
0.1
1
Metabolic flux magnitude (mmol/gDW/hour)
K
a
/K
s
(a) (b)
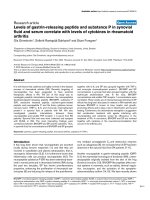
The relationship between enzyme connectivity and the average number of duplications in corresponding enzyme-coding genesFigure 4
The relationship between enzyme connectivity and the average number of
duplications in corresponding enzyme-coding genes. Enzymes with
sequence identity larger than 40% over 100 or more aligned amino acids
were considered as duplicates.
0-15
15-30
>30
321
0.0
0.2
0.4
0.6
0.8
1.0
1.2
1.4
Average number of gene
duplications
Enzyme connectivity
The relationship between the number of duplicates of an enzyme-coding gene and the magnitude of the metabolic flux through the enzymatic reactionFigure 5
The relationship between the number of duplicates of an enzyme-coding
gene and the magnitude of the metabolic flux through the enzymatic
reaction. The results are shown for aerobic growth on glucose (maximal
uptake rate for glucose 15.3 mmol/gDW/h; oxygen 0.2 mmol/gDW/h).
Putative duplicate pairs with less than 40% amino acid similarity or less
than 100 aligned amino acid residues were excluded.
0.001-0.01 0.01-0.1 0.1-1 >1
1234
0.0
0.2
0.4
0.6
0.8
1.0
1.2
1.4
1.6
Average number of gene
duplications (per bin)
Metabolic flux magnitude
R39.6 Genome Biology 2006, Volume 7, Issue 5, Article R39 Vitkup et al. />Genome Biology 2006, 7:R39
using data on essential genes derived from a large scale gene
deletion study by Giaever et al. [23], and used the Saccharo-
myces genome database (SGD) [25] to collect the essentiality
data.
Our analyses of essential enzyme-coding genes show the
clearest deviations from behavior observed in protein interac-
tion networks. In the metabolic network from which the most
highly connected metabolites (such as ATP or hydrogen) have
been excluded, the mean connectivity of essential enzymes is
significantly smaller than the mean connectivity of non-
essential enzymes (Figure 6). For the yeast network, mean
connectivity of essential enzymes is 13.2, and for non-essen-
tial enzymes 17.5 (non-parametric Wilcoxon test, P = 4.0 × 10
-
4
). No statistically significant difference in connectivity of
essential and non-essential enzymes is observed if all
metabolites are used to establish network connections. Con-
sequently, highly connected metabolic enzymes are no more
likely to be essential than low connected enzymes. Similarly,
as Mahadevan et al. [26] demonstrated recently, removal of
highly connected metabolites is no more essential than
removal of low connected metabolites. As we show above,
highly connected enzymes and enzymes carrying high fluxes
are more likely to have duplicates (often with the same or sim-
ilar biochemical function). This suggests that highly con-
nected enzymes are no more likely to be essential because
they often have duplicates that can compensate for loss-of-
function mutations [27]. Indeed, we find that the average
number of duplicates for essential metabolic enzymes is 0.19
while the average number of duplicates for non-essential
enzymes is 0.8 (non-parametric Wilcoxon test, P = 8 × 10
-49
).
In addition to gene duplications, flux rerouting may provide
another mechanism to make highly connected genes less
essential. In highly connected parts of a metabolic network,
metabolic fluxes may be rerouted through alternative path-
ways after a loss-of-function mutation [19,28,29]. This does
not hold for linear metabolic pathways at a metabolic net-
work's periphery, where a loss-of-function mutation may be
fatal because no rerouting is possible.
Discussion
In sum, we demonstrate that both highly connected enzymes
and enzymes that carry high metabolic fluxes in the yeast
metabolic network have tolerated fewer amino acid substitu-
tions in their evolutionary history. Why are enzymes carrying
larger fluxes more constrained? The likely answer comes
from the observation that most mutations affecting enzy-
matic activity may reduce rather than increase flux. Enzymes
carrying high fluxes tend to have reaction products that enter
a large number of metabolic pathways. Consequently, a muta-
tional reduction in the activity of such enzymes should be
more detrimental than a reduction in the activity of enzymes
with lower flux.
We also show that the genes encoding enzymes with high flux
have more duplicates. Importantly, we do not argue that
duplications arise more frequently for genes whose products
carry high flux, but that such duplications are more likely to
be preserved in evolution, because of the advantage - higher
flux - they provide. While a gene's duplicates can initially be
preserved through an advantageous increase in metabolic
flux, after divergence they may provide other functional ben-
efits [30]. Divergence of metabolic genes in their expression
and regulation is well-established for gene in intensely stud-
ied parts of metabolism, such as tricarboxylic acid cycle
enzymes [31].
We found that the association between predicted enzymatic
flux and evolutionary rate is most pronounced for carbon
sources that dominate the natural environment of yeast. This
suggests that one can use the association between flux and
evolutionary constraint to search for conditions that domi-
nated the evolution of metabolic networks. Similar analyses,
which use genomic data to infer the environment that has
shaped an organism's evolution, have been used before to
show that carbon limitation may have influenced the evolu-
tion of the E. coli metabolic network more strongly than
nitrogen limitation [19], and to show that yeast evolution
favored fermentation over respiration [32].
A previous study by Hahn et al. [6] reported that, based on
amino acid divergence, in the E. coli metabolic network there
exists no statistically significant association between enzyme
connectivity and evolutionary constraint. We emphasize that
any contradiction between this earlier work and our results is
only apparent. First, the earlier study was based on a much
smaller set of enzymes (n = 108 as opposed to n = 350 here),
and thus had less statistical power. Nevertheless, two differ-
The relationship between enzyme connectivity and gene essentialityFigure 6
The relationship between enzyme connectivity and gene essentiality. The
connectivity of a metabolic enzyme is equal to the total number of other
network enzymes producing or consuming the enzyme's reactants and
products. The information on gene essentiality was obtained from the
systematic gene deletion study by Giaever et al. [23] using the SGD
database [25].
0-12 12-24 >24
32
0.00
0.05
0.10
0.15
0.20
0.25
Fraction of essential genes
Enzyme connectivity
Genome Biology 2006, Volume 7, Issue 5, Article R39 Vitkup et al. R39.7
comment reviews reports refereed researchdeposited research interactions information
Genome Biology 2006, 7:R39
ent statistical measures in the previous study showed, like we
do here, a negative association between connectivity and evo-
lutionary constraint, albeit not at P < 0.05. Second, because
of the lack of sufficient sequence information for a closely
related sister species of E. coli, the previous study used only
amino acid divergence K
a
and not the preferable K
a
/K
s
to
indicate evolutionary constraint. In fact, the correlation
between connectivity and K
a
is very similar between the
present study and the previous work (Spearman's rank corre-
lation r = -0.13, P = 1.2 × 10
-2
here versus Spearman's rank
correlation r = -0.15, P = 7 × 10
-2
in the study by Hahn et al.).
It should not be surprising that the observed associations are
weak in magnitude. The reason for the low magnitude is that
many other factors influence the evolution of enzyme-coding
genes. Two of these factors are gene expression levels (dis-
cussed in the paper) and constraints stemming from the ter-
tiary and quaternary structure of enzymes, which may differ
among enzymes (little is known about such constraints). The
key point is that besides all these other factors, metabolic
network function and structure also has a clear influence on
protein evolution.
How do our results on the yeast metabolic network relate to
earlier work on protein interaction networks? There, a similar
relationship between protein connectivity and evolutionary
constraint has been suggested [4,5]; however, this association
exists for different reasons. Highly connected proteins in pro-
tein interaction networks may evolve slowly because a larger
fraction of a highly connected protein's sequence is involved
in protein interactions and may thus be evolutionarily con-
strained [4]. In contrast, high protein connectivity in the met-
abolic network is established not through protein-protein
interactions, but through consumption or production of
widely used metabolites. In metabolic networks, mutations in
enzyme-coding genes - changing reaction rates and concen-
trations - may have especially deleterious consequences for
widely used metabolites. Consequently, highly connected
metabolic enzymes may evolve slowly due to functional as
opposed to structural constraints. Our ability to consider
fluxes through enzymes in a metabolic network allows us to
relate the functional role of each enzyme in a network to its
rate of evolution. Such a functional analysis of a genome-scale
network has no counterpart in any other genome-scale net-
work studied thus far.
In conclusion, our analysis of evolutionary constraints, gene
duplication, and essentiality demonstrates that the structure
and function of a metabolic network shapes the evolution of
its enzymes. In the long run, system analyses of biological
networks will allow us to increasingly place the evolution of
genes in the larger context in which they operate, as building
blocks of cellular networks.
Materials and methods
Metabolic network
We used a comprehensive collection of the yeast S. cerevisiae
metabolic reactions by Foster et al. [10] to calculate metabolic
enzyme connectivities. In addition to enzymatic reactions
assigned to 671 open reading frames (ORFs), the collection
contains reactions unassigned to known ORFs, transport
reactions, and reactions represented by large macromolecu-
lar complexes. These reactions were used to calculate other
enzyme connectivities but were excluded from the main anal-
ysis. Large macromolecular complexes (containing several
ORFs) were represented by single enzymatic nodes in the cal-
culation of connectivities for other metabolic enzymes. In
order to include only functional relationships in the calcula-
tion of the enzyme connectivities, we excluded the 14 highly
connected metabolites and co-factors (as described in the
main text). As a result of the exclusion, a small fraction (5%)
of network enzymes became disconnected from the network
(they have zero connectivity). These enzymes were not
included in the analysis.
Flux balance analysis
Flux balance analysis (FBA) was used to obtain metabolic flux
distribution as described previously [10,17,19]. The network
by Forster et al. [10] was used in all flux balance calculations.
The in silico network of yeast metabolism includes central
carbon metabolism, transmembrane transport reactions,
pathways responsible for the synthesis and degradation of
amino acids, nucleic acids, vitamins, cofactors, and lipids. In
total, the network consists of 733 metabolites and 1,175 met-
abolic reactions. In the flux-balance analysis, the constraints
limiting nutrient uptake, reaction irreversibility, and steady-
state conservation of metabolite concentrations are applied.
The fluxes optimal for growth are then obtained by maximi-
zation of biomass production using linear optimization. Lin-
ear optimization was performed using the GNU Linear
Programming Kit [33].
Molecular evolution
We identified duplicates in the S. cerecisae genome using a
previously described whole-genome analysis tool [34].
Briefly, the tool locates gene duplicates in a genome using
BLASTP [35] and aligns them globally with the Needleman
and Wunsch dynamic programming alignment algorithm
[36]. Putative duplicate pairs with less than 40% amino acid
similarity or less than 100 aligned amino acid residues were
excluded; for the remaining pairs we calculated the number of
substitutions per synonymous site (K
s
) and the number of
substitutions per non-synonymous site (K
a
) using the maxi-
mum likelyhood models of Muse and Gaut [37] and Goldman
and Yang [38].
The average K
a
/K
s
, K
a
, and K
s
values used in the analysis were
obtained from the study by Kellis et al. [14]. In a complemen-
tary approach, we also recalculated the average ratios using
R39.8 Genome Biology 2006, Volume 7, Issue 5, Article R39 Vitkup et al. />Genome Biology 2006, 7:R39
the maximum-likelihood method of Yang and Nielsen [15]
and obtained qualitatively similar results.
Additional data files
The following additional data are available with the online
version of this paper. Additional data file 1 is a figure showing
examples of metabolic connectivity. (a) An example of the
metabolic reaction network from sphingoglycolipid metabo-
lism; metabolites are drawn as small circles (DHSP, sphinga-
nine 1-phosphate; PETHM, ethanolamine phosphate; SPH,
sphinganine; CDPETN, CDPethanolamine; ETHM, eth-
anolamine) and enzyme-encoding genes are shown in rectan-
gles. (b) Metabolic connectivity of the dpl1 gene (solid edges),
as defined by the reactions shown in (a). The dpl1 gene has a
total of six metabolic connections: two established through
ethanolamine phosphate (red edges); and four through sph-
inganine 1-phosphate (blue edges). Metabolic connections
between other enzymes are show by dashed edges. Additional
data file 2 demonstrates the relationship between enzyme
connectivity and the average amino acid divergence K
a
.
Spearman's rank correlation r = -0.13, P = 1.6 × 10
-2
. Addi-
tional data file 3 shows the relationship between enzyme con-
nectivity and the average silent divergence K
s
. Spearman's
rank correlation r = -0.056, P = 0.30. Additional data file 4 is
a histogram of the calculated metabolic fluxes in the yeast
network for aerobic growth on glucose (maximal uptake rate
for glucose 15.3 mmol/g dry weight/h; oxygen 0.2 mmol/g
dry weight/h). Note the small number of fluxes - representing
glycolysis - with disproportionately large magnitudes. Similar
flux distributions were also obtained for other growth condi-
tions. Additional data file 5 shows the correlation between
non-zero enzymatic flux through a reaction and the number
of duplicates of the respective enzyme's coding gene. Addi-
tional data file 6 provides connectivity and evolutionary
parameters (K
a
/K
s
, K
a
, K
s
) for yeast metabolic enzymes.
Additional data file 1Examples of metabolic connectivity(a) An example of the metabolic reaction network from sphingogly-colipid metabolism; metabolites are drawn as small circles (DHSP, sphinganine 1-phosphate; PETHM, ethanolamine phosphate; SPH, sphinganine; CDPETN, CDPethanolamine; ETHM, ethanolamine) and enzyme-encoding genes are shown in rectangles. (b) Metabolic connectivity of the dpl1 gene (solid edges), as defined by the reac-tions shown in (a). The dpl1 gene has a total of six metabolic con-nections: two established through ethanolamine phosphate (red edges); and four through sphinganine 1-phosphate (blue edges). Metabolic connections between other enzymes are show by dashed edges.Click here for fileAdditional data file 2The relationship between enzyme connectivity and the average amino acid divergence K
a
The relationship between enzyme connectivity and the average amino acid divergence K
a
. Spearman's rank correlation r = -0.13, P = 1.6 × 10
-2
Click here for fileAdditional data file 3The relationship between enzyme connectivity and the average silent divergence K
s
The relationship between enzyme connectivity and the average silent divergence K
s
. Spearman's rank correlation r = -0.056, P = 0.30.Click here for fileAdditional data file 4Histogram of the calculated metabolic fluxes in the yeast network for aerobic growth on glucoseMaximal uptake rate for glucose 15.3 mmol/g dry weight/h and for oxygen 0.2 mmol/g dry weight/h. Note the small number of fluxes - representing glycolysis - with disproportionately large magni-tudes. Similar flux distributions were also obtained for other growth conditions.Click here for fileAdditional data file 5The correlation between non-zero enzymatic flux through a reac-tion and the number of duplicates of the respective enzyme's coding geneThe correlation between non-zero enzymatic flux through a reac-tion and the number of duplicates of the respective enzyme's coding gene.Click here for fileAdditional data file 6Connectivity and evolutionary parameters (K
a
/K
s
, K
a
, K
s
) for yeast metabolic enzymesConnectivity and evolutionary parameters (K
a
/K
s
, K
a
, K
s
) for yeast metabolic enzymes.Click here for file
Acknowledgements
We thank Dr Andrey Rzhetsky, Dr Uwe Sauer, and Dr Eugene Koonin for
valuable discussions. We also thank two anonymous reviewers for several
very helpful suggestions.
References
1. Jeong H, Mason SP, Barabasi AL, Oltvai ZN: Lethality and central-
ity in protein networks. Nature 2001, 411:41-42.
2. Hirsh AE, Fraser HB: Protein dispensability and rate of
evolution. Nature 2001, 411:1046-1049.
3. Pal C, Papp B, Hurst LD: Highly expressed genes in yeast evolve
slowly. Genetics 2001, 158:927-931.
4. Fraser HB, Hirsh AE, Steinmetz LM, Scharfe C, Feldman MW: Evolu-
tionary rate in the protein interaction network. Science 2002,
296:750-752.
5. Jordan IK, Wolf DM, Koonin EV: No simple dependence
between protein evolution rate and the number of protein-
protein interactions: only the most prolific interactors tend
to evolve slowly. BMC Evol Biol 2003, 3:1-12.
6. Hahn MW, Conant GC, Wagner A: Molecular evolution in large
genetic networks: does connectivity equal constraint? J Mol
Evol 2004, 58:203-211.
7. Mering C, Krause R, Snel B, Cornell M, Oliver SG, Fields S, Bork P:
Comparative assessment of large-scale data sets of protein-
protein interactions. Nature 2002, 417:399-403.
8. Spinzak E, Sattah S, Margalit H: How reliable are experimental
protein-protein interaction data ? J Mol Biol 2003, 327:919-923.
9. Karp PD, Paley S, Romero P: The Pathway Tools software. Bioin-
formatics 2002, 18:S225-S232.
10. Forster J, Famili I, Fu P, Palsson BO, Nielsen J: Genome-scale
reconstruction of the Saccharomyces cerevisiae metabolic
network. Genome Res 2003, 13:244-253.
11. Edwards JS, Palsson BO: The Escherichia coli MG1655 in silico
metabolic genotype: its definition, characteristics, and
capabilities. Proc Natl Acad Sci USA 2000, 97:5528-5533.
12. Kharchenko P, Vitkup D, Church GM: Filling gaps in a metabolic
network using expression information. Bioinformatics 2004,
20:I178-I185.
13. Li W-H: Molecular Evolution Sunderland: Sinauer Associates; 1997.
14. Kellis M, Patterson N, Endrizzi M, Birren B, Lander ES: Sequencing
and comparison of yeast species to identify genes and regu-
latory elements. Nature 2003, 423:241-254.
15. Yang Z, Nielsen R: Estimating synonymous and nonsynony-
mous substitution rates under realistic evolutionary models.
Mol Biol Evol 2000, 17:32-43.
16. Holstege FC, Jennings EG, Wyrick JJ, Lee TI, Hengartner CJ, Green
MR, Golub TR, Lander ES, Young RA: Dissecting the regulatory
circuitry of a eukaryotic genome. Cell 1998, 95:717-728.
17. Varma A, Boesch BW, Palsson BO: Biochemical production capa-
bilites of Escherichia coli. Biotech Bioeng 1993, 42:59-73.
18. Edwards JS, Ibarra RU, Palsson BO: In silico predictions of
Escherichia coli metabolic capabilites are consistent with
experimental data. Nat Biotechnol 2001, 19:125-130.
19. Segre D, Vitkup D, Church GM: Analysis of optimality in natural
and perturbed metabolic networks. Proc Natl Acad Sci USA 2002,
99:15112-12117.
20. Foster J, Famili I, Palsson BO, Nielsen J: Large-scale evaluation of
in-silico gene deletions in Saccharomyces cerevisiae. OMICS
2003, 7:193-202.
21. Strathern JN, Jones EW, Broach JR: The Molecular Biology of the
Yeast Saccharomyces. In Metabolism and Gene Expression Cold
Spring Harbor Press, NY; 1982.
22. Papp B, Pal C, Hurst LD: Metabolic network analysis of the
causes and evolution of the enzyme dispensability in yeast.
Nature 2004, 429:661-664.
23. Giaever G, Chu AM, Ni L, Connelly C, Riles L, Veronneau S, Dow S,
Lucau-Danila A, Anderson K, Andre B, et al.: Functional profiling
of the Saccharomyces cerevisiae genome. Nature 2002,
418:387-391.
24. Steinmetz LM, Scharfe C, Deutschbauer AM, Mokranjac D, Herman
ZS, Jones T, Chu AM, Giaever G, Prokisch H, Oefner PJ, Davis RW:
Systematic screen for human disease genes in yeast. Nat
Genet 2002, 31:400-404.
25. Dwight SS, Balakrishnan R, Christie KR, Costanzo MC, Dolinski K,
Engel SR, Feierboch B, Fisk DG, Hirchman J, Hong EL, et al.: Saccha-
romyces genome database: underlying principles and
organisation. Brief Bioinform 2004, 5:9-22.
26. Mahadevan R, Palsson BO: Properties of metabolic networks:
structure versus function. Biophys J 2005, 88:L07-L09.
27. Gu Z, Steinmetz LM, Gu X, Scharfe C, Davis RW, Li WH: Role of
duplicate genes in genetic robustness against null mutations.
Nature 2003, 421:63-66.
28. Wagner A: Robustness against mutations in genetics net-
works of yeast. Nat Genet 2000, 24:355-361.
29. Edwards JS, Palsson BO: Robustness analysis of the Esherichia
coli metabolic network. Biotechnol Prog 2000, 16:927-939.
30. Kuepfer L, Sauer U, Blank LM: Metabolic functions of duplicate
genes in Saccharomyces cerevisiae. Genome Res 2005,
15:1421-1430.
31. McAlister-Henn L, Small WC: Molecular genetics of yeast TCA
cycle isozymes. Prog Nucleic Acid Res Mol Biol 1997, 57:317-339.
32. Wagner A: Inferring lifestyle from gene expression patterns.
Mol Biol Evol 2000, 17:1985-1987.
33. Makhorin A: GNU Linear Programming Kit Boston: Free Software
Foundation; 2001.
34. Conant GC, Wagner A: GenomeHistory: a software tool and its
application to fully sequenced genomes. Nucleic Acids Res 2002,
30:3378-3386.
35. Altschul SF, Madden TL, Schaffer AA, Zhang J, Zhang Z, Miller W, Lip-
man DJ: Gapped BLAST and PSI-BLAST: a new generation of
protein database search programs. Nucleic Acid Res 1997,
Genome Biology 2006, Volume 7, Issue 5, Article R39 Vitkup et al. R39.9
comment reviews reports refereed researchdeposited research interactions information
Genome Biology 2006, 7:R39
25:3389-3402.
36. Needleman SB, Wunsch CD: A general method applicable to
the search for similarities for amino acid sequences of two
proteins. J Mol Biol 1970, 48:443-453.
37. Muse SV, Gaut BS: A likelihood approach for comparing synon-
ymous and nonsynonymous nucleotide substitution rates,
with application to the chloroplast genome. Mol Biol Evol 1994,
11:715-724.
38. Goldman N, Yang Z: A codon-based model of nucleotide sub-
stitution for protein-coding DNA sequences. Mol Biol Evol
1994, 11:725-736.