Báo cáo y học: "Intron gain and loss in segmentally duplicated genes in rice" docx
Bạn đang xem bản rút gọn của tài liệu. Xem và tải ngay bản đầy đủ của tài liệu tại đây (342.11 KB, 11 trang )
Genome Biology 2006, 7:R41
comment reviews reports deposited research refereed research interactions information
Open Access
2006Linet al.Volume 7, Issue 5, Article R41
Research
Intron gain and loss in segmentally duplicated genes in rice
Haining Lin
*
, Wei Zhu
*
, Joana C Silva
*
, Xun Gu
†
and C Robin Buell
*
Addresses:
*
The Institute for Genomic Research, Medical Center Drive, Rockville, MD 20850, USA.
†
Department of Genetics, Development,
and Cell Biology, Center for Bioinformatics and Biological Statistics, Iowa State University, Ames, IA 50011, USA.
Correspondence: C Robin Buell. Email:
© 2006 Lin et al.; licensee BioMed Central Ltd.
This is an open access article distributed under the terms of the Creative Commons Attribution License ( which
permits unrestricted use, distribution, and reproduction in any medium, provided the original work is properly cited.
Intron evolution in rice<p>Analysis of over 3,000 co-linear paired genes in rice shows more intron loss than intron gain following segmental duplication.</p>
Abstract
Background: Introns are under less selection pressure than exons, and consequently, intronic
sequences have a higher rate of gain and loss than exons. In a number of plant species, a large
portion of the genome has been segmentally duplicated, giving rise to a large set of duplicated
genes. The recent completion of the rice genome in which segmental duplication has been
documented has allowed us to investigate intron evolution within rice, a diploid monocotyledonous
species.
Results: Analysis of segmental duplication in rice revealed that 159 Mb of the 371 Mb genome and
21,570 of the 43,719 non-transposable element-related genes were contained within a duplicated
region. In these duplicated regions, 3,101 collinear paired genes were present. Using this set of
segmentally duplicated genes, we investigated intron evolution from full-length cDNA-supported
non-transposable element-related gene models of rice. Using gene pairs that have an ortholog in
the dicotyledonous model species Arabidopsis thaliana, we identified more intron loss (49 introns
within 35 gene pairs) than intron gain (5 introns within 5 gene pairs) following segmental
duplication. We were unable to demonstrate preferential intron loss at the 3' end of genes as
previously reported in mammalian genomes. However, we did find that the four nucleotides of
exons that flank lost introns had less frequently used 4-mers.
Conclusion: We observed that intron evolution within rice following segmental duplication is
largely dominated by intron loss. In two of the five cases of intron gain within segmentally duplicated
genes, the gained sequences were similar to transposable elements.
Background
Introns are under less selection pressure than exons, and con-
sequently, their sequences diverge faster than exons. How-
ever, the position of the intron with respect to the protein
sequence is relatively conserved and conservation of intron
position has been observed between distinct eukaryotic line-
ages throughout about 1.5 billion years of evolution such as
between animal and fungal genes [1] and between the malaria
parasite Plasmodium falciparum and other eukaryotes [2].
With respect to intron position within genes, introns within
intron-sparse species as well as single intron genes are pref-
erentially located near the 5' end of the gene [3,4], suggesting
a biased pattern of intron distribution. Indeed, recent studies
on 684 eukaryotic orthologous genes from eight eukaryotic
species of animals, plants, fungi, and protists showed prefer-
ential intron loss [5,6] and intron gain [6] in the 3' end of
Published: 23 May 2006
Genome Biology 2006, 7:R41 (doi:10.1186/gb-2006-7-5-r41)
Received: 30 January 2006
Revised: 21 March 2006
Accepted: 24 April 2006
The electronic version of this article is the complete one and can be
found online at />R41.2 Genome Biology 2006, Volume 7, Issue 5, Article R41 Lin et al. />Genome Biology 2006, 7:R41
genes. This is in contrast to an analysis in fungal species in
which no positional bias in intron loss was observed [7].
Introns can be classified into three categories based on loca-
tion relative to the codon. Introns that do not interrupt the
codons are termed phase 0, while phase 1 introns are located
between the first and second bases of the codon and phase 2
introns are located between the second and third bases of the
codon. It has been reported that eukaryotic genes have more
phase 0 introns than phase 1 or phase 2 introns; on average a
5:3:2 ratio of phase 0: phase 1: phase 2 introns is observed,
although the specific ratio of intron phase appears to be spe-
cies specific [8-10]. Several explanations have been proposed
for phase bias, including legacy of gene formation in the
intron early theory [11,12], phase bias of intron insertion [13],
and phase bias of intron loss or selection [5,7].
Discovery of both intron loss and intron gain suggests that
these two processes may be ongoing events in evolution. The
rates of intron gain and loss seem to differ greatly among spe-
cies [2,7,14-16] and the underlying mechanism(s) driving
intron loss and gain are still unknown. With respect to plants,
large-scale computational analyses of intron loss and gain
have been focused on Arabidopsis thaliana, a model dicoty-
ledonous plant [2,4-6,16-20]. With the availability of the
near-complete, high quality rice genome sequence [21] and
uniform, high quality gene annotation for the genome [22],
we have the ability to examine intron loss and gain within a
second plant species that represents the other major clade of
angiosperms, monocotyledonous plants. Phylogenetic analy-
sis indicates that date of divergence of Arabidopsis and rice is
approximately 130 to 200 million years ago (MYA) [23-25].
Interestingly, depending on the completeness and quality of
the genome dataset, as well as the methods and parameters
employed, the rice genome underwent a segmental duplica-
tion that involved 15% to 62% of the genome [25-29] and
occurred approximately 70 MYA [25,27], with the exception
of the top arms of chromosomes 11 and 12, which underwent
a more recent duplication estimated at 5 MYA [27].
Segmental duplication in rice provides the opportunity to
study intron gain and loss within a subset of genes that have
recently diverged. In this study, we report on the evolution of
introns within coding sequences (CDS) after segmental dupli-
cation in rice. Through our examination of segmentally dupli-
cated genes, we anticipated that we would identify more
intron gain or loss events than for non-duplicated genes due
to the accelerated rate of intron loss or intron gain in dupli-
cated versus orthologous genes, as reported previously in two
malaria parasites [30]. Other advantages of investigating seg-
mentally duplicated genes are that the age of the duplication
is approximately 70 MYA [25,27], which is within the approx-
imately 100 million years divergence limit for investigating
recently gained introns [31,32], and that segmentally dupli-
cated blocks are more reliable than individually duplicated
genes for this type of analysis. Furthermore, we could exploit
the phylogeny of rice with A. thaliana, a model dicotyledous
plant with a near-complete genome sequence, as the out-
group to readily classify 'intron loss' and 'intron gain' events
between the two duplicated rice genes.
Results
Rice segmentally duplicated blocks
Previous analyses of segmental duplication in rice used
sequence datasets that contained a substantial portion of
unfinished genome sequence and lacked refined structural
and functional annotation of the genes [25-29]. Thus, we
repeated the analysis of segmental duplication using a set of
pseudomolecules (about 371 Mb total) that contain 98% fin-
ished sequence and had been annotated for genes both at the
structural and functional level [22]. Depending on the maxi-
mum distance permitted between collinear gene pairs, 25.9%
to 53.4% of the rice genome could be identified as segmentally
duplicated (Table 1). Using a maximum distance of 200 kb
between collinear gene pairs, a total of 149 segmentally dupli-
cated blocks were identified (Additional data file 1). The larg-
est block had 287 pairs of duplicated genes between
chromosomes 11 and 12, consistent with the more recent
duplicated reported between the top arms of these two chro-
mosomes [27]. These 149 blocks covered 159 Mb (42.8%) of
the 371 Mb genome and contained 21,570 of the total 43,719
non-transposable element (TE) related genes (49.3%) in the
rice genome. Of these 21,570 genes, 5,567 were retained
within the blocks and corresponded to 3,101 pairs of segmen-
tally duplicated genes distributed across all 12 chromosomes
of rice (Additional data file 2), with chromosomes 1 and 5 hav-
ing the largest number of duplicated gene pairs (656 pairs).
An increase in genome coverage within the duplicated regions
was observed if the maximum distance permitted between
collinear gene pairs was expanded from 200 kb to 500 kb, 1
Mb, or 5 Mb, whereas a much smaller percentage of the
genome was covered if the maximum distance was limited to
100 kb (Table 1). Previous studies on segmental duplication in
the rice genomes reported that 15% to 62% of the rice genome
had undergone segmental duplication [25-29], consistent
with our analyses of duplication within the rice genome. As
we wished to examine intron evolution within segmentally
duplicated genes and there was little difference in percent of
the genome identified as duplicated using a maximum dis-
tance of 500 kb, 1 Mb, and 5 Mb between collinear gene pairs,
we utilized the intermediate estimate of segmental duplica-
tion that we obtained using 200 kb as the maximum distance
permitted between collinear gene pairs. Thus, our subsequent
analyses report on duplicated genes with a maximum dis-
tance of 200 kb permitted between collinear gene pairs.
Conservation of exon-intron structure
Within the 43,719 non-transposable element-related gene
models in rice, 140,827 introns within the CDS are present,
with an average length of 385 base pairs (bp; standard
Genome Biology 2006, Volume 7, Issue 5, Article R41 Lin et al. R41.3
comment reviews reports refereed researchdeposited research interactions information
Genome Biology 2006, 7:R41
deviation (std) 470) and an average GC content of 37.5%. Out
of the 3,101 pairs of segmentally duplicated genes, 281 pairs
had at least one intron that passed the manual review for full-
length (fl)-cDNA support and single isoform. In total, 2,573
introns were present within these 281 gene pairs and had a
similar length distribution (average 315 bp) and GC content
(36.9% GC) to those found throughout the genome. We found
that 197 of the 281 pairs (70%) had completely conserved
exon-intron structure in the coding region (958 intron posi-
tions in the alignments), that is, the intron number, position,
and phase were identical among the duplicated genes (Figure
1). The other 84 pairs (30%) had incongruent exon-intron
structure. To eliminate the possibility that the incongruence
was due to an aberrant alignment, these alignments were
manually checked. Only introns surrounded by reliable align-
ments and only pairs with a putative orthologous gene from
Arabidopsis were further investigated. Thus, 48 alignments
were excluded and a total of 36 pairs of genes (137 intron posi-
tions within the alignments) that showed potential intron loss
or intron gain were investigated further.
Abundance of intron loss after segmental duplication
To determine whether the incongruence was due to intron
gain or loss, we used the putative orthologous gene from Ara-
bidopsis for the gene pair. From our set of 36 gene pairs with
validated alignments, we identified 31 gene pairs with an
intron loss(es) (43 intron losses in total), one gene pair with a
single gained intron, and four gene pairs in which both intron
loss and gain were observed (6 intron losses and 4 intron
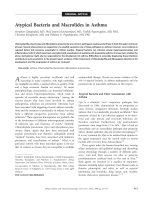
gains). An example of intron loss is shown in Figure 2. In this
example, the third intron of LOC_Os07g49150.1 was lost as
shown by the comparison to the duplicated rice gene model
LOC_Os03g18690.1 and the putative ortholog from Arabi-
dopsis At4g29040.1. Alignments of all of the 36 gene pairs
with their orthologs from Arabidopsis are displayed in Addi-
tional data file 3. The length of the lost introns (226 bp, std
206) was shorter than the average intron length in the rice
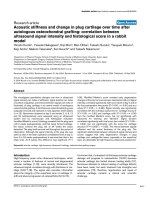
genome (385 bp, std 470). The distribution of the length of
the lost introns and gained introns and the frequency of the
length of the 33,011 fl-cDNA supported (FLS) rice introns (see
Materials and methods for detail) are shown in Figure 3.
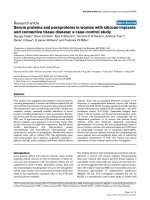
Intron loss showed no preference at the 3' end of genes
A single intron loss, termed an independent intron loss, was
observed in 31 gene pairs as determined by alignment with
the putative Arabidopsis ortholog. However, within these 31
gene pairs, 34 introns in total were lost as for 3 gene pairs,
both rice genes underwent separate intron loss events. In
these 31 gene pairs, we observed no bias in intron loss posi-
tion at the 3' ends of genes (Figure 4). Neither was there a bias
in the position of intron loss in our set of four gene pairs in
which multiple intron losses were observed (data not shown).
Interestingly, in one gene pair (LOC_Os05g02130.1 and
LOC_Os01g74320.1), all seven introns were lost in
LOC_Os01g74320.1, and in LOC_Os07g44140.1, multiple
consecutive introns at the 3' end of the gene were lost (see
Additional data file 3).
Table 1
Statistics of genome, genes, and regions within segmentally duplicated blocks of the rice genome
Maximum distance between collinear gene pairs
Statistics 100 kb 200 Kb 500 Kb 1 Mb 5 Mb
Region covered by duplicated blocks (Mb) 96.04 158.9 193.25 196.35 197.96
Region covered by multiple duplicated blocks (Mb) 7.16 30.6 45.2 45.31 45.74
Number of duplicated blocks 151 149 101 98 96
Genome coverage (%) 25.9 42.8 52.1 52.9 53.4
Non-TE gene coverage (%) 30.3 49.3 59.1 59.7 60
Total number of non-TE genes retained within duplicated blocks 4,377 5,567 5,879 5,894 5,894
Number gene pairs retained within duplicated blocks 2,277 3,101 3,346 3,355 3,355
Total number non-TE genes within duplicated blocks 13,250 21,570 25,819 26,114 26,248
Table 2
Distribution of phase of intron loss in segmentally duplicated rice genes
Phase 0 Phase 1 Phase 2
Intron loss* 15 7 12
Conserved introns
†
580 236 225
Intron loss rate
‡
2.5% 2.8% 5.1%
*Multiple consecutively lost introns were excluded from this analysis.
†
Conserved aligned intron positions within all 235 duplicate gene pairs.
‡
Intron
loss rate was calculated by (intron loss/(intron loss + conserved introns)) × 100.
R41.4 Genome Biology 2006, Volume 7, Issue 5, Article R41 Lin et al. />Genome Biology 2006, 7:R41
Intron loss rate at phase 0, 1, 2
Previous reports on intron loss suggested a phase bias [5]. To
investigate phase bias in intron loss, we first examined intron
phase distribution within the rice genome using a set of
introns (33,011 total) derived from the coding regions of
6,046 rice gene models that were supported with fl-cDNA evi-
dence, had no alternative splicing isoform, and had at least
one intron within the CDS. The phases of the coding introns
were distributed as phase 0 (57.3%): phase 1 (21.5%): phase 2
(21.2%), comparable to the distribution reported previously
in plants (62: 17: 21) [1].
To examine whether there was a bias in the phase of intron
loss in segmentally duplicated genes in rice, we examined the
34 independently lost introns and excluded genes with multi-
ple intron losses. The frequency of intron loss at phase 2 was
higher, but not statistically significant, than intron loss at
phase 0 and 1 (Table 2; χ
2
test P value = 0.155). Randomiza-
tion tests showed that intron loss at phase 2 was unexpectedly
high (P value = 0.06) and intron loss at phase 0 was unexpect-
edly low (P value = 0.08).
Rare 4-mers in the exonic sequence at the donor splice
site of lost introns
Previous studies indicated sequence composition preferences
surrounding splice sites [13,33]. As our sample size was small,
we restricted our analysis of nucleotide composition sur-
rounding the splice site to the nearest four nucleotides (4-
mers); a total of 31 gene pairs with an independent intron loss
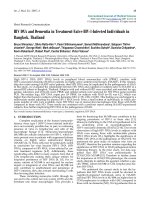
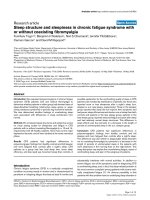
Flow chart for the identification of intron gain and intron loss within segmentally duplicated rice genesFigure 1
Flow chart for the identification of intron gain and intron loss within
segmentally duplicated rice genes. TE, transposable element.
57,915 genes
43,719 non-
TE related
14,196 TE-related
genes removed
Segmental duplication
identification (DAGchainer)
3,101 pairs of
duplicates
Fl-cDNA, ≥ 1 coding
intron, single isoform
281 pairs of genes
Exon-intron structure
conserved (197 pairs)
84 pairs of genes
Manual alignment check;
orthologous gene from
Arabidopsis check (48
pairs excluded
)
36 gene pairs with
gain and/or loss of
introns
Example of intron lossFigure 2
Example of intron loss. Multiple alignment of the two duplicated rice genes
(top; LOC__Os03g18690.1, LOC_Os07g49150.1) and their putative
orthologous Arabidopsis gene (bottom; At4g29040.1) suggests that the
third intron of LOC_ Os07g49150.1 was lost. Yellow inserts indicate
conserved introns across the three genes while red indicates lost intron.
The phase of the intron is inserted into the alignment. All conserved
introns are phase 0 whereas the lost intron is phase 2. The two rice genes
and putative Arabidopsis ortholog encode a 26S proteasome regulatory
subunit 4.
MGQGTPGGMGKQGGLPGDRKPGDGGAGDKKDRKFEPPAAPSRVGRKQRKQKGPEAAARLP
MGQGTPGGMGKQGGAPGDRKPG GDGDKKDRKFEPPAAPSRVGRKQRKQKGPEAAARLP
MGQGPSGGLNRQG DRKPD GGDKKEKKFEPAAPPARVGRKQRKQKGPEAAARLP
**** **:.:** ****. ****::****.*.*:*******************
AVAPLSKCRLRLLKLERVKDYLLMEEEFVVSQERLRPSEDKTEEDRSKVDDLRGTPMSVG
NVAPLSKCRLRLLKLERVKDYLLMEEEFVAAQERLRPTEDKTEEDRSKVDDLRGTPMSVG
TVTPSTKCKLRLLKLERIKDYLLMEEEFVANQERLKPQEEKAEEDRSKVDDLRGTPMSVG
*:* :**:********:***********. ****:* *:*:******************
SLEEIIDESHAIVSSSVGPEYYVGILSFVDKDQLEPGCAILMHNK0VLSVVGILQDEVDP
SLEEIIDESHAIVSSSVGPEYYVGILSFVDKDQLEPGCSILMHNK0VLSVVGILQDEVDP
NLEELIDENHAIVSSSVGPEYYVGILSFVDKDQLEPGCSILMHNK0VLSVVGILQDEVDP
.***:***.*****************************:****** **************
MVSVMKVEKAPLESYADIGGLDAQIQEIKEAVELPLTHPELYEDIGIRPPKGVILYGEPG
MVSVMKVEKAPLESYADIGGLDAQIQEIKEAVELPLTHPELYEDIGIRPPKGVILYGEPG
MVSVMKVEKAPLESYADIGGLEAQIQEIKEAVELPLTHPELYEDIGIKPPKGVILYGEPG
*********************:*************************:************
TGKTLLAK0AVANSTSATFLRVVGSELIQKYLGDGPKLVRELFRVADDLSPSIVFIDEID
TGKTLLAK0AVANSTSATFLRVVGSELIQKYLGDGPKLVRELFRVADELSPSIVFIDEID
TGKTLLAK0AVANSTSATFLRVVGSELIQKYLGDGPKLVRELFRVADDLSPSIVFIDEID
******** **************************************:************
AVGTK2RYDAHSGGEREIQRTMLELLNQLDGFDSRGDVKVILATNRIESLDPALLRPGRI
AVGTK~RYDAHSGGEREIQRTMLELLNQLDGFDSRGDVKVILATNRIESLDPALLRPGRI
AVGTK2RYDAHSGGEREIQRTMLELLNQLDGFDSRGDVKVILATNRIESLDPALLRPGRI
***** ******************************************************
DRKIEFPLPDIKTRRRIFQ0IHTSKMTLADDVNLEEFVMTKDEFSGADIKAICTEAGLLA
DRKIEFPLPDIKTRRRIFQ0IHTSKMTLADDVNLEEFVMTKDEFSGADIKAICTEAGLLA
DRKIEFPLPDIKTRRRIFQ0IHTSKMTLSEDVNLEEFVMTKDEFSGADIKAICTEAGLLA
******************* ********::******************************
LRERRMK0VTHADFKKAKEKVMFKKKEGVPEGLYM
LRERRMK0VTHADFKKAKEKVMFKKKEGVPEGLYM
LRERRMK0VTHPDFKKAKEKVMFKKKEGVPEGLYM
******* ***.***********************
Genome Biology 2006, Volume 7, Issue 5, Article R41 Lin et al. R41.5
comment reviews reports refereed researchdeposited research interactions information
Genome Biology 2006, 7:R41
(34 total introns) were investigated to determine the exonic
nucleotide composition flanking each pair of lost and retained
introns (Figure 5). We observed that the 4-mer usage flanking
all rice introns was dependent on intron phase (Additional
data file 4 and 5). For example, ACAA occurs at the exon
donor splice site 70, 17 and 110 times at phase 0, phase 1 and
phase 2, respectively. To determine if intron loss is independ-
ent of the nucleotide composition of the exon sequence flank-
ing introns, we compared the 4-mers flanking lost introns
with those flanking the corresponding retained introns, as
well as with the 4-mers flanking all rice introns. To this end,
the exonic 4-mers flanking the donor and acceptor splice sites
of the lost and retained introns were each attributed a rank,
with rank of 1 being the rarest, according to their frequency in
the sample of all rice introns (Tables 3 and 4; see Materials
and methods).
The sum of the ranks (SoR) of the exonic 4-mers flanking the
donor splice site of the lost introns (observed SoR = 6,737)
was very significantly lower than expected (expected SoR =
7,647; P approximately 0.0007), while that at the acceptor
site of the lost introns was within the average range (Table 5).
These results reveal a preponderance of rare 4-mers flanking
the 5' end of lost introns. This observation is further sup-
ported by the fact that the distribution of ranks of 4-mers
flanking the donor splice site in lost introns is significantly
Table 3
4-mer usage of exonic sequence at donor splice site of lost and corresponding retained introns
Intron lost Intron retained
Locus name* 4-mer
†
Rank
‡
Locus name
§
Phase 4-mer Rank
LOC_Os05g48520.1 CAAG 256 LOC_Os01g48540.1 0 CAAG 256
LOC_Os06g44300.1 CGAG 245 LOC_Os02g08230.1 0 CGAG 245
LOC_Os06g11920.1 CAAG 256 LOC_Os02g51600.1 0 CAAG 256
LOC_Os06g10850.1 GAGG 219 LOC_Os02g52830.1 0 CCAT 211
LOC_Os07g02440.1 CGAC 130 LOC_Os03g55420.1 0 CGAG 245
LOC_Os07g12340.1 CAGG 234 LOC_Os03g60080.1 0 CAGG 234
LOC_Os01g13130.1 CGCC 154 LOC_Os05g14240.1 0 CATG 244
LOC_Os11g01820.1 GCTC 103 LOC_Os05g39600.1 0 CATG 244
LOC_Os12g02840.1 CCTC 172 LOC_Os05g40650.1 0 CCTC 172
LOC_Os02g14430.1 CCAG 251 LOC_Os06g35480.1 0 CAAC 193
LOC_Os09g39720.1 GGAG 246 LOC_Os08g44590.1 0 GGAG 246
LOC_Os02g54640.1 GTTC 28 LOC_Os09g26160.1 0 TTTT 133
LOC_Os08g39370.1 CAAC 193 LOC_Os09g31130.1 0 CAAC 193
LOC_Os08g41880.1 CGAG 245 LOC_Os09g32840.1 0 TGAG 253
LOC_Os03g01820.1 GAGG 219 LOC_Os10g39810.1 0 CAAG 256
LOC_Os05g38420.1 TTCG 225 LOC_Os01g62490.1 1 TTCG 225
LOC_Os06g12960.1 GACG 228 LOC_Os02g50810.1 1 CACG 222
LOC_Os09g26160.1 CATC 54 LOC_Os02g54640.1 1 CACA 171
LOC_Os06g51050.1 ACCG 223 LOC_Os03g04060.1 1 ACAG 250
LOC_Os02g46780.1 GCCG 227 LOC_Os04g50770.1 1 GCAG 251
LOC_Os01g50760.1 GGAG 247 LOC_Os05g46580.1 1 GGAG 247
LOC_Os11g09020.1 GTCG 216 LOC_Os12g08090.1 1 ATCT 194
LOC_Os05g04690.1 CGTG 88 LOC_Os01g18400.1 2 CATG 237
LOC_Os05g48700.1 TGAG 246 LOC_Os01g55240.1 2 TCCG 222
LOC_Os05g39720.1 GGTG 115 LOC_Os01g61080.1 2 GATG 217
LOC_Os07g49280.1 CAAG 254 LOC_Os03g18140.1 2 CCCG 142
LOC_Os07g49150.1 AGAG 251 LOC_Os03g18690.1 2 AGAG 251
LOC_Os07g49000.1 GGAG 245 LOC_Os03g19200.1 2 GGAG 245
LOC_Os09g26360.1 GAAG 249 LOC_Os08g34910.1 2 GAAG 249
LOC_Os08g41730.1 GCGG 208 LOC_Os09g32800.1 2 GCGG 208
LOC_Os12g08090.1 TGCG 115 LOC_Os11g09020.1 2 TGCT 163
LOC_Os01g09540.1 TCGG 225 LOC_Os05g10210.1 2 ATGG 238
LOC_Os05g10210.1 TCCA 175 LOC_Os01g09540.1 2 TAAG 248
LOC_Os03g21820.1 GCCG 195 LOC_Os05g39990.1 2 GCAG 252
*Locus name of the rice gene model with intron loss.
†
The exonic 4-mer at the donor splice site of the lost intron was inferred from the pair-wise
alignment of the coding sequences as illustrated in Figure 5.
‡
Each 4-mer is associated with an intron phase-dependent rank ranging from 1 to 256
based on the frequency of occurrence calculated from exonic 4-mers at the exon-intron boundary of all 33,011 FLS introns.
§
The corresponding rice
duplicated gene with retained intron.
R41.6 Genome Biology 2006, Volume 7, Issue 5, Article R41 Lin et al. />Genome Biology 2006, 7:R41
lower than that in the corresponding retained introns (P <
0.013; Wilcoxon's signed rank test). The rank distributions of
4-mers flanking the acceptor splice site did not differ signifi-
cantly between lost and retained introns (P approximately
0.069).
Source of gained introns
Two out of the five gained introns showed several matches to
known rice transposon sequences. The intron of
LOC_Os12g02840.1 had a significant hit to a putative Ty1-
copia subclass retrotransposon protein (82% identity over the
entire intron). A large portion of the other gained intron
(LOC_Os12g37660.1; 430 bp out of 741 bp) was highly simi-
lar (92% identity) to Oryza sativa transposon Rim2-M341
(BK000935) [34]. To ascertain if any of the five gained
introns had inserted into other regions of the genome, we
searched the five gained introns against our set of 12
pseudomolecules. Three of the gained introns did not match
any sequence in the rice genome except itself. For the gained
intron in LOC_Os12g02840.1, three high quality matches
were detected: to the entire intron of LOC_Os11g03070 (98%
identity, putative function of sodium/hydrogen exchanger
family protein), which is another segmentally duplicated gene
of LOC_Os12g02840.1 from the 5 MYA duplication event;
82% identity to the entire intron of LOC_Os10g05450 (anno-
tated as a hypothetical protein); and 82% identity to the
entire intron of LOC_Os06g36500 (annotated as retrotrans-
poson protein, putative, Ty1-copia e subclass). For the second
gained intron (LOC_Os12g37660.1), a large portion (approx-
imately 400 bp) matched to numerous regions throughout
the pseudomolecules. Of the 64 top alignments to the gained
intron within LOC_Os12g37660.1 (approximately 95% iden-
tity, approximately 400 bp in length), 54 were in intergenic
regions and 10 were within introns of genes, all of which
lacked fl-cDNA support (3 hypothetical proteins, 3 expressed
proteins, 2 transposable-element related proteins, and 2
known proteins).
We examined these five cases of intron gain further by exam-
ining homologous genes from other plant species. With the
exception of one case, the gained intron was clearly a straight-
forward insertion into one of the rice gene pairs (Additional
data file 6). For LOC_Os3g16960.1, the gained intron was
observed in the maize and sorghum homologs, but absent in
the Arabidopsis and poplar homologs. Thus, the most parsi-
monious explanation for the data is a single insertion into one
of the rice duplicates prior to the divergence of rice, sorghum,
and maize (data not shown).
Discussion
Intron loss and gain are two important processes in evolution.
We observed more genes with intron loss than gain after seg-
mental duplication in rice. We estimated the rates of intron
loss and gain after the segmental genome duplication in rice.
Allowing p to be the proportion of non-conserved introns
between duplicated genes, we have p = 54/(137 + 958) =
0.0493, where 54 is the number of non-conserved introns,
137 is the total number of the aligned intron positions within
the 36 gene pairs that have intron loss and gain, and 958 is the
total number of aligned intron positions within the 197 con-
served gene pairs. Given that intron loss and acquisition are
rare events, the expected rate of intron loss and gain can be
estimated under the simple Poisson model and calculated as:
D
int
= -ln (1 - p) = 0.0506
Distribution of the sizes of the lost and gained intronsFigure 3
Distribution of the sizes of the lost and gained introns. Intron lengths were
binned into 100 bp bins and the number of lost and gained introns in each
bin was determined and plotted against the frequency of 33,011 FLS
introns within the rice genome.
0
2
4
6
8
10
12
14
100
200
30
0
40
0
50
0
600
700
800
900
1,00
0
1,100
1,200
1,300
Bin length (bp)
Number of introns
0
0.05
0.1
0.15
0.2
0.25
0.3
0.35
Frequency
lost introns
gained introns
FLS introns
1,400
Intron loss along the coding sequenceFigure 4
Intron loss along the coding sequence. The positions of the lost introns
were inferred from the retained intron of its corresponding duplicated
gene. The whole coding sequence was divided into 10 bins. The positions
of independently lost introns were placed into the corresponding bin and
plotted against the frequency of all 33,011 FLS introns within the rice
genome, which had been binned into the same 10 bins.
0
1
2
3
4
5
6
7
8
12345678910
Bin location
Number of lost introns
0.06
0.07
0.08
0.09
0.1
0.11
0.12
Frequency
lost introns
FLS introns
Genome Biology 2006, Volume 7, Issue 5, Article R41 Lin et al. R41.7
comment reviews reports refereed researchdeposited research interactions information
Genome Biology 2006, 7:R41
If we estimate t = 70 MYA for the rice genome duplication
[25,27], we estimate that the rate of intron gain and loss is:
µ = D
int
/2t = 0.0506/(2 × 70 × 10
6
) = 3.61 × 10
-10
per intron
per year
As a total of 49 lost introns and 5 gained introns were
observed, we estimated the evolutionary rate of intron loss
and intron gain after the genome duplication is:
µ
loss
= 3.61 × 10
-10
× 49/(49 + 5) = 3.28 × 10
-10
per intron per
year
µ
gain
= 3.61 × 10
-10
× 5(49 + 5) = 3.34 × 10
-11
per intron per year
A previous study involving 684 groups of orthologous genes
reported an intron loss rate in Arabidopsis of 2 to 3 × 10
-10
per
year and an intron gain rate of 2.2 to 2.9 × 10
-12
per year [16].
Our study, which involved segmentally duplicated genes
within rice, revealed a similar intron loss rate but a higher
intron gain rate, which may be reflective of the reduced evo-
lutionary pressure on duplicated genes. The detection of
transposon-related sequences in two of the five gained
introns suggests that transposable elements may have a role
in intron evolution and is consistent with the increased frac-
Table 4
4-mer usage of exonic sequence at acceptor splice site of lost and corresponding retained introns
Intron lost Intron retained
Locus name* 4-mer
†
Rank
‡
Locus name
§
Phase 4-mer Rank
LOC_Os05g48520.1 ACCG 53 LOC_Os01g48540.1 0 ATCG 186
LOC_Os06g44300.1 TACA 136 LOC_Os02g08230.1 0 TACA 136
LOC_Os06g11920.1 GGCT 183 LOC_Os02g51600.1 0 GGTT 222
LOC_Os06g10850.1 GCCA 206 LOC_Os02g52830.1 0 GTGA 255
LOC_Os07g02440.1 GGCT 183 LOC_Os03g55420.1 0 GGAT 201
LOC_Os07g12340.1 CTGG 176 LOC_Os03g60080.1 0 TTGG 169
LOC_Os01g13130.1 GCCA 206 LOC_Os05g14240.1 0 GCGA 178
LOC_Os11g01820.1 GTCG 204 LOC_Os05g39600.1 0 GGCG 152
LOC_Os12g02840.1 GCCG 143 LOC_Os05g40650.1 0 GCTG 251
LOC_Os02g14430.1 GGCT 183 LOC_Os06g35480.1 0 GGGT 178
LOC_Os09g39720.1 ATAC 194 LOC_Os08g44590.1 0 ATAT 215
LOC_Os02g54640.1 GTGT 243 LOC_Os09g26160.1 0 GCAT 223
LOC_Os08g39370.1 GTGC 246 LOC_Os09g31130.1 0 ATCA 230
LOC_Os08g41880.1 ATGA 214 LOC_Os09g32840.1 0 ATGA 214
LOC_Os03g01820.1 GCGG 173 LOC_Os10g39810.1 0 ATGG 232
LOC_Os05g38420.1 GCGA 205 LOC_Os01g62490.1 1 GCGA 205
LOC_Os06g12960.1 AGGT 156 LOC_Os02g50810.1 1 AGGT 156
LOC_Os09g26160.1 GGCA 229 LOC_Os02g54640.1 1 AGGA 226
LOC_Os06g51050.1 GCGG 156 LOC_Os03g04060.1 1 GTGG 255
LOC_Os02g46780.1 GATT 244 LOC_Os04g50770.1 1 GTTT 251
LOC_Os01g50760.1 GAAA 246 LOC_Os05g46580.1 1 GGAA 247
LOC_Os11g09020.1 CCAA 156 LOC_Os12g08090.1 1 CCAA 156
LOC_Os05g04690.1 GAAC 235 LOC_Os01g18400.1 2 GAAC 235
LOC_Os05g48700.1 GGCG 189 LOC_Os01g55240.1 2 GGCC 158
LOC_Os05g39720.1 GAGG 218 LOC_Os01g61080.1 2 GAGG 218
LOC_Os07g49280.1 CTTC 163 LOC_Os03g18140.1 2 GTTC 251
LOC_Os07g49150.1 GTAC 255 LOC_Os03g18690.1 2 GTAT 256
LOC_Os07g49000.1 GTAC 255 LOC_Os03g19200.1 2 GTAC 255
LOC_Os09g26360.1 GTAC 255 LOC_Os08g34910.1 2 GTAC 255
LOC_Os08g41730.1 CACG 97 LOC_Os09g32800.1 2 GACG 158
LOC_Os12g08090.1 CGCC 18 LOC_Os11g09020.1 2 GGCG 189
LOC_Os01g09540.1 GTAC 255 LOC_Os05g10210.1 2 AACT 134
LOC_Os05g10210.1 GCCT 182 LOC_Os01g09540.1 2 GTCG 194
LOC_Os03g21820.1 CGTG 153 LOC_Os05g39990.1 2 GGTG 233
*Locus name of the rice gene model with intron loss.
†
The exonic 4-mer at the acceptor splice site of the lost intron was inferred from the pair-wise
alignment of the coding sequences as illustrated in Figure 5.
‡
Each 4-mer is associated with an intron phase-dependent rank ranging from 1 to 256 as
its based on the frequency of occurrence calculated from exonic 4-mers at the exon-intron boundary of all 33,011 FLS introns.
§
The corresponding
rice duplicated gene with retained intron.
R41.8 Genome Biology 2006, Volume 7, Issue 5, Article R41 Lin et al. />Genome Biology 2006, 7:R41
tion of transposable elements in the rice genome compared to
Arabidopsis [21].
It is possible that the rate of intron loss and gain differs within
our set of segmentally duplicated genes as it has been
previously reported that the segmental duplication between
the top arms of chromosomes 11 and 12 is recent (within 5
MYA) in comparison to the bulk of the segmental duplication,
estimated at 70 MYA [25,27]. Thus, we determined the d
S
for
the 233 gene pairs that had a single isoform, were supported
by a fl-cDNA, and had been manually validated (197 gene
pairs with congruent intron structure and 36 gene pairs with
intron loss and/or intron gain). The d
S
values ranged from
0.03 to 24.86 with a clear peak between 0.6 to 1.4 (data not
shown). Similar rates of intron loss (1.41 × 10
-10
per intron per
year) and intron gain (0.94 × 10
-11
per intron per year) were
obtained from the calculations performed using a subset of
the 233 gene pairs in which the d
S
between duplicates was
between 0.6 and 1.4 (117 pairs total with four gene pairs orig-
inating from the top arms of chromosomes 11 and 12).
A reverse transcriptase-mediated model in which a segment
of the genomic copy of a gene can be replaced by a reverse-
transcribed copy via homologous recombination was previ-
ously proposed to explain the pattern of intron loss [3,35,36]
and has been further supported by recent genomic analysis of
several species [5,6,15]. The 3' end bias of intron loss is
important evidence for this model as reverse transcriptase is
error-prone and, as a consequence, a high frequency of 5'-
truncated cDNA fragments are generated. Although we did
not observe a 3' end preference of intron loss, we did find
examples of multiple consecutive intron loss at the 3' end of
genes and even loss of all the introns, which is consistent with
the reverse-transcriptase-mediated model. Lack of power due
to a small sample size (34 lost introns) might be one explana-
tion for the lack of evidence for a 3' bias of intron loss in rice.
Another explanation may be the unusual intron distribution
pattern, which is similar to that of Arabidopsis (data not
shown) in which there is no 5' bias in intron location within
single-intron genes [4]. The other explanation is that the
reverse-transcriptase-mediated model may not be the only
mechanism for intron loss in rice and that intron loss may
occur via genomic deletion as proposed by Cho et al. [37], who
observed no intron loss bias at the 3' end of genes in
Caenorhabditis. However, according to the genomic deletion
model, we would expect some instances of imprecise deletion
of introns, which is not the case in our sample. Therefore, an
unknown recognition signal may exist that allows the exact
deletion of introns in rice.
We did not observe any statistically significant differences in
the frequency of intron losses in different phases. Nor did
examination of nucleotide compositional patterns in the
exons surrounding the splicing site reveal an apparent
pattern in the bi-nucleotide sequence of the exon at the
boundary other than that shown by canonical splice site con-
sensus sequence (AG|GT) in which '|' represents the intron
position (data not shown). Yet conservation of the exon nucle-
otides adjacent to the exon-intron boundary has been
reported to play an important role in correct splicing [38-40].
Within the four nucleotides at the donor splice site, we
observed that the exon boundary of lost introns had less fre-
quently used 4-mers than their corresponding retained
introns, as well as relative to the sample of all approximately
33,000 introns. Thus, genes with less common exonic
sequence at the donor site may experience splicing inaccuracy
and inefficiency and, consequently, intron loss at these posi-
tions may be strongly favored by selection. Alternatively, it is
possible that the less common 4-mers reflect exonic
sequences more prone to direct intron loss, in the case of the
genomic deletion model. Since we did not have a large sample
for each intron phase, our data were insufficient to draw a
correlation between intron loss rate at each phase and the
nucleotide composition of the flanking exonic sequence.
Conclusion
We were able to document intron loss and gain in segmentally
duplicated rice genes with a rate of loss and gain similar to
that observed within orthologous genes across a range of
eukaryotes. While we did not observe preferential intron loss
at the 3' end of genes, we did observe a nucleotide bias within
the exonic sequence flanking the lost introns.
Table 5
Sum of the ranks of the exonic 4-mers at the donor and acceptor splice site of lost introns and simulated introns
Sum of the ranks
Donor site Acceptor site
Lost introns* 6,737 6,410
Simulation average
†
(std) 7,647 (253) 6,679 (337)
P value of lost introns
‡
0.0007 >0.05
*Sum of the ranks of the exonic 4-mers at the donor and acceptor splice site of the 34 lost introns.
†
A total of 10,000 iterations were generated. In
each iteration, a total of 34 ranks were randomly generated according to the frequencies obtained from all the exonic 4-mers at the exon-intron
boundaries of 33,011 FLS introns. Standard deviation is listed in the parenthesis.
‡
The P value for the sums of the ranks of the donor and acceptor
splice site.
Genome Biology 2006, Volume 7, Issue 5, Article R41 Lin et al. R41.9
comment reviews reports refereed researchdeposited research interactions information
Genome Biology 2006, 7:R41
Materials and methods
Identification of segmentally duplicated genes
A total of 43,719 non-transposable element-related rice pro-
tein sequences from release 3 of the TIGR Rice Genome
Annotation [22] were used to identify segmental duplication
in rice using an all versus all BLAST search (WU-BLASTP,
parameters "V = 5 B = 5 E = 1e-10 - filter seg) [41]. As alterna-
tive splicing occurs in rice and some genes have multiple
splice forms, the largest peptide sequence was used whenever
alternative isoforms existed. Repetitive matches were filtered
using perl scripts to remove low scoring matches within mul-
tiple alignment regions that were defined by a high-scoring
segment pair within 50 kb. Segmentally duplicated blocks
were identified using DAGchainer [42] with parameters '-s -I
-D 200000'. which primarily includes self comparisons,
ignores tandem duplication alignments, and sets the maxi-
mum distance allowed between two collinear gene pairs to
200 kb. A minimum of six gene pairs was used to define a
block.
Identification of congruent and incongruent introns
Duplicated genes with at least one intron were checked to
ensure that they were supported by a fl-cDNA and that no
alternative isoforms existed. Intron positions and phases
were retrieved from the TIGR Osa1 genome annotation data-
base [22]. ClustalW [43,44] with default parameter settings
was run for each pair to obtain a global alignment. Intron
positions and phases were then inserted into the ClustalW
alignment using perl scripts. Alignments with incongruent
exon-intron structure were manually checked to ensure the
introns were supported by reliable alignments. For the ten
amino acids flanking the splice site (five amino acids on each
side), we required that at a minimum, three amino acids had
to be identical and that approximately 60% similarity was
observed.
Identification of intron loss and intron gain
Simple phylogeny analysis was used to determine if the
incongruent exon-intron structure was attributable to loss or
gain of an intron. We identified putative orthologous genes by
searching the predicted Arabidopsis proteome (TIGR release
5, [45]) with the predicted rice proteome using blastp (E-
value < 1e-10) and selecting the reciprocal best hit. In the
event we did not identify an ortholog in Arabidopsis via the
reciprocal top match method, we used the best Arabidopsis
match. Using the Arabidopsis genes as the outgroup, we
aligned the rice duplicated gene models to the orthologous
Arabidopsis gene model. ClustalW with default parameter
settings was run for each triplet (the two rice gene models and
their putative Arabidopsis ortholog) and intron positions and
phases were inserted into the ClustalW alignment (Additional
data file 3). Only loss or gain of introns after segmental dupli-
cation was examined further. An intron loss was defined if the
intron was present at the same position in only a single rice
gene and the putative Arabidopsis ortholog (referred to as a
retained intron). An intron gain was defined if the intron was
present in single rice gene but absent in the other rice paralog
and the putative Arabidopsis ortholog.
Randomization test for intron loss rate at phase 0, 1, 2
A total of 233 pairs of duplicated genes, among which 197
pairs have completely conserved introns and 36 pairs show
putative loss and gain of introns, were used in our randomi-
zation test. The total number of conserved intron alignment
positions at each phase was counted (P0, 580; P1, 236; P2,
225). The total number of independently lost introns at each
phase was counted (P0, 15; P1, 7; P2, 12). A total of 10,000
iterations were simulated. A total of 34 phases were randomly
generated in each iteration based on the frequencies of the
conserved aligned intron positions at each phase from the 233
gene pairs. The number of lost introns at each phase was then
compared with those generated by simulation.
Nucleotide composition of exonic sequences flanking
lost introns, retained introns, and all introns
To determine whether lost introns in duplicated rice genes
tend to be flanked by rare nucleotide combinations, we com-
pared the frequency distribution of the four nucleotides (4-
mers) in the exonic sequence that flanked lost introns with
the exonic 4-mers flanking the corresponding retained
introns, as well as with the frequency distribution of the 4-
mers flanking all introns in the genome. Comparisons were
done independently for 4-mers flanking the donor and the
acceptor ends of introns. The small number of lost introns,
distributed over three intron phases (34 introns, of which 15,
7 and 12 were from phases 0, 1 and 2, respectively) relative to
the total number of 4-mer classes (4
4
= 256) precludes effec-
tive use of standard tests, such as the chi-square test, to com-
pare the distributions. Instead, tests based on rank
distributions were used as described below.
Extraction of the exonic 4-mers at the donor and acceptor splice sites of lost and retained intronsFigure 5
Extraction of the exonic 4-mers at the donor and acceptor splice sites of
lost and retained introns. Duplicated rice gene 1 with a single exon and
rice gene 2 and Arabidopsis orthologous gene with two exons and a single
intron are shown in colored rectangles. Dashed lines indicate similar
regions. Phylogeny analysis with Arabidopsis suggests an intron was lost in
rice gene 1. The red ovals show the 4-mers extracted for SoR analysis.
Exon 1
Exon 1 Exon 2
Rice gene 1
Rice gene 2
Exon 1 Exon 2
Arabidopsis
R41.10 Genome Biology 2006, Volume 7, Issue 5, Article R41 Lin et al. />Genome Biology 2006, 7:R41
Comparison of 4-mers flanking lost introns versus all introns
A total of 33,011 introns within the coding regions from 6,046
rice gene models that were supported with fl-cDNA, had no
alternative splicing isoform, and had at least one intron
within the CDS were used to determine the 4-mer distribution
in exonic sequences that flank the introns. The four nucle-
otides that flank the donor and acceptor splice sites of each
intron were extracted and their frequency calculated. For
each intron phase, each 4-mer was given a rank between 1 and
256, to cover all of the 4
4
nucleotide combinations, with the
lowest frequency having the smallest rank (rank = 1). In this
way, three rank distributions, one for each intron phase 0, 1
and 2, and their attached frequency distributions, were gen-
erated for each the donor and the acceptor flanking regions.
We devised a statistic that we call 'sum of ranks', SoR, to
determine if the 4-mers flanking lost introns are less common
than expected by chance. This statistic SoR corresponds to
the sum of the ranks of all introns in a sample, as determined
by their nucleotide composition and phase. The test was con-
ducted as follows: 10,000 pseudo-replicates were generated
by randomly sampling the three rank distribution obtained
for all introns, according to their frequency distribution (that
is, each rank was selected with probability equal to its
frequency). Each pseudo-replicate consisted of 34 sampled
introns, 15, 7 and 12 of which were sampled from the rank dis-
tribution of phase 0, 1, and 2 introns, respectively, to preserve
the characteristics of the observed distribution of lost introns.
A SoR value was obtained for each pseudo-replicate to gener-
ate the distribution of expected 'sum of ranks'. The SoR for
the 34 lost introns was compared against this distribution to
determine the probability P of obtaining this value by chance.
P is approximately equal to the fraction of pseudo-replicated
with a smaller or equal SoR value.
Comparison of 4-mers flanking lost introns versus retained introns, in
the corresponding duplicate gene
A rank was attributed to each lost intron, based on the com-
position of its 4-mer and its intron phase, according to the
rank distributions obtained for all 33,011 introns (see above),
to obtain a distribution of ranks for the set of lost introns. A
distribution of ranks for the set of retained introns was
obtained in a similar way. The two distributions were com-
pared using a Wilcoxon's signed rank test. This procedure was
done for both donor and acceptor flanking sequences.
Identification of the source elements of gained introns
Sequences of the five gained introns were searched against
the NCBI non-redundant database and were further searched
against all the 12 rice pseudomolecules [22]. Significant hits
were manually checked. For each case of a gained intron, we
examined homologous proteins from three plant species with
substantial genome sequence: maize, sorghum, and poplar.
Using the protein sequences of the ten rice genes with gained
introns, we searched the TIGR Assembled Zea Mays (AZMs)
sequences, which are assemblies of gene enrichment
sequences [46,47], TIGR Assembled Sorghum Bicolor (ASBs)
which are assemblies of gene enrichment reads from sorghum
[48], and contigs from the poplar genome project [49]. All of
the top hits from maize and sorghum had >70% similarity at
the protein level with the rice proteins. Gene models were
predicted by running the ab initio gene finder FGENESH [50]
on the maize, sorghum and poplar genomic sequences. We
used ClustalW with default parameter settings to align the six
proteins (two rice proteins and the homologous proteins from
Arabidopsis, maize, sorghum and poplar) and inserted the
intron positions/phases into the ClustalW alignment.
Determination of substitutions per site
The number of synonymous substitutions per synonymous
site (d
S
) between each of the two rice duplicates was esti-
mated by maximum likelihood, using the codon-based substi-
tution model of Yang et al. [51] as implemented in codeml of
PAML, version 3.15 [51,52]. Codeml was run using in pairwise
mode (runmode = -2), with codon equilibrium frequencies
estimated from average nucleotide frequencies at each codon
position (codonFreq = 2). Given the estimated age of approx-
imately 70 MYA for the polyploidization event in rice [25],
and the estimated substitution rate in synonymous sites of
approximately 6.5 × 10
-9
/site/year [53], rice paralogs result-
ing from this polyploidization event are expected to differ on
average by approximately 0.9 synonymous substitution per
site.
Additional data files
The following additional data are available with the online
version of this paper. Additional data file 1 lists the segmen-
tally duplicated blocks within the rice genome. Additional
data file 2 lists 3,101 pairs of segmentally duplicated genes
along with their pairings and their sequence. Additional data
file 3 shows the ClustalW alignment of the two rice duplicated
genes and their orthologous gene from Arabidopsis. Addi-
tional data file 4 lists the occurrence of background exonic 4-
mers at the donor splice sites of different intron phase. Addi-
tional data file 5 lists the occurrence of background exonic 4-
mer at the acceptor splice sites of different intron phase.
Additional data file 6 shows the ClustalW alignment of the
two rice duplicated proteins with putative orthologous pro-
teins from Arabidopsis, poplar, maize and sorghum.
Additional File 1The segmentally duplicated blocks within the rice genomeThe segmentally duplicated blocks within the rice genome.Click here for fileAdditional File 2The 3,101 pairs of segmentally duplicated genes along with their pairings and their sequenceThe 3,101 pairs of segmentally duplicated genes along with their pairings and their sequence.Click here for fileAdditional File 3The ClustalW alignment of the two rice duplicated genes and their orthologous gene from ArabidopsisThe ClustalW alignment of the two rice duplicated genes and their orthologous gene from Arabidopsis.Click here for fileAdditional File 4The occurrence of background exonic 4-mers at the donor splice sites of different intron phaseThe occurrence of background exonic 4-mers at the donor splice sites of different intron phase.Click here for fileAdditional File 5The occurrence of background exonic 4-mer at the acceptor splice sites of different intron phaseThe occurrence of background exonic 4-mer at the acceptor splice sites of different intron phase.Click here for fileAdditional File 6The ClustalW alignment of the two rice duplicated proteins with putative orthologous proteins from Arabidopsis, poplar, maize and sorghumThe ClustalW alignment of the two rice duplicated proteins with putative orthologous proteins from Arabidopsis, poplar, maize and sorghum.Click here for file
Acknowledgements
This work was supported by a National Science Foundation Plant Genome
Research Program grant to C.R.B. (DBI-0321538).
References
1. Fedorov A, Merican AF, Gilbert W: Large-scale comparison of
intron positions among animal, plant, and fungal genes. Proc
Natl Acad Sci USA 2002, 99:16128-16133.
2. Rogozin IB, Wolf YI, Sorokin AV, Mirkin BG, Koonin EV: Remarka-
ble interkingdom conservation of intron positions and mas-
sive, lineage-specific intron loss and gain in eukaryotic
Genome Biology 2006, Volume 7, Issue 5, Article R41 Lin et al. R41.11
comment reviews reports refereed researchdeposited research interactions information
Genome Biology 2006, 7:R41
evolution. Curr Biol 2003, 13:1512-1517.
3. Fink GR: Pseudogenes in yeast? Cell 1987, 49:5-6.
4. Sakurai A, Fujimori S, Kochiwa H, Kitamura-Abe S, Washio T, Saito
R, Carninci P, Hayashizaki Y, Tomita M: On biased distribution of
introns in various eukaryotes. Gene 2002, 300:89-95.
5. Roy SW, Gilbert W: Complex early genes. Proc Natl Acad Sci USA
2005, 102:1986-1991.
6. Sverdlov AV, Babenko VN, Rogozin IB, Koonin EV: Preferential loss
and gain of introns in 3' portions of genes suggests a reverse-
transcription mechanism of intron insertion. Gene 2004,
338:85-91.
7. Nielsen CB, Friedman B, Birren B, Burge CB, Galagan JE: Patterns of
intron gain and loss in fungi. PLoS Biol 2004, 2:e422.
8. Fedorov A, Suboch G, Bujakov M, Fedorova L: Analysis of nonuni-
formity in intron phase distribution. Nucleic Acids Res 1992,
20:2553-2557.
9. Long M, de Souza SJ, Gilbert W: Evolution of the intron-exon
structure of eukaryotic genes. Curr Opin Genet Dev 1995,
5:774-778.
10. Tomita M, Shimizu N, Brutlag DL: Introns and reading frames:
correlation between splicing sites and their codon positions.
Mol Biol Evol 1996, 13:1219-1223.
11. Gilbert W: The exon theory of genes. Cold Spring Harb Symp
Quant Biol 1987, 52:901-905.
12. Gilbert W, Glynias M: On the ancient nature of introns. Gene
1993, 135:137-144.
13. Qiu WG, Schisler N, Stoltzfus A: The evolutionary gain of spli-
ceosomal introns: sequence and phase preferences. Mol Biol
Evol 2004, 21:1252-1263.
14. Coghlan A, Wolfe KH: Origins of recently gained introns in
Caenorhabditis. Proc Natl Acad Sci USA 2004, 101:11362-11367.
15. Roy SW, Fedorov A, Gilbert W: Large-scale comparison of
intron positions in mammalian genes shows intron loss but
no gain. Proc Natl Acad Sci USA 2003, 100:7158-7162.
16. Roy SW, Gilbert W: Rates of intron loss and gain: implications
for early eukaryotic evolution. Proc Natl Acad Sci USA 2005,
102:5773-5778.
17. Roy SW, Gilbert W: The pattern of intron loss. Proc Natl Acad Sci
USA 2005, 102:713-718.
18. Fedorov A, Roy S, Fedorova L, Gilbert W: Mystery of intron gain.
Genome Res 2003, 13:2236-2241.
19. Babenko VN, Rogozin IB, Mekhedov SL, Koonin EV: Prevalence of
intron gain over intron loss in the evolution of paralogous
gene families. Nucleic Acids Res 2004, 32:3724-3733.
20. Sverdlov AV, Rogozin IB, Babenko VN, Koonin EV: Conservation
versus parallel gains in intron evolution. Nucleic Acids Res 2005,
33:1741-1748.
21. International Rice Genome Sequencing Project: The map-based
sequence of the rice genome. Nature 2005, 436:793-800.
22. Yuan Q, Ouyang S, Wang A, Zhu W, Maiti R, Lin H, Hamilton J, Haas
B, Sultana R, Cheung F, et al.: The Institute for Genomic
Research Osa1 rice genome annotation database. Plant Physiol
2005, 138:18-26.
23. Wolfe KH, Gouy M, Yang YW, Sharp PM, Li WH: Date of the
monocot-dicot divergence estimated from chloroplast DNA
sequence data. Proc Natl Acad Sci USA 1989, 86:6201-6205.
24. Crane PR, Friis EM, Pedersen KR: The origin and early diversifi-
cation of angiosperms. Nature 2002, 374:27-33.
25. Paterson AH, Bowers JE, Chapman BA: Ancient polyploidization
predating divergence of the cereals, and its consequences for
comparative genomics. Proc Natl Acad Sci USA 2004,
101:9903-9908.
26. Vandepoele K, Simillion C, Van de Peer Y: Evidence that rice and
other cereals are ancient aneuploids. Plant Cell 2003,
15:2192-2202.
27. Wang X, Shi X, Hao B, Ge S, Luo J: Duplication and DNA seg-
mental loss in the rice genome: implications for
diploidization. New Phytol 2005, 165:937-946.
28. Simillion C, Vandepoele K, Saeys Y, Van de Peer Y: Building
genomic profiles for uncovering segmental homology in the
twilight zone. Genome Res 2004, 14:1095-1106.
29. Guyot R, Keller B: Ancestral genome duplication in rice.
Genome 2004, 47:610-614.
30. Castillo-Davis CI, Bedford TB, Hartl DL: Accelerated rates of
intron gain/loss and protein evolution in duplicate genes in
human and mouse malaria parasites. Mol Biol Evol 2004,
21:1422-1427.
31. Logsdon JM Jr: The recent origins of spliceosomal introns
revisited. Curr Opin Genet Dev 1998, 8:637-648.
32. Logsdon JM Jr: Worm genomes hold the smoking guns of
intron gain. Proc Natl Acad Sci USA 2004, 101:11195-11196.
33. Long M, Deutsch M: Association of intron phases with conser-
vation at splice site sequences and evolution of spliceosomal
introns. Mol Biol Evol 1999, 16:1528-1534.
34. Wang GD, Tian PF, Cheng ZK, Wu G, Jiang JM, Li DB, Li Q, He ZH:
Genomic characterization of Rim2/Hipa elements reveals a
CACTA-like transposon superfamily with unique features in
the rice genome. Mol Genet Genomics 2003, 270:234-242.
35. Bernstein LB, Mount SM, Weiner AM: Pseudogenes for human
small nuclear RNA U3 appear to arise by integration of self-
primed reverse transcripts of the RNA into new chromo-
somal sites. Cell 1983, 32:461-472.
36. Lewin R: How mammalian RNA returns to its genome. Science
1983, 219:1052-1054.
37. Cho S, Jin SW, Cohen A, Ellis RE: A phylogeny of Caenorhabditis
reveals frequent loss of introns during nematode evolution.
Genome Res 2004, 14:1207-1220.
38. Seraphin B, Rosbash M: Exon mutations uncouple 5' splice site
selection from U1 snRNA pairing. Cell 1990, 63:619-629.
39. Treisman R, Proudfoot NJ, Shander M, Maniatis T: A single-base
change at a splice site in a beta 0-thalassemic gene causes
abnormal RNA splicing. Cell 1982, 29:903-911.
40. Jacobsen SE, Binkowski KA, Olszewski NE: SPINDLY, a tetratr-
icopeptide repeat protein involved in gibberellin signal trans-
duction in Arabidopsis. Proc Natl Acad Sci USA 1996, 93:9292-9296.
41. Washington University BLAST Archives [http://
blast.wustl.edu]
42. Haas BJ, Delcher AL, Wortman JR, Salzberg SL: DAGchainer: a tool
for mining segmental genome duplications and synteny. Bio-
informatics 2004, 20:3643-3646.
43. Chenna R, Sugawara H, Koike T, Lopez R, Gibson TJ, Higgins DG,
Thompson JD: Multiple sequence alignment with the Clustal
series of programs. Nucleic Acids Res 2003, 31:3497-3500.
44. Thompson JD, Higgins DG, Gibson TJ: CLUSTAL W: improving
the sensitivity of progressive multiple sequence alignment
through sequence weighting, position-specific gap penalties
and weight matrix choice. Nucleic Acids Res 1994, 22:4673-4680.
45. The TIGR Arabidopsis thaliana Database [ />tdb/e2k1/ath1/]
46. Whitelaw CA, Barbazuk WB, Pertea G, Chan AP, Cheung F, Lee Y,
Zheng L, van Heeringen S, Karamycheva S, Bennetzen JL, et al.:
Enrichment of gene-coding sequences in maize by genome
filtration. Science 2003, 302:2118-2120.
47. The TIGR Maize Database [ />48. TIGR Assembled Sorghum Bicolor [ />MAIZE/Sorghum_assembly/ASB.gz]
49. The JGI Populus trichocarpa Genome WebSite [http://
genome.jgi-psf.org/Poptr1/Poptr1.home.html]
50. Salamov AA, Solovyev VV: Ab initio gene finding in Drosophila
genomic DNA. Genome Res 2000, 10:516-522.
51. Yang Z, Nielsen R, Hasegawa M: Models of amino acid substitu-
tion and applications to mitochondrial protein evolution.
Mol Biol Evol 1998, 15:1600-1611.
52. Yang Z: PAML: a program package for phylogenetic analysis
by maximum likelihood. Comput Appl Biosci 1997, 13:555-556.
53. Gaut BS, Morton BR, McCaig BC, Clegg MT: Substitution rate
comparisons between grasses and palms: synonymous rate
differences at the nuclear gene Adh parallel rate differences
at the plastid gene rbcL. Proc Natl Acad Sci USA 1996,
93:10274-10279.