Báo cáo y học: "The gain and loss of genes during 600 million years of vertebrate evolution" pps
Bạn đang xem bản rút gọn của tài liệu. Xem và tải ngay bản đầy đủ của tài liệu tại đây (343.64 KB, 12 trang )
Genome Biology 2006, 7:R43
comment reviews reports deposited research refereed research interactions information
Open Access
2006Blommeet al.Volume 7, Issue 5, Article R43
Research
The gain and loss of genes during 600 million years of vertebrate
evolution
Tine Blomme, Klaas Vandepoele, Stefanie De Bodt, Cedric Simillion,
Steven Maere and Yves Van de Peer
Address: Department of Plant Systems Biology, Flanders Interuniversity Institute for Biotechnology (VIB), Ghent University, Technologiepark,
B-9052 Ghent, Belgium.
Correspondence: Yves Van de Peer. Email:
© 2006 Blomme et al.; licensee BioMed Central Ltd.
This is an open access article distributed under the terms of the Creative Commons Attribution License ( which
permits unrestricted use, distribution, and reproduction in any medium, provided the original work is properly cited.
Gene duplication in vertebrate evolution<p>Phylogenetic analysis of gene gain and loss during vertebrate evolution provides evidence for the importance of early gene or genome duplication events in evolution of complex vertebrates.</p>
Abstract
Background: Gene duplication is assumed to have played a crucial role in the evolution of
vertebrate organisms. Apart from a continuous mode of duplication, two or three whole genome
duplication events have been proposed during the evolution of vertebrates, one or two at the dawn
of vertebrate evolution, and an additional one in the fish lineage, not shared with land vertebrates.
Here, we have studied gene gain and loss in seven different vertebrate genomes, spanning an
evolutionary period of about 600 million years.
Results: We show that: first, the majority of duplicated genes in extant vertebrate genomes are
ancient and were created at times that coincide with proposed whole genome duplication events;
second, there exist significant differences in gene retention for different functional categories of
genes between fishes and land vertebrates; third, there seems to be a considerable bias in gene
retention of regulatory genes towards the mode of gene duplication (whole genome duplication
events compared to smaller-scale events), which is in accordance with the so-called gene balance
hypothesis; and fourth, that ancient duplicates that have survived for many hundreds of millions of
years can still be lost.
Conclusion: Based on phylogenetic analyses, we show that both the mode of duplication and the
functional class the duplicated genes belong to have been of major importance for the evolution of
the vertebrates. In particular, we provide evidence that massive gene duplication (probably as a
consequence of entire genome duplications) at the dawn of vertebrate evolution might have been
particularly important for the evolution of complex vertebrates.
Background
The sequencing of vertebrate genomes occurs at an ever-
increasing pace. Currently, the genome sequences, or at least
first drafts thereof, are available for more than 14 different
vertebrate species, while many more are underway. These
vertebrate genome sequences cover a phylogenetic distance
of more than 450 million years of evolution, dating back as far
as the split between fishes and land vertebrates. Unfortu-
nately, genome sequences of cartilaginous fish such as sharks,
rays or skates, or of jawless vertebrates such as lampreys and
Published: 24 May 2006
Genome Biology 2006, 7:R43 (doi:10.1186/gb-2006-7-5-r43)
Received: 10 February 2006
Revised: 27 March 2006
Accepted: 3 May 2006
The electronic version of this article is the complete one and can be
found online at />R43.2 Genome Biology 2006, Volume 7, Issue 5, Article R43 Blomme et al. />Genome Biology 2006, 7:R43
hagfish, which diverged well before that time, are not availa-
ble yet.
Based on rather inaccurate indicators such as genome size
and isozyme complexity, Ohno already suggested in 1970 that
the genomes of (early) vertebrates have been shaped by two
whole genome duplications (WGDs) [1]. More than 20 years
later, important indications for two rounds (1R/2R) of large-
scale gene duplications in early vertebrate evolution came
from the analysis of Hox genes and Hox gene clusters [2-4].
Since then, the 2R hypothesis has been heavily debated, and
several modifications have been proposed, assuming a diver-
sity of small and large scale gene duplication events (reviewed
in [5]). Based on quadruplicate paralogy between different
genomic segments [6-8], or a large increase in the number of
new duplicated genes at the dawn of vertebrate evolution
about 600 million years ago (MYA) [9], some have indeed
strongly argued for two rounds of genome duplications, pos-
sibly in very short succession [10,11]. Others, often analyzing
the same data but using different techniques, found only clear
evidence for one genome-doubling event [12-14]. Still others
have rejected whole genome duplications in vertebrates all
together and only accept a continuous rate of gene duplica-
tion [15,16]. Recently, additional evidence for two rounds of
whole genome duplications was presented [17], combining
data from gene families, phylogenetic trees, and genomic map
position. In particular, when examining the genomic map
position of those genes in the human genome that can be
traced back to a duplication event at the base of vertebrates, a
clear pattern of tetra-paralogy emerges, making a convincing
case for 1R/2R.
Whole genome duplication events shaping the genomes of
vertebrates have not only been proposed in the early evolu-
tion of vertebrates, but also in the stem lineage of ray-finned
(actinopterygian) fishes, after their divergence from the land
vertebrates. Again, the first strong indications for a fish-spe-
cific genome duplication (FSGD) [18] came from studies
based on Hox genes and Hox clusters. Extra Hox gene clusters
discovered in the zebrafish (Danio rerio) [19], medaka
(Oryzias latipes) [20], the African cichlid (Oreochromis nilo-
ticus) [21], and the pufferfish (Takifugu rubripes) [22], sug-
gested an additional genome duplication in ray-finned fishes
(Actinopterygii) before the divergence of most teleost species.
Comparative genomic studies have also revealed many more
genes and gene clusters for which two copies exist in teleost
fishes but only one cognate copy in other vertebrates. The
observations that different paralogs are found on different
linkage groups and show synteny with other duplicated chro-
mosomal regions [23] and that many paralogous pairs seem
to have originated at about the same time [9,24] support the
hypothesis that these genes arose through a complete genome
duplication event during the evolution of the actinopterygian
lineage. Both Vandepoele et al. [9] and Christoffels et al. [24]
identified duplicated genes in Takifugu and estimated that
3R took place about 320 to 350 MYA. The split between ray-
finned fishes and land vertebrates, dated at 450 MYA, was
used as a calibration point for the dating of the gene duplica-
tion events in fishes. However, the most conclusive evidence
for a complete genome duplication in ray-finned fishes came
from the comparative analyses of the recently determined
Tetraodon genome sequence and the human genome
sequence [25]. Jaillon et al. [25] compared the chromosomal
distribution of genes of Tetraodon with those in human and
observed that many incidents of human synteny segments
were found in duplicate on two different Tetraodon chromo-
somes.
Apart from a continuous creation of genes [26] through
small-scale gene duplication events such as unequal crossing-
over or reverse transcription, vertebrate genomes have thus
most probably been shaped by two or more WGD events. As a
matter of fact, it is even very tempting to speculate that verte-
brates as we know them today might not have existed if it
were not for these major duplication events [1,27,28]. Simi-
larly, the fish-specific genome duplication might have con-
tributed to the biological diversification of ray-finned fishes
[18], although others reject such a hypothesis [29]. Neverthe-
less, a recent paper by Scannell et al. [30] suggests a clear link
between genome duplication and speciation in yeasts, and
also in plants, genome-wide duplication events have been
associated with speciation and adaptive radiations [31-33].
Here, we report on gene gain and loss in seven different ver-
tebrate genomes, namely human, mouse, rat, chicken, frog,
zebrafish and pufferfish. The aims of our study were: to deter-
mine in which part of the vertebrate tree gene duplication and
gene loss have been the most extensive; to investigate
whether there is a bias in gene loss towards the functional
class duplicated genes belong to and whether this is corre-
lated with the mode of duplication (small-scale versus large-
scale); and to speculate on the importance of these events for
the evolution of vertebrates in general.
Results and discussion
The current composition of vertebrate proteomes is, to a large
extent, the result of gene duplication and gene loss events that
have occurred at different times during vertebrate evolution
[5,9,17] (see also this study). To study the consequences of
these events on vertebrate proteomes and vertebrate evolu-
tion, we delineated gene families and used these for con-
structing phylogenetic trees (see Materials and methods). The
delineation of gene families resulted in 9,461 families with a
Ciona or Drosophila outgroup. As expected, Ciona was more
often found as first outgroup sequence (better E-value score
in BLAST) than Drosophila (5,609 versus 3,852, respec-
tively). We discarded 602 multi-gene families, for which no
Ciona or Drosophila outgroup sequence could be identified.
Genome Biology 2006, Volume 7, Issue 5, Article R43 Blomme et al. R43.3
comment reviews reports refereed researchdeposited research interactions information
Genome Biology 2006, 7:R43
Gene duplication in the vertebrate tree
On the basis of the 9,461 gene families, 8,165 phylogenetic
trees containing 85,426 vertebrate genes were inferred, and
speciation and duplication events were counted (59,852 and
11,167, respectively; Figure 1). The relative position of the
duplicated genes in a vertebrate tree was used to determine
timing of a duplication event. For ease of reference, the differ-
ent branches in the tree, corresponding with certain periods
in vertebrate evolution, are indicated by TPx, where x is a
number between 1 and 13 (Figure 2). All trees can be con-
sulted on our website [34]. The whole genome duplication
(WGD) events during the early evolution of vertebrates (1R/
2R) are assumed to have occurred before the divergence of
the fishes and the tetrapods (indicated by TP13) [5,9]. TP12
marks the branch on which 3R (the FSGD) has occurred [18].
It should be noted though that, although we assume that
many of the duplicates in TP13 and TP12 were created as a
result of WGD events, a considerable fraction originated
through small-scale duplication events, further referred to as
the continuous mode of duplication.
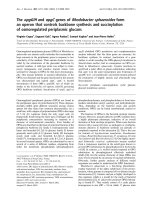
As can be seen in Figure 2, the number of identified duplica-
tions at TP13 (2,972 duplications) exceeds all other values,
which indeed suggests that gene duplication has been ram-
pant during early vertebrate evolution. A high number of
duplications is also detected in TP12 (branch of the FSGD).
Nevertheless, the number of detected duplications in the
common ancestor of the fishes (coinciding with 3R, TP12: 545
duplications) is more than five times smaller than the number
of duplications on TP13. There might be several explanations
for the large difference in the number of duplications between
TP12 and TP13. First, the FSGD was one event (reviewed in
[18]), while there is good evidence that there have been two
WGD events at the dawn of vertebrate evolution (see, for
example, [8,9,17]). Second, gene loss following the FSGD
might have been more extensive than gene loss following 1R/
2R (see below). In addition, a duplication on TP12 can only be
recognized if at least one of the two fish (Danio or Tetraodon)
has retained two copies of the same gene. Regarding the TP13
branch, there is a much greater chance to detect duplications,
simply because there are more species in our dataset to com-
pare with. As long as two duplicated genes that arose early in
vertebrate evolution (for example, TP13) can be found in at
least one of the extant vertebrate genomes, this can be
regarded as evidence for a duplication event in the common
ancestor of the vertebrates (TP13; see Materials and
methods).
Apart from WGDs, gene duplication is a continuous process
and, as expected, duplication events were found on all
branches during vertebrate evolution. Nevertheless, there are
remarkable differences in the number of duplications in the
different branches. For instance, the number of zebrafish-
specific gene duplicates seems exceptionally high, while that
for Tetraodon is rather low. Zebrafish and Tetraodon are
assumed to have diverged about 140 MYA [35], and since that
time Tetraodon has retained 363 duplicates (TP11), while
zebrafish counts almost four times as many duplicates (1,265,
TP10). When the number of retained duplicates is divided by
the time since speciation, a net average duplication rate of
9.04 duplications per million years in zebrafish is obtained,
which is the highest of all lineages in the vertebrate tree, com-
pared to only 2.6 for Tetraodon. Mouse and rat have values
that lie in between those of zebrafish and Tetraodon (7.27 and
5.07 duplications per million years, respectively). Comparing
these net rates to net rates in other terminal branches con-
firms the extremely high number of retained duplicates in
zebrafish, rather than an exceptionally low rate in Tetraodon.
The lower net rate of duplicate retention after species-specific
duplications in rat (TP2) compared to mouse was already
noted before [36]. The numbers of retained duplicates for
frog and chicken are exceptionally low (0.6 in TP8, and 0.27
in TP6, respectively). It should be noted though that low
values for duplications might reflect excessive gene loss in
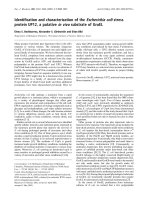
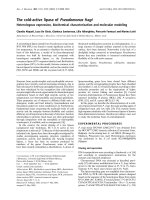
Hypothetical examples of phylogenetic trees with duplication and gene loss eventsFigure 1
Hypothetical examples of phylogenetic trees with duplication and gene
loss events. The phylogenetic trees were inferred from a gene family
including members of all genomes used in the current study (human, HS;
mouse, MM; rat, RN; chicken, GG; frog, XT; zebrafish, DR; Tetraodon, TN;
Ciona, CI). All nodes are assumed to be supported by >70% in bootstrap
analysis. Gene duplication can be recognized if at least two gene copies are
present for the same species. (a) The duplication event (represented by a
pink diamond) was inferred to have occurred early in vertebrate evolution
because both land vertebrates and fishes have two copies of the gene. This
is the most likely explanation, since the alternative assumption, where all
lineages have undergone separate gene duplication events, is much less
parsimonious. Subsequently, a gene loss event can be inferred for
Tetraodon, since gene2 is missing (dotted line). The general conclusion of
this hypothetical tree is thus one gene loss event of a TN duplicate that
first had been created in the common ancestor of land vertebrates and
fishes. For all other genomes, we count two retained duplicates after this
ancient duplication event. (b) This more complex phylogenetic tree
contains three duplication events (again indicated by diamonds). The
oldest duplication event (pink diamond) is dated early in vertebrate
evolution (TP13, similar to the one in (a)). HS, MM, RN and GG lost gene2,
which is interpreted as gene loss of a TP13 duplicate in the common
ancestor of these organisms (thus at TP7; Figure 2). GG also lost gene1, a
gene loss event at TP6 of a duplicate that originated at TP13. The orange
diamond indicates a duplication event in the common ancestor of the
fishes, not shared with land vertebrates (TP12), resulting in gene1 and
gene1' for both DR and TN. Finally, DR gene1 and gene1" are the result of a
species-specific duplication event in DR.
HS gene1
RN gene1
MM gene1
GG gene1
XT gene1
DR gene1
TN gene1
HS gene2
RN gene2
MM gene2
GG gene2
XT gene2
DR gene2
TN gene2
CI gene
(a) (b)
HS gene1
RN gene1
MM gene1
GG gene1
XT gene1
DR gene1'
TN gene1'
HS gene2
RN gene2
MM gene2
GG gene2
XT gene2
DR gene2
TN gene2
CI gene
DR gene1
DR gene1''
TN gene1
R43.4 Genome Biology 2006, Volume 7, Issue 5, Article R43 Blomme et al. />Genome Biology 2006, 7:R43
those lineages, rather than a decreased rate in gene
duplication.
Gene loss in the vertebrate tree
After a duplication event, the most likely fate of a duplicate is
gene loss or nonfunctionalization [26,32]. However, there is a
reasonable chance that both copies will be retained, after
which different scenarios can be envisioned: one of the two
duplicates might acquire a new function (neofunctionaliza-
tion); the duplicates undergo so-called subfunctionalization,
in which both gene copies lose a complementary set of sub-
functions and thereby divide the ancestral gene's original
functions [37], or instead of diverging in function both gene
copies remain largely redundant and provide the organism
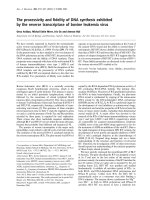
Gene duplications and gene losses mapped on the vertebrate treeFigure 2
Gene duplications and gene losses mapped on the vertebrate tree. The vertebrate tree is shown with branch lengths proportional to time. The divergence
times were taken from [35,68,69]. Abbreviations of species names are as in Figure 1. The numbers in colored circles indicate the different time points
analyzed, referred to in the text as TPx. The total number of inferred duplications at each time point (TP) is shown in italics. The (negative) bars on the
plots (with gray background) show the fraction of genes that was lost again after they have been created in a specific duplication event (indicated in colors
corresponding to the time points (TP)). The total amount of gene loss for each organism is indicated under the species name.
12
HS
RN
MM
GG
XT
DR
TN
5.44191140
310360450
MYA
1
2
5
4
2
3
6
7
9
8
10
11
1R/2R
3R
13
525-875 MYA
363
480
324
1252
1300
1169
1103
68
208
396
53
298
83
7
28
217
1,265
545
363
2,972
12
1
-0.5
-0.4
-0.3
-0.2
-0.1
0
57913
-0.5
-0.4
-0.3
-0.2
-0.1
0
457913
-0.5
-0.4
-0.3
-0.2
-0.1
0
457913
-0.5
-0.4
-0.3
-0.2
-0.1
0
57913
-0.5
-0.4
-0.3
-0.2
-0.1
0
7913
-0.5
-0.4
-0.3
-0.2
-0.1
0
7913
-0.5
-0.4
-0.3
-0.2
-0.1
0
913
-0.5
-0.4
-0.3
-0.2
-0.1
0
913
-0.5
-0.4
-0.3
-0.2
-0.1
0
13
-0.5
-0.4
-0.3
-0.2
-0.1
0
12 13
-0.5
-0.4
-0.3
-0.2
-0.1
0
12 13
-0.5
-0.4
-0.3
-0.2
-0.1
0
13
Genome Biology 2006, Volume 7, Issue 5, Article R43 Blomme et al. R43.5
comment reviews reports refereed researchdeposited research interactions information
Genome Biology 2006, 7:R43
with increased genetic robustness against harmful mutations
[38]. Recent studies revealed that subfunctionalization can
occur rapidly after duplication, and is often accompanied by
neofunctionalization. This has led to a new model of gene
function evolution called sub-neofunctionalization [39,40].
Shiu et al. [41] provided some evidence that positive selection
plays a more important role in the retention of gene
duplicates than subfunctionalization. A general overview of
the mechanisms of gene duplication and retention can be
found in [42,43].
In the current study, gene loss was determined as follows:
when a sequence was missing from a certain species or a clade
of species in a tree topology, while it was expected to be
present because of a duplication event deeper in the same
tree, this was counted as a gene loss event in the branch lead-
ing to the species or the clade (Figure 1). However, if one
accepts that one or two WGD events have occurred in the
early evolution of vertebrates (TP13), we can roughly estimate
the amount of gene loss following these events. More in par-
ticular, we can infer where in the vertebrate tree these genes
have been lost again. Since these WGDs originally duplicated
all genes, we can assume that gene families for which such a
duplication event at TP13 cannot be uncovered are character-
ized by an immediate gene loss of the duplicates created
through 1R/2R. In the 7,350 gene families that have a repre-
sentative in fish, land vertebrates and one of the outgroup
sequences, 5,396 families were identified without a duplica-
tion on TP13, which seems to indicate massive gene loss fol-
lowing 1R/2R.
Similarly, fishes also seem to have lost many genes following
the FSGD. As a matter of fact, both zebrafish and Tetraodon
seem to have lost a similar amount of duplicates, although, as
stated before, zebrafish has much more recent duplicates
than Tetraodon. For instance, Figure 2 shows that both
zebrafish and Tetraodon have lost about 30% of the genes
that could still be identified as duplicated at TP13, about 15%
before the split and about 15% after the split of both fish spe-
cies (pink bins in plots, Figure 2). On top of that, about 20%
of the duplicates resulting from the FSGD (or from small-
scale duplication events that have occurred between 450 and
140 MYA; Figure 2) have been lost in both fish species.
Strikingly, all vertebrates continue to lose duplicates that
were created at much earlier times. Figure 2 (pink bins in
plots) clearly shows that duplicates that were created during
1R/2R can still be lost after they have survived for hundreds
of millions of years of evolution. Some of those genes are lost
only after the divergence of human and rodents, or after the
divergence of mouse and rat. As a matter of fact, this is in con-
gruence with what is predicted by age distributions of dupli-
cated genes, which usually show an exponential or power-law
decay of genes that have been duplicated [26,32], suggesting
that, although chances become smaller, anciently duplicated
genes are still getting lost. A high gene loss of such old dupli-
cates is observed in particular for frog, chicken, and both fish
genomes, while this is much less the case for mammals. Actu-
ally, gene loss in general is about four times higher in frog,
chicken, and fishes, compared to primates (human) and
rodents (mouse and rat). Extensive gene loss in the avian lin-
eage has been reported before [44].
We have also computed the relative contribution of gene
duplication at different times in vertebrate evolution to the
total gene or proteome content of extant vertebrates (Figure
3a). Rescaling to the fraction of retained duplicates of differ-
ent origin versus the total number of retained duplicates (Fig-
ure 3b) provides a view on the relative importance of
duplication events for the composition of current vertebrate
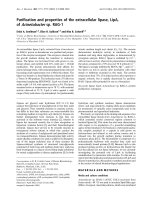
proteomes. As can be seen in Figure 3a, the majority of dupli-
cated genes in all vertebrate genomes have been created by
ancient duplication events early in vertebrate evolution and
coinciding with TP13 or 1R/2R (pink parts in graph of Figure
3). For fishes, the FSGD (TP12) has also contributed a consid-
erable number of genes to their current genome content
(orange parts in graphs of Figure 3). As can be observed, and
stated above already, a majority of duplicates in zebrafish are
of more recent origin (indicated in light green, TP10), created
after the split between zebrafish and Tetraodon. Apparently,
the zebrafish genome, unlike that of Tetraodon, has not only
considerably expanded through the accumulation of (retro-)
transposable elements [45], but also through a large number
of recent duplications.
As can be seen in Figure 3, the gene duplicates of ancient ori-
gin (TP13) contribute considerably less to the whole of the
current paranome (the full set of paralogs in a genome) of
Table 1
Number of genes in genomes, gene families, phylogenetic trees, and trees with GOslim annotation
Homo sapiens Rattus norvegicus Mus musculus Gallus gallus Xenopus tropicalis Danio rerio Tetraodon nigroviridis
Genome 22,218 21,952 24,461 17,709 24,405 22,877 28,005
Gene families 14,054 (0.63) 14,155 (0.64) 14,813 (0.61) 9,875 (0.56) 13,336 (0.55) 14,597 (0.64) 12,373 (0.44)
Phylogenetic
trees
13,080 (0.59) 12,537 (0.57) 13,325 (0.54) 9,292 (0.52) 11,747 (0.48) 13,785 (0.60) 11,660 (0.42)
Phylogenetic
trees with GO
annotation
12,470 (0.56) 11,919 (0.54) 12,669 (0.52) 8,806 (0.50) 11,049 (0.45) 13,244 (0.58) 11,097 (0.40)
The fraction of the proteome analyzed at a certain step in the procedure is in parentheses (see Materials and methods for details).
R43.6 Genome Biology 2006, Volume 7, Issue 5, Article R43 Blomme et al. />Genome Biology 2006, 7:R43
fishes than to that of the land vertebrates, because of both the
FSGD and species specific duplications. Indeed, while for
land vertebrates the fraction of the paranome formed by
ancient duplicates amounts to 80% or more, this is only 50%
for zebrafish and 70% for Tetraodon. However, the total
number of ancient duplicates in fish genomes is still very sim-
ilar to that of chicken and frog, and only slightly less than in
human or rodents.
Which genes have been retained or lost?
To determine whether gene families involved in different bio-
logical processes or with distinct biochemical functions show
dissimilar patterns of gene retention and gene loss, the Gene
Ontology (GO) controlled vocabulary was used [46] (see
Materials and methods). In total, 7,314 trees with GOslim
annotation could be analyzed (Table 1).
In a first step, we compared the paranome of all organisms in
a pairwise manner, without considering the mode and time of
origin of the duplicates. Several functional categories with a
significantly different number of retained duplicates could be
identified. Interestingly, all of the significant differences were
observed between fishes on the one hand and land verte-
brates on the other (Additional data file 1, Table S1). For
instance, genes belonging to the GOslim category 'catalytic
activity' have been retained in excess in both zebrafish and
Tetraodon compared to the land vertebrates, whereas other
categories such as 'protein modification', 'protein metabo-
lism', 'catabolism', and 'peptidase activity' show the opposite
trend (Additional data file 1; Table S1). Significant differences
regarding gene retention for different functional categories
within the land vertebrates or within the fishes could not be
observed, suggesting that land vertebrates on the one hand
and fishes on the other show similar gene loss for the same
functional classes of genes.
In a second step, we investigated the effect of the time and
mode of duplication on the retention of genes belonging to
different functional categories. We already showed that the
WGDs have played a major role in contributing extra genes to
vertebrate genomes. In addition, there seems to be a consid-
erable functional bias in gene retention following these major
events (1R/2R, TP13 and 3R, TP12). For instance, for most
vertebrates, genes belonging to GO classes such as 'protein
binding', 'signal transduction', 'transcription', 'development',
'DNA binding', 'receptor activity', 'ion transport', and 'protein
modification' show significantly higher levels of gene reten-
tion following WGD events (TP12 and TP13; Table 2) than
when such genes are being created in smaller-scale events.
Again, it should be noted that we assume that many of the
genes created at TP12 and TP13 are the result of a WGD event
(see above). On the other hand, genes belonging to other
functional classes such as 'electron transport', 'amino acid
and derivative metabolism' and 'RNA binding' seem to have
been retained in particular following small-scale duplication
events in at least four different species of the dataset (Table
2). The strong bias in gene retention for regulatory genes fol-
lowing large-scale gene duplication events is very much in
congruence with what has been observed in plants. There too,
genes involved in transcriptional regulation and signal trans-
duction seem to have been preferentially retained following
genome duplications [32,47,48]. Even in yeast, a large
number of duplicates resulting from the WGD with functions
in transcription were observed [49]. Similarly, in both verte-
brates (this study) and plants [32,33], developmental genes
are observed to be well retained following genome duplica-
tions. Furthermore, the high retention rate of transcription
factors following WGD events might be explained by the fact
that they are often active as protein complexes and probably
need to be present in stoichiometric quantities for their
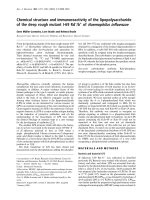
Origin of duplicates in different vertebratesFigure 3
Origin of duplicates in different vertebrates. The number of duplicates and
their origin (in the vertebrate tree) is shown for all organisms analyzed in
the current study. (a) The absolute number of duplicated genes; (b) the
relative contribution of the origin of duplicates to the total duplicate
content of each vertebrate genome. Colors correspond to the duplication
events indicated in Figure 2. Pink represents genes of which a major
fraction is assumed to have been created during 1R/2R, while orange
refers to the fraction of genes of which many are assumed to have been
created during the FSGD.
(a)
(b)
0
500
1,000
1,500
2,000
2,500
3,000
HS RN MM GG XT DR TN
Number of duplicate pairs
1
2
3
4
5
6
7
8
9
10
11
12
13
0.000
0.100
0.200
0.300
0.400
0.500
0.600
0.700
0.800
0.900
1.000
HS RN MM GG XT DR TN
Fraction of all present duplicates
1
2
3
4
5
6
7
8
9
10
11
12
13
Genome Biology 2006, Volume 7, Issue 5, Article R43 Blomme et al. R43.7
comment reviews reports refereed researchdeposited research interactions information
Genome Biology 2006, 7:R43
Table 2
Excess of gene retention in parts of the vertebrate tree
GOslim label, category, description Organism TPs showing significant difference TP with highest number of duplicates q-value
GO:0006118, BP, electron transport HS TP13 vs TP1 TP1 6.73E-05
DR TP12 vs TP10 TP10 2.50E-04
DR TP13 vs TP10 TP10 8.60E-06
GO:0006519, BP, amino acid and derivative
metabolism
HS TP13 vs TP1 TP1 8.69E-04
DR TP12 vs TP10 TP10 5.37E-04
DR TP13 vs TP10 TP10 1.47E-08
GO:0007165, BP, signal transduction TN TP13 vs TP11 TP13 5.76E-04
XT TP13 vs TP8 TP13 9.18E-04
RN TP13 vs TP2 TP13 1.44E-17
MM TP13 vs TP3 TP13 8.32E-19
HS TP13 vs TP1 TP13 2.43E-02
DR TP12 vs TP10 TP10 3.60E-16
DR TP13 vs TP10 TP10 6.40E-12
GO:0003677, MF, DNA binding XT TP13 vs TP8 TP13 4.38E-02
RN TP13 vs TP2 TP13 1.20E-08
MM TP13 vs TP3 TP13 1.86E-07
DR TP12 vs TP10 TP10 1.51E-10
DR TP13 vs TP10 TP10 3.99E-10
GO:0004872, MF, receptor activity TN TP13 vs TP11 TP13 6.34E-03
XT TP13 vs TP8 TP13 5.83E-03
RN TP13 vs TP2 TP13 2.26E-11
MM TP13 vs TP3 TP13 7.47E-09
DR TP12 vs TP10 TP10 1.01E-08
DR TP13 vs TP10 TP10 7.37E-05
GO:0006464, BP, protein modification RN TP13 vs TP2 TP13 8.16E-12
MM TP13 vs TP3 TP13 7.26E-07
HS TP13 vs TP1 TP13 2.43E-02
DR TP12 vs TP10 TP10 1.00E-09
DR TP13 vs TP10 TP10 2.63E-07
GO:0005515, MF, protein binding TN TP13 vs TP11 TP13 5.76E-04
XT TP13 vs TP8 TP13 1.01E-02
RN TP13 vs TP2 TP13 2.31E-12
MM TP13 vs TP3 TP13 3.72E-08
DR TP12 vs TP10 TP10 7.78E-07
DR TP13 vs TP10 TP10 4.01E-06
GO:0007275, BP, development TN TP13 vs TP11 TP13 3.71E-02
XT TP13 vs TP8 TP13 4.50E-02
RN TP13 vs TP2 TP13 7.64E-08
MM TP13 vs TP3 TP13 1.49E-06
HS TP13 vs TP1 TP13 1.88E-02
DR TP12 vs TP10 TP10 1.18E-06
DR TP13 vs TP10 TP10 1.06E-03
GO:0006350, BP, transcription TN TP13 vs TP11 TP13 1.97E-02
RN TP13 vs TP2 TP13 7.13E-11
MM TP13 vs TP3 TP13 3.82E-11
DR TP12 vs TP10 TP10 1.54E-20
DR TP13 vs TP10 TP10 4.11E-11
GO:0003723, MF, RNA binding RN TP13 vs TP2 TP2 4.71E-02
HS TP13 vs TP1 TP1 9.08E-03
DR TP12 vs TP10 TP10 9.36E-04
R43.8 Genome Biology 2006, Volume 7, Issue 5, Article R43 Blomme et al. />Genome Biology 2006, 7:R43
correct functioning. This is also supported by the retention of
genes belonging to classes such as 'protein binding' and 'pro-
tein modification' following WGDs. As a matter of fact, the
higher retention of genes belonging to these particular classes
is predicted by the 'gene balance' hypothesis, which states
that retention of genes that may have strong dosage effects,
such as transcription factors, will be selected against if they
are copied without their partners in the regulatory or protein
interaction network [50-53]. On the other hand, if the genes,
encoding products that cooperate in the same complex path-
way or network, are duplicated at the same time, which is the
case in WGDs, gene dosage effects might be avoided by
retaining all genes in that particular complex or network. It
should be noted that the exceptionally high number of spe-
cies-specific duplications in zebrafish outshines the number
of retained WGD duplicates in this proteome. This explains
why many genes of GOs resulting from WGDs are retained in
excess in all species except zebrafish (Table 2).
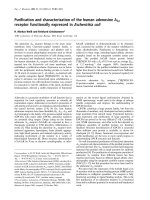
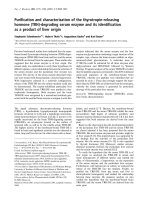
Figure 4 shows the retention of duplicates in human and
zebrafish following WGD events (assumed at TP12 and TP13)
versus small-scale duplication events for the GOSlim ontolo-
gies 'biotic stimulus, 'signal transduction', 'transcription', and
'metabolism'. As can be seen, apart from a larger number of
genes that have to do with signal transduction and
transcription factor activity, these genes are also retained at a
higher level following WGD events. Compared to these genes,
the contribution of small-scale duplication events to the
retention of genes involved in 'biotic stimulus' and 'metabo-
lism' is much more significant, in particular for human. As a
matter of fact, duplicates involved in 'response to biotic stim-
ulus' occur all throughout the vertebrate tree, and none of the
branches in the vertebrate tree contain exceptionally few or
many duplicates. For instance, the amount of gene loss fol-
lowing 1R/2R was not significantly higher or lower than
expected. This again confirms previous findings that genes
involved in secondary metabolism or response to biotic stim-
uli tend to be preserved regardless of the mode of duplication
because they are important adaptive traits that are heavily
selected for during evolution [32].
Conclusion
It has been shown before that gene duplication greatly con-
tributed to the complexity of eukaryotic genomes [54,55].
Although gene and genome duplication events in vertebrates
might have been less extensive than in plants [56], in verte-
brates a major part of the proteome also consists of proteins
encoded by duplicated genes. As shown previously, many of
the duplicates residing in vertebrate genomes have been cre-
ated during very ancient paleopolyploidy events [5,9,17]. As
previously observed for plants [32,33,47,48], in vertebrates
there also seems to be a significant difference in gene reten-
tion between genes created in polyploidy events or in small-
scale duplication events. In addition, similar to plants, and as
predicted by the 'gene-balance' hypothesis [51-53], retention
for genes encoding proteins that are active as protein
complexes and need to be present in stoichiometric quantities
for their correct functioning (for example, genes involved in
transcriptional regulation and signal transduction), is high
following (paleo)polyploidy events, while this is not the case
when such genes are being duplicated individually.
It has been suggested that polyploidy events can be associated
with important evolutionary transitions, major leaps in
development, and/or adaptive radiations of species
[1,18,28,31,33,53,57]. The high retention of many important
genes involved in transcriptional regulation, signaling, and
development after paleopolyploidy events as shown here and
in previous studies, and the fact that in particular such genes
are considered important for introducing phenotypic varia-
tion and increase in biological complexity, makes it tempting
to speculate on the importance of such large-scale duplication
events for vertebrate evolution. As far as we know, within the
animal lineage, vertebrate genomes are still the most com-
plex, and, at least compared to invertebrates, vertebrates still
do contain considerably more genes, a majority of which is
probably created by gene and ancient genome duplications.
Whether these 'ancient' extra genes are sufficient to explain
the increased morphological complexity of vertebrates is
doubtful, but they might hold at least part of the answer.
DR TP13 vs TP10 TP10 3.42E-05
GO:0006811, BP, ion transport TN TP13 vs TP11 TP13 1.11E-02
XT TP13 vs TP8 TP13 1.79E-02
RN TP13 vs TP2 TP13 1.23E-11
MM TP13 vs TP3 TP13 1.34E-06
HS TP13 vs TP1 TP13 3.84E-02
DR TP12 vs TP10 TP10 8.52E-03
DR TP13 vs TP10 TP10 1.00E-02
The GOslim label, its category (MF, molecular function; BP, biological process) and the general description are shown. For each organism (HS,
human; MM, mouse; RN, rat; GG, chicken; XT, frog; DR, zebrafish; TN, Tetraodon), the number of species-specific duplicates was compared to the
number of duplicates from time points (TPs) coinciding with WGDs (TP12 and TP13). The time points showing a significant difference (q < 0.05) in
comparison are shown (TPx vs TPy), followed by the time point with the highest number of duplicates. The last column shows the q-value. Only
significant results that are discussed in the text are listed (others can be found in Additional data file 1; Table S2).
Table 2 (Continued)
Excess of gene retention in parts of the vertebrate tree
Genome Biology 2006, Volume 7, Issue 5, Article R43 Blomme et al. R43.9
comment reviews reports refereed researchdeposited research interactions information
Genome Biology 2006, 7:R43
Materials and methods
Construction of the dataset and phylogenetic analysis
of gene families
The predicted protein sequences from human (release
31.35d), mouse (release 31.33g), Tetraodon nigroviridis
(release 31.1c), zebrafish (Danio rerio, release Zfish5), rat
(Rattus norvegicus, release 31.34a), chicken (Gallus gallus,
release 31.1g), and frog (Xenopus tropicalis, release 31.1a)
were retrieved from Ensembl [58]. If multiple splice variants
were reported for one gene, only the longest transcript was
used. Transposon-like genes were removed based on homol-
ogy with known transposons [59].
To delineate vertebrate gene families, a similarity search was
performed (BLASTP, [60]; E-value cutoff E-10) with all pro-
teins from the organisms listed above, plus the proteins of
Ciona intestinalis ([61], version 1) and Drosophila mela-
nogaster (Ensembl [58], version 3), which were added as out-
group species. Because the focus of this study was to identify
genes that were duplicated during vertebrate evolution, only
vertebrate genes were used as blast query. Blast hits between
vertebrate sequences with a better score than the best score
between a vertebrate sequence and an outgroup sequence
(Drosophila or Ciona) were retained in the gene family. The
Drosophila or Ciona sequence was used to root the phyloge-
netic tree (see below). Redundancy between the families was
Retention of duplicates in human and zebrafish following WGDs and small-scale duplications for four different functional categoriesFigure 4
Retention of duplicates in human and zebrafish following WGDs and small-scale duplications for four different functional categories. The retention of
duplicates in (a,b) human and (c,d) zebrafish following WGD events (assumed at TP12 and TP13) versus small-scale duplication events for the GOSlim
ontologies 'biotic stimulus' (BS), 'signal transduction' (SD), 'transcription' (TR), and 'metabolism' (MET). Color codings correspond to time points in Figure
2. (a,c) Absolute numbers of retained duplicates. (b,d) Relative numbers of retained duplicates normalized for the total amount of duplicates in the
genome.
(a)
(b)
(c)
(d)
0
50
100
150
200
250
300
350
400
450
BS SD TR MET
1
2
3
4
5
6
7
8
9
10
11
12
13
0%
10%
20%
30%
40%
50%
60%
70%
80%
90%
100%
BS SD TR MET
1
2
3
4
5
6
7
8
9
10
11
12
13
0%
10%
20%
30%
40%
50%
60%
70%
80%
90%
100%
BS SD TR MET
1
2
3
4
5
6
7
8
9
10
11
12
13
0
100
200
300
400
500
600
BS SD TR MET
1
2
3
4
5
6
7
8
9
10
11
12
13
R43.10 Genome Biology 2006, Volume 7, Issue 5, Article R43 Blomme et al. />Genome Biology 2006, 7:R43
removed. Gene families without a homolog in Ciona or Dro-
sophila were discarded from the dataset.
For all retained gene families a multiple alignment was cre-
ated with T-Coffee 1.37 using default parameters [62]. Align-
ment columns containing gaps were removed when a gap was
present in >10% of the sequences. To reduce the chance of
including misaligned amino acids, all positions in the align-
ment left or right from the gap were also removed until a col-
umn in the sequence alignment was found where the residues
were conserved in all genes included in our analyses. This was
determined as follows: for every pair of residues in the col-
umn, the BLOSUM62 value was retrieved. If at least half of
the pairs had a BLOSUM62 value ≥0, the column was consid-
ered as conserved.
Neighbor joining trees (with 500 bootstrap replicates) were
constructed using PHYLIP 3.5 [63]. Families containing more
than 100 proteins were aligned with ClustalW 1.83 [64] and
were bootstrapped 100 times. Families with more than 260
genes were excluded from the dataset, because PHYLIP was
unable to build a phylogenetic tree. The neighbor-joining
trees were parsed, and phylogenetic information supported
by a bootstrap value of at least 70% was considered for further
analysis.
Functional annotation of the gene families
Gene families were functionally annotated using GO [46,65].
The GO annotation for human and mouse, as well as the
InterPro annotation for all organisms listed above was
downloaded from Ensembl. For the organisms that did not
have a GO annotation, a GO labeling was obtained based on
the InterPro annotation [66]. In a first step, the InterPro
annotation was linked to the corresponding GO annotation
with the InterPro2GO mapping ([65], version of April 2005).
Since some GO categories only contain a small fraction of
genes, in a second step all GO labels were remapped to the
GOslim ontology, a reduced version of GO ontology ([65],
generic version of August 2002). GO annotation per family
was obtained by listing the GOslim labels for all the genes of
that family. A weight, equal to the percentage of genes with
GOslim annotation within the same subcategory (molecular
function, cellular component, biological process) that carried
this label, was attached to all the GOslim labels. Only GOslim
labels with a weight greater than 30% were considered as rep-
resentative for the family because it is unlikely that a GOslim
label ascribing fewer members of that family is representative
for the entire family. A lower cutoff leads to a considerable
increase in the number of GOslim labels for each family,
which means that rare GO labels would be assigned to an
entire family. A higher cutoff only decreased the number of
GOslim labels for each family slightly (Additional data file 1;
Figure S1).
Relative dating of duplication events
Phylogenetic trees were systematically analyzed for the pres-
ence of gene duplication events at different points in verte-
brate evolution (see below). Duplication events were
evaluated by relative dating, thus based on the relative posi-
tion of the duplicated genes compared to speciation events in
the phylogenetic tree. Gene loss following gene duplication
events was always counted as parsimonious as possible. Two
hypothetical examples that explain identification of gene loss
after duplication are given in Figure 1. For instance, a dupli-
cation event is registered at TP13 (Figure 2) if a land verte-
brate and a fish gene are clustered at one side of the root and
at least one other vertebrate sequence is found on the other
side of the root. For example, the topology (((TNgene1,
HSgene1), HSgene2), CI), supported by bootstrap values
higher than 70%, is a minimal requirement for accepting a
duplication event at TP13. A tree with only mammals and
amphibians, such as (((HSgene1, XTgene1), (HSgene2,
XTgene2)), CI) does contain a duplication event, shared by
mammals and amphibians, but does not allow one to cor-
rectly identify the time point of the duplication event since it
is possible that the duplication took place at TP9 or at TP13.
To identify a duplication on TP9, we need a fish gene that
clusters outside the duplication node. All scripts to parse phy-
logenetic trees are available upon request.
To determine if there are any significant differences in the
total number of duplicates in the vertebrate proteomes, we
performed pairwise comparisons and used the Fisher's exact
test. This test was also used to determine whether gene reten-
tion at different time points or between different species is
biased towards particular functional categories (GOslim)
[34]. The false discovery rate method (q-value) [67] was used
to correct for multiple hypotheses testing and adjusted p val-
ues smaller than 0.05 were considered as significant.
Additional data files
The following additional data are available with the online
version of this paper. Additional data file 1 contains addi-
tional information about the applied methods and the results,
including: an explanation about the setting of the weight cut-
off in the labelling of gene families with GOslim annotation;
Table S1, showing significant trends in the total amount of
duplicate pairs in the vertebrate genomes; and Table S2,
showing the excess of gene retention in parts of the vertebrate
tree. Additional data file 2 lists the proteins with descriptions
(Ensembl).
Additional File 1Additional information about the applied methods and the resultsContains an explanation about the setting of the weight cutoff in the labelling of gene families with GOslim annotation; Table S1, showing significant trends in the total amount of duplicate pairs in the vertebrate genomes; and Table S2, showing the excess of gene retention in parts of the vertebrate tree.Click here for fileAdditional File 2Proteins with descriptions (Ensembl)Proteins with descriptions (Ensembl).Click here for file
Authors' contributions
T.B. designed the research, analyzed data and wrote the
paper. K.V. helped in research design and writing the paper.
S.D.B. provided technical assistance and scientific guidance.
C.S. provided technical assistance. S.M. provided scientific
Genome Biology 2006, Volume 7, Issue 5, Article R43 Blomme et al. R43.11
comment reviews reports refereed researchdeposited research interactions information
Genome Biology 2006, 7:R43
guidance. Y.V.d.P. designed the research, supervised the
project, and wrote the paper.
Acknowledgements
T.B., S.D.B. and C.S. are indebted to the Institute for the Promotion of
Innovation by Science and Technology (Flanders, Belgium) for a predoctoral
fellowship. S.M. is a predoctoral fellow and K.V. a postdoctoral fellow of the
Fund for Scientific Research (Flanders, Belgium). The authors would like to
thank Steven Schockaert and Francis Dierick for help in tree parsing and for
the online supplementary material and Tineke Casneuf for help on statisti-
cal issues.
References
1. Ohno S: Evolution by Gene Duplication New York: Springer-Verlag;
1970.
2. Holland PW, Garcia-Fernandez J, Williams NA, Sidow A: Gene
duplications and the origins of vertebrate development. Dev
Suppl 1994:125-133.
3. Garcia-Fernandez J, Holland PW: Amphioxus Hox genes: insights
into evolution and development. Int J Dev Biol 1996:71S-72S.
4. Holland PW: Vertebrate evolution: something fishy about
Hox genes. Curr Biol 1997, 7:R570-R572.
5. Panopoulou G, Poustka AJ: Timing and mechanism of ancient
vertebrate genome duplications - the adventure of a
hypothesis. Trends Genet 2005, 21:559-567.
6. Abi-Rached L, Gilles A, Shiina T, Pontarotti P, Inoko H: Evidence of
en bloc duplication in vertebrate genomes. Nat Genet 2002,
31:100-105.
7. Larhammer D, Lundin LG, Hallböök F: The human Hox-bearing
chromosome regions did arise by block or chromosome (or
even genome) duplications. Genome Res 2002, 12:1910-1920.
8. Lundin LG, Larhammer D, Hallböök F: Numerous groups of chro-
mosomal regional paralogies strongly indicate two genome
doublings at the root of the vertebrates. J Struct Funct Genomics
2003, 3:53-63.
9. Vandepoele K, De Vos W, Taylor JS, Meyer A, Van de Peer Y: Major
events in the genome evolution of vertebrates: paranome
age and size differs considerably between ray-finned fishes
and land vertebrates. Proc Nat Acad Sci USA 2004, 101:1638-1643.
10. Wang Y, Gu X: Evolutionary patterns of gene families gener-
ated in the early stage of vertebrates. J Mol Evol 2000, 51:88-96.
11. Gibson TJ, Spring J: Evidence in favour of ancient octaploidy in
the vertebrate genome. Biochem Soc Trans 2000, 28:259-264.
12. McLysaght A, Hokamp K, Wolfe KH: Extensive genomic duplica-
tion during early chordate evolution. Nat Genet 2002,
31:200-204.
13. Gu X, Wang Y, Gu J: Age distribution of human gene families
shows significant roles of both large- and small-scale duplica-
tions in vertebrate evolution. Nat Genet 2002, 31:205-209.
14. Panopoulou G, Hennig S, Groth D, Krause A, Poustka AJ, Herwig R,
Vingron M, Lehrach H: New evidence for genome-wide duplica-
tions at the origin of vertebrates using an amphioxus gene
set and completed animal genomes. Genome Res 2003,
13:1056-1066.
15. Hughes AL: Phylogenies of developmentally important pro-
teins do not support the hypothesis of two rounds of genome
duplication early in vertebrate history. J Mol Evol 1999,
48:565-576.
16. Friedman R, Hughes AL: Pattern and timing of gene duplication
in animal genomes. Genome Res 2001, 11:1842-1847.
17. Dehal P, Boore JL: Two rounds of whole genome duplication in
the ancestral vertebrate. Plos Biology 2005, 3:e314.
18. Meyer A, Van de Peer Y: From 2R to 3R: evidence for a fish-spe-
cific genome duplication (FSGD). Bioessays 2005, 27:937-945.
19. Amores A, Force A, Yan YL, Joly L, Amemiya C, Fritz A, Ho RK,
Langeland J, Prince V, Wang YL, et al.: Zebrafish hox clusters and
vertebrate genome evolution. Science 1998, 282:1711-1714.
20. Naruse K, Fukamachi S, Mitani H, Kondo M, Matsuoka T, Kondo S,
Hanamura N, Morita Y, Hasegawa K, Nishigaki R, et al.: A detailed
linkage map of Medaka, Oryzias latipes: comparative genom-
ics and genome evolution. Genetics 2000, 154:1773-1784.
21. Malaga-Trillo E, Meyer A: Genome duplications and accelerated
evolution of Hox genes and cluster architecture in teleost
fishes. Am Zool 2001, 41:676-686.
22. Aparicio S, Hawker K, Cottage A, Mikawa Y, Zuo L, Venkatesh B,
Chen E, Krumlauf R, Brenner S: Organization of the Fugu
rubripes Hox clusters: evidence for continuing evolution of
vertebrate Hox complexes. Nat Genet 1997, 16:79-83.
23. Taylor JS, Braasch I, Frickey T, Meyer A, Van de Peer Y: Genome
duplication, a trait shared by 22,000 species of ray-finned
fish. Genome Res 2003, 13:382-390.
24. Christoffels A, Koh EG, Chia JM, Brenner S, Aparicio S, Venkatesh B:
Fugu genome analysis provides evidence for a whole-
genome duplication early during the evolution of ray-finned
fishes. Mol Biol Evol 2004, 21:1146-1151.
25. Jaillon O, Aury JM, Brunet F, Petit JL, Stange-Thomann N, Mauceli E,
Bouneau L, Fischer C, Ozouf-Costaz C, Bernot A, et al.: Genome
duplication in the teleost fish Tetraodonnigroviridis reveals
the early vertebrate protokaryrotype. Nature 2004,
431:946-957.
26. Lynch M, Conery JS: The evolutionary fate and consequences of
duplicate genes. Science 2000, 290:1151-1155.
27. Holland PW: More genes in vertebrates? J Struct Funct Genomics
2003, 3:75-84.
28. Aburomia R, Khaner O, Sidow A: Functional evolution in the
ancestral lineage of vertebrates or when genomic complex-
ity was wagging its morphological tail. J Struct Funct Genomics
2003, 3:45-52.
29. Donoghue PCJ, Purnell MA: Genome duplication, extinction and
vertebrate evolution. Trends Ecol Evol 2005, 20:312-319.
30. Scannell DR, Byrne KP, Gordon JL, Wong S, Wolfe KH: Multiple
rounds of speciation associated with reciprocal gene loss in
polyploid yeasts. Nature 2006, 440:341-345.
31. Wendel JF: Genome evolution in polyploids. Plant Mol Biol 2000,
42:225-249.
32. Maere S, De Bodt S, Raes J, Casneuf T, Van Montagu M, Kuiper M, Van
de Peer Y: Modeling gene and genome duplications in
eukaryotes. Proc Natl Acad Sci USA 2005, 102:5454-5459.
33. De Bodt S, Maere S, Van de Peer Y: Genome duplication and the
origin of angiosperms. Trends Ecol Evol 2005, 20:591-597.
34. Supplemental Data for this Research [http://bioinformat
ics.psb.ugent.be/supplementary_data/]
35. Hedges SB, Kumar S: Vertebrate genomes compared. Science
2002, 297:1283-1285.
36. Gibbs RA, Weinstock GM, Metzker ML, Muzny DM, Sodergren EJ,
Scherer S, Scott G, Steffen D, Worley KC, Burch PE, et al.: Genome
sequence of the Brown Norway rat yields insights into
mammalian evolution. Nature 2004, 428:493-521.
37. Force A, Lynch M, Pickett FB, Amores A, Yan YL, Postlethwait J:
Preservation of duplicate genes by complementary, degen-
erative mutations. Genetics 1999, 151:1531-1545.
38. Gu X: Functional divergence in protein (family) sequence
evolution. Genetica 2003, 118:133-141.
39. He X, Zhang J: Rapid subfunctionalization accompanied by
prolonged and substantial neofunctionalization in duplicate
gene evolution. Genetics 2005, 169:1157-1164.
40. Rastogi S, Liberles DA: Subfunctionalization of duplicated genes
as a transition state to neofunctionalization. BMC Evol Biol
2005, 5:28.
41. Shiu SH, Byrnes JK, Pan R, Zhang P, Li WH: Role of positive selec-
tion in the retention of duplicate genes in mammalian
genomes. Proc Nat Acad Sci USA 2006, 103:2232-2236.
42. Kondrashov FA, Kondrashov AS: Role of selection in fixation of
gene duplications. J Theor Biol 2006, 239:141-151.
43. Hurles M: Gene duplication: the genomic trade in spare parts.
Plos Biology 2004, 2:E206.
44. Hillier LW, Miller W, Birney E, Warren W, Hardison RC, Ponting CP,
Bork P, Burt DW, Groenen MAM, Delany ME, et al.: Sequencing
and comparative analysis of the chicken genome provide
unique perspectives on vertebrate evolution. Nature 2004,
432:695-716.
45. Volff JN, Bouneau L, Ozouf-Costaz C, Fischer C: Diversity of ret-
rotransposable elements in compact pufferfish genomes.
Trends Genet 2003, 19:674-678.
46. Gene Ontology Consortium: The Gene Ontology (GO) data-
base and informatics resource. Nucleic Acids Res 2004:D258-261.
47. Blanc G, Wolfe KH: Widespread paleopolyploidy in model
plant species inferred from age distributions of duplicate
genes. Plant Cell 2004, 16:1667-1678.
48. Seoighe C, Gehring C: Genome duplication led to highly selec-
tive expansion of the Arabidopsis thaliana proteome. Trends
R43.12 Genome Biology 2006, Volume 7, Issue 5, Article R43 Blomme et al. />Genome Biology 2006, 7:R43
Genet 2004, 20:461-464.
49. Davis JC, Petrov DA: Do disparate mechanisms of duplication
add similar genes to the genome? Trends Genet 2005,
21:548-551.
50. Teichmann SA, Babu MM: Gene regulatory network growth by
duplication. Nat Genet 2004, 36:492-496.
51. Papp B, Pal C, Hurst LD: Dosage sensitivity and the evolution of
gene families in yeast. Nature 2003, 424:194-197.
52. Birchler JA, Riddle NC, Auger DL, Veitia RA: Dosage balance in
gene regulation: biological implications. Trends Genet 2005,
21:219-226.
53. Freeling M, Thomas BC: Gene-balanced duplications, like tetra-
ploidy, provide predictable drive to increase morphological
complexity. Genome Res in press.
54. Lespinet O, Wolf YI, Koonin EV, Aravind L: The role of lineage
specific gene family expansion in the evolution of
eukaryotes. Genome Res 2002, 12:1048-1059.
55. Koonin EV, Fedorova ND, Jackson JD, Jacobs AR, Krylov DM,
Makarova KS, Mazumder R, Mekhedov SL, Nikolskaya AN, Rao BS, et
al.: A comprehensive evolutionary classification of proteins
encoded in complete eukaryotic genomes. Genome Biol 2004,
5:R7.
56. Van de Peer Y, Meyer A: Large-scale gene and ancient genome
duplications. In The Evolution of the Genome San Diego: Elsevier;
2005:328-368. Edited by Gregory TR
57. Otto SP, Whitton J: Polyploid incidence and evolution. Annu Rev
Genet 2000, 34:401-437.
58. Ensembl []
59. Swiss-Prot Protein Knowledgebase, release 47.3 [http://
us.expasy.org/sprot]
60. Altschul SF, Madden TL, Schaffer AA, Zhang J, Zhang Z, Miller W, Lip-
man DJ: Gapped BLAST and PSI-BLAST: a new generation of
protein database search programs. Nucleic Acids Res 1997,
25:3389-3402.
61. JGI []
62. Notredame C, Higgins DG, Heringa J: T-Coffee: A novel method
for fast and accurate multiple sequence alignment. J Mol Biol
2000, 302:205-217.
63. Felsenstein J: PHYLIP - Phylogeny Inference Package (version
3.2). Cladistics 1989, 5:164-166.
64. Thompson JD, Higgins DG, Gibson TJ: CLUSTAL W: improving
the sensitivity of progressive multiple sequence alignment
through sequence weighting, positions-specific gap penalties
and weight matrix choice. Nucleic Acids Res 1994, 22:4673-4680.
65. Gene Ontology []
66. Mulder NJ, Apweiler R, Attwood TK, Bairoch A, Bateman A, Binns D,
Bradley P, Bork P, Bucher P, Cerutti L, et al.: InterPro, progress
and status in 2005. Nucleic Acids Res 2005:D201-D205.
67. Storey JD, Tibshirani R: Statistical significance for genomewide
studies. Proc Nat Acad Sci USA 2003, 100:9440-9445.
68. Hedges SB, Kumar S: Genomic clocks and evolutionary
timescales. Trends Genet 2003, 19:200-206.
69. Kumar S, Hedges SB: A molecular timescale for vertebrate
evolution. Nature 1998, 392:917-920.