Báo cáo y học: "Analysis of gene expression in operons of Streptomyces coelicolor" ppsx
Bạn đang xem bản rút gọn của tài liệu. Xem và tải ngay bản đầy đủ của tài liệu tại đây (378.26 KB, 12 trang )
Genome Biology 2006, 7:R46
comment reviews reports deposited research refereed research interactions information
Open Access
2006Lainget al.Volume 7, Issue 6, Article R46
Research
Analysis of gene expression in operons of Streptomyces coelicolor
Emma Laing
*†
, Vassilis Mersinias
‡
, Colin P Smith
‡
and Simon J Hubbard
*
Addresses:
*
Faculty of Life Sciences, The University of Manchester, Manchester M13 9PT, UK.
†
Current Address: School of Biomedical and
Molecular Sciences, University of Surrey, Guildford GU2 7XH, UK.
‡
Functional Genomics Laboratory, School of Biomedical and Molecular
Sciences, University of Surrey, Guildford GU2 7XH, UK.
Correspondence: Simon J Hubbard. Email:
© 2006 Laing et al.; licensee BioMed Central Ltd.
This is an open acess article distributed under the terms of the Creative Commons Attribution License ( which
permits unrestricted use, distribution, and reproduction in any medium, provided the original work is properly cited.
Gene expression in operons<p>Analysis of the relative transcript levels of intra-operonic genes in <it>Streptomyces coelicolor </it>suggests significant levels of inter-nal regulation.</p>
Abstract
Background: Recent studies have shown that microarray-derived gene-expression data are useful
for operon prediction. However, it is apparent that genes within an operon do not conform to the
simple notion that they have equal levels of expression.
Results: To investigate the relative transcript levels of intra-operonic genes, we have used a Z-
score approach to normalize the expression levels of all genes within an operon to expression of
the first gene of that operon. Here we demonstrate that there is a general downward trend in
expression from the first to the last gene in Streptomyces coelicolor operons, in contrast to what we
observe in Escherichia coli. Combining transcription-factor binding-site prediction with the
identification of operonic genes that exhibited higher transcript levels than the first gene of the
same operon enabled the discovery of putative internal promoters. The presence of transcription
terminators and abundance of putative transcriptional control sequences in S. coelicolor operons are
also described.
Conclusion: Here we have demonstrated a polarity of expression in operons of S. coelicolor not
seen in E. coli, bringing caution to those that apply operon prediction strategies based on E. coli
'equal-expression' to divergent species. We speculate that this general difference in transcription
behavior could reflect the contrasting lifestyles of the two organisms and, in the case of
Streptomyces, might also be influenced by its high G+C content genome. Identification of putative
internal promoters, previously thought to cause problems in operon prediction strategies, has also
been enabled.
Background
The analysis of gene expression patterns observed over a
range of conditions and time points has become widely used
in modern biology to discover relationships between different
genes in a genome. This can involve clustering genes into co-
expressed sets to try and predict common functions and reg-
ulatory relationships, or to determine differential expression
in different conditions to provide insight into the function of
specific genes. Additionally, in prokaryotic organisms, the
relationships inferred from gene co-expression should also
provide clues to the organization of genes into operons and
regulons. Since operons are, by definition, a transcriptional
unit containing genes that are co-regulated as a single poly-
cistronic message, they are, therefore, deemed to be
Published: 2 June 2006
Genome Biology 2006, 7:R46 (doi:10.1186/gb-2006-7-6-r46)
Received: 22 December 2005
Revised: 3 March 2006
Accepted: 9 May 2006
The electronic version of this article is the complete one and can be
found online at />R46.2 Genome Biology 2006, Volume 7, Issue 6, Article R46 Laing et al. />Genome Biology 2006, 7:R46
functionally similar. Hence, an understanding of operon
structure and regulation forms a basis on which to build reg-
ulatory networks.
Given the importance of operons to prokaryotic gene function
and regulation, several approaches have been developed to
try and predict them, exploiting genome sequences and other
related features. As operon structure has been observed to be
relatively poorly conserved [1-4] non-homology based predic-
tion of operons has predominated. These methods use the
basic principles that genes within the same operon are con-
trolled by a single promoter, tend to be close together [5], ter-
minate at a single transcription terminator, and are
transcribed at similar levels. Several groups have developed
computational methods to predict operons that adopt these
principles, either through the use of sequence information
alone [6] or by combining it with microarray data [7,8] and/
or by including functional annotation [5,9-11] in Escherichia
coli or Bacillus subtilis. The use of microarray data and/or
functional data improves the quality of operon prediction
above that achieved from sequence alone and in addition
offers some experimental validation of the predictions
[7,8,11].
Through the presence of a promoter(s) and other regulatory
features such as cis-acting transcription factor-binding sites
upstream of the first gene of an operon, it is generally
assumed that genes within an operon are expressed at equal
levels. Typically, this equal expression is measured through
distance metrics such as Pearson correlation or Euclidean
distance where a score of 1 or 0 (respectively) is considered to
be more likely with operonic pairs than non-operonic pairs.
Indeed, recent studies in E. coli [8] and B. subtilis [7] have
shown that this is the case, with operonic pairs of genes show-
ing high correlation in gene expression using either metric.
However, although microarray data are useful in predicting
operons, the ideal condition of perfectly correlated gene
expression, even within well characterized operons, is not
observed experimentally, and the distinction between oper-
onic and non-operonic pairs is not straightforward.
In the light of these findings we were motivated to analyze the
patterns of expression across documented operons in Strep-
tomyces coelicolor, an actinomycete with a high G+C content
genome that is responsible for the production of about two-
thirds of all natural antibiotics currently available, and to
compare them with our knowledge of known E. coli operons.
This was driven from an interest in S. coelicolor itself, which
is a complex bacterium equipped with an unusually large
number of transcription factors, including 65 sigma factors
[12], and also to provide a third, phylogenetically diverse,
bacterial species in which to examine operon-expression rela-
tionships. Furthermore, we use the determined pattern of
expression across operons to identify potential internal cis-
acting control sites by combining microarray-derived expres-
sion profiles with transcription factor binding site (TFBSs)
and terminator prediction algorithms. This study reveals that
the control of gene expression in operons in Streptomyces
differs from, and is more complex than that observed in E.
coli and B. subtilis, and is likely to demonstrate more internal
control.
Results and discussion
In order to compare expression levels of genes within oper-
ons, we considered several metrics, concluding that the Pear-
son correlation coefficient provides a superior measure of the
direction or change in gene expression over a set of experi-
ments. This has also been observed by other workers [7] and
suggests that the gene expression profiles of operonic mem-
bers are co-ordinated (that is, go up and down in a correlated
fashion) but not necessarily in terms of absolute expression
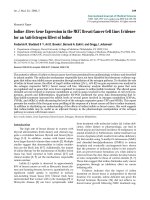
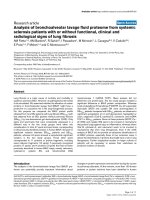
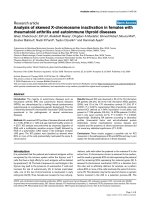
level. This idea is illustrated in Figure 1, which depicts the
normalized expression profile of 107 experiments for each of
the four genes found within the known S. coelicolor rspL-tuf1
operon [13]. Figure 1 illustrates cases where genes in the same
operon have similar trajectory patterns over a variety of
experiments, but varying expression levels for individual
experiments.
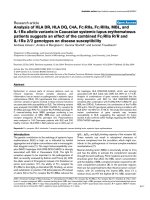
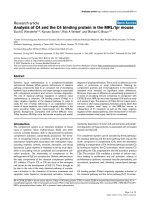
When the normalized expression levels of genes within oper-
ons are compared in S. coelicolor and E. coli (Figure 2a,c), the
intra-operonic pairs show a higher degree of correlation than
those not in operons, using either of our definitions for non-
operonic (either through direction, or crossing a true operon
boundary). For example, the mean correlation values in S.
coelicolor are 0.34, 0.26, 0.14 for known operons, non-oper-
ons (via direction), and non-operons (via boundaries),
respectively. The equivalent values in E. coli are 0.74, 0.53,
0,54. However, the trend is more marked between known
operonic gene pairs and randomly selected gene pairs (p <
0.01 after t test; Figure 2b,d). Interestingly, the most signifi-
cant trend is noted between random gene pairs in E. coli and
S. coelicolor, where randomly selected gene pairs are signifi-
cantly (p < 0.01 after t test) more highly correlated than with
mean correlation coefficients of 0.4 and 0.06, respectively
(Figure 2b,d). This is also backed up by Figure 2e, which
Example operon expression profileFigure 1
Example operon expression profile. Expression profile across all 107
experiments for all genes within the rspL-tuf1 operon in S. coelicolor.
0 102030405060708090100110
−6
−4
−2
0
2
4
6
Experiments
Normalised log(2) expression
SCO4659
SCO4660
SCO4661
SCO4662
Genome Biology 2006, Volume 7, Issue 6, Article R46 Laing et al. R46.3
comment reviews reports refereed researchdeposited research interactions information
Genome Biology 2006, 7:R46
Correlations in intra-operonic and non-operonic gene expressionFigure 2
Correlations in intra-operonic and non-operonic gene expression. Correlations in intra-operonic and non-operonic gene expression in (a) S. coelicolor and
(c) E. coli. Random gene pair correlation distribution (after 10,000 simulations) in (b) S. coelicolor and (d) E. coli. (e) Shows upstream intergenic distance
versus Pearson correlation distributions for S. coelicolor and E. coli.
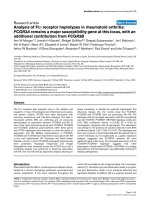
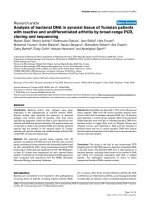
Variation in generalised operon gene expressionFigure 3
Variation in generalised operon gene expression. Box plot diagrams for all Z
op,i
values calculated for genes at position k in (a) all known S. coelicolor
operons, (b) adjacent genes known not to be in an operon in S. coelicolor, (c) all known E. coli operons, and (d) adjacent genes known not be in an operon
in E. coli.
−50 50 150 250
0
0.2
0.4
0.6
0.8
Intergenic distance (50nt bins)
Pearson correlation
(e)
−1 −0.5 0 0.5 1
0
0.1
0.2
0.3
0.4
0.5
(d)
−1 −0.5 0 0.5 1
0
0.1
0.2
0.3
0.4
0.5
Pearson correlation
Frequency
(c)
−1 −0.5 0 0.5 1
0
0.1
0.2
0.3
0.4
0.5
(b)
−1 −0.5 0 0.5 1
0
0.1
0.2
0.3
0.4
0.5
(a)
Operonic pairs
Non−operonic
(boundaries)
Non−operonic
(direction)
S. coelicolor
E. coli
12345
−100
0
100
(a)
12345
−100
0
100
Zop,i
Gene position in operon
(c)
12345
−100
0
100
(b)
12345
−100
0
100
(d)
R46.4 Genome Biology 2006, Volume 7, Issue 6, Article R46 Laing et al. />Genome Biology 2006, 7:R46
shows that the closer gene pairs are together (using adjacent
gene pairs on the same strand in the genome), the stronger
the correlation in their expression profiles, independent of
their operonic status. Again, the similarity in gene expression
between adjacent genes transcribed in the same direction is
much larger in E. coli compared to S. coelicolor (Figure 3e).
This has important implications for operon prediction meth-
ods that use microarray data directly or to validate predic-
tions [7,8,11,14] because, particularly in E. coli, gene
proximity is highly correlated with co-expression regardless
of whether the genes are members of the same operon.
Taken together, these results suggest that control of genes
within characterized operons in S. coelicolor is more com-
plex, and that the regulation of expression at adjacent loci is
more diverse than in E. coli. Indeed, the large differences in
gene expression patterns observed between the two species
were unexpected and we tested for bias in the data sets that
might cause this. However, we found no systematic differ-
ences in the number and type of experiments (time-course
derived data and/or single perturbations) or absence of vari-
ation of individual gene expression (measured by an entropy
value, (E Laing and S Hubbard, unpublished data)) that
would lead to higher correlations. Indeed, the latter entropy
calculations suggested there is more variation in the E. coli
data sets. The apparent increased complexity of genetic con-
trol in S. coelicolor might explain this, given the larger, more
complex genome and increased number of transcription
factors.
There is, nevertheless, increased correlation in gene expres-
sion for operonic members (Figure 2a,c) and for this reason
we analyzed expression patterns of documented operons in S.
coelicolor and E. coli. Using a Z-score normalization proce-
dure (see Materials and methods), gene expression across an
operon is normalized to the first gene of the same operon,
which allows individual gene expression patterns both within
and across operons to be compared. For every position i
within an operon the distribution of Z
op,i
for operonic genes at
position i can then be plotted, such that a box in the plots
illustrated in Figure 3a-d represents a gene position in a 'vir-
tual' operon. Figure 3a shows a box plot of Z
op,i
values for each
gene position in operons in S. coelicolor, restricted to five due
to lack of experimental data for larger operons. Figure 3a sug-
gests that operons in S. coelicolor exhibit 'polar' expression,
whereby gene expression generally decreases throughout the
operon, with successive genes having lower expression levels
than the preceding gene. This does not correspond to the
common notion that operonic genes are expressed equally.
This apparent downward trend was tested by randomly shuf-
fling gene order in the same operon set using 1,000 simula-
tions, which showed that when the order of the genes in an
operon are changed no polarity of expression is observed
(data not shown). Using the random (shuffled) Z
op,i
distribu-
tions for each position, p values were obtained. Although no
significance less than p < 0.05 was observed for individual
positions compared to random, the deviations from expecta-
tion for individual genes in given operons is significant, with
Z-values exceeding 20 in many instances. We suggest that the
downward trend of expression is a characteristic of S. coeli-
color operons.
It is evident that some genes do not follow the trend of down-
ward expression observed in Streptomyces operons in Figure
3a. One possible explanation for this increased expression is
the presence of internal promoters, a feature that is thought
to cause problems in operon prediction methods [6-8,11,14].
Although the prediction of promoter sequences is difficult,
TFBSs in prokaryotes tend to be proximal to a promoter [15]
and potential internal promoters were assayed by the identi-
fication of a putative TFBS. Intra-operonic genes (excluding
the initial gene of an operon) were classed as either over-rep-
resented intra-operonic genes (OIGs) with a Z
op,i
greater than
the µ
op,1
+ σ
op,1
or non-over-represented intra-operonic genes
(NOIGs) with a Z
op,i
less than the µ
op,1
- σ
op,1
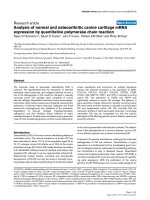
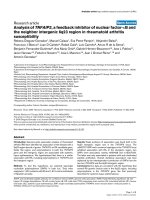
. The abundance
of TFBSs within their upstream intergenic regions was stud-
ied (Figure 4). Figure 4 shows that there is a consistent over-
representation of TFBSs in the OIGS set for Streptomyces,
not present in randomly selected genes from the same operon
set, with a p < 0.05 from a chi-square test using TFBS predic-
tion thresholds m
b
+ nσ
b
(n = 4, 4.5, and 5).
The TFBS prediction algorithm uses position specific weight
matrices (PSWMs) to predict likely sites in the upstream
regions of candidate genes. Some genes do not possess sub-
stantial upstream non-coding sequence, and hence these
genes were filtered out in the TFBS tests shown in Figure 4 in
order to remove any potential bias. However, the gene hisB
(SCO2052) is known to have an internal promoter upstream
in E. coli but has no upstream intergenic sequence in S.
coelicolor, overlapping the upstream neighboring gene by
four bases. This gene was originally assigned to the upregu-
lated set prior to filtering and is, therefore, predicted to be
internally promoted, although our approach would not
attempt to find a putative TFBS. A substantial proportion of
the gene sets fall into this category; 48% of the upregulated
data set and 27% of the normal data set had no upstream
intergenic sequence. The upregulated genes that fall into this
category may well be similar cases in which internal tran-
scription initiation occurs but the internal promoter lies in an
intragenic upstream sequence. The significant difference
between TFBS abundance for upregulated and normal genes
using this method would suggest that TFBS prediction algo-
rithms capable of analyzing overlapping upstream regions
should be developed.
There are several reasons why NOIGs have TFBSs identified
by our prediction methods: first, it could be that those genes
in the majority of cases do not show any upregulation in our
restricted experiments but there are conditions when they are
upregulated; second, the promoter is unregulated and consti-
tutive activity only enables the gene to reach basal expression
Genome Biology 2006, Volume 7, Issue 6, Article R46 Laing et al. R46.5
comment reviews reports refereed researchdeposited research interactions information
Genome Biology 2006, 7:R46
[16]; third, a binding site is present and used in termination,
a phenomenon found in Spiroplasma citri [17]; fourth, exper-
imental error, where expression measurements in the profile
are less than the true biological amount; or fifth, due to false
positives within our TFBS set, although few false positives are
expected at the prediction threshold of m
b
+ 5σ
b
[18].
Only 4 of 55 NOIGs were predicted to have a binding site with
a threshold of m
b
+ 5σ
b
; SCO3358 (cseB), SCO2610 (mreC),
SCO5319 (whiE protein II), and SCO5625 (tsf). No additional
information about the transcriptional status of SCO2610 or
SCO5319 could be found and, consequently, information for
the two remaining genes is briefly discussed here. SCO3358 is
the third gene of the sigE operon, an operon that has been
found to be entirely transcribed only 10% of the time due to
termination downstream of the first gene sigE [19]. In agree-
ment with this, SCO3358 has reduced expression compared
to the first gene of the operon. The binding site we predicted
upstream of SCO3358 (cseB) may offer an additional route to
activate this gene in the operon, as the product of SCO3358
regulates the upstream promoter of the operon [19].
SCO5625 (tsf), is the second gene of a bicistronic operon and
is expressed less than the first gene (rpsB) by a ratio of 2:1 in
S. coelicolor [13], consistent with the array data presented
here. However, the authors of this work [13] could not deduce
the likely mechanism and speculated that attenuation, if
occurring, may be brought about by a 16 base-pair inverted
repeat just upstream of tsf in S. coelicolor, similar to that
found in E. coli. Alternatively, a similar attenuation mecha-
nism in S. coelicolor to that proposed for the rpsB-tsf operon
of Spiroplasma citri may be responsible, where a DNA bind-
ing protein interacts with the region immediately down-
stream of rpsB [20]. The binding site found to be bound by a
protein just upstream of tsf (although how it would influence
transcription is not known) by Le Dantec et al. [20] was an
AT-rich inverted repeat that did not resemble a typical termi-
nator sequence. Interestingly, the inverted repeat predicted
by our method to be in the upstream region of tsf is also AT-
rich. From the 23 OIGs, 5 genes were predicted to have a
TFBS (using the threshold of m
b
+ 5σ
b
); SCO2389 (acpP),
SCO0712 (lipR), SCO2390 (fabF), SCO4662 (tuf1), and
SCO5356 (thrB). Table 1 details known information about the
regulation of these genes, where all but one of the OIGs with
predicted binding sites are known to have a promoter in their
upstream regions. Although formally classified as a monocis-
tronic operon in Streptomyces, thrB is included as it is tran-
scriptionally linked to a bicistronic operon involved in the
same pathway immediately upstream in E. coli, and often
part of an operon in other organisms (for example, B. subtilis)
[21].
The fact that thrB was identified as an OIG and a TFBS was
also predicted is promising for operon prediction algorithm
improvement, since thrB is expressed independently in
Predicted TFBS abundance in operonsFigure 4
Predicted TFBS abundance in operons. Transcription factor binding site (TFBS) abundance in the upstream intergenic regions of intra-operonic genes with
a Z
op,i
greater than µ
op,1
+ σ
op,1
(OIG) and genes with a Z
op,i
less than µ
op,1
- σ
op,1
(NOIG) when using (a) the documented S. coelicolor operon data set
reduced to genes that have an upstream intergenic distance greater than 0, (b) a random selection from documented S. coelicolor operons, (c) Li et al.'s
[17] TFBS prediction on documented E. coli operons, and (d) our TFBS prediction on documented E. coli operons. NOIG, non-over-represented intra-
operonic genes; OIG, over-represented intra-operonic genes.
4 4.5 5 5.5 6
0
20
40
60
80
(a)
4 4.5 5 5.5 6
0
20
40
60
80
(b)
4 4.5 5 5.5 6
0
20
40
60
80
(c)
Transcription factor binding site prediction threshold
Abundance %
4 4.5 5 5.5 6
0
20
40
60
80
(d)
NOIG
OIG
R46.6 Genome Biology 2006, Volume 7, Issue 6, Article R46 Laing et al. />Genome Biology 2006, 7:R46
Streptomyces. Additionally, tuf1 in Streptomyces ramocis-
simus was found to have a TFBS characterized by an inverted
repeat upstream of the internal promoter [22], which is spec-
ulated to play a role in promoter activation; the promoter
sequence, although 'weak' [22], is highly conserved across dif-
ferent strains of streptomycetes, suggesting it plays an impor-
tant role. Interestingly, the TFBS inverted repeat predicted
here in S. coelicolor is very similar to the one found in S. ram-
ocissimus, suggesting that the mechanism for internal upreg-
ulation of tuf1 is conserved.
In contrast to the situation observed in S. coelicolor, no bias
towards increased abundance of TFBSs in OIGs is seen in E.
coli (Figure 4c,d), again suggesting that there is a general dif-
ference in transcriptional regulation between the two species.
Of the 65 experimentally validated internal promoter sites (as
annotated in RegulonDB [23,24]) within our constructed
operon set for E. coli (Additional data file 1) 37% of proximal
downstream genes (to the promoter) were classed as OIGs by
our method using a restricted set of experiments. Of these, 12
genes had upstream intergenic regions that could be tested
for TFBSs. Using the TFBS prediction threshold of m
b
+ 5σ
b
,
we compared the two sets of PSWMs (see Materials and
methods) at finding these known sites. Only 1 site (8%) of the
possible 12 was correctly predicted by the matrices built by Li
and co-workers [18], whilst our matrices identified 5 (42%).
In addition to known sites, our matrices predicted 22 other
putative internal control sites in E. coli operons (compared to
17 by Li and co-workers matrices [18]), 4 of which are docu-
mented in RegulonDB [23,24] as being predicted by compu-
tational methods. A complete list of the predicted internal
promoters in E. coli is given in Additional data file 2.
To further test the internal promoter predictions, box plots
were made of the mean expression of all the operonic genes
upstream and downstream of the putative internal promoter
in this restricted set of S. coelicolor operons, after normaliz-
ing to the first gene of the operon (Figure 5a). In total, 80% of
the mean values for genes downstream of the predicted inter-
nal promoter have a higher expression compared to the mean
values for genes upstream, indicating enhancement of
expression due to presence of the promoter (as expected). As
a control, when selecting the same number of genes randomly
from all of the documented S. coelicolor operons and ran-
domly splitting them into upstream and downstream genes
(following 1,000 simulations) only 32% were upregulated
(Figure 5b). The same trend in E. coli is not observed, with
higher expression observed downstream of the internal pro-
moter in 57% of cases compared to 49% in equivalent random
tests (Figure 5c,d).
Internal termination could also play an important role in the
control of individual gene expression within operons. Hence,
one might expect NOIGs to have a greater abundance of ter-
minators in their upstream regions than OIGs. The prediction
of rho-dependent terminators is a difficult task due to the
diversity of structures bound by the rho-factor and, therefore,
only rho-independent terminators were considered here.
Although rho-independent terminator prediction algorithms
have been developed by several groups (for example, [25-27])
the %G+C richness of the S. coelicolor genome (approxi-
mately 72%) and the phylogenetic similarity of S. coelicolor
and M. tuberculosis [12] suggested the use of GeSTer [28].
This algorithm is not dependent on the presence of a U-rich
tail following a stem-loop, which might be expected to be
absent in S. coelicolor. Permitting stem-loops to be sited up to
300 bases downstream of a gene's stop codon, along with
GeSTer's default settings [28], resulted in 3,365 predicted
terminators. Only about 8% had a U-rich tail, agreeing with
expectations. We used the distance between the end of a gene
and the start of the stem-loop (GDSL) as a potential metric to
reduce false positives, and counted intra-operonic genes from
the OIG and NOIG sets with predicted terminators in the
upstream intergenic regions. Figure 6 shows the fraction of
intra-operonic genes with predicted terminators within the
OIG and NOIG sets, excluding the first gene in each operon,
which would be expected to have a terminator upstream
considering that only 27% of upstream intergenic regions in
S. coelicolor are divergent.
Regardless of expression status, very few intra-operonic
genes are predicted to have an upstream terminator (maxi-
mum of about 32% when considering the entire intergenic
region). The propensity of genes with predicted terminators
for NOIG to OIG are shown in Figure 6, and varies between
0.5 and 2.3. The only clear signal differing from random is
Table 1
Over-represented intra-operonic genes with predicted TFBS*
Gene name Known internal promoter? Organism (reference if known)
SCO2389 (acpP)Yes Escherichia coli [61]
SCO0712 (lipR)? -
SCO2390 (fabF)Yes Escherichia coli [61]
SCO4662 (tuf1)Yes Streptomyces ramocissimus [22]
SCO5356 (thrB) Monocistronic Streptomyces [21]
*OIGs that have a TFBS predicted using threshold background mean + (5 × background standard deviation) and whether they are known to have an
internal promoter and in which organism this has been found in.
Genome Biology 2006, Volume 7, Issue 6, Article R46 Laing et al. R46.7
comment reviews reports refereed researchdeposited research interactions information
Genome Biology 2006, 7:R46
observed within 10 bases of the stop codon of the preceding
gene, where OIGs have a higher propensity for predicted
terminators compared to random, and the opposite effect is
seen for NOIGs. Although this appears to be somewhat coun-
terintuitive, we believe this reflects the need to regulate cer-
tain genes within an operon independently, which may
require the presence of an internal upstream terminator and
promoter, as well as a terminator downstream of the gene.
This would in effect 'isolate' the gene, allowing its expression
independently of the whole operon (where physiological con-
ditions might dictate this). Indeed, we see a similar enrich-
ment for OIGs with a higher propensity for downstream
terminators too (1.7 compared to 0.7 for NOIGs). This sug-
gests a more complex mechanism for the regulation and
expression of some genes within operons, involving both
internal transcriptional initiation and termination.
Finally, to gain some insight into the complexity of intra-
operonic gene regulation, intra-operonic genes were split
using a TFBS prediction threshold of m
b
+ 5σ
b
and a basic
GDSL threshold of 0, to yield four different classes as defined
in Table 2: type 1 and type 2 are likely to represent OIGs due
to the presence of an upstream TFBS, given what is observed
in Figure 4; type 3 are expected to be NOIGs due to the pres-
ence of an upstream terminator but the absence of a putative
TFBS; and type 4 should represent the majority of genes if
there is to be any agreement with the basic operon model as
proposed by Jacob and Monod [29]. The proportion of genes
falling into each class split into OIGs and NOIGs is also shown
in Table 2. Encouragingly, approximately 80% do not have a
predicted TFBS or terminator site. Although this is expected
Variation up and down stream of putative internal promotersFigure 5
Variation up and down stream of putative internal promoters. Box plots of the mean expression of genes upstream and downstream of the putative
internal promoter in (a) documented S. coelicolor operons using our predictions, (b) random simulations of S. coelicolor operons, (c) documented E. coli
operons using experimentally known internal promoters, and (d) random simulations of E. coli operons.
Upstream Downstream
−50
0
50
(a)
Upstream Downstream
−50
0
50
(b)
Upstream Downstream
−50
0
50
Mean Zop,i
Position from internal promoter
(c)
Upstream Downstream
−50
0
50
(d)
Predicted terminator propensities in operonsFigure 6
Predicted terminator propensities in operons. Propensity of over-
represented intra-operonic genes (OIGs) and non-over-represented intra-
operonic genes (NOIGs) predicted to have a terminator in their upstream
intergenic region for all GDSL threshold bins compared to random.
Propensities were calculated by dividing the fraction of OIGs or NOIGs
with a predicted terminator by the fraction of all genes that were OIGs or
NOIGs in this restricted 78 gene subset. This was done for non-inclusive
10 base-pair regions moving out from the stop codon of the previous
gene. Random values were estimated by random picking from the 78 gene
intra-operonic set to represent the OIG and NOIG expressed data sets,
repeating 1,000 times.
10 20 30 40 50 60 70
0.4
0.6
0.8
1
1.2
1.4
1.6
1.8
2
2.2
2.4
Distance between end of gene and start of stem−loop (GDSL)
Propensity
P(OIG|T)
P(NOIG|T)
P(randOIG|T)
P(randNOIG|T)
R46.8 Genome Biology 2006, Volume 7, Issue 6, Article R46 Laing et al. />Genome Biology 2006, 7:R46
to be an overestimate, it is not likely to be a large one given the
low false negative rate expected from use of the TFBS matri-
ces (approximately 2%). Furthermore, the majority of type 4
genes are NOIGs and, therefore, have reduced expression
compared to the first gene in the operon. This suggests that
although internal regulation (promotion and termination)
plays an important role in the control of gene expression of
genes within some operons, this is by no means a universal
mechanism. However, we do expect that some internal TFBSs
are missed by current algorithms (about 20% of the genes
classed as type 4 are upregulated, although no internal sites
could be detected). It is estimated, therefore, that 'internal'
gene regulation is likely to operate on 20% to 40% of operonic
genes, based on the data currently available.
Interestingly, those genes that have both a TFBS and termina-
tor predicted in their upstream regions (type 1) make up 9%
of operonic genes and seem to be mostly upregulated, with a
OIG:NOIG ratio of 1.3. This is consistent with the 'isolated'
gene expression hypothesis, where both an internal promoter
and terminator are required to express this gene independ-
ently from the rest of the operon. In addition, there appear to
be very few genes in this dataset (3%) that have a TFBS and
no terminator (type 2), suggesting that genes that have an
upstream TFBS site also have a terminator present, allowing
for a tighter control of expression.
Conclusion
Although the co-regulation of genes in prokaryotes has been
shown to be highly conserved in some cases when comparing
operonic gene pairs from one organism to the regulon map of
another [30], inter-species operon structure is generally not
stable [1-4,31]. Instability of operons and, therefore, operonic
regulation through the addition, removal, and reorganization
of genes during long-term evolution as well as different phys-
iological and developmental states [31] can produce a variety
of control mechanisms. Furthermore, it has previously been
suggested that patterns of gene co-regulation could be spe-
cific to the organism or a set of closely related organisms [32].
Here we provide evidence that demonstrates large differences
in the general regulatory mechanisms that S. coelicolor and E.
coli use to control gene expression within operons. This is
apparent through the different relative expression patterns
across operons and differences in abundance of predicted
TFBSs within operons, pointing to different levels of intra-
operonic gene regulation between the two species. This raises
a note of caution for those attempting to predict operons
through the use of expression similarity in other species.
Given the dynamistic nature of orthologous genes' operonic
organization and differences in their regulation, we cannot
expect expression across operons to be similar either.
Operons in S. coelicolor exhibit a polarity in expression that
is not observed in E. coli. When considering the minimum
and maximum values obtained for each gene position within
an operon (Figure 3), it could also be seen that E. coli genes
have a tighter distribution of Z
op,i
values than S. coelicolor.
However, this corresponds to a mixture of functionally equiv-
alent and non-equivalent operon examples. It could be
argued that equivalent operons between species that function
in a similar response/pathway may have similar regulatory
elements and/or expression patterns. An examination of
existing comparable data sets suggests otherwise. When com-
paring documented operons in E. coli and the orthologous
operons in S. coelicolor (defined as containing at least one
equivalent gene, yielding a total of 15 pairs matched by gene
name), general expression across the operons is different
(Figure 7). Using expression data from all available
experimental sets, the downward 5' to 3' directionality in
expression is retained in S. coelicolor operons, but is not
shared by orthologous operons in E. coli. This has been
observed previously when differences in the regulation of
orthologous operons across many organisms were character-
ized [1,30], although not from levels of expression across
operons.
The co-transcription of genes in operons allows concerted
expression of gene products involved in the same response/
pathway [33,34]. However, our data demonstrates a marked
polarity of expression in S. coelicolor operons. The concept of
polarity is not new; as early as 1979, Ullman and colleagues
[35] discussed operon polarity as a "salient feature of
prokaryotic gene expression, where promoter-distal genes
have reduced expression compared to promoter-proximal
genes most likely caused by premature termination". This
may be caused by a variety of mechanisms, including environ-
mental factors, absence of termination suppressors, and the
possible presence of the rho-factor [35]. A further factor is
differential mRNA degradation, where genes closer to the 3'
Table 2
Classification of genes by predicted regulatory sites and fraction of OIGs and NOIGs that fall into each gene type
Type number Predicted TFBS? Predicted terminator? OIG (%) NOIG (%)
1 Y Y 5.1 3.9
2 Y N 1.3 1.3
3 N Y 2.6 7.8
4 N N 20.5 57.8
Genome Biology 2006, Volume 7, Issue 6, Article R46 Laing et al. R46.9
comment reviews reports refereed researchdeposited research interactions information
Genome Biology 2006, 7:R46
end of the polycistronic transcript can be degraded more
slowly than genes closer to the 5' end [36].
Although it is not clear from the data presented here which, if
any, of these mechanisms is responsible for the differential
patterns observed in S. coelicolor operons, it is interesting to
compare gene expression differences already characterized
between S. coelicolor and E. coli. S. coelicolor has an esti-
mated 12.3% of 7,825 genes involved in regulation [12] whilst
E. coli has 7.2% of 4,829 genes [37], agreeing with the obser-
vation that the proportion of genes involved in regulation
increases with bacterial genome size [38]. Furthermore, S.
coelicolor has a large number of sigma factors (65) compared
to E. coli's 6. Based on these figures alone we would expect a
greater diversity of regulation in S. coelicolor than in E. coli.
A good example of this greater diversity in S. coelicolor is the
specialization of stress regulons, where each is thought to be
controlled by a specific sigma factor or multiple regulatory
genes with very few induced proteins being shared between
stress responses [12,39]. In contrast, in E. coli, sigma 38
(RpoS) brings on a general response to starvation, osmotic,
oxidative, and heat stresses [39]. Streptomycetes inhabit
highly diverse and dynamic soil and aquatic environments
and, as sessile saprophytic organisms, need to constantly
modulate gene expression levels to adapt to these changes
and modify their metabolism appropriately. This could have
led to the development of a more 'punctuated' and flexible
transcriptional organization. In this context we also speculate
on the potential influence of the high G+C content of Strepto-
myces on the evolution of operons and intra-operon control.
The topological consequences of a high G+C (72%) genome
might have favored the evolution of 'operons' that can be
transcribed segmentally to perhaps modulate torsional stress.
An advantage of operon structure is that, in the majority of
cases, all the genes within an operon encode proteins that are
needed within the same pathway/response. For S. coelicolor,
where specialized responses are elicited under certain condi-
tions, specialized promoters within operons would also be an
advantage. Indeed, where an increase in expression greater
than the expression of the first gene in the operon is needed,
we found evidence for a significant abundance of internal
promoters in S. coelicolor, something not seen in E. coli.
Finally, we have shown that 60% to 80% of S. coelicolor intra-
operonic genes defined in this study did not have any putative
internal control sites upstream. Although this represents the
majority of the operonic genes, it has serious implications for
operon prediction methods. These methods often use the
presence of promoters and/or terminators at the start and/or
end of an operon as signals to delineate operon boundaries,
and clearly in the cases of S. coelicolor this is likely to cause
mis-prediction of operon membership. The consideration of
internal control sites within operons has not yet been imple-
mented in these approaches, and could lead to improvements
for some species. Here, we have shown that the use of across-
operon expression levels combined with TFBSs and termina-
tor prediction is a strategy capable of allowing for such sites.
Work to produce an operon prediction tool that integrates
these different sources of information is on-going in our
laboratory.
Materials and methods
Microarray data
Data from two-color DNA microarrays for S. coelicolor were
collected from two sources: time-dependent gene expression
patterns during development and antibiotic production on
solid growth medium, averaged over three replicates stored in
ArrayExpress [40,41] (Accession numbers: Experiment, E-
MAXD-14; Arrays: A-MAXD-6, UMIST_S
COELICOLOR_SC8_7337; A-MAXD-7, UMIST_S
COELICOLOR_SC3_6077; A-MAXD-8, UMIST_S
COELICOLOR_SC4_6884), resulting in 19 time points with
expression ratios extracted from a Genespring
®
version 5
(Silicon Genetics) output file [42]; and 88 other experiments
publicly available in the Stanford Microarray Database (SMD;
Additional data file 3) [43,44] with expression ratios calcu-
lated from the background-subtracted median values in each
channel. In total, 145 publicly available experiments were col-
lected for E. coli, using 56 from SMD (Additional data file 4)
with expression ratios calculated in the same way as S.
coelicolor SMD data except for mean intensities being used as
medians were unavailable, and taking 89 from the E. coli gene
expression database of the University of Oklahoma [45-53]
(Additional data file 4) with expression ratios calculated from
the available control and test values.
Positive and negative examples of operons
Operon definitions were based on the annotated genome of E.
coli K12 strain MG1655 from GenBank [54,55] [Gen-
Bank:NC_000913
] and the S. coelicolor chromosome (not
cosmid) in EMBL [56,57] [EMBL:AL645882 version 2]. Pos-
itive examples of operons were collected through searching
the literature for operons in S. coelicolor (Additional data file
Comparative gene expression for orthologous operonsFigure 7
Comparative gene expression for orthologous operons. Boxplot of Z
op,i
scores are shown for orthologous operons, where at least one gene is the
same in a documented S. coelicolor compared to E. coli. Data are shown in
E. coli (EC) and S. coelicolor (SC) using all available experiments.
EC1 EC2 EC3 EC4 EC5 SC1 SC2 SC3 SC4 SC5
−120
−100
−80
−60
−40
−20
0
20
40
60
Z,opi
Gene number
R46.10 Genome Biology 2006, Volume 7, Issue 6, Article R46 Laing et al. />Genome Biology 2006, 7:R46
5) and from the transcriptional unit annotation in EcoCyc for
E. coli [58,59] (Additional data file 6). Negative examples of
operons were collected from knowledge of basic operon struc-
ture applicable to both organisms (Figure 8). Assuming that
the entire polycistronic transcript is documented, non-oper-
ons of length 2 were formed by using the initial gene of the
operon and its upstream neighboring gene if that neighbor is
transcribed in the same direction (for example, gene pair d-
e), and the last gene in the documented operon and its down-
stream neighboring gene, again if it is transcribed in the same
direction (for example, gene pair g-h). To increase the size of
the non-operonic data set a non-operon of length 3 was also
formed by collecting triplets of genes that are transcribed in
the opposite direction (for example, genes b-c-d). In total, 35
operons and 1,282 non-operons were collected for S. coeli-
color, and 325 operons and 821 non-operons were collected
for E. coli.
TFBS prediction
Lists of putative TFBSs for both S. coelicolor and E. coli were
collected by searching upstream intergenic regions for over-
represented dimers using the method of Li et al. [18], search-
ing against the same E. coli K12 strain MG1655 from GenBank
[54,55] and S. coelicolor chromosome from EMBL [56,57].
This method defines putative TFBSs as PSWMs for each puta-
tive site, based on the statistical over-representation of
dimeric words (dyads) in defined sequence sets. Our imple-
mentation of this method yielded slightly different results
from the published ones; however, we used both sets of
TFBSs for E. coli - the published TFBSs of Li et al. [18], giving
849 putative sites, and the TFBSs collected with our imple-
mentation of Li et al.'s method [18], resulting in 1,506 puta-
tive sites. Comparisons between the two data sets were
performed and we were able to find all of those published by
Li et al. [18] plus additional sites and we therefore use this as
an alternative set. For S. coelicolor, a TFBS list was built by
searching upstream of all genes on the chromosome and
applying the same method [60], resulting in 3,628 putative
sites defined by PSWMs. Here we define 'upstream' as the
maximum of 300 nucleotides or the intergenic distance to the
stop codon of the previous gene. Previous work applying a
similar approach on S. coelicolor [60] reported 2,497 putative
TFBSs. However, using dyad word lengths of 3 to 5 nucle-
otides instead of 4 nucleotides results in additional matrices,
as well as all of the matrices found previously [60].
Hence, for each putative TFBS the defining sequences can be
matched back against the PSWM, resulting in a mean score
m
d
with standard deviation σ
d
. Similarly, a mean score m
b
with standard deviation σ
b
is obtained matching the PSWM
against background sequences (all upstream sequences) as
described in Li et al. [18]. For a sequence to be predicted to
contain a given TFBS, the score of the sequence against the
PSWM must be higher than m
d
- 2σ
d
and m
b
+ xσ
b
, where x is
used to represent trials of different thresholds as discussed
later in this report; since this is the only part of the threshold
that changes, the TFBS prediction threshold used will be rep-
resented by m
b
+ xσ
b
.
Normalization of microarray data
A per-chip normalization strategy was used throughout. This
was found to be the best normalization strategy with regards
to operon prediction, since the general trajectory of expres-
sion is retained. Hence, all log
2
expression ratios for each
experiment in the microarray data sets collected for S. coeli-
color and E. coli were calculated as follows:
We define the expression level of each gene in a given operon
of m genes as g
i
for i = 1, m. As the first gene of an operon (g
1
)
is the first to be transcribed it is expected that the transcrip-
tion level of the downstream genes should be equal to the
expression of g
1
(given the expectation that they are co-tran-
scribed in a single polycistronic unit) and, therefore, the
expression level of g
1
is taken as a representative of the
operon's expression level (µ
op,1
). Using all available experi-
ments (j) µ
op,1
is calculated by:
Where n = total number of experiments (107 for S. coelicolor
and 145 for E. coli). µ
op,1
has a standard deviation associated
with it (σ
op,1
):
Each gene in an operon (g
i
) can then be expressed as a Z-
score, normalizing its value of expression compared to the
µ
op,1
, Z
op,i
can then be calculated:
The Z-score provides a simple metric that measures the
expression level of genes in an operon with respect to the first,
Examples of positive and control sets of operons/non-operonsFigure 8
Examples of positive and control sets of operons/non-operons.
ba e f gc d h i
Non-operonNon-operon
Known operon Known operon
Non-operonNon-operonNon-operon
ba e f gc d h iba e f gc d h iba e f gc d h i
Non-operonNon-operon
Known operon Known operon
Non-operonNon-operonNon-operon
g
ij,
log (
______
=
2
expression ratio of gene i in experiment_j
Median
____ _ __
)
of all expression ratios in experiment_j
µ
op
j
j
n
g
n
,
,
1
1
0
=
=
∑
σ
µ
op
ij op
j
n
g
n
,
,,
()
1
1
2
0
1
=
−
−
=
∑
Z
gn
op i
op i op
op
ij
j
n
op
op
,
,,
,
,,
,
/
=
−
=
−
=
∑
µµ
σ
µ
σ
1
1
0
1
1
Genome Biology 2006, Volume 7, Issue 6, Article R46 Laing et al. R46.11
comment reviews reports refereed researchdeposited research interactions information
Genome Biology 2006, 7:R46
with an expectation that genes should have small Z-scores
close to 0 if the measured expression of every gene in an
operon is truly uniform. In addition, this procedure facilitates
cross-operon comparison by normalizing the expression of
the first gene in every operon to 0.
Additional data files
The following additional data are available with the online
version of this paper. Additional data file 1 lists 65 E. coli
genes found in our constructed data set of operons that have
an experimentally validated upstream internal promoter.
Additional data file 2 comprises two tables: the top table
describes OIGs in E. coli found to have a putative TFBS site
using our own PSWMs, their Z
op,i
score (in comparison to the
first gene of the respective operon) and whether they are
experimentally known (or computationally predicted); the
bottom table describes E. coli OIGs predicted to have an
upstream internal promoter using Li et al. [18] matrices.
Additional data file 3 lists the SMD Experiment IDs used for
S. coelicolor. Additional data file 4 lists the Oklahoma data-
base experiment IDs and SMD Experiment IDs used for E.
coli. Additional data file 5 documents experimentally vali-
dated operons used in this analysis for S. coelicolor. Addi-
tional data file 6 documents experimentally validated
operons used in this analysis for E. coli.
Additional File 1Sixty-five E. coli genes found in our constructed data set of operons that have an experimentally validated upstream internal promoterSixty-five E. coli genes found in our constructed data set of operons that have an experimentally validated upstream internal promoter.Click here for fileAdditional File 2OIGs in E. coli found to have a putative TFBS site and predicted to have an upstream internal promoterThe top table describes OIGs in E. coli found to have a putative TFBS site using our own PSWMs, their Z
op,i
score (in comparison to the first gene of the respective operon) and whether they are exper-imentally known (or computationally predicted); the bottom table describes E. coli OIGs predicted to have an upstream internal pro-moter using Li et al. [18] matrices.Click here for fileAdditional File 3SMD Experiment IDs used for S. coelicolorSMD Experiment IDs used for S. coelicolor.Click here for fileAdditional File 4Oklahoma database experiment IDs and SMD Experiment IDs used for E. coliOklahoma database experiment IDs and SMD Experiment IDs used for E. coli.Click here for fileAdditional File 5Experimentally validated operons used in this analysis for S. coelicolorExperimentally validated operons used in this analysis for S. coelicolor.Click here for fileAdditional File 6Experimentally validated operons used in this analysis for E. coliExperimentally validated operons used in this analysis for E. coli.Click here for file
Acknowledgements
E.L. was the recipient of a MRC Priority PhD Studentship in Bioinformatics.
This work was partly supported by grants from the BBSRC (to CPS).
References
1. Dandekar T, Snel B, Huynen M, Bork P: Conservation of gene
order: a fingerprint of proteins that physically interact.
Trends Biochem Sci 1998, 23:324-328.
2. Itoh T, Takemoto K, Mori H, Gojobori T: Evolutionary instability
of operon structures disclosed by sequence comparisons of
complete microbial genomes. Mol Biol Evol 1999, 16:332-346.
3. Mushegian AR, Koonin EV: Gene order is not conserved in bac-
terial evolution. Trends Genet 1996, 12:289-290.
4. Snel B, Bork P, Huynen MA: Conservation of gene co-regulation
in prokaryotes and eukaryotes. Trends Biotechnol 2002, 20:410.
5. Salgado H, Moreno-Hagelsieb G, Smith TF, Collado-Vides J: Operons
in Escherichia coli: Genome analyses and predictions. Proc Natl
Acad Sci 2000, 97:6652-6657.
6. Yada T, Nakao M, Totoki Y, Nakai K: Modelling and predicting
transcriptional units of Escherichia coli genes using hidden
markov models. Bioinformatics 1999, 15:987-993.
7. de Hoon MJL, Imoto S, Kobayashi K, Ogasawara N, Miyano S: Pre-
dicting the operon structure of Bacillus subtilis using operon
length, intergene distance, and gene expression information.
In Proceedings of the Ninth Pacific Symposium on Biocomputing: January 6-
10 2004; Hawaii Edited by: Altman RB, Dunker AK, Hunter L, Jung
TA. Klein TE: World Scientific; 2004:276-287.
8. Sabatti C, Rohlin L, Oh M, Liao JC: Co-expression pattern from
DNA microarray experiments as a tool for operon
prediction. Nucleic Acids Res 2002, 30:2886-2893.
9. Bockhorst J, Craven M, Page D, Shavlik J, Glasner J: A Bayesian net-
work approach to operon prediction. Bioinformatics 2003,
19:1227-1235.
10. Bockhorst J, Qiu Y, Glasner J, Liu M, Blattner F, Craven M: Predict-
ing bacterial transcriptional units using sequence and
expression data. Bioinformatics 2003:i34-i43.
11. Craven M, Page D, Shavlik J, Bockhorst J, Glasner J: A probabilistic
learning approach to whole-genome operon prediction. In
Proceedings of the 8th International Conference on Intelligent Systems for
Molecular Biology (ISMB): August 19-23 2000; San Diego Edited by:
Bourne P, Gribskov M, Altman R, Jensen N, Hope D, Lengauer T,
Mitchell J, Scheeff E, Smith C, Strande S, et al. American Association
for Artificial Intelligence Press; 2000:116-127.
12. Bentley SD, Chater KF, Cerdeño-Tárraga AM, Challis GL, Thomson
NR, James KD, Harris DE, Quail MA, Kieser H, Harper D, et al.:
Complete genome sequence of the model actinomycete
Streptomyces coelicolor A3(2). Nature 2002, 417:141-147.
13. Hoogvliet G, van Wezel GP, Krall B: Evidence that a single EF-Ts
suffices for the recycling of multiple and divergent EF-TU
species in Streptomyces coelicolor A3(2) and Streptomyces
ramocissimus. Microbiology 1999, 145:2293-2301.
14. Price MN, Huang KH, Alm E, Arkin AP: A novel method for accu-
rate operon predictions in all sequenced prokaryotes. Nucleic
Acids Res 2005, 33:880-892.
15. Thieffry D, Salgado H, Huerta AM, Collado-Vides J: Prediction of
transcriptional regulatory sites in the complete genome
sequence of Escherichia coli K-12. Bioinformatics 1998,
14:391-400.
16. Wek RC, Hatfield GW: Examination of the internal promoter,
PE, in the ilv GMEDA operon of E. coli K-12. Nucleic Acids Res
1986, 14:2763-2777.
17. Le Dantec L, Bové JM, Saillard C: Gene organisation and tran-
scriptional analysis of the Spiroplasma citri rsp B/tsf/x operon.
Curr Microbiol 1998, 37:269-273.
18. Li H, Rhodius V, Gross C, Siggia ED: Identification of the binding
sites of regulatory proteins in bacterial genomes. Proc Natl
Acad Sci 2002, 99:11772-11777.
19. Paget MSB, Leibovitz E, Buttner MJ: A putative two-component
signal transduction system sE, a sigma factor required for
normal cell wall integrity in Streptomyces coelicolor A3(2).
Mol Microbiol 1999, 33:97-107.
20. Le Dantec L, Castroviejo M, Bové JM, Saillard C: Purification, clon-
ing, and preliminary characterisation of a Spiroplasma citri
ribosomal protein with DNA binding capacity. J Biol Chem
1998, 273:24379-24386.
21. Fernández M, Cuadrado Y, Reico E, Aparicio JF, Martin JF: Charac-
terisation of the hom-thrC-thrB cluster in aminoethoxyvi-
nylglycine-producing Streptomyces sp. NRRL 5331.
Microbiology 2002, 148:1413-1420.
22. Tieleman LN, van Wezel GP, Bibb MJ, Kraal B: Growth phase-
dependent transcription of the Streptomyces ramocissimus tuf
1 gene occurs from two promoters. J Bacteriol 1997,
179:3619-3624.
23. RegulonDB [ />24. Salgado H, Gama-Castro S, Peralta-Gil M, Diaz-Peredo E, Sanchez-
Solano F, Santos-Zavaleta A, Martinez-Flores I, Jimenez-Jacinto V,
Bonavides-Martinez C, Segura-Salazar J, et al.: RegulonDB (version
5.0): Escherichia coli K-12 transcriptional regulatory network,
operon organization, and growth conditions. Nucleic Acids Res
2006, 34:D394-D397.
25. d'Aubenton Carafa Y, Brody E, Thermes C: Prediction of rho-inde-
pendent Escherichia coli transcription terminators. A
statistical analysis of their RNA stem-loop structures. J Mol
Biol 1990, 216:835-858.
26. Ermolaeva MD, Khalak HG, White O, Smith HO, Salzberg SL: Pre-
diction of transcription terminators in bacterial genomes. J
Mol Biol 2000, 301:27-33.
27. Macke T, Ecker DJ, Gutell R, Gautheret D, Case D, Sampath R:
RNAMotif, an RNA secondary structure definition and
search algorithm. Nucleic Acids Res 2001, 29:4724-4735.
28. Unniraman S, Prakash R, Nagaraja V: Conserved economics of
transcription termination in eubacteria. Nucleic Acids Res 2002,
30:675-684.
29. Jacob F, Monod J: Genetic regulatory mechanisms in the syn-
thesis of proteins. J Mol Biol 1961, 3:318-356.
30. Snel B, van Noort V, Huynen MA: Gene co-regulation is highly
conserved in the evolution of eukaryotes and prokaryotes.
Nucleic Acids Res 2004, 32:4725-4731.
31. Xie G, Keyhani NO, Bonner CA, Jensen RA: Ancient origin of the
tryptophan operon and the dynamics of evolutionary
change. Microbiol Mol Biol Rev 2003, 67:303-342.
32. Teichmann S, Babu MM: Conservation of gene co-regulation in
prokaryotes and eukaryotes. Trends Biotechnol 2002, 20:407-410.
33. Lawrence JG, Roth JR: Selfish operons: Horizontal transfer may
R46.12 Genome Biology 2006, Volume 7, Issue 6, Article R46 Laing et al. />Genome Biology 2006, 7:R46
drive the evolution of gene clusters. Genetics 1996,
143:1843-1860.
34. Price MN, Huang KH, Arkin AP, Alm E: Operon formation is
driven by co-regulation and not by horizontal gene transfer.
Genome Res 2005, 15:809-819.
35. Ullmann A, Joseph E, Danchin A: Cyclic AMP as a modulator of
polarity in polycistronic transcriptional units. Proc Natl Acad Sci
USA 1979, 76:3194-3197.
36. Selinger DW, Saxena RM, Cheung KJ, Church GM, Rosenow C: Glo-
bal RNA Half-life analysis in Escherichia coli reveals positional
patterns of transcript degradation. Genome Res 2003,
13:216-233.
37. Pérez-Rueda E, Collado-Vides J: The repertoire of DNA-binding
transcriptional regulators in Escherichia coli K-12. Nucleic Acids
Res 2000, 28:1838-1847.
38. Stover CK, Pham XQ, Erwin AL, Mizoguchi SD, Warrener P, Hickey
MJ, Brinkman FSL, Hufnagle WO, Kowalik DJ, Lagrou M, et al.: Com-
plete genome sequence of Pseudomonas aeruginosa PA01, an
opportunistic pathogen. Nature 2000, 406:959-964.
39. Vohradsky J, Li XM, Dale G, Folcher M, Nguyen L, Viollier PH,
Thompson CJ: Developmental control of stress stimulons in
Streptomyces coelicolor revealed by statistical analyses of glo-
bal gene expression patterns. J Bacteriol 2000, 182:4979-4986.
40. ArrayExpress [ />41. Parkinson H, Sarkans U, Shojatalab M, Abeygunawardena N, Contrino
S, Coulson R, Farne A, Garcia Lara G, Holloway E, Kapushesky M, et
al.: ArrayExpress-a public repository for microarray gene
expression data at the EBI. Nucleic Acids Res 2005,
33:D553-D555.
42. Mersinias V: DNA microarray-based analysis of gene expres-
sion in Streptomyces coelicolor A3(2) and Streptomyces livi-
dans. In PhD thesis University of Manchester Institute of Science and
Technology, Department of Biomolecular Sciences; 2004.
43. Stanford Microarray Database [n
ford.edu]
44. Gollub J, Ball CA, Binkley G, Demeter J, Finklestein DB, Hebert JM,
Hernandez-Boussard T, Jin H, Kaloper M, Matese JC, et al.: The
Stanford Microarray Database: data access and quality
assessment tools. Nucleic Acids Res 2003, 31:94-96.
45. University of Oklahoma E. coli Gene Expression Database
[ />46. Chang DE, Smalley DJ, Conway T: Gene expression profiling of
Escherichia coli growth transitions: an expanded stringent
response model. Mol Microbiol 2002, 45:289-306.
47. Chang DE, Smalley DJ, Tucker DL, Leatham MP, Norris WE, Steven-
son SJ, Anderson AB, Grissom JE, Laux DC, Cohen PS, Conway T:
Carbon Nutrition of E. coli in the Mouse Intestine. Proc Natl
Acad Sci USA 2004, 101:7427-7432.
48. Ma Z, Richard H, Tucker DL, Conway T, Foster JW: Collaborative
regulation of Escherichia coli Glutamate-dependent acid
resistance by two Arac-like regulators, GadX and GadW
(YHiW). J Bacteriol 2002, 184:7001-7012.
49. Ma Z, Gong S, Richard H, Tucker DL, Conway T, Foster JW: GadE
(YhiE) activates glutamate decarboxylase-dependent acid
resistance in Escherichia coli K-12. Mol Microbiol 2003,
49:1309-1320.
50. Tao H, Bausch C, Richmond C, Blattner FR, Conway T: Functional
genomics: Expression analysis of Escherichia coli growing on
minimal and rich media. J Bacteriol 1999, 181:6425-6440.
51. Tucker DL, Tucker N, Conway T: Gene expression profiling of
the pH response in Escherichia coli. J Bacteriol 2002,
184:6551-6558.
52. Tucker DL, Tucker N, Ma Z, Foster JW, Miranda RL, Cohen PS, Con-
way T: Genes of the GadX-GadW regulon in Escherichia coli.
J Bacteriol 2003, 185:3190-3201.
53. Wolfe AJ, Chang D, Walker JD, Seitz-Partridge JE, Vidaurri MD, Lange
CF, Prüß BM, Henk MC, Larkin JC, Conway T: Evidence that acetyl
phosphate functions as a global signal during biofilm
development. Mol Microbiol 2003, 48:977-988.
54. GenBank [ />55. Benson DA, Karsch-Mizrachi I, Lipman DJ, Ostell J, Wheeler DL:
GenBank: update. Nucleic Acids Res 2004, 32:D23-D26.
56. EMBL [ />57. Kanz C, Aldebert P, Althorpe N, Baker W, Baldwin A, Bates K,
Browne P, van der Broek A, Castro M, Cochrane G, et al.: The
EMBL Nucleotide Sequence Database. Nucleic Acids Res 2005,
33:D29-D33.
58. EcoCyc []
59. Keseler IM, Collado-Vides J, Gama-Castro S, Ingraham J, Paley S,
Paulsen IT, Peralata-Gil M, Karp PD: EcoCyc: A comprehensive
database resource for Escherichia coli. Nucleic Acids Res 2005,
33:D334-D337.
60. Studholme DJ, Bentley SD, Kormanec J: Bioinformatic identifica-
tion of novel regulatory DNA sequence motifs in Streptomy-
ces coelicolor. BMC Microbiol 2004, 4:14.
61. Zhang Y, Cronan JE Jr: Polar allele duplication for transcrip-
tional analysis of consecutive essential genes: application to
a cluster of Escherichia coli fatty acid biosynthetic genes. J
Bacteriol 1996, 178:3614-3620.