Báo cáo y học: "Integration of metabolite with transcript and enzyme activity profiling during diurnal cycles in Arabidopsis rosettes" pptx
Bạn đang xem bản rút gọn của tài liệu. Xem và tải ngay bản đầy đủ của tài liệu tại đây (916.52 KB, 23 trang )
Genome Biology 2006, 7:R76
comment reviews reports deposited research refereed research interactions information
Open Access
2006Gibonet al.Volume 7, Issue 8, Article R76
Research
Integration of metabolite with transcript and enzyme activity
profiling during diurnal cycles in Arabidopsis rosettes
Yves Gibon
*
, Bjoern Usadel
*
, Oliver E Blaesing
*†
, Beate Kamlage
†
,
Melanie Hoehne
*
, Richard Trethewey
†
and Mark Stitt
*
Addresses:
*
Max Planck Institute of Molecular Plant Physiology, Science Park Golm, Am Muehlenberg, D-14476 Potsdam-Golm, Germany.
†
metanomics GmbH, Tegeler Weg, 10589, Berlin, Germany.
Correspondence: Yves Gibon. Email:
© 2006 Gibon et al.; licensee BioMed Central Ltd.
This is an open access article distributed under the terms of the Creative Commons Attribution License ( which
permits unrestricted use, distribution, and reproduction in any medium, provided the original work is properly cited.
Arabidopsis diurnal cycles<p>An analysis of the temporal dynamics of metabolite and transcript levels, as well as enzyme activity, of 137 metabolites during diurnal cycles in <it>Arabidopsis </it>leaves</p>
Abstract
Background: Genome-wide transcript profiling and analyses of enzyme activities from central
carbon and nitrogen metabolism show that transcript levels undergo marked and rapid changes
during diurnal cycles and after transfer to darkness, whereas changes in activities are smaller and
delayed. In the starchless pgm mutant, where sugars are depleted every night, there are
accentuated diurnal changes in transcript levels. Enzyme activities in this mutant do not show larger
diurnal changes; instead, they shift towards the levels found in the wild type after several days of
darkness. This indicates that enzyme activities change slowly, integrating the changes in transcript
levels over several diurnal cycles.
Results: To generalize this conclusion, 137 metabolites were profiled using gas and liquid
chromatography coupled to mass spectroscopy. The amplitudes of the diurnal changes in
metabolite levels in pgm were (with the exception of sugars) similar or smaller than in the wild type.
The average levels shifted towards those found after several days of darkness in the wild type.
Examples include increased levels of amino acids due to protein degradation, decreased levels of
fatty acids, increased tocopherol and decreased myo-inositol. Many metabolite-transcript
correlations were found and the proportion of transcripts correlated with sugars increased
dramatically in the starchless mutant.
Conclusion: Rapid diurnal changes in transcript levels are integrated over time to generate quasi-
stable changes across large sectors of metabolism. This implies that correlations between
metabolites and transcripts are due to regulation of gene expression by metabolites, rather than
metabolites being changed as a consequence of a change in gene expression.
Background
A full understanding of metabolic networks requires quanti-
tative data about transcript levels, protein levels or enzyme
activities, and metabolite levels. Interactions between these
three functional levels will depend on the structure of the
metabolic and signaling network, and on the dynamics of
transcript, protein and metabolite turnover. Many inputs,
including changes in metabolite levels, contribute to the
Published: 17 August 2006
Genome Biology 2006, 7:R76 (doi:10.1186/gb-2006-7-8-r76)
Received: 11 May 2006
Revised: 22 June 2006
Accepted: 17 August 2006
The electronic version of this article is the complete one and can be
found online at />R76.2 Genome Biology 2006, Volume 7, Issue 8, Article R76 Gibon et al. />Genome Biology 2006, 7:R76
regulation of gene expression. Changes in the levels of tran-
scripts modify the levels of the encoded enzymes and the
levels of metabolites or, more broadly, the metabolic pheno-
type. The impact of changes in transcript levels on metabo-
lism will depend on the rates of turnover of the encoded
proteins, their contribution to the control of the metabolic
pathways that they are involved in, and the rates of turnover
of the metabolites that are in, or are produced by, these path-
ways. There have been many focused studies on the impact of
altered expression of single genes on protein and metabolite
levels [1,2], and broader genomics studies that link changes at
the levels of transcripts and proteins or enzymes [3,4], or
transcripts and metabolites [5,6], but relatively few global
studies of responses at all three levels [7]. Most studies have
also concentrated on comparing individual conditions, rather
than analyzing the temporal dynamics during a time series.
The paucity of multilevel studies is partly because of technical
reasons. While global changes in expression can be routinely
analyzed using custom-made or commercial arrays [8-10], it
is more difficult to obtain quantitative information about the
accompanying changes in protein levels and metabolites.
Quantitative proteomics is still in its infancy [3,11]. The
importance of analyzing changes in protein levels is under-
lined by the growing evidence that, at least in eukaryotes, pro-
tein levels can change independently of the levels of the
transcripts that encode them [3,12]. We recently developed a
robotized system to measure the activities of >20 enzymes
involved in central carbon and nitrogen metabolism using
optimized assays, in which the measured activity reflects
changes in protein levels [4]. This platform was used to ana-
lyze changes in enzyme activities during diurnal light/dark
cycles and during several days of darkness in Arabidopsis
leaves. Most enzyme activities changed less and much more
slowly than transcripts, and the attenuation and delay varied
from enzyme to enzyme. Routine analysis of large numbers of
metabolites is complicated by the vast number and chemical
diversity of the metabolites in a given organism [13-16].
Methods have been developed for the profiling of metabolites
using gas chromatography-mass spectroscopy (GC-MS)
[17,18] and liquid chromatography-mass spectroscopy (LC-
MS) [19] or nuclear magnetic resonance (NMR) [20,21], but
to date relatively few studies have applied these technologies
in combination with global analysis of levels of transcripts
[5,6,22,23] or proteins [24,25].
Normalization, analysis and display of multilayered data sets
also pose challenges. While considerable progress has been
achieved for transcript arrays [26-28], there is no consensus
on normalization strategies for metabolites and/or proteins.
Typically, log fold-change normalization is used when metab-
olites are involved. Combined network analysis with imple-
mented causality has been used to generate putative gene-
metabolite communication networks [29] and protein-
metabolite networks [30]. Deeper insights are provided when
the experimental data are integrated with information about
the structure of metabolic or signaling pathways, as illus-
trated in a recent study of glucosinolates and primary metab-
olism [5,6]. Although general metabolic pathway databases
such as KEGG exist to support the integration of previous
knowledge, it is often necessary to edit or extend them for use
with a specific organism or set of organisms. Some specific
plant metabolome/transcriptome pathway databases have
been developed recently [16,22,31]. Software tools are also
emerging that allow multiple facets of data to be displayed on
a common interface [32]. However, such approaches quickly
run into the limitation that only small sectors of metabolism
can be usefully visualized when items are being viewed at dif-
ferent levels.
Plants typically grow in a diurnal light/dark cycle, providing
an amenable system to analyze the temporal dynamics of
changes in gene expression and metabolism. In the light, pho-
tosynthetic CO
2
fixation drives the synthesis of sucrose in
leaves and its export to the remainder of the plant to support
growth and storage, whereas at night the plant becomes a net
consumer of carbon [33-36]. The following experiments ana-
lyze changes in transcripts, enzyme activities and metabolites
during a diurnal cycle and under two further conditions that
accentuate changes in sugars; a prolonged dark treatment
and the starchless pgm mutant. Prolongation of the night
leads within a few hours to total exhaustion of starch and a
collapse of sugars and related metabolites, even in wild-type
(WT) plants [22]. This provides a system to investigate the
responses of transcript levels, enzyme activities and metabo-
lite levels over a longer time frame than is available in the 24
h light/dark cycle. Starch normally accumulates in leaves in
the light and is remobilized and converted to sucrose at night
[4,37]. The pgm mutant lacks plastid phosphoglucomutase
activity, which is an essential enzyme for photosynthetic
starch synthesis [38]. It accumulates very high levels of sug-
ars in the day, but has very low levels of sugars in the second
part of the night [36-38]. This provides a system to investi-
gate how recurring accentuated changes in the levels of sug-
ars impact on the diurnal responses of transcript levels,
enzyme activities and other metabolites.
The responses of transcript levels and 23 enzyme activities
during the diurnal cycle and an extended dark treatment in
WT Arabidopsis, and during the diurnal cycle in starchless
pgm mutants, were presented in [4,37]. In WT, over 30% of
the genes expressed in rosettes exhibit significant diurnal
changes in their transcript levels, mainly driven by changes of
sugars and by the circadian clock [37]. Prolongation of the
night leads to marked changes of hundreds of transcripts
within 4 to 6 h [22], and thousands of transcripts after 1 to 2
days (O Blaesing, unpublished data). The accentuated diurnal
changes in sugar levels in the starchless pgm mutant lead to
exaggerated diurnal changes in the levels of >4,000 tran-
scripts [37]. These are mainly due to the low levels of sugars
at night; in the light period the global transcript levels in pgm
resemble those in WT, whereas in the dark the global
Genome Biology 2006, Volume 7, Issue 8, Article R76 Gibon et al. R76.3
comment reviews reports refereed researchdeposited research interactions information
Genome Biology 2006, 7:R76
transcript profile in pgm resembles WT after a 4 to 8 h exten-
sion of the night [4,37]. The responses of enzyme activities
were smaller and much slower than those of transcripts [4],
both during diurnal cycles and the extended dark treatment
in WT, and when WT is compared with pgm. In particular,
whereas transcript levels in pgm resembled WT after a 6 hour
extension of the night (see above), enzyme activities in pgm
resembled WT after several days of darkness [4,22,37].
Based on these results, we propose that: changes in enzyme
activities are strongly delayed compared to changes in tran-
script levels; and a series of transient but recurring changes in
transcript levels are integrated over time as changes in
enzyme activities. This conclusion is based on an analysis of
23 enzymes involved in central carbon and nitrogen metabo-
lism. The following paper generalizes this conclusion by ana-
lyzing the responses of 137 metabolites, measured using GC-
MS and LC-MS. The underlying hypothesis is that changes in
the metabolite profile will integrate the responses of hun-
dreds of enzymes across several sectors of metabolism.
Results and discussion
Changes in transcript levels and enzyme activities
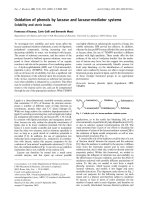
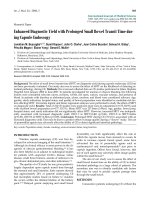
A subset of the published data on changes in transcript levels
and enzyme activities is summarized in Figure 1, to highlight
aspects that are important for the present paper and facilitate
comparison with the new data on metabolites. Figure 1 sum-
marizes the changes in transcript levels for 82 genes, which
encode the 23 enzymes analyzed in [4]. The number of genes
is larger than the number of enzymes because many enzymes
are encoded by small gene families. For each transcript, the
average level was estimated across all the time points in WT
and pgm diurnal cycles, and the prolonged night. These aver-
age values are shown using a monotonic color scale on the far
left-hand side of the figure (the first column), and indicate
which members of a given gene family are expressed at either
a low or high level. A transcript level at a given time was
divided by the average value, converted to a log
2
scale and
presented in a false color scale (blue = increase, red =
decrease) to display the temporal changes in the transcript
levels in a concise manner.
Many of the 82 genes show diurnal changes in transcript lev-
els in WT (the second column). The amplitude and timing
varies from gene to gene (Figure 1). Most show an accentu-
ated diurnal change in pgm (the fourth column), including
some that do not show marked diurnal changes in WT.
Almost all of the genes show marked changes in their tran-
script levels after a prolonged night (the third column labeled
XN). In most cases, the response after the prolonged night
treatment represents an extension of the changes towards the
end of the night in WT or pgm. A few genes show a change
after the prolonged night that is opposite to that during the
later part of the diurnal cycle in WT; for example, two genes
(NIA1, NIA2) encoding nitrate reductase and one of the two
genes encoding ferredoxin-glutamate synthase rose at the
end of the night in WT but fell during a prolonged night. For
most of these, the diurnal response in pgm also differs from
that in WT, and the response during a prolonged night resem-
bles that in the last part of the night in the pgm mutant.
The same normalization was used to depict changes in
enzyme activities (Figure 1). As discussed in [4], the ampli-
tudes of the diurnal changes of enzyme activities are unre-
lated to the changes of the encoding transcript levels, and the
daily peak of enzyme activity is delayed compared to the peak
of transcript level by an interval that varies from enzyme to
enzyme. Two further aspects of the data highlight that tran-
script levels and enzyme activities respond with very different
dynamics. First, when plants are subjected to prolonged dark-
ness there are widespread and coordinated changes in the
transcript levels for many genes within 6 h, whereas the
changes in enzyme activity require several days (compare
transcript levels and activities). Second, instead of showing
larger diurnal changes, enzyme activities in pgm are typically
shifted to a new value that qualitatively resembles the WT
after a prolonged dark treatment. For example, transcripts for
glutamate dehydrogenase and invertase show a rapid over-
shoot and a lower but sustained increase in WT in an
extended night, and increase transiently at the end of the
night in pgm (Figure 1). The activities rise gradually over sev-
eral days in an extended night, and show a marked increase in
pgm that is maintained across the entire diurnal cycle. An
analogous response is found for many enzymes involved in
respiratory metabolism, nitrogen assimilation and amino
acid synthesis, including fructokinase, NAD-glyceraldehyde-
3P dehydrogenase, PPi-phosphofructokinase, phosphoe-
nolpyruvate carboxylase, NADP-isocitrate dehydrogenase,
ferredoxin-glutamate synthase, alanine and aspartate ami-
notransferases, fumarase, shikimate dehydrogenase, and
transketolase. In this case, the transcript levels fall rapidly in
a prolonged night, but the activities do not decrease until sev-
eral days later. Their activities during the diurnal cycle are
lower in pgm than WT.
Our approach requires that these measurements of enzyme
activity can be used as a surrogate for measurements of pro-
tein levels. In these assays, the reaction product is determined
via highly sensitive enzymatic cycling systems [4], which
allow the use of highly diluted extracts. All optimized assays
were shown to be linear with time and independent of the
extract concentration, indicating that they are not compro-
mised by inhibitory compounds in the extracts. Substrate lev-
els and other assay conditions were optimized to allow
measurement of Vmax activity [4]. In selected cases, immu-
noassays were used to confirm that the changes in activity
match the changes in protein level, measured by [4] (and
unpublished data).
R76.4 Genome Biology 2006, Volume 7, Issue 8, Article R76 Gibon et al. />Genome Biology 2006, 7:R76
Figure 1 (see legend on next page)
At1g42970
At2g24270
At3g26650
At2g45290
At3g60750
At1g27680
At2g21590
At4g39210
At5g19220
At5g48300
At1g24280
At3g27300
At5g13110
At5g35790
At5g40760
At1g43670
At1g12000
At1g20950
At1g76550
At2g22480
At4g32840
At4g10120
At5g11110
At5g20280
At1g12240
At1g22650
At1g55120
At1g62660
At3g13790
At4g34860
At1g03160
At1g66430
At1g69200
At2g31390
At3g54090
At5g51830
At1g47840
At1g50460
At2g19860
At4g29130
At1g13440
At1g79530
At3g04120
At1g32440
At2g36580
At3g22960
At3g49160
At5g08570
At5g52920
At5g56350
At5g63680
At1g53310
At2g42600
At3g14940
At1g54340
At1g65930
At5g50950
At1g37130
At1g77760
At1g66200
At3g17820
At3g53170
At3g53180
At5g35630
At5g37600
At5g57440
At2g41220
At5g04140
At3g03910
At5g07440
At5g18170
At1g62800
At2g22250
At2g30970
At4g31990
At5g11520
At5g19550
At1g17290
At1g23310
At1g70580
At3g06350
At
1g80460
EC 1.2.1.13
NADP-GAPD
H
EC 2.2.1.1
T
K
EC 2.7.7.27
AGPase
EC 1.1.1.49
EC 3.1.3.11
G6PDH
EC 2.7.1.90
EC 2.4.1.14
EC 3.2.1.26
PFP
SPS
Invertase, acid
Fructokinase
Glucokinase
NAD-GAPD
EC 2.7.1.4
EC 2.7.1.1
EC 1.2.1.12
H
EC 2.7.1.40
EC 4.1.1.31
EC 1.1.1.42
EC 4.2.1.2
EC 1.7.1.1
PK
PEPCase
NADP-ICDH
Fumarase
N
R
EC 2.7.7.42
EC 1.4.7.1
GS
Fd-GOGA
T
EC 1.4.1.2
EC 2.6.1.1
GDH
Asp AT
EC 2.6.1.2
Ala AT
EC 1.1.1.25
Shikimate DH
Lipids Gl
EC 2.7.1.30
ycerokinase
-5 -4 -3 -2 -1 0 1 2 3 4 5
pgmWT XN
Transcripts
Amino acids
Organic acids
Glycolysis
Major CHO metabolism
Photosynthesis
Amino acids
Organic acids
Major CHO metabolism
Glycolysis
Photosynthesis
Ala AT
Asp AT
GDH
Fd-GOGAT
GS
NR
NADP-ICDH
PEPCase
PK
NAD-GAPDH
Glucokinase
PFP
SPS
Acid Inv
Fructokinase
NADP-GAPDH
TK
AGPase
G6PDH
Glycerokinase
Shikimate DH
Fumarase
cytFBPase
Lipids
4 8 12 16 20 24 0 2 4 6 8 24 48 72 144 4 8 12 16 20 24
Log ratio
2
020 406080100
Relative proportion %
cytFBPase
Activities
Genome Biology 2006, Volume 7, Issue 8, Article R76 Gibon et al. R76.5
comment reviews reports refereed researchdeposited research interactions information
Genome Biology 2006, 7:R76
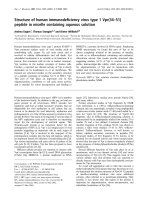
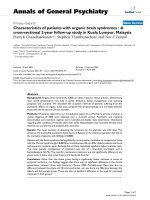
Diurnal changes in metabolite levels in WT Arabidopsis
Figure 2 summarizes the diurnal changes of 70 known metab-
olites during the WT diurnal cycle. The original data, includ-
ing changes in 67 unidentified metabolites, are available in
[Additional data file 1]. The value at each time was divided by
the average level during the whole diurnal cycle; this allowed
a more sensitive visualization of the changes in this data set,
which were small compared to those in other conditions (see
below).
A large proportion of the 137 metabolites exhibit marked
diurnal changes in WT rosettes. The data were evaluated to
identify metabolites that undergo authentic diurnal changes
using an algorithm developed in [4], which generates a
'smoothness value' that has a value of zero if every data point
lies on a smooth curve that moves through one maximum and
one minimum per diurnal cycle, and increases to a maximum
value of one as the data points become increasingly irregular.
Using a cut-off of 0.05 as indicative of a 'good' oscillation [4],
about half the metabolites showed smooth oscillations (Table
1). This includes sucrose, glucose, fructose and more unusual
sugars like raffinose, all of the organic acids, glycerate, all
amino acids except glutamate, which typically shows only
small changes [39], glycerol-3P, many lipids (C16:2, C18:0,
C18:cis[9,12]2, C20:1), many pigments and secondary metab-
olites, including cryptoxanthin, lutein, zeaxanthin and toco-
pherol, some cofactors (coenzymes Q9 and Q10), as well as
many of the unidentified peaks (not shown), some of which
show similar responses to known metabolites. The remaining
metabolites showed more irregular responses or did not show
major diurnal changes.
Figure 3 summarizes the frequency with which metabolites
show a maximum or a minimum at different times during the
diurnal cycle. A similar trend was seen, irrespective of
whether this analysis was carried out with metabolites that
had a smoothness value <0.05 (not shown) or all metabolites
(Figure 3). Relatively few metabolites show a peak or mini-
mum early in the light period (for example, fructose, glucose,
UDP-glucose, cryptoxanthin, pyruvate) or early in the night
(for example, 2,3 dimethyl-5-phytylquinol, succinate, coen-
zyme Q10). This would be the response expected if the metab-
olite level responds directly to the presence or absence of
light. The vast majority peak at the end of the day, and are
lowest at the end of the night (Figure 3). This is consistent
with their level depending on the cumulative activity of a
pathway that is active in the light. This group of metabolites
included sucrose, many organic acids and amino acids, shiki-
mate, fatty acids, glycerol and glycerol-3P.
Particularly large diurnal changes were found for sugars
(sucrose, glucose, fructose), photorespiratory intermediates
(glycine, serine and glycerate) and, to a lesser extent, other
amino acids (Figure 2). Hexoses peaked relatively early in the
photoperiod (2 to 4 h), as has also been seen in other species
[33,34]. UDP-glucose peaked at 6 h and sucrose at the end of
the day. Malate and fumarate rose until the end of the light
period, while succinate decreased during the day and rose
during the first hours of darkness (Figure 2). Accumulation of
malate during the light period has been previously reported in
other species, and may be related to the accumulation of
malate as a counter-anion of nitrate, which decreases during
the light period due to rapid assimilation of nitrate [33].
Among the fatty acids, palmitolenate (C16:2), stearate
(C18:0), linolenate (C18:cis[9,12]2) and palmitate (C16:0)
had a clear diurnal rhythm (Figure 2), with maxima at the end
of the day and minima at the end of the night. The chloroplast
contains up to 85% of the total lipids in Arabidopsis rosettes,
mainly in the thylakoids [40], making it likely that large diur-
nal changes must reflect changes in this compartment. Palmi-
tolenate (C16:2), which exhibits the strongest oscillations, is
exclusively located within the chloroplast. This fatty acid is
mainly present as a constituent of 1-18:2-2-16:2-monogalac-
tosyldiacylglycerol, and is synthesized via the glycosylglycer-
ide desaturation pathway, which takes place in the
chloroplast [40].
Changes in metabolites in a prolonged night and during
diurnal changes in the starchless pgm mutant
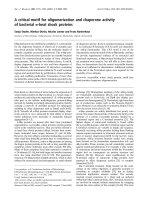
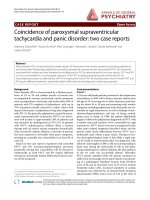
Figure 4 compares the diurnal changes of metabolites in WT
with the changes during the diurnal cycle in pgm (right-hand
column) and during a prolonged night in WT (middle col-
umn). The same normalization procedure was used as for Fig-
ure 1; as a result the scale used for coloring the values in
Figure 4 is different to that in Figure 2. The original data are
given in [Additional file data 1].
During a prolonged night, many metabolites showed gradual
but marked changes. This included a large decrease in the lev-
els of organic acids and shikimate (an intermediate in the aro-
matic amino acid biosynthesis pathway), a marked decrease
in C16:2 and smaller decreases in other fatty acids, including
C18:0. C18:2, C18:3, and C20:1, a decrease in inositol,
Heat map representing the changes in transcript levels and in the corresponding 23 enzyme activities in rosettes of ArabidopsisFigure 1 (see previous page)
Heat map representing the changes in transcript levels and in the corresponding 23 enzyme activities in rosettes of Arabidopsis. Samples were taken from
Col0 WT plants and Col0 pgm growing in a 12 h night and 12 h day cycle, throughout one day and night cycle, and in WT plants transferred to an
extended night (XN). Log
2
ratios were calculated for each value, by dividing it by the average of diurnal WT values and applying the logarithm (base 2). Log
2
ratios give the intensity of the blue or red colors, according to the scale from the legend. Relative proportions among isoforms were calculated using the
entire dataset and give the intensity of the gray color. These data are taken from [4] and [37]. CHO, carbohydrate.
R76.6 Genome Biology 2006, Volume 7, Issue 8, Article R76 Gibon et al. />Genome Biology 2006, 7:R76
Figure 2 (see legend on next page)
0 4 8 12162024
beta-apo-8'-Carotenal
beta-Carotene
Cryptoxanthin
Lutein
Zeaxanthin
Sucrose
Fructose
Glucose
UDP-Glucose
Glycolysis Pyruvate
Succinate
Fumarate
Malate
Ubiquinone 50 (Coenzyme Q10)
Ubiquinone-45 (Coenzyme Q9)
Glycine
Serine
Glycerate
Glutamate
Glutamine
Aspartate
Alanine
Proline
Homoserine
Threonine
Isoleucine
Leucine
Valine
Methionine
Shikimate
Phenylalanine
Tyrosine
Tryptophan
Arginine
Citrulline
GABA
Putrescine
Glycerol (polar fraction)
Glycerol-3-P (polar fraction)
Glycerol (lipid fraction)
Glycerol-3-P (lipid fraction)
Palmitate (C16:0)
2-hydroxy-Palmitate (C16:0)-OH
Palmitolenate (C16:2)
Hexadecatrienoate (C16:3)
Heptadecanoate (C17:0)
Stearate (C18:0)
Linoleate (C18:cis[9,12]2)
Linolenate (C18:cis[9,12,15]3)
Eicosenoate (C20:1)
Lignocerate (C24:0)
Nervonate (C24:1)
Hexacosanoate (C26:0)
Melissate (C30:0)
Raffinose
Inositol
Methylgalactopyranoside
Cell wal l Ribonate
2,3-dimethyl-5-phytyl-Quinol
alpha-Tocopherol
gamma-Tocopherol
beta-Sitosterol
Campesterol
DOPA
Ferulate
Sinapinate
Isopentenyl Pyrophosphate
Mineral Nutrition Phosphate
Anhydroglucose
Gluconate
Log ratio
-2 -1 0 1 2
Minor CHO metabolism
Organic acids
Respiration
Photosynthesis
Major CHO metabolism
Polyamines
Lipids
Photorespiration
Amino acids
Secondary metabolism
Unknown function
Genome Biology 2006, Volume 7, Issue 8, Article R76 Gibon et al. R76.7
comment reviews reports refereed researchdeposited research interactions information
Genome Biology 2006, 7:R76
ribonate, gluconate and isopentenyl pyrophosphate, and a
marked increase in many amino acids due to release during
catabolism of proteins [22].
In pgm, most metabolites showed similar or smaller diurnal
changes than in WT (Figure 4). The left-hand column of Fig-
ure 5 uses a false color scale to highlight for each metabolite
whether the amplitude of the diurnal change is larger (black-
blue) or smaller (red) in pgm than WT. Of 137 metabolites,
only 18 showed larger diurnal amplitudes in pgm. This
included sucrose, glucose and fructose, which accumulate to
high levels in the light and fall to low levels at night as a direct
consequence of the lesion in starch synthesis (see Back-
ground). Seven amino acids showed a completely altered
diurnal response in pgm, with an increase in the night instead
of the day (Figure 4). This is probably due to enhanced prote-
olysis triggered by carbon starvation [22]. Strikingly, 32
metabolites showed smaller diurnal amplitudes in pgm,
including some photorespiratory intermediates glycine (ser-
ine, glycerate) and several fatty acids.
Figure 5 then compares metabolite levels in pgm with the lev-
els in WT in an extended night. The middle column uses a
false color scale to compare the average level across the diur-
nal cycle in pgm with the average level during a diurnal cycle
in WT. Many metabolites show a change in their level in pgm
(see also Figure 4). The right-hand column in Figure 5 dis-
plays the level of each metabolite in WT after 7 days of pro-
longed darkness, compared to the average level during a
diurnal cycle in WT. Comparison of these two columns
reveals that many metabolites show a qualitatively similar
shift in pgm and an extended night. This is explored further
in Figure 6 where, for each metabolite, the change between
pgm and Col0 (x axis) is plotted against the response to an
extended night in WT (y axis). With the exception of sugars,
the majority of the metabolites change in the same direction
in pgm and in an extended night in WT. This is apparent by 4
h for a subset of metabolites that increase in response to star-
vation, including several amino acids (Figure 4). The agree-
ment increases with time, extending to many metabolites
whose level decreases in response to starvation, like inositol,
glycerate, proline, homoserine, shikimate and several fatty
acids.
The pgm mutant is characterized by a daily alternation
between elevated levels of sugars in the light, and low levels of
sugars in the dark. It has already been shown that most of the
genes that undergo larger diurnal changes in pgm are
responding to the low levels of sugars in the night, rather than
the higher levels of sugars in the day [37]. The finding that the
metabolite profile of pgm leaves (with the exception of sugars
and a few other metabolites) resembles that of WT plants
after a prolonged dark treatment reveals that carbon starva-
tion acts via long term mechanisms to regulate the levels of
many metabolites, and generate a low-carbon metabolic phe-
notype. This phenotype will reflect the response of large
numbers of enzymes across several sectors of central metab-
olism. It provides general support for the conclusions drawn
from a subset of 23 enzymes in [4].
Comparison of the amplitudes of the changes in
transcript levels, enzyme activities and metabolites in
diurnal cycles
Comparison of the data sets for transcripts, enzyme activities
and metabolites indicates that transcript levels change mark-
edly and rapidly, whereas enzyme activities and metabolites
typically change less and/or change far more slowly. These
temporal dynamics are investigated more systematically in
Figures 7 and 8.
Figure 7 shows the frequency distribution of the amplitudes
of the diurnal changes of transcript levels for all 2,433 genes
assigned to metabolism by the MapMan ontology [22,32]
(Figure 7a; [Additional data file 2]), the 82 genes that encode
the enzymes treated in this paper (Figure 7b), 23 enzyme
activities (Figure 7c), and 137 metabolites (Figure 7d). The
data for WT and pgm diurnal cycles are shown separately.
The x axis shows the amplitude of the diurnal change
(expressed as (max-min)/max), and the y-axis shows the pro-
portion of genes that show an amplitude in that magnitude.
Although current data processing of Affymetrix arrays may
underestimate the extent of changes in transcript levels by a
factor of two to three [41,42], this should not lead to serious
error when the amplitudes are compared because this
involves comparison of relative changes.
In WT, the peak values were approximately 0.15 for tran-
scripts, and approximately 0.2 for metabolites and enzymes.
The amplitudes of the changes of transcript levels were
slightly larger for the 82 transcripts that encode the enzymes
measured in [4] than for all 2,433 genes assigned to
metabolism. The spread of amplitudes is larger for transcripts
than enzymes. While most metabolites show smaller ampli-
tudes, some show comparable diurnal changes to the most
strongly responding transcripts. The pgm mutant has larger
diurnal changes in transcript levels (approximately 0.28) but
similar diurnal changes in enzyme activities and metabolites
(approximately 0.2) to those in WT. There was a shift to a bi-
modal distribution curve in pgm, with substantial numbers of
transcripts, some enzyme activities and a few metabolites
Heat map representing the changes in metabolite levels in rosettes of ArabidopsisFigure 2 (see previous page)
Heat map representing the changes in metabolite levels in rosettes of Arabidopsis. Metabolites of Col0 WT plants growing in 12 h light and 12 h night
throughout one day and night cycle are shown. Log
2
ratios were calculated for each value by dividing it by the average. Log
2
ratios give the intensity of the
blue or red colors according to the scale bar. CHO, carbohydrate.
R76.8 Genome Biology 2006, Volume 7, Issue 8, Article R76 Gibon et al. />Genome Biology 2006, 7:R76
(mainly sugars) undergoing a diurnal change with larger
amplitude. This analysis illustrates in a condensed form that
large diurnal changes in transcript levels do not lead to a sys-
tematic increase of the amplitudes of the diurnal changes in
enzyme activities or metabolites.
Comparison of the temporal dynamics of the changes
in transcript levels, enzyme activities and metabolites
in a prolonged night
An analogous approach was taken to compare the speed and
extent of the changes in metabolites, transcript levels and
enzyme activities in WT during a prolonged night (Figure 8).
All values were normalized on a reference value at the end of
the normal night. The normalized values are shown as a series
of frequency plots, which compare the amplitudes of the
changes of transcript levels (Figure 8a), enzyme activities
(Figure 8b) and metabolites (Figure 8c) after different times
in an extended dark treatment. Figure 8a shows the changes
for all 2,433 genes assigned to metabolism by the MapMan
ontology. A similar result was obtained with the genes encod-
ing the set of enzymes (not shown). After a 2 h extension of
the night, a small subset of metabolites, including glucose,
fructose, and glycerate, showed a marked change in their
level. By 4 h, changes in transcript levels were becoming
marked and by 8 h these were more widespread than the
changes in metabolites. At this time, there were only minimal
changes in enzyme activities. After 24 and 48 h, the changes
in transcript levels became even larger and changes in
Table 1
Metabolites with smooth diurnal oscillations in Arabidopsis Col0
WT plants growing in 12 h day and 12 h night cycles.
Metabolite Smooth factor
Isoleucine 0.000
Cryptoxanthin 0.000
Citrulline 0.000
Proline 0.000
Shikimate 0.000
Palmitolenate (C16:2) 0.000
Threonine 0.000
Fumarate 0.000
Glycerate 0.000
Malate 0.000
Stearate (C18:0) 0.004
Homoserine 0.004
Pyruvate 0.005
Tyrosine 0.005
Phosphate 0.005
Glycine 0.005
Glucose 0.009
Raffinose 0.009
Lutein 0.010
Methionine 0.011
Serine 0.012
Ubiquinone-50 (Coenzyme Q10) 0.013
Succinate 0.014
Alanine 0.014
Tryptophan 0.014
DOPA 0.015
2,3-dimethyl-5-phytyl-Quinol 0.015
Sucrose 0.018
GABA 0.021
Valine 0.022
Linoleate (C18:cis[9, 12]2) 0.027
Glutamine 0.028
Arginine 0.035
Phenylalanine 0.036
Glycerol-3-P (polar fraction) 0.039
Eicosenoate (C20:1) 0.040
Fructose 0.041
Ferulate 0.043
Inositol 0.045
beta/gamma-Tocopherol 0.047
Leucine 0.047
alpha-Tocopherol 0.049
Zeaxanthin 0.049
Smoothness values were calculated on data previously smoothed using
the moving average method. Only known metabolites with a
smoothness value below 0.05 are listed.
Timing of maxima and minima for metabolites across a 12 h light and 12 h night cycle, in rosettes of Arabidopsis Col0 WT plantsFigure 3
Timing of maxima and minima for metabolites across a 12 h light and 12 h
night cycle, in rosettes of Arabidopsis Col0 WT plants. Data were
smoothed prior to calculations. The shaded region indicates the dark
period.
Time (h)
0 4 8 12 16 20 24
Number of metabolites
0
10
20
30
40
50
Minima
Maxima
Genome Biology 2006, Volume 7, Issue 8, Article R76 Gibon et al. R76.9
comment reviews reports refereed researchdeposited research interactions information
Genome Biology 2006, 7:R76
enzyme activities became apparent, while the changes in
metabolites became only slightly larger. Only data for enzyme
activities and metabolites are available for 72 and 144 h. At
these times, there were large changes in sets of enzyme activ-
ities and metabolites.
Comparison of changes in specific transcripts, enzyme
activities and metabolites
The data set was next inspected to identify examples where
changes of metabolites in pgm or prolonged darkness can be
associated with the induction or repression of specific path-
way genes and/or variations in enzyme activities.
In central carbon metabolism, the accumulation of sugars in
pgm in the light includes an increase of sucrose and a partic-
ularly large increase of glucose and fructose. The pgm mutant
has increased levels of transcripts for most of the gene family
for sucrose-P synthase, a small increase in sucrose-P synthase
activity, a large increase in the levels of transcripts for two and
a small increase in the levels of transcripts for another three
genes encoding acid invertase, and a large increase in acid
invertase activity (Figures 1 and 4). The lower levels of tran-
scripts and activities for enzymes involved in glycolysis and
organic acid synthesis in WT in prolonged darkness and in
pgm is accompanied by lower average levels of pyruvate and,
to a lesser extent, malate and fumarate. It should be noted
that there are also changes in these metabolites within the
diurnal cycles, and that these are not related to momentary
changes in the enzyme activity (as measured in optimized
conditions in vitro). Thus, changes in enzyme levels contrib-
ute to the mid-term shifts of metabolite levels, but are not
responsible for the shorter-term changes within an individual
diurnal cycle. The same holds for many of the other metabo-
lites discussed in this section.
Qualitative agreement was also found between changes in
transcript levels, enzyme activities and mid-term changes in
metabolites in nitrogen metabolism. The levels of glutamine
and glutamate were always lower in pgm than in WT Arabi-
dopsis (Figure 4), as were the activities of nitrate reductase,
glutamine synthetase and ferredoxin-glutamate synthase and
transcript levels for the corresponding genes (Figure 1). It is
known that nitrate reductase expression is regulated by sug-
ars, acting at the level of transcription, translation and pro-
tein stability [43]. The levels of most minor amino acids,
including the aromatic and branched chain amino acids,
increased in a prolonged night and in pgm. This was associ-
ated with increased levels of transcripts for genes assigned to
amino acid degradation, including GDH and several genes
annotated as branched chain amino acid dehydrogenases
[22,37], and increased glutamate dehydrogenase activity
(Figure 4).
Agreement between the three functional levels was also found
for phospholipid biosynthesis. Several genes predicted to be
involved in plastidial phospholipid synthesis [44] showed a
marked diurnal cycle in the pgm mutant ([Additional data file
3]) and for some a strong decrease in transcript levels was
observed in an extended night. For example, transcripts
encoding the enzymes catalyzing the first two steps of the
pathway, plastidial glycerol-3P dehydrogenase and glycerol-
3P acyltransferase, showed a four-fold reduction after 48 h of
prolonged night, and were also found to be lower in pgm.
Glycerol-3P dehydrogenase activity was significantly (with a
p value of 2E-8) decreased by 26% in pgm compared to WT
during the diurnal cycle, and decreased gradually in a pro-
longed night (Figure 9a). Glycerol-3-P levels were lower in
pgm and decreased in a prolonged night. Furthermore, these
alterations were accompanied by a decrease in the levels of
fatty acids in pgm and in WT after an extended night,
especially C16:2, which is essentially contained in plastid
glycerolipids (see above).
In some cases, there is agreement between the changes in the
levels of transcripts and metabolites, but enzyme activities
are not available to establish a clear correlation between all
three levels. For example, the lower levels of inositol found in
pgm and WT plants exposed to several days of darkness were
associated with the strong induction of MIOX2 and MIOX4,
which encode related inositol oxidases [45] (Figure 9b; [Addi-
tional data file 3]). The decreased levels of isopentenyl pyro-
phosphate observed after several days of prolonged darkness
and in the pgm mutant were related to coherent changes in
the levels of transcripts of a large proportion of genes encod-
ing enzymes from the non-mevalonate pathway. Typically,
these transcripts dropped strongly at night in pgm, or in WT
plants transferred to a prolonged night ([Additional data file
3]). In contrast, no consistent changes were found within the
mevalonate pathway. This suggests that at low carbon levels,
the decrease in isopentenyl pyrophosphate synthesis mainly
occurs within the chloroplast, as the non-mevalonate path-
way is located in the plastids and the mevalonate pathway is
in the cytosol [46].
In other cases, there are discrepancies between the functional
levels. Cytosolic fructose-1,6-bisphosphatase and ADP-glu-
cose pyrophosphorylase activity change independently of the
levels of the corresponding transcripts. This discrepancy
indicates that translation or degradation of these enzymes is
regulated. These two enzymes and NADP-glyceraldehyde-3P
dehydrogenase activity also respond differently in pgm and in
a prolonged night, with activity being lower during the diur-
nal cycle in pgm, especially in the light, but unchanged or
even increased in a prolonged night (Figure 1). One possibility
is that the high sugar levels during the light period in pgm
inhibits translation and/or promotes degradation of these
proteins. Another example relates to shikimate
dehydrogenase: lower levels of shikimate in pgm and in a
prolonged dark treatment correlate with decreased activity of
shikimate dehydrogenase, but there are no marked changes
in SDH transcript levels. This indicates that post-transcrip-
R76.10 Genome Biology 2006, Volume 7, Issue 8, Article R76 Gibon et al. />Genome Biology 2006, 7:R76
Figure 4 (see legend on next page)
beta-apo-8'-Carotenal
beta-Carotene
Cryptoxanthin
Lutein
Zeaxanthin
Sucrose
Fructose
Glucose
UDP-Glucose
Glycolysis Pyruvate
Succinate
Fumarate
Malate
Ubiquinone 50 (Coenzyme Q10)
Ubiquinone-45 (Coenzyme Q9)
Glycine
Serine
Glycerate
Glutamate
Glutamine
Aspartate
Alanine
Proline
Homoserine
Threonine
Isoleucine
Leucine
Valine
Methionine
Shikimate
Phenylalanine
Tyrosine
Tryptophan
Arginine
Citrulline
GABA
Putrescine
Glycerol (polar fraction)
Glycerol-3-P (polar fraction)
Glycerol (lipid fraction)
Glycerol-3-P (lipid fraction)
Palmitate (C16:0)
2-hydroxy-Palmitate (C16:0)-OH
Palmitolenate (C16:2)
Hexadecatrienoate (C16:3)
Heptadecanoate (C17:0)
Stearate (C18:0)
Linoleate (C18:cis[9,12]2)
Linolenate (C18:cis[9,12,15]3)
Eicosanoate (C20:1)
Lignocerate (C24:0)
Nervonate (C24:1)
Hexacosanoate (C26:0)
Melissate (C30:0)
Raffinose
Inositol
Methylgalactopyranoside
Cell wall Ribonate
2,3-dimethyl-5-phytyl-Quinol
alpha-Tocopherol
gamma-Tocopherol
beta-Sitosterol
Campesterol
DOPA
Ferulate
Sinapinate
Isopentenyl Pyrophosphate
Mineral Nutrition Phosphate
Anhydroglucose
Gluconate
Log ratio
-6 -4 -2 0 2 4 6
Unknown function
Photosynthesis
WT WT XN
Major CHO metabolism
Minor CHO metabolism
Organic acids
Secondary metabolism
Polyamines
Lipids
Respiration
pgm
Photorespiration
Amino Acids
0
4812 16 20 24 0 4 8 12 16 20 240 2 4 8 48 7224 144
Genome Biology 2006, Volume 7, Issue 8, Article R76 Gibon et al. R76.11
comment reviews reports refereed researchdeposited research interactions information
Genome Biology 2006, 7:R76
tional mechanisms contribute to the regulation of this
enzyme.
There are also cases where discrepancies are already appar-
ent, even though only two of the three functional levels have
been analyzed. The increase in tocopherols in extended
darkness and in pgm could not be related to any clear change
at the level of transcripts for genes involved in tocopherol
synthesis (data not shown). A similar picture emerged for fer-
ulate, which decreased in a prolonged night and was lower in
the pgm mutant. In these examples, measurements of
enzyme activity or protein will be needed to define whether
the changes in metabolites are due to translational or post-
translational regulation.
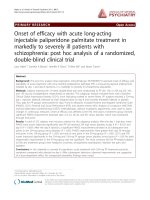
Comparison of the global relationship between
metabolite levels and transcript levels
The data set was also analyzed to detect correlations between
metabolite and transcript levels. The relatively slow response
of enzyme activities and most metabolites to changes in tran-
script levels indicates that most correlations during short
term responses will be due to regulation of gene expression by
metabolites, rather than vice versa.
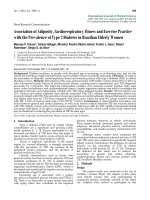
We first compared the changes in levels of metabolites and
transcripts during the diurnal cycle. The first step in the anal-
ysis involved calculation of Pearson's correlation coefficients
between metabolites during diurnal cycles in WT or pgm
(Figure 10). These are visualized as a correlation network.
Several features of the network mirrors known functional
relationships. For example, glucose and fructose were con-
nected, as were a set of intermediates from the photorespira-
tory pathway (glycine, serine, glycerate). The next step was to
search for correlations (Pearson) between metabolites and
the diurnal changes in transcript levels for all the genes on the
ATH1 array. The number of genes that correlated with a
metabolite (p < 0.01) is represented by the size of the green
circle (see figure legend for scale). The number of transcripts
that were correlated to sugars increased dramatically in pgm
(Figure 10).
While the analysis in Figure 10 documents a qualitative dif-
ference between WT and pgm, these separate data sets con-
tain too few data points to provide highly significant p values
for individual genes. The data sets for diurnal cycles in WT
and pgm and for WT transferred to an extended night were,
therefore, combined and re-analyzed to determine if there
was a relationship between the p values of the correlation
coefficients and selected metabolites (Figure 11a). This was
done using values for sucrose, fructose and glucose that had
been obtained by reanalysis using enzyme-based assays. The
results obtained with fructose are not shown, as glucose and
fructose were highly correlated, and, therefore, both sugars
have similar correlations with transcripts. In addition, we
measured glucose-6-P, an intermediate in sugar metabolism.
The transcript and metabolite levels were expressed on a log-
arithmic scale before analyzing the correlation coefficients. A
large number of genes showed a high positive or negative cor-
relation with sucrose or glucose-6-P. Relatively few genes
showed a positive, and even less a good negative, correlation
with glucose. A similar trend but with slightly fewer correla-
tions was obtained when log values of transcript levels were
compared with untransformed metabolite levels. Correla-
tions calculated between untransformed transcript values
and logarithmic metabolite values gave the lowest enrich-
ments (data not shown).
To provide independent evidence that expression of these
genes may be regulated by sugars or closely related metabo-
lites, several transcript profiling data sets from published
experiments in which sugar levels were changed by several
different methods were inspected to complete a list of 1,312
'sugar responsive' genes. The criteria were that the genes
show: a >2-fold change after addition of 15 mM glucose or 15
mM sucrose to Arabidopsis seedlings that had been carbon-
starved for two days; and a >2-fold change between Arabi-
dopsis rosettes that had been illuminated for 4 h in the
presence of ambient [CO
2
] or low [CO
2
] to prevent photo-
synthesis [37]. The procedure is described in [37], where it is
additionally shown that about 70% of these sugar-regulated
genes show diurnal changes in WT, and even more in pgm. A
list of these genes is provided in [Additional data file 4]. Fig-
ure 11a shows, for the genes whose transcript levels correlate
positively or negatively with glucose, sucrose or glucose-6-P
in the combined data set, what proportion is found in this list
of 1,312 'sugar-responsive' genes. There was an increasingly
large overlap as the p value was increased (Figure 11b). At p
values <0.001, the highest overlap was found for the genes
that correlated with glucose-6-P and sucrose (847 genes, that
is to say >60% of sugar responsive genes).
In a reverse comparison, we asked what proportion of the
1,312 sugar-responsive genes shows highly significant p val-
ues (<10
-3
) with sucrose, glucose-6-phoshopate or glucose in
the combined data set. To do this, the genes showing a corre-
lation with glucose, sucrose or glucose-6-P with a p value <10
-
3
(Figure 11a) were filtered, by requiring that they should be in
the list of 1,312 'sugar-responsive' genes. This operation can
Heat map representing the changes in metabolites throughout one day and night cycle in rosettes of Arabidopsis Col0 WT plants, in Col0 pgm growing in a 12 h night and day cycle, and in WT plants transferred to an extended night (XN)Figure 4 (see previous page)
Heat map representing the changes in metabolites throughout one day and night cycle in rosettes of Arabidopsis Col0 WT plants, in Col0 pgm growing in a
12 h night and day cycle, and in WT plants transferred to an extended night (XN). Log
2
ratios were calculated for each value by dividing it by the average
of diurnal WT values and applying the logarithm (base 2). Log
2
ratios give the intensity of the blue or red colors, according to the scale bar. CHO,
carbohydrate.
R76.12 Genome Biology 2006, Volume 7, Issue 8, Article R76 Gibon et al. />Genome Biology 2006, 7:R76
Figure 5 (see legend on next page)
beta-apo-8'-Carotenal
beta-Carotene
Cryptoxanthin
Lutein
Zeaxanthin
Sucrose
Fructose
Glucose
UDP-Glucose
Glycolysis Pyruvate
Succinate
Fumarate
Malate
Ubiquinone 50 (Coenzyme Q10)
Ubiquinone-45 (Coenzyme Q9)
Glycine
Serine
Glycerate
Glutamate
Glutamine
Aspartate
Alanine
Proline
Homoserine
Threonine
Isoleucine
Leucine
Valine
Methionine
Shikimate
Phenylalanine
Tyrosine
Tryptophan
Arginine
Citrulline
GABA
Putrescine
Glycerol (polar fraction)
Glycerol-3-P (polar fraction)
Glycerol (lipid fraction)
Glycerol-3-P (lipid fraction)
Palmitate (C16:0)
2-hydroxy-Palmitate (C16:0)-OH
Palmitolenate (C16:2)
Hexadecatrienoate (C16:3)
Heptadecanoate (C17:0)
Stearate (C18:0)
Linoleate (C18:cis[9,12]2)
Linolenate (C18:cis[9,12,15]3)
Eicosenoate (C20:1)
Lignocerate (C24:0)
Nervonate (C24:1)
Hexacosanoate (C26:0)
Melissate (C30:0)
Raffinose
Inositol
Methylgalactopyranoside
Cell wall Ribonate
2,3-dimethyl-5-phytyl-Quinol
alpha-Tocopherol
gamma-Tocopherol
beta-Sitosterol
Campesterol
DOPA
Ferulate
Sinapinate
Isopentenyl Pyrophosphate
Mineral Nutrition Phosphate
Anhydroglucose
Gluconate
Δ Amplitude (%)
0
WT/pgm (Log ratio)
2
-2 0 2
XN/WT (Log ratio)
2
-4 0 4
Photosynthesis
Major carbohydrates
minor CHO metabolism
Polyamines
Lipids
Amino Acids
Organic acids
Respiration
Photorespiration
Secondary metabolism
Unknown function
ΔAmplitudes
pgm /WT XN/WT
-60 60
Genome Biology 2006, Volume 7, Issue 8, Article R76 Gibon et al. R76.13
comment reviews reports refereed researchdeposited research interactions information
Genome Biology 2006, 7:R76
be performed in a spreadsheet provided in [Additional data
file 4]. Of the 1,312 genes in the 'sugar-responsive' set, 426
showed positive and 125 negative correlations with glucose,
626 positive and 408 negative correlations with sucrose, and
579 positive and 371 negative correlations with glucose-6-
phosphate in the combined data set. More genes correlate
with changes of sucrose or glucose-6-P than with glucose.
Further, sucrose and glucose-6-P induce and repress similar
proportions of genes during diurnal cycles, whereas glucose
acts mainly to induce gene expression (Figure 11a). In total,
this analysis identified a robust core of 1,141 genes whose
transcripts correlate with endogenous changes in sugars, and
also changes in response to addition of sugars and to a treat-
ment that alters the endogenous sugar level.
Hexoses are sensed via at least three pathways, including one
that does not require phosphorylation, one that requires
hexokinase as a sensor, and one that requires phosphoryla-
tion of glucose [47], whereas there may be separate sucrose-
specific sensing and signaling pathways [48]. The sensing
mechanisms for sucrose are largely unknown. There is con-
siderable overlap between genes that correlate with sucrose
or glucose-6-phosphate, but little overlap between these and
the genes that correlate with glucose (Figure 11b). It is tempt-
ing to speculate that glucose and sucrose act via different
pathways. To further test this hypothesis, we inspected the
responses of a set of 363 genes that respond >2-fold 30 min-
utes after adding sucrose to carbon-starved seedlings (Osuna
D, Usadel B, Morcuende R, Gibon Y, Bläsing OE, Höhne M,
Günter M, Kamlage B, Trethewey R, Scheible WR, and Stitt
M, unpublished). Of these 363 genes, 194 and 188 were corre-
lated at a p value of <0.001 to sucrose or glucose-6-P,
respectively. Only 68 genes were found to be correlated to
glucose at this p value.
Blaesing et al. [37] used a set of filters to identify genes whose
expression might be subject to sugar-regulation during the
diurnal cycle. The correlative approach in the present paper
provides a refined list of candidate genes that may be regu-
lated by a particular sugar or their derivatives ([Additional
data file 4]). To assign genes to a given sugar, we performed a
ranking based on the p values ([Additional file 4]). With strin-
gent p values below 10
-6
, 8 genes were assigned to glucose,
493 to sucrose, and 211 to glucose-6-P. Strikingly, all six
sugar-regulated genes encoding trehalose phosphate syn-
thases or phosphatases were highly correlated to sucrose
and/or to glucose-6P, namely At4g17770 (TPS5), At1g70290
(TPS8), At1g23870 (TPS9), At1g60140 (TPS10) and
At2g18700 (TPS11) and At2g22190 (TPP H). An over-repre-
sentation analysis using Fisher exact tests as in [49] was per-
formed using MapMan [22,32] BINs as categories to identify
functional groups of genes that may respond to a given sugar.
This approach was carried out with genes that were positively
correlated to the various sugars at different p value
thresholds. Genes involved in protein biosynthesis were over-
represented among genes for which transcript levels are pos-
itively correlated to sugars (see [Additional data file 4] for
accession codes) and genes involved in protein degradation
were over-represented among the negatively correlated genes
(Fisher exact test; see [Additional data file 4] for accession
codes). This suggests the occurrence of tight links between
sugar sensing and protein turnover. Previous studies have
shown that a number of genes involved in protein synthesis
are repressed and genes involved in protein degradation are
induced in carbon starved Arabidopsis [22,50].
About 5,500 genes correlate (p <10
-3
) with sucrose, glucose or
glucose-6-P in diurnal changes and extended night treat-
ments (Figure 10a,b), but are absent from the list of 1,312
'sugar-responsive' genes. These correlations may be due to
secondary effects, or the genes might have been excluded
from the list of 'sugar responsive' genes because they do not
respond in one of the treatments used as filters in compiling
this list. Similarly, genes that are regulated by a sugar-related
input will not be necessarily correlated to endogenous sugar
levels in a given set of treatments. For some genes, sugar
repression only takes places below a given threshold, which is
not passed in a diurnal cycle in WT plants. For example, the
transcripts encoding inositol oxidases, MIOX2 and MIOX4,
show little or no diurnal variations in WT (Figure 8b), but
respond strongly to carbon starvation in both WT in a pro-
longed night and pgm at night.
Further experiments are needed to validate these correla-
tions, and establish whether they reflect a causal relationship
in which metabolites directly or indirectly regulate gene
expression. Use of a wider range of conditions might exclude
some false positives. However, stringent validation will
require additional strategies, for example, the use of reverse
genetics to generate small changes in the levels of specific
metabolites. A two- to three-fold decrease in protein level and
enzyme activity typically has little or no impact on the path-
way flux, but often leads to small shifts in the levels of the sub-
strates, products and other ligands of the enzyme, and other
closely linked metabolites [51,52]. A partial inhibition of gene
expression can be obtained using techniques like antisense
RNA or interference RNA. The availability of large collections
of knock-out mutants may allow a general strategy to be used,
in which heterozygotes are used to partially inhibit enzyme
activity. For many enzymes, activity is halved in a heterozy-
Comparative analysis of metabolite profiles obtained from Arabidopsis Col0 pgm and WT plants transferred to an extended night (XN)Figure 5 (see previous page)
Comparative analysis of metabolite profiles obtained from Arabidopsis Col0 pgm and WT plants transferred to an extended night (XN). Heat map
representing the differences in amplitudes of diurnal changes in individual metabolites calculated as maximum value - minimum value from smoothed data
in WT and pgm (left); Log
2
values of average (pgm) to average (WT) levels (middle), and Log
2
values of average(WT) to 144 h XN (right). Scales are given
in the legend.
R76.14 Genome Biology 2006, Volume 7, Issue 8, Article R76 Gibon et al. />Genome Biology 2006, 7:R76
Correlation plots comparing changes in 137 metabolites in pgm to changes due to the extension of the night in WTFigure 6
Correlation plots comparing changes in 137 metabolites in pgm to changes due to the extension of the night in WT. Colored plots correspond to the
metabolites listed in the legend.
Log
2
(pgm /control)
Log
2
(XN/control)
-4
-2
0
2
4
-4
-2
0
2
4
-4
-2
0
2
4
-2 0 2
-4
-2
0
2
4
-2 0 2
Proline
Inositol
Fatty acids
Branched and aromatic amino acids
Glycerate
Shikimate
Time of treatment(o hours)
(144 h)
(72 h)
(48 h)
(24 h)
(8 h)
(4 h)
(2 h)
Genome Biology 2006, Volume 7, Issue 8, Article R76 Gibon et al. R76.15
comment reviews reports refereed researchdeposited research interactions information
Genome Biology 2006, 7:R76
gote between the WT and a null mutant [52]. A further possi-
bility is the use of inducible gene expression to generate small
and reversible changes in the levels of specific metabolites.
A particular problem in multicellular eukaryotes is that cellu-
lar or subcellular compartmentation can mask correlations
between a specific pool of a metabolite and the transcript
level. For example, whereas sucrose is distributed between
the cytoplasm and vacuole in leaves, the vast majority of the
glucose is located in the vacuole [53]. The poor correlation
between transcript levels and glucose noted above shows that
vacuolar glucose is not a major signal, but it remains possible
that other smaller pools of glucose in other compartments, or
fluxes of glucose between compartments, act as signals. In
principle, techniques are available to allow comprehensive
measurements of subcellular metabolite levels [53]. How-
ever, such measurements would be very time consuming, and
would not provide reliable information about minor pools
due to errors in correcting for cross-contamination. Powerful
technologies are emerging that use imaging techniques to
measure the local concentrations of specific metabolites
[54,55]. A complementary strategy would be to use reverse
genetics to generate targeted changes in metabolites in spe-
cific compartments. For example, overexpression of invertase
in the vacuole, the cytosol and the cell wall space can be used
as a strategy to alter the sucrose/reducing sugar ratio in these
different metabolic compartments [51]. Notwithstanding cur-
rent limitations, the occurrence of highly significant correla-
tions in light/dark cycles and their independent validation in
independent experiments in which sugars are added or
endogenous pools are manipulated by changing [CO
2
] pro-
vides an initial step in dissecting these interactions.
Conclusion
It is not yet possible to systematically establish a comprehen-
sive gene-protein-metabolite network in plants, due to theo-
retical limitations in current gene annotations and technical
limitations that prevent the measurement of all enzymes and
metabolites (see Background). However, analysis of the
dynamics of enzymes and metabolites that are technically
accessible does allow a general comparison of responses and
dynamics at these different levels of metabolic function,
provided enough parameters are analyzed to obtain a repre-
sentative picture of the response at each functional level. In
the experimental systems studied in this article, levels of tran-
scripts and some metabolic intermediates in central metabo-
Figure 7
(a)
(b)
(c)
(d)
0
1
2
3
4
5
WT
pgm
Probability density
0
1
2
3
4
WT
pgm
0
1
2
3
4
WT
pgm
Amplitude
0.0 0.2 0.4 0.6 0.8 1.0
0
1
2
3
4
WT
pgm
Metabolites
Enzyme
activities
2433
transcripts
82
transcripts
Distribution of amplitudes of diurnal changes in transcripts, metabolites and enzyme activitiesFigure 7
Distribution of amplitudes of diurnal changes in transcripts, metabolites
and enzyme activities. Distribution of amplitudes of diurnal changes in (a)
2,433 transcripts assigned to metabolism, (b) the subset of 82 transcripts
encoding the enzymes measured, (c) 23 enzyme activities, and (d) 137
metabolites. Distributions are expressed as probability densities and were
calculated with R using the function 'density', which computes kernel
density estimations. The same bandwidth of 0.06 was used for all datasets.
R76.16 Genome Biology 2006, Volume 7, Issue 8, Article R76 Gibon et al. />Genome Biology 2006, 7:R76
lism show rapid changes, but the majority of the 137
metabolites investigated show slow changes, which reflect the
dynamics with which changes in transcript levels lead to
changes in 23 enzyme activities. These results have two
important implications. First, the enzyme activity profile and
the metabolite profile represent an integration, over time, of
faster but more transient changes in transcript levels. This
may reflect the fact that plants are subject to recurrent diur-
nal changes and many other irregular fluctuations with a time
frame of hours, days or weeks. The temporal dynamics of
enzyme turnover may be hardwired to allow the metabolic
phenotype to adjust to changes when they are maintained for
several days, while being largely independent of short term
fluctuations or recurring diurnal changes. Second, the slow
response of enzyme activities, and the resulting time delay
between changes in transcript levels and changes in metabo-
lite levels, implies that correlations between transcripts and
metabolites are likely to reflect a regulatory impact of
metabolites on gene expression, rather than the impact of
changes of gene expression on metabolism.
Even though a comprehensive analysis is not yet possible,
analysis of the responses of individual parameters at all three
levels already provides some functional information. Analysis
of the responses of transcript and metabolite levels identified
over 1,141 transcripts, whose levels are strongly correlated
with endogenous changes of sugars, and half of which could
be cross-validated by analyzing how they respond to changes
in levels of sugars in other experimental systems. Further
experiments will be required, for example using genotypes
Distribution of global changes in transcript and metabolite levels and enzyme activities during the diurnal cycle and an extended night (XN)Figure 8
Distribution of global changes in transcript and metabolite levels and enzyme activities during the diurnal cycle and an extended night (XN). Distribution of
changes in (a) 2,433 transcripts assigned to metabolism, (b) 23 enzyme activities and (c) 140 metabolites after 2, 4, 8, 24, 48, 72 and 144 h of extension of
the night. Transcript levels were not determined at 72 and 144 h. Distributions are expressed as probability densities and were calculated with R using the
function 'density', which computes kernel density estimations. The same bandwidth of 0.2 was used for all datasets.
Amplitude as Log
2
(XN/Control)
-2 -1 0 1 2
Probability density
0.0
0.4
0.8
1.2
-2 -1 0 1 2 -2 -1 0 1 2
2h
4h
8h
24h
48h
72h
144h
Transcripts Enzymes Metabolites
(a)
(b)
(c)
Genome Biology 2006, Volume 7, Issue 8, Article R76 Gibon et al. R76.17
comment reviews reports refereed researchdeposited research interactions information
Genome Biology 2006, 7:R76
Details of specific changes in transcript levels, metabolites and enzyme activities during the diurnal cycle and an extended nightFigure 9
Details of specific changes in transcript levels, metabolites and enzyme activities during the diurnal cycle and an extended night. Changes in specific
transcripts, enzyme activities and metabolites in rosettes of Arabidopsis Col0 WT plants (WT diurnal) and pgm (pgm diurnal) throughout a day and night
cycle, and in WT transferred to an extended night. (a) Glycerolipid metabolism: levels of transcripts encoding glycerol-3P dehydrogenase (At5g40610) and
fatty acid desaturase 6 (At4g30950), activity of glycerol-3P dehydrogenase, and levels of glycerol-3P and palmitolenate. (b) Inositol metabolism: levels of
transcripts encoding inositol oxidase (At5g56640, At4g26260 and At2g19800), and inositol levels. FW, fresh weight.
(b)
Transcript level
Time (h)
0 4 8 12 16 20 24
Metabolite level
(normalised)
0
500
1000
1500
2000
2500
3000
0
0.2
0.4
0.6
0.8
1.0
1.2
1.4
0 4 8 12162024
At5g56640 (Miox5)
At4g26260 (Miox4)
At2g19800 (Miox2)
72 96 120 144
0 8 16 24 32 40 48
Inositol
Transcript level
(At5g40610)
Metabolite level
(normalised)
Activit
y
(nmol/g FW/min)
0
100
200
300
400
500
0
0.5
1.0
1.5
2.0
2.5
3.0
0
5
10
15
20
25
Tr
anscript level
(At4g30950)
0 4 8 12162024
(a)
2000
4000
6000
Time (h)
0 4 8 12162024 72 96 120 1440 8 16 24 32 40 48
Glycerol-3P
C16:2
G3PDH activity
At5g40610
At4g30950
0
WT diurnal Extended night pgm diurnal
R76.18 Genome Biology 2006, Volume 7, Issue 8, Article R76 Gibon et al. />Genome Biology 2006, 7:R76
Figure 10 (see legend on next page)
2_3 Dimethyl-5-phytylquinol
2-Hydroxy-Palmitic acid
Ala
alpha-Tocopherol
Anhydroglucose
Arginine
Asp
Beta-apo-8_carotenal
Beta-Carotene
b-Tocopherol
beta-Sitosterol
C16:0
C17:0
C18:0
C18:cis[9_12]2
C18:cis[9_12_15]3
C20:1
C24:0
C26:0
C30:0Campesterol
Citrulline
Coenzyme Q10
Cryptoxanthin
DOPA
Ferulic acid
Fructose
Fumarate
GABA
Glucose
Glutamic acid
Glutamine
Gly
Glyceric acid
Glycerol (lipid fraction)
Glycerol (polar fraction)
Glycerol-3-phosphate (polar fraction)
Glycerophosphat (lipid fraction)
Hexadecadienoic Acid (C16:2)
Hexadecatrienoic Acid (C16:3)
Homoser
Ile
Isopentenyl Pyrophosphate
Leu
Lutein
Malate
Methionine
Methylgalactopyranosid
Myo-Inositol
Nervonic Acid (C24:1)
Phe
Phosphate
Proline
Putrescin
Pyruvate
Raffinose
Ser
Shikimic Acid
Sinapic Acid
Succinate
Sucrose
Thr
Tryptophan
Tyrosine
Ubichinone-45 (Coenzyme Q9)
UDPGlucose
Val
Zeaxanthin
2_3 Dimethyl-5-phytylquinol
2-Hydroxy-Palmitic acid
Ala
alpha-Tocopherol
Anhydroglucose
Arginine
Asp
Beta-apo-8_carotenal
Beta-Carotene
b-Tocopherol
beta-Sitosterol
C16:0
C17:0
C18:0
C18:cis[9_12]2
C18:cis[9_12_15]3
C20:1
C24:0
C26:0
C30:0
Campesterol
Citrulline
Coenzyme Q10
Cryptoxanthin
DOPA
Ferulic acid
Fructose
Fumarate
GABA
Glucose
Glutamic acid
Glutamine
Gly
Glyceric acid
Glycerol (lipid fraction)
Glycerol (polar fraction)
Glycerol-3-phosphate (polar fraction)
Glycerophosphat (lipid fraction)
Hexadecadienoic Acid (C16:2)
Hexadecatrienoic Acid (C16:3)
Homoser
Ile
Isopentenyl Pyrophosphate
Leu
Lutein
Malate
Methionine
Methylgalactopyranosid
Myo-Inositol
Nervonic Acid (C24:1)
Phe
Phosphate
Proline
Putrescin
Pyruvate
Raffinose
Ser
Shikimic Acid
Sinapic Acid
Succinate
Sucrose
Thr
Tryptophan
Tyrosine
Ubichinone-45 (Coenzyme Q9)
UDPGlucose
Val
Zeaxanthin
1,8002,4003,0003,600
WT
pgm
Genome Biology 2006, Volume 7, Issue 8, Article R76 Gibon et al. R76.19
comment reviews reports refereed researchdeposited research interactions information
Genome Biology 2006, 7:R76
with altered levels of specific enzymes or transporters, to
generate more specific changes in the levels of individual
metabolites and their subcellular pools and identify the
underlying metabolic signals more precisely. Analyses of the
combined changes in transcript levels, enzyme activities and
metabolites also identified cases where changes in expression
could contribute to the changes in metabolism, and other
cases where additional regulation at the level of protein syn-
thesis or degradation is probably required.
More generally, our results show that comprehensive infor-
mation about protein levels is required to dissect the causal
relationship between transcription and cellular responses.
The present analysis used robotized enzyme assays as a proxy
for protein levels. Enzyme activity measurements are precise,
have a relatively high throughput, do not require expensive or
complex infrastructure and can be used in species where com-
prehensive genome sequence data are not available. How-
ever, it is sometimes not possible to unambiguously link the
measured enzyme activity to a single gene, and this approach
is only applicable to a small sector of the genome, that is,
genes that encode enzymes whose activities can be easily
measured. Advances in hardware and data evaluation
software are currently allowing advances in quantitative pro-
teomics [3,12]. This will ultimately allow comprehensive
analysis of the dynamics of all types of proteins, including
those involved in signaling and cellular structure.
Materials and methods
Plant growth
Arabidopsis thaliana var Col0, WT, and a plastidic pgm [38]
were grown in an 8 h day growth chamber. At least 3 weeks
before their use, the plants were transferred into a small
growth cabinet with a 12 h day of 160 μE and 20°C throughout
the day/night cycle. Harvests of 15 plant rosettes at a time
point were carried out sequentially every 2 or 4 h within a
day/night cycle, or after 0, 2, 4, 8, 24, 48, 72 and 144 h in total
darkness. Each sample typically contained 3 rosettes, equiva-
lent to approximately 500 mg fresh weight. The entire sample
was powdered under liquid nitrogen and stored at -80°C until
its use. Each experiment was repeated two times.
RNA isolation and expression analysis with 22K
Affymetrix arrays
Isolation of total RNA, cDNA synthesis, cRNA labeling and
the hybridization on the GeneChip Arabidopsis ATH1
genome array was done as described in [22] and recom-
mended by the manufacturer (part no. 900385, Affymetrix
UK Ltd., High Wycombe, UK). The microarray suite software
package (MAS 5.0, Affymetrix) was used to evaluate probe set
signals of the array. The generated data files (.cel) were the
input for the software package RMAExpress, which was used
to normalize and estimate raw signal intensities [56]. Nor-
malization was performed on the entire set of transcript pro-
files used in the present study, that is, WT and pgm diurnal
cycles [37], and WT transferred to 0, 2, 4, 8, 24 and 48 h of
extension of the night ([Additional data file 2]).
Extraction and assay of metabolites
Batches of 15 samples, and 5 control samples obtained from
200 Col0 rosettes grown in the greenhouse, pooled and
homogenized, were used. The analysis of metabolites by GC-
MS was performed as described in [17]. The LC-MS [57], anal-
yses were performed using an Agilent 1100 capillary LC sys-
tem (Agilent, Technologies, Waldbronn, Germany) coupled
with an Applied Biosystems/MDS SCIEX API 4000 triple
quadrupole mass spectrometer (Applied Biosystems, Darm-
stadt, Germany). After reversed phase HPLC separation,
detection and quantification was performed in the multiple
reaction monitoring (MRM) mode [58]. Results are
expressed as ratios between samples and the median calcu-
lated for control samples. Sucrose, glucose, fructose and glu-
cose-6P were extracted and measured as in [36].
Extraction and assay of glycerol-3P dehydrogenase
Aliquots of 20 mg fresh weight were extracted by vigorous
mixing with 1 ml extraction buffer. The composition of the
extraction buffer was 20% (v/v) glycerol, 0.25% (w/v) bovine
serum albumin, 1% (v/v) Triton-X100, 50 mM Hepes/KOH
pH 7.5, 10 mM MgCl
2
, 1 mM EDTA, 1 mM EGTA, 1 mM ben-
zamidine, 1 mM aminocapronic acid, 10 μM leupeptin and 1
mM DTT.
Glycerol-3P dehydrogenase activity was determined in micro-
plates using a stopped assay, in which 2 μl extract as well as
glycerol-3P standards prepared in the extraction buffer and
ranging from 0 to 100 μM were incubated for 30 minutes in
20 μl medium containing 50 mM Hepes/KOH pH 7.5, 10 mM
MgCl
2
, 0.5 mM NADH, and 0 or 1 mM dihydroxyacetone-P.
The reaction was stopped with 20 μl of 0.5 M NaOH. After
heating for 10 minutes at 95°C to destroy dihydroxyacetone-
P [59], the wells were neutralized with 20 μl of 0.5 M HCl.
Glycerol-3P was then determined as in [4].
Statistics
Standard procedures were carried out using functions of the
Microsoft Excel program. Heat maps were generated in Excel
using a macro. Smoothness was calculated as described in [4].
Density plots were calculated in R [60] using the 'density plot'
Metabolite correlation networks resulting from diurnal changesFigure 10 (see previous page)
Metabolite correlation networks resulting from diurnal changes. Correlation networks of 137 metabolites determined across a day and night cycle in
Arabidopsis Col0 WT plants and pgm growing in 12 h day/12 h night cycles. Metabolites with significant correlations are linked together; green discs
represent the number of transcripts correlated to a given metabolite. Solid lines indicate positive correlations, dotted lines indicate negative correlations.
R76.20 Genome Biology 2006, Volume 7, Issue 8, Article R76 Gibon et al. />Genome Biology 2006, 7:R76
Figure 11 (see legend on next page)
Number of genes
10
100
1000
10000
1e-61e-51e-41e-31e-21e-11e-61e-51e-41e-31e-21e-1
p value
1e-61e-51e-41e-31e-21e-1
Fraction of
sugar-responsive genes
0.0
0.2
0.4
0.6
0.8
(a)
Glucose Sucrose Glucose-6-P
Sucrose correlated
Glucose correlated
G6P correlated
p value <0.001
(b)
positively correlated
negatively correlated
sugar-responsive genes
genes responding after 30 min re-addition of sucrose
25
4
162
493
29354
74
Genome Biology 2006, Volume 7, Issue 8, Article R76 Gibon et al. R76.21
comment reviews reports refereed researchdeposited research interactions information
Genome Biology 2006, 7:R76
function. Smoothing was achieved by calculating means for
two consecutive points.
Correlation networks were generated by calculating all pair-
wise correlations in R and considering all pair-wise correla-
tions with a significant p value (0.05) calculated as described
earlier [61] as connected. The resulting network was then dis-
played using Pajek [62] using the Kamada layout process
option. When displaying correlations of transcripts and
metabolites, the number of transcripts correlated with a
metabolite was indicated by the size of the metabolite token.
Genes showing a significant and strong correlation to glucose,
fructose and sucrose were extracted from the list of sugar reg-
ulated genes generated by [37] using an R script. These were
then tested for a deviation of biological processes defined by
MapMan BINS from all approximately 1,312 sugar regulated
genes using Fisher's exact test.
All scripts and macros are available upon request.
Additional data files
The following additional data are available with the online
version of this paper. Additional data file 1 lists metabolite
levels in WT and pgm throughout a 12 h day/12 h night cycle,
and in WT plants transferred to an extended night for 2, 4, 8,
24, 48, 72 and 148 h. Data are expressed as means and stand-
ard deviation (n = 5) of ratios to the median calculated for a
set of 5 control samples. Additional data file 2 lists Affymetrix
array data for the conditions described. Data are given as
means of RMA-normalized data, and numbers of replicates
are indicated. Additional data file 3 lists levels of transcripts
encoding enzymes involved in the glycerolipid and inositol
metabolism, and the mevalonate and non-mevalonate
pathways. Transcript levels were determined using the
Affymetrix ATH1 array.Additional data file 4 lists correlation
coefficients (Pearson) calculated between sugar responsive
genes and sucrose, glucose or fructose. Sugar responsive
genes were retrieved from [37]. Significant correlation coeffi-
cients are indicated in bold.
Additional data file 1Metabolite levels in WT and pgm throughout a 12 h day/12 h night cycle, and in WT plants transferred to an extended night for 2, 4, 8, 24, 48, 72 and 148 hData are expressed as means and standard deviation (n = 5) of ratios to the median calculated for a set of 5 control samplesClick here for fileAdditional data file 2Affymetrix array data for the conditions describedData are given as means of RMA-normalized data, and numbers of replicates are indicatedClick here for fileAdditional data file 3Levels of transcripts encoding enzymes involved in the glycerolipid and inositol metabolism, and the mevalonate and non-mevalonate pathwaysTranscript levels were determined using the Affymetrix ATH1 arrayClick here for fileAdditional data file 4Correlation coefficients (Pearson) calculated between sugar responsive genes and sucrose, glucose or fructoseSugar responsive genes were retrieved from [37]. Significant corre-lation coefficients are indicated in boldClick here for file
Acknowledgements
This research was supported by the Max Planck Society and by the German
Ministry for Research and technology, in the framework of the German
plant genomics program GABI (0312277A, 0313110). The support of Ralf
Looser and the Bioanalytics Technical Center at metanomics in performing
the metabolic analyses is gratefully acknowledged. Thanks are due to Linda
Bartezko and Manuela Guenther for technical assistance.
References
1. Willmitzer L: The use of transgenic plants to study plant gene-
expression. Trends Genet 1988, 4:13-18.
2. Stitt M, Sonnewald U: Regulation of metabolism in transgenic
plants. Annu Rev Plant Biol 1995, 46:341-361.
3. Greenbaum D, Colangelo C, Williams K, Gerstein M: Comparing
protein abundance and mRNA expression levels on a
genomic scale. Genome Biol 2003, 4:117.
4. Gibon Y, Blaesing OE, Hannemann J, Carillo P, Hoehne M, Hendriks
JHM, Palacios N, Cross J, Selbig J, Stitt M: A Robot-based platform
to measure multiple enzyme activities in Arabidopsis using a
set of cycling assays: comparison of changes of enzyme activ-
ities and transcript levels during diurnal cycles and in pro-
longed darkness. Plant Cell 2004, 16:3304-3325.
5. Hirai MY, Yano M, Goodenowe DB, Kanaya S, Kimura T, Awazuhara
M, Arita M, Fujiwara T, Saito K: Integration of transcriptomics
and metabolomics for understanding of global responses to
nutritional stresses in Arabidopsis thaliana. Proc Natl Acad Sci
USA 2004, 101:10205-10210.
6. Hirai MY, Klein M, Fujikawa Y, Yano M, Goodenowe DB, Yamazaki Y,
Kanaya S, Nakamura Y, Kitayama M, Suzuki H, et al.: Elucidation of
gene-to-gene and metabolite-to-gene networks in arabidop-
sis by integration of metabolomics and transcriptomics. J Biol
Chem 2005, 280:25590-25595.
7. Oresic M, Clish CB, Davidov EJ, Verheij E, Vogels J, Havekes LM, Neu-
mann E, Adourian A, Naylor S, van der Greef J, Plasterer T: Pheno-
type characterisation using integrated gene transcript,
protein and metabolite profiling. Appl Bioinformatics 2004,
3:205-217.
8. DeRisi JL, Iyer VR, Brown PO: Exploring the metabolic and
genetic control of gene expression on a genomic scale. Sci-
ence 1997, 278:680-686.
9. Redman JC, Haas BJ, Tanimoto G, Town CD: Development and
evaluation of an Arabidopsis whole genome Affymetrix
probe array. Plant J
2004, 38:545-561.
10. The Arabidopsis Functional Genomics Network [http://
web.uni-frankfurt.de/fb15/botanik/mcb/AFGN/atgenex.htm]
11. Peck SC: Update on proteomics in Arabidopsis. Where do we
go from here? Plant Physiol 2005, 138:591-599.
12. Horak CE, Snyder M: Global analysis of gene expression in
yeast. Funct Integr Genomics 2002, 2:171-180.
13. Fiehn O, Kopka J, Dormann P, Altmann T, Trethewey RN, Willmitzer
L: Metabolite profiling for plant functional genomics. Nat
Biotechnol 2000, 18:1157-1161.
14. Sumner LW, Mendes P, Dixon RA: Plant metabolomics: large-
scale phytochemistry in the functional genomics era. Phyto-
chemistry 2003, 62:817-836.
15. Stitt M, Fernie AR: From measurements of metabolites to
metabolomics: an 'on the fly' perspective illustrated by
recent studies of carbon-nitrogen interactions. Curr Opin
Identification of robust sugar-responsive genes whose transcripts correlate with changes in glucose, sucrose or glucose-6-phosphate during diurnal cycles in WT plants and pgm, and in an extended night treatmentFigure 11 (see previous page)
Identification of robust sugar-responsive genes whose transcripts correlate with changes in glucose, sucrose or glucose-6-phosphate during diurnal cycles
in WT plants and pgm, and in an extended night treatment. (a) Correlation coefficients and corresponding p values (x axis, logarithmic scale) were
calculated between the transcript levels for each of these genes and the levels of glucose, sucrose, or glucose-6P using a combined dataset, including data
obtained from WT and pgm across a night and day cycle, and WT plants transferred to an extended night. The top graphs show the number of genes
whose transcripts correlate with glucose (left hand), sucrose (middle) or glucose-6P (right hand) at a significance level. The bottom graphs show the
proportion of the genes that correlate with a given metabolite, which are found in a set of 'sugar-responsive' genes (thick line). A set of 1,312 'sugar-
responsive' genes was defined by inspection of public domain data for experiments in which sugars were added to carbon-starved seedlings for 3 h, or
leaves were illuminated for 4 h in the presence and absence of CO
2
(see main text for details). The plot also shows a similar comparison against a set of
genes that are induced or repressed within 30 minutes by addition of sucrose to starved seedlings (dotted line). Blue lines correspond to positive
correlations, red lines to negative correlations. (b) Venn Diagram of sugar-regulated genes correlated to sucrose, glucose and glucose-6-phosphate with a
significance level of 0.001 or better. In total, 1,141 of the 1,312 genes correlated with at least one metabolite with a p value < 10
-3
.
R76.22 Genome Biology 2006, Volume 7, Issue 8, Article R76 Gibon et al. />Genome Biology 2006, 7:R76
Biotechnol 2003, 14:136-144.
16. Kopka J, Fernie A, Weckwerth W, Gibon Y, Stitt M: Metabolite
profiling in plant biology: platforms and destinations. Genome
Biol 2004, 5:109.
17. Roessner U, Wagner C, Kopka J, Trethewey RN, Willmitzer L: Tech-
nical advance: simultaneous analysis of metabolites in potato
tuber by gas chromatography-mass spectrometry. Plant J
2000, 23:131-142.
18. Roessner U, Luedemann A, Brust D, Fiehn O, Linke T, Willmitzer L,
Fernie A: Metabolic profiling allows comprehensive phenotyp-
ing of genetically or environmentally modified plant systems.
Plant Cell 2001, 13:11-29.
19. von Roepenack-Lahaye E, Degenkolb T, Zerjeski M, Franz M, Roth U,
Wessjohann L, Schmidt J, Scheel D, Clemens S: Profiling of Arabi-
dopsis secondary metabolites by capillary liquid chromatog-
raphy coupled to electrospray ionization quadrupole time-
of-flight mass spectrometry. Plant Physiol 2004, 134:548-559.
20. Ratcliffe RG, Shachar-Hill Y: Probing plant metabolism with
NMR. Annu Rev Plant Physiol Plant Mol Biol 2001, 52:499-526.
21. Krishnan P, Kruger NJ, Ratcliffe RG: Metabolite fingerprinting
and profiling in plants using NMR. J Exp Bot 2005, 56:255-265.
22. Thimm O, Blaesing O, Gibon Y, Nagel A, Meyer S, Kruger P, Selbig J,
Muller LA, Rhee SY, Stitt M: MAPMAN: a user-driven tool to dis-
play genomics data sets onto diagrams of metabolic path-
ways and other biological processes. Plant J 2004, 37:914-939.
23. Urbanczyk-Wochniak E, Baxter C, Kolbe A, Kopka J, Sweetlove LJ,
Fernie AR: Profiling of diurnal patterns of metabolite and
transcript abundance in potato (Solanum tuberosum)
leaves. Planta 2005, 221:891-903.
24. Lafaye A, Junot C, Pereira Y, Lagniel G, Tabet JC, Ezan E, Labarre J:
Combined proteome and metabolite-profiling analyses
reveal surprising insights into yeast sulfur metabolism. J Biol
Chem 2005, 280:24723-24730.
25. Mijalski T, Harder A, Halder T, Kersten M, Horsch M, Strom TM,
Liebscher HV, Lottspeich F, de Angelis MH, Beckers J: Identification
of coexpressed gene clusters in a comparative analysis of
transcriptome and proteome in mouse tissues. Proc Natl Acad
Sci USA 2005, 102:8621-8626.
26. Irizarry RA, Bolstad BM, Collin F, Cope LM, Hobbs B, Speed TP:
Summaries of Affymetrix GeneChip probe level data. Nucleic
Acids Res 2003, 31:e15.
27. Li C, Hung Wong W: Model-based analysis of oligonucleotide
arrays: model validation, design issues and standard error
application. Genome Biol 2001, 2:research0032.1-0032.11.
28. Thimm O, Blaesing O, Usadel B, Gibon Y: Evaluation of the tran-
scriptome and genome to inform the study of metabolic con-
trol. In Control of Primary Metabolism in Plants Volume 22. Edited by:
Plaxton B, McManus M. Oxford (UK): Blackwell Publishing; 2006:1-23.
Robert J (series editor): Annual Plant Reviews.
29. Nikiforova VJ, Daub CO, Hesse H, Willmitzer L, Hoefgen R: Integra-
tive gene-metabolite network with implemented causality
deciphers informational fluxes of sulphur stress response. J
Exp Bot 2005, 56:1887-1896.
30. Morgenthal K, Wienkoop S, Scholz N, Weckwerth W: Correlative
GC-TOF-MS-based metabolite profiling and LC-MS-based
protein profiling reveal time-related systemic regulation of
metabolite-protein networks and improve pattern recogni-
tion for multiple biomarker selection. Metabolomics 2005,
1:109-121.
31. Mueller LA, Zhang P, Rhee SY: AraCyc: a biochemical pathway
database for Arabidopsis. Plant Physiol 2003, 132:453-460.
32. Usadel B, Nagel A, Thimm O, Redestig H, Blaesing OE, Palacios-Rojas
N, Selbig J, Hannemann J, Piques MC, Steinhauser D, et al.: Extension
of the visualization tool MapMan to allow statistical analysis
of arrays, display of corresponding genes, and comparison
with known responses.
Plant Physiol 2005, 138:1195-1204.
33. Matt P, Geiger M, Walch-Liu P, Engels C, Krapp A, Stitt M: The
immediate cause of the diurnal changes of nitrogen metabo-
lism in leaves of nitrate-replete tobacco: a major imbalance
between the rate of nitrate reduction and the rates of nitrate
uptake and ammonium metabolism during the first part of
the light period. Plant Cell Environ 2001, 24:177-190.
34. Matt P, Geiger M, Walch-Liu P, Engels C, Krapp A, Stitt M: Elevated
carbon dioxide increases nitrate uptake and nitrate reduct-
ase activity when tobacco is growing on nitrate, but
increases ammonium uptake and inhibits nitrate reductase
activity when tobacco is growing on ammonium nitrate.
Plant Cell Environ 2001, 24:1119-1137.
35. Smith SM, Fulton DC, Chia T, Thorneycroft D, Chapple A, Dunstan
H, Hylton C, Zeeman SC, Smith AM: Diurnal changes in the tran-
scriptome encoding enzymes of starch metabolism provide
evidence for both transcriptional and posttranscriptional
regulation of starch metabolism in Arabidopsis leaves. Plant
Physiol 2004, 136:2687-2699.
36. Gibon Y, Blaesing OE, Palacios N, Pankovic D, Hendriks JHM, Fisahn
J, Hoehne M, Günter M, Stitt M: Adjustment of diurnal starch
turnover to short days: Depletion of sugar during the night
leads to a temporary inhibition of carbohydrate utilisation,
accumulation of sugars and post-translational activation of
ADPglucose pyrophosphorylase in the following light period.
Plant J 2004, 39:847-862.
37. Blaesing OE, Gibon Y, Guenther M, Hoehne M, Morcuende R, Osuna
D, Thimm O, Usadel B, Scheible WR, Stitt M: Sugars and circadian
regulation make major contributions to the global regula-
tion of diurnal gene expression in Arabidopsis. Plant Cell 2005,
17:3257-3281.
38. Caspar T, Huber SC, Somerville C: Alterations in growth, photo-
synthesis, and respiration in a starchless mutant of Arabi-
dopsis-thaliana (L) deficient in chloroplast
phosphoglucomutase activity. Plant Physiol 1985, 79:11-17.
39. Stitt M, Mueller C, Matt P, Gibon Y, Carillo P, Morcuende R, Scheible
WR, Krapp A: Steps towards an integrated view of nitrogen
metabolism. J Exp Bot 2002, 53:959-970.
40. Somerville C, Browse J: Dissecting desaturation: plants prove
advantageous. Trends Cell Biol 1996, 6:148-153.
41. Czechowski T, Bari RP, Stitt M, Scheible WR, Udvardi MK: Real-
time RT-PCR profiling of over 1400 Arabidopsis transcrip-
tion factors: unprecedented sensitivity reveals novel root-
and shoot-specific genes. Plant J 2004, 38:366-379.
42. Scheible WR, Morcuende R, Czechowski T, Fritz C, Osuna D, Pala-
cios-Rojas N, Schindelasch D, Thimm O, Udvardi MK, Stitt M:
Genome-wide reprogramming of primary and secondary
metabolism, protein synthesis, cellular growth processes,
and the regulatory infrastructure of Arabidopsis in response
to nitrogen. Plant Physiol 2004, 136:2483-2499.
43. Meyer C, Stitt M: Nitrate reduction and signalling. In Plant Nitro-
gen Edited by: Morot-Gaudry JF, Lea PJ. INRA (France): Springer-Ver-
lag; 2001:37-59.
44. The Arabidopsis Lipid Gene Database [ntbiol
ogy.msu.edu/lipids/genesurvey/Presentation_database.htm]
45. Kanter U, Usadel B, Guerineau F, Li Y, Pauly M, Tenhaken R: The
inositol oxygenase gene family of Arabidopsis is involved in
the biosynthesis of nucleotide sugar precursors for cell-wall
matrix polysaccharides. Planta 2005, 221:243-254.
46. Hsieh M-H, Goodman HM: The Arabidopsis IspH homolog is
involved in the plastid nonmevalonate pathway of isoprenoid
biosynthesis. Plant Physiol 2005, 138:641-653.
47. Moore B, Zhou L, Rolland F, Hall Q, Cheng WH, Liu YX, Hwang I,
Jones T, Sheen J: Role of the Arabidopsis glucose sensor HXK1
in nutrient, light, and hormonal signalling. Science 2003,
300:332-336.
48. Smeekens S: Sugar-induced signal transduction in plants. Annu
Rev Plant Physiol Plant Mol Biol 2000, 51:49-81.
49. Hannah MA, Heyer AG, Hincha DK: A global survey of gene reg-
ulation during cold acclimation in Arabidopsis thaliana. PLoS
Genetics 2005, 1:e26.
50. Contento AL, Kim SJ, Bassham DC: Transcriptome profiling of
the response of Arabidopsis suspension culture cells to Suc
starvation. Plant Physiol 2004, 135:2330-2347.
51. Sonnewald U, Brauer M, von Schaewen A, Stitt M, Willmitzer L:
Transgenic tobacco plants expressing yeast-derived inver-
tase in either the cytosol, the vacuole or the apoplast; a pow-
erful tool to study sucrose metabolism and sink-source
interactions. Plant J 1991, 1:95-106.
52. Neuhaus HE, Kruckeberg AL, Feil R, Gottlieb L, Stitt M: Dosage
mutants of phosphoglucose isomerase in the cytosol and
chloroplasts of Clarkia xantiana
. II. Study of the mechanisms
which regulate photosynthate partitioning. Planta 1989,
178:110-122.
53. Stitt M, Lilley RMC, Gerhardt R, Heldt HW: Determination of
metabolite levels in specific cells and subcellular compart-
ments of plant leaves. Methods Enzymol 1989, 174:518-552.
54. Fehr M, Frommer WB, Lalonde S: Visualization of maltose
uptake in living yeast cells by fluorescent nanosensors. Proc
Natl Acad Sci USA 2002, 99:9846-9851.
55. Frehr M, Okumoto S, Deuschle K, Lager I, Looger LL, Person J,
Genome Biology 2006, Volume 7, Issue 8, Article R76 Gibon et al. R76.23
comment reviews reports refereed researchdeposited research interactions information
Genome Biology 2006, 7:R76
Kozhukh L, Lalonde S, Frommer WB: Development and use of
fluorescent nanosensors for metabolite imaging in living
cells. Biochem Soc Trans 2005, 33:287-290.
56. Bolstad BM, Irizarry RA, Astrand M, Speed TP: A comparison of
normalization methods for high density oligonucleotide
array data based on bias and variance. Bioinformatics 2003,
19:185-193.
57. Niessen WM: Progress in liquid chromatography-mass spec-
trometry instrumentation and its impact on high-through-
put screening. J Chromatogr A 2003, 1000:413-436.
58. Gergov M, Ojanperä I, Vuori E: Simultaneous screening for 238
drugs in blood by liquid chromatography-ionspray tandem
mass spectrometry with multiple-reaction monitoring. J
Chromatogr B 2003, 795:41-53.
59. Gibon Y, Vigeolas H, Tiessen A, Geigenberger P, Stitt M: Sensitive
and high throughput metabolite assays for inorganic pyro-
phosphate, ADPGlc, nucleotide phosphates, and glycolytic
intermediates based on a novel enzymic cycling system. Plant
J 2002, 30:221-235.
60. The R Project for Statistical Computing [http://www.R-
project.org]
61. Steinhauser D, Usadel B, Luedemann A, Thimm O, Kopka J:
CSB.DB: a comprehensive systems-biology database. Bioin-
formatics 2004, 20:3647-3651.
62. Batagelj V, Mrvar A: Pajek - Program for Large Network
Analysis. Connections 1998, 2:47-57.