Báo cáo y học: "Transcriptional and structural impact of TATA-initiation site spacing in mammalian core promoters" potx
Bạn đang xem bản rút gọn của tài liệu. Xem và tải ngay bản đầy đủ của tài liệu tại đây (1.01 MB, 18 trang )
Genome Biology 2006, 7:R78
comment reviews reports deposited research refereed research interactions information
Open Access
2006Ponjavicet al.Volume 7, Issue 8, Article R78
Research
Transcriptional and structural impact of TATA-initiation site
spacing in mammalian core promoters
Jasmina Ponjavic
*†
, Boris Lenhard
*‡
, Chikatoshi Kai
*
, Jun Kawai
*§
,
Piero Carninci
§
, Yoshihide Hayashizaki
*§
and Albin Sandelin
*
Addresses:
*
Genome Exploration Research Group (Genome Network Project Core Group), RIKEN Genomic Sciences Center (GSC), RIKEN
Yokohama Institute, Yokohama, Kanagawa, 230-0045, Japan.
†
MRC Functional Genetics Unit, Department of Physiology, Anatomy and
Genetics, University of Oxford, Oxford OX1 3QX, UK.
‡
Computational Biology Unit, Bergen Center for Computational Science, University of
Bergen, HIB, Thormøhlensgate 55, N-5008 Bergen, Norway.
§
Genome Science Laboratory, Discovery and Research Institute, RIKEN Wako
Institute, Wako, Saitama, 351-0198, Japan.
Correspondence: Albin Sandelin. Email:
© 2006 Ponjavic et al.; licensee BioMed Central Ltd.
This is an open access article distributed under the terms of the Creative Commons Attribution License ( which
permits unrestricted use, distribution, and reproduction in any medium, provided the original work is properly cited.
Impact of TATA-initiation site spacing<p>Investigations of the spacing between TATA box and transcription start site in mouse core promoters reveals a coupling of spacing to tissue specificity.</p>
Abstract
Background: The TATA box, one of the most well studied core promoter elements, is associated
with induced, context-specific expression. The lack of precise transcription start site (TSS)
locations linked with expression information has impeded genome-wide characterization of the
interaction between TATA and the pre-initiation complex.
Results: Using a comprehensive set of 5.66 × 10
6
sequenced 5' cDNA ends from diverse tissues
mapped to the mouse genome, we found that the TATA-TSS distance is correlated with the tissue
specificity of the downstream transcript. To achieve tissue-specific regulation, the TATA box
position relative to the TSS is constrained to a narrow window (-32 to -29), where positions -31
and -30 are the optimal positions for achieving high tissue specificity. Slightly larger spacings can be
accommodated only when there is no optimally spaced initiation signal; in contrast, the TATA box
like motifs found downstream of position -28 are generally nonfunctional. The strength of the
TATA binding protein-DNA interaction plays a subordinate role to spacing in terms of tissue
specificity. Furthermore, promoters with different TATA-TSS spacings have distinct features in
terms of consensus sequence around the initiation site and distribution of alternative TSSs.
Unexpectedly, promoters that have two dominant, consecutive TSSs are TATA depleted and have
a novel GGG initiation site consensus.
Conclusion: In this report we present the most comprehensive characterization of TATA-TSS
spacing and functionality to date. The coupling of spacing to tissue specificity at the transcriptome
level provides important clues as to the function of core promoters and the choice of TSS by the
pre-initiation complex.
Published: 17 August 2006
Genome Biology 2006, 7:R78 (doi:10.1186/gb-2006-7-8-r78)
Received: 3 May 2006
Revised: 19 June 2006
Accepted: 17 August 2006
The electronic version of this article is the complete one and can be
found online at />R78.2 Genome Biology 2006, Volume 7, Issue 8, Article R78 Ponjavic et al. />Genome Biology 2006, 7:R78
Background
Elucidation of the mechanisms that govern the regulation of
genes at the transcriptional level remains one of the most
important challenges in biology. Transcriptional regulation is
achieved by a combination of cellular events, including bind-
ing of cis-regulatory elements to transcription factor binding
sites (TFBSs), chromatin structure modification, and the
assembly of the pre-initiation complex (PIC) at transcription
start sites (TSSs) [1].
Presently, we have a reasonable understanding of compo-
nents used in the transcription initiation process but only
limited insight into the mechanisms of the cognate elements
[2-6]. The generally accepted model for transcriptional initi-
ation by core promoter elements is centered on the complexes
formed by TATA box binding protein (TBP) with RNA
polymerases and associated factors [1]. It is a common text-
book-inflicted misconception that 'typical' RNA polymerase
II eukaryotic core promoters have a TATA box guiding the
PIC. Recent evidence [7,8] provided genome-wide confirma-
tion of the existence of at least two distinct modes of tran-
scription initiation: CpG-island based, TATA independent
initiation with multiple TSSs; and TATA dependent initia-
tion, in which TSSs are concentrated on one or few consecu-
tive genome positions (called single peak [SP] promoters). SP
promoters and, by association, TATA-driven promoters are
strongly associated with genes with tissue-specific and/or
context-specific expression [8]. This is in agreement with
recent large-scale statistical studies that confirmed the previ-
ously anecdotal correlation between CpG island promoters
and housekeeping genes on one hand, and TATA box pro-
moter and tissue-specific genes on the other [9]. The fact that
TATA box promoters evolve more slowly than other types of
promoters [10] implies that changes in such promoters are
less tolerated and that this type of mechanism is more ancient
than the more plastic promoters with many TSSs [8], in which
evolutionary events can include evolutionary turnover [11].
In TATA driven promoters, the primary role of the TATA box
is to anchor the PIC. In higher eukaryotes, this process steri-
cally constrains the selection of transcription initiation sites,
but TATA-TSS distance can vary slightly. The exact mecha-
nism of start site selection, and therefore the TATA-TSS dis-
tance, remains unknown [3,12].
Because TATA boxes are highly overrepresented in promoters
where the TSSs are concentrated in one or few consecutive
genome positions, the TATA box location relative to the TSS
is likely to have an impact on the efficiency of inducible
expression. The unavailability of precise TSS locations has
limited the study of the TATA-TSS spacing to a handful of
promoters [13-18]. These studies indicated that the TATA box
is functionally linked to the determination of the initiation
site, and that TATA-TSS spacing affects the efficiency of tran-
scriptional initiation.
It is evident that inducible expression is not solely orches-
trated by events at the core promoter, but is also subject to
long-range cis-regulatory element interactions [1] as well as
cellular events on a larger scale, including epigenetic control
of chromatin superstructure [19]. Nonetheless, core pro-
moter elements have been confirmed as important determi-
nants for transcriptional specificity [3], and our goal in this
work is to determine the constraints imposed on such
determinants.
We recently showed that the FANTOM cap analysis of gene
expression (CAGE) data allow us, for the first time, to analyze
simultaneously the precise locations of TSSs and the spatio-
temporal expression patterns of the corresponding tran-
scripts [8]. This permits detailed analysis of constraints
imposed on TATA driven promoters for regulating inducible
expression. Here, we show that, in TATA-driven promoters,
the TATA-TSS spacing affects the transcriptional specificity
of the downstream transcript. We then proceed to show that
different TATA-TSS spacings affect a number of core pro-
moter features, including the consensus sequence of the -3 to
+1 region and the distribution of alternative TSS. Finally, we
show that the overall TSS distribution within SP class pro-
moters is indicative of tissue specificity as well as TATA box
and initiation site properties.
Results
CAGE data and promoter classifications
CAGE [20,21] enables genome-wide localization of TSSs by
rapid large-scale sequencing of 5' ends of mRNAs. The data
structure and content of the CAGE data repository were
described by Carninci and coworkers [8]. CAGE tags consist
of sequenced 20-21 base pair (bp) long, 5' ends of full-length
cDNAs that have been mapped to the corresponding (mouse
or human) genome. Protocols for CAGE were described by
Kodzius and colleagues [21]. Overlapping tags on the same
strand form a tag cluster (TC) [8]. A TC and its surrounding
genomic sequence can be considered a core promoter and is
the basic unit used in this work.
A wide variety of RNA libraries (209) and tissues (23) was
used for CAGE sequencing in mouse. Because all CAGE tags
originate from defined RNA libraries isolated from specific
tissues, for each TSS detected by CAGE the distribution of
source libraries and tissues is also available. There are multi-
ple lines of evidence for the high reliability and nucleotide-
level resolution of CAGE tags, as discussed in detail in the
supplementary material presented by Carninci and cowork-
ers [8].
As discussed above, we previously discovered that promoters
where the vast majority of TSSs are constrained to one to four
consecutive nucleotides are enriched for TATA boxes and are
associated with tissue-specific expression [8]. In the present
study, in order to avoid ambiguous estimation of TATA-TSS
Genome Biology 2006, Volume 7, Issue 8, Article R78 Ponjavic et al. R78.3
comment reviews reports refereed researchdeposited research interactions information
Genome Biology 2006, 7:R78
distances, we analyzed promoters that have a single dominant
peak located at a single nucleotide position (see Materials and
methods, below). We shall refer to this type of promoters as
'single-TSS' promoters. For clarity, they are a subset of the SP
promoter class, as defined by Carninci and coworkers [8].
In the final part of the Results section, below, we also ana-
lyzed the properties of two related promoter classes: the sub-
set of the single-TSS promoters that have a dominant single
peak in combination with a uniform distribution of CAGE
tags stretching over 50 bp; and the distinct set of promoters
having two closely located dominant peaks (see Materials and
methods, below, for exact definitions and Figure 1 for repre-
sentative examples).
Measuring tissue specificity using CAGE expression
data
To assess the specificity of the expression of the downstream
gene, we compared the tissue distribution of the CAGE tags
within the TC with the tissue distribution of all CAGE tags, by
computing the relative entropy (the Kullback-Leibler dis-
tance) [22,23] between the two distributions (see Materials
and methods, below).
The concept of relative entropy has been applied to diverse
computational biology problems, including sequence conser-
vation [24], single nucleotide polymorphism selection [25],
binding site predictions [26], and gene expression analysis
[9,23,27-31]. Yan and coworkers [31] recently showed that
relative entropy can distinguish differentially expressed
genes better than other popular methods, such as t-tests,
whereas Kasturi and coworkers [28] showed that clustering of
gene expression using relative entropy was superior to Pear-
son correlation. In particular, Shannon entropy has been
used in a number of studies to analyze transcriptional specif-
icity based on cDNA and expressed sequence tag (EST) librar-
ies [9,30]. Stekel and coworkers [30] presented a detailed
study of statistical properties of related metrics in this con-
text, whereas Schug and colleagues [9] showed that entropy-
based metrics are useful for classifying expression profiles in
GNF Gene Expression Atlas [32] and EST libraries as source
datasets.
To demonstrate that relative entropy in combination with the
CAGE data correlates with tissue-specific expression, we col-
lected three sets of genes expected to be ubiquitously
expressed: a set of 263 housekeeping genes from the
HuGEIndex database (identified from microarray experi-
ments) [33]; 14 genes of the citric acid cycle; and 23 genes of
the ubiquitin-mediated proteolysis pathway, as annotated in
the KEGG database [34]. We then collected six gene sets iden-
tified as tissue-specific using diverse approaches: 17 whole-
brain specific genes (based on microarray expression pro-
files) [35,36]; 10 heart-specific genes (based on statistical
over-representation in EST libraries) [37]; nine testis-specific
genes (based on microarray expression profiles) [35,38]; 66
liver-specific genes; 12 lung-specific genes; and 20 cerebel-
lum-specific genes, all from the GNF Gene Expression Atlas
[32]. We then calculated the tissue specificity for each gene in
the sets using relative entropy based on CAGE tags as well as
on an independent dataset of EST cluster expression profiles
within UniGene [39] (see Materials and methods, below).
The estimates of tissue specificity by CAGE and ESTs in
almost all cases are significantly correlated when assessing
single genes (Table 1 and Figure 2b). Because CAGE and ESTs
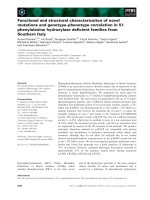
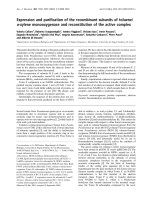
Representative examples of subclasses of SP promotersFigure 1
Representative examples of subclasses of SP promoters. Histograms show
the fraction of tags that map into the 120 bp region centered on the TC.
TC identifiers are shown above each histogram. Three subclasses of the SP
TCs defined by Carninci and coworkers [8] were analyzed: (a) single-TSS
promoters having a single well defined TSS; (b) shallow-TSS promoters,
which is the subset of single TSS promoters that have one sharp peak
surrounded by multiple weakly defined TSSs; and (c) twin-TSS classed
promoters, which are characterized by two closely located, well defined
TSSs, and in turn can be classified by the number of base pairs in between
them (0-3 bp spacing). bp, base pair; SP, single peak; TC, tag cluster; TSS,
transcription start site.
Fraction of tag counts
in tag cluster
Fraction of tag counts
in tag cluster
20 40 60 80 100
Shallow-TSS classSingle-TSS class
T19F012F4266
80%
60%
40%
20%
T0XR04C97323
20 40 60 80 100
Nucleotide position
(a) (b)
20 40 60 80 100
80%
60%
40%
20%
20 40 60 80 100
T02F09CA5850
T03F07C8EBD0
Nucleotide position
(c)
Twin-TSS class
0 bp spacing
Twin-TSS class
3 bp spacing
Twin-TSS class
1 bp spacing
Fraction of tag counts
in tag cluster
80 100
20 40 6020 40 60 80 100
2 bp spacing
3 bp spacing
T04F08B20DDD
T04F03AD37D1
80%
60%
40%
20%
Nucleotide position
Twin-TSS class
2 bp spacing
R78.4 Genome Biology 2006, Volume 7, Issue 8, Article R78 Ponjavic et al. />Genome Biology 2006, 7:R78
are different and independent data sources, this is an
additional piece of evidence that supports the validity and
resolution of CAGE data, and supports relative entropy as a
measure of tissue specificity. It is also immediately obvious
that relative entropy separates the ubiquitous genes from tis-
sue-specific genes when assessing the mean tissue specificity
for each gene set (Figure 2a).
High relative entropy signifies great discrepancy between the
TC tissue distribution and the background tissue distribution,
and therefore temporally or spatially constrained expression
of the corresponding gene, whereas two identical distribu-
tions will have a relative entropy value of zero. In this report
we refer to the relative entropy measurement between the
sample and expected distribution as the 'tissue specificity' or
'transcriptional specificity'.
TATA-TSS spacing is associated with transcriptional
specificity in vertebrates
A previous, basic descriptive analysis of the distribution of
TATA-TSS spacing established that the most common spac-
ings are 30 and 31 bp and that the great majority of TATA-
driven promoters have a distance of 27-34 bp between TATA
and the TSS [8] in mouse. Because our goal in this work was
to elucidate whether there is a link between transcriptional
specificity and TATA-TSS spacing, we sought both to increase
the number of promoters analyzed and to focus on cases in
which the TATA-TSS distance is unambiguous. Therefore, we
applied a more conservative detection procedure to a larger
amount of core promoters where the absolute majority of
TSSs were concentrated on a single nucleotide position (the
single-TSS class of TCs [see Materials and methods, below]).
Only promoters with at least one predicted TATA box with a
score greater than 75% within the -40 to -19 bp region relative
to the dominant start site were used for subsequent analyses.
This resulted in 784 single-TSS promoters used for the subse-
quent analysis.
Initially, we focused on the most prominent TATA box found
in each single-TSS promoter (the highest scoring predicted)
[6,40] TATA box location. We then measured the spacing
between the first T in the TATA box (as defined by Bucher
[41]) and the highest CAGE tag peak found in the TC (for sim-
plicity, we refer to this position as 'TSS'). The findings we
present below are not dependent on these specific cutoffs;
changes in score cutoff and/or application of cross-species fil-
tering of the promoter sets give similar results (data not
shown).
We assessed the impact of TATA-TSS spacing on overall tis-
sue specificity by measuring the relative expression entropy
of the TCs grouped by TATA-TSS distance, as described in
Materials and methods (below). When discussing positions
within the promoter, we use the word 'upstream' to mean in
the 5' direction of a given location in the promoter, with
respect to the strand of the produced transcript (in all rele-
vant figures, this is equivalent to the left-hand side). Simi-
larly, we use the word 'downstream' for locations 3' of a given
position (right-hand side in figures).
When evaluating the results, it is important to consider both
the median relative entropy (Figure 3a) and the count of pro-
moters in each group (Figure 3b). A high promoter count in a
given position implies a preferred TATA box usage of the
position. Positions supported by 20 promoters or more have
a distinct relative entropy distribution that reflects the corre-
sponding site count distribution. Within this group, positions
-31 and -30 have the greatest median tissue specificity, which
is significantly higher than the preceding and following
positions (-29 and -32: P = 4.3 × 10
-2
and P = 2.9 × 10
-2
,
respectively; one-sided Wilcoxon test). They are also sup-
ported by the highest number of TATA boxes (Figure 3a,b).
This implies that these two positions are the optimal TATA-
TSS spacings for achieving high transcriptional specificity.
TATA boxes downstream of -29 have lower specificity and
radically lower counts; they are virtually never used in
Table 1
Correlation of tissue specificities measured by relative entropy in CAGE and UniGene EST clusters
Gene set EST versus CAGE: Spearman rank correlation coefficient Spearman rank correlation P value Number of genes
Whole brain specific 216 1.10 × 10
-3
17
Testis specific 48 9.68 × 10
-2
9
Heart specific 40 1.48 × 10
-2
10
Liver specific 20,898 1.32 × 10
-6
66
Lung specific 92 1.81 × 10
-2
12
Cerebellum specific 186 <2.20 × 10
-16
20
Citric acid cycle 318 2.90 × 10
-1
14
Ubiquitin-mediated proteolysis pathway 886 5.94 × 10
-3
23
Housekeeping genes 2,208,352 8.54 × 10
-6
263
All sets combined 5,269,164 <2.20 × 10
-16
434
Pair-wise correlations between tissue specificity values using CAGE and EST clusters was calculated as in the cor.test method in the R language [62],
using Spearman correlation (two-sided test). CAGE, cap analysis of gene expression; EST, expressed sequence tag.
Genome Biology 2006, Volume 7, Issue 8, Article R78 Ponjavic et al. R78.5
comment reviews reports refereed researchdeposited research interactions information
Genome Biology 2006, 7:R78
transcripts with high transcriptional specificity. It is therefore
likely that 29 bp is the minimal spacing between TATA and
TSS for effective transcription driven by the TATA box in a
conventional manner (Figure 3a; see below for an analysis of
atypical promoters with the TATA box located at -28).
Upstream of -31, the three consecutive positions are viable as
TATA box locations but are used less often; the tissue specifi-
city and site counts diminish when moving from position -36
to -32. In large part, the varying median entropy values from
positions -39 to -33 are due to low site counts in combination
with a few extreme relative entropy values. This phenomenon
might also be due to parallel usage of two TATA boxes, as dis-
cussed below.
As previously shown, the preferred consensus for the initia-
tion site is a pyrimidine-purine (PyPu) dinucleotide situated
at position [-1, +1] relative to the TSS [8], corresponding to a
weaker version of the previously defined Inr element [42].
Analysis of the preferred usage of initiation sites for different
spacing classes provides additional insight (Figure 4). Pro-
moters where the TATA box is located at -28 have a signifi-
cantly different initiation site dinucleotide consensus
compared with promoters that have other TATA box start
locations (P = 3.1 × 10
-5
; χ
2
-test [see Materials and methods,
below]). The initiation site dinucleotide distribution in pro-
moters where the TATA box is located at -28 is also signifi-
cantly different in pair-wise comparison versus positions -29
(P = 1.8 × 10
-2
), -30 (P = 1.6 × 10
-6
), -31 (P = 7.4 × 10
-4
), -32
(P = 1.6 × 10
-2
), and -33 (P = 1.5 × 10
-2
). In particular, the
usage of the preferred PyPu dinucleotide is lower at position
-28. This suggests that a different mechanism might govern
this type of TATA-initiation site interaction. By comparing
the use of PyPu dinucleotides in the region around the domi-
nant TSS, we found that positions -34 to -32 are depleted of
PyPu dinucleotides immediately upstream of the dominant
TSS (Figure 5, grey bars), as compared with more favorable
spacings. This is a strong indicator that introduction of PyPu
sites in the depleted region would result in new TSSs with
more favorable spacings. We show below that these atypical
spacings are reflected in the overall promoter structure, both
in terms of initiation site consensus and CAGE tag
distribution.
Correlation between TATA location and initiation
signal
Because the different TATA-TSS spacings have different
properties both in terms of tissue specificity and initiation
signal, we investigated the core promoter regions (the -40 to
+25 region relative to the dominant start site, defined as +1)
of each subset using small sample corrected sequence logos
[43,44] and normalized CAGE tag distributions (see Materi-
als and methods, below; Figure 6).
Although small differences in TATA box consensus exist
between spacing classes, the most important difference is in
the properties of the sequence motif near the TSS; the initia-
tion site consensus as well as the distribution of alternative
TSSs are dependent on TATA-TSS spacing.
For the four most favored spacings (TATA located at -29, -30,
-31, or -32), the initiation site [-1, +1] is composed of a PyPu
dinucleotide, which is consistent with work reported by Carn-
inci and coworkers [8] and other studies [42]. The signal
strength of the initiation signal (measured by information
content [45,46] of the aligned region around the TSS [-5 to
+5]) is slightly higher when the TATA box is located at posi-
tion -32 compared with promoters with TATA boxes at the
previous two positions (positions -30 and -31), and increases
when the TATA box is positioned further upstream (positions
-33 and -34; Figure 7).
When the TATA box is located at position -33 or -34, this
increase is due to a gradually extended initiation site motif
(Figure 6f,g). When the TATA box is located at position -33,
the initiation site motif consists of a PyPu dinucleotide at [-1,
+1], and a Py at -2. The reason for this is best explained by an
example. Promoters with TATA boxes located at position -33
rarely have PyPu dinucleotides ending in positions -3 to -2
(Figure 5); consequently, the remaining alternatives are
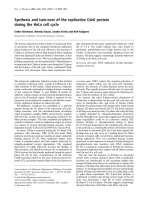
Tissue specificity measured by relative entropyFigure 2 (see following page)
Tissue specificity measured by relative entropy. (a) Tissue specificity correlation between EST and CAGE data sources, measured as the mean relative
entropy in each of the nine gene sets. Standard error bars for CAGE (red) and EST (blue) are shown. The plots of the six tissue-specific sets are distinct
from the three ubiquitously expressed sets. (b) Tissue specificity correlation between EST and CAGE data sources, using the tissue specificity (relative
entropy) of individual genes in each set. Spearman correlation coefficients and associated P values rejecting the null hypothesis (no correlation) are shown
in Table 1. CAGE, cap analysis of gene expression; EST, expressed sequence tag.
R78.6 Genome Biology 2006, Volume 7, Issue 8, Article R78 Ponjavic et al. />Genome Biology 2006, 7:R78
Figure 2 (see legend on previous page)
6
6
6
0123456
012345
012345
0123456
0123456
0123456
0123456
0123456
0123456
Relative entropy of
each gene
based on UniGene
EST clusters
Relative entropy of
each gene
based on UniGene
EST clusters
Relative entropy of
each gene
based on UniGene
EST clusters
Relative entropy
of each gene
based on CAGE clusters
Relative entropy
of each gene
based on CAGE clusters
Relative entropy
of each gene
based on CAGE clusters
Liver-specific gene set
0123456
012345
0123456
0123456
0123456
0123456
0123456
0123456
0123456
Housekeeping gene set
Citric acid cycle gene set
Ubiquitin mediated
proteolysis
gene set
Testis-specific gene set
Heart-specific
gene set
Whole-brain-specific
gene set
Lung-specific gene set
Cerebellum-specific gene set
0.0 0.5 1.0 1.5 2.0 2.5 3.0 3.5
0.0 0.5 1.0 1.5 2.0 2.5 3.0 3.50.0 0.5 1.0
Housekeeping set
Citric acid cycle set
Ubiquitin mediated
proteolysis set
Whole-brain-specific set
Heart-specific set
Testis-specific set
Liver-specific set
Lung-specific set
Cerebellum-specific set
(a)
Mean (relative entropy based on CAGE clusters)
for each geneset
Mean (relative entropy based on UniGene EST clusters)
for each geneset
(b)
Genome Biology 2006, Volume 7, Issue 8, Article R78 Ponjavic et al. R78.7
comment reviews reports refereed researchdeposited research interactions information
Genome Biology 2006, 7:R78
PyPy, PuPy, and PuPu dinucleotides. This would result in an
over-representation of Py nucleotides in the second dinucle-
otide position. More importantly, once a Py nucleotide is cho-
sen, each following nucleotide must also be a Py (until the
true initiation site is reached) because the alternative would
create a PyPu initiation site at a more favorable position. To
determine whether we can reproduce these observations by
simulation of the described constraints, we constructed a
rule-based hidden Markov model (HMM) [47,48] that
generated promoters where PyPu dinucleotides were not
allowed in the region upstream of the TSS (see Materials and
methods, below). Using the HMM, we generated three sets of
1000 promoters corresponding to TATA-TSS spacings of 32-
34 bp (Figure 8). The generated promoters exhibit a gradual
increase in Py nucleotides immediately upstream of the TSS.
This is consistent with the observed promoters having TATA
boxes at -33, but less so for promoters with TATA boxes at -
34 (Figure 6). The initiation motif of promoters with the
TATA box at -34 is ambiguous: the [C|T] in position -1 is
replaced by a [C|T|G], with two weaker [C|T|G] at positions -
2 and -3. The weaker signal strength is possibly a conse-
quence of the lower number of sites in combination with the
small sample correction applied (see Materials and methods,
below). As a result, we cannot claim with confidence that the
-34 position differs in a fundamental way from position -33
except by being even less favorable and therefore rarely
observed.
Given the findings above, we argue that the additional signal
strength (Figures 6 and 7) found around the initiation site in
promoters with extended TATA-TSS spacings is not due to
the existence of shared PIC binding site motifs in these
promoters, but is due to the absence of a PyPu transcription
initiation site at a more favorable spacing (Figure 5). Because
information content is a measure of constraints in selection of
symbols (in this case nucleotides), negative selection against
a subset of symbols will increase the information content.
Consistent with the previous initiation site analysis (Figure
4), promoters where the TATA box is located at -28 have a
weaker initiation site with an SR consensus at [-1, +1] (Figure
6a). The atypical promoter structure together with the low tis-
sue specificity suggests that the mechanism for TATA-driven
transcription is different in promoters with this spacing type.
We checked for the possibility that the TATA boxes at -28
could actually represent bona fide TATA boxes at -30, which
would render the TATA box at position -28 redundant. How-
ever, the logo summarizing TATA boxes detected at -28 shows
no support for this explanation. Additionally, the promoter
structure and differential use of initiation site sequences
between the promoters with TATA boxes at -30 and -28
makes the proposition unlikely. If a majority of TATA boxes
located at -28 had a functional (and preferentially used)
TATA box at -30, then we would expect the initiation site dis-
tributions to be similar for both spacing classes. On the other
hand, the logo representing the TATA boxes located at posi-
tion -34 (Figure 6g) has a TATATAA consensus instead of the
TATAAA seen in the other spacings. This clearly shows the
potential for parallel usage of TATA boxes at positions -34
and -32 (using the first and second T in the TATATAA).
The CAGE tag distribution around the dominant start posi-
tion also reflects the spacing classes (Figure 6). As expected,
positions -31 and -30 have the smallest CAGE tag distribution
skew (the number of CAGE tags at each side of the dominant
start site is approximately equal). Interestingly, the CAGE tag
distribution in promoters with TATA boxes at position -31 is
close to perfectly symmetrical, whereas there is a small skew
toward the larger spacings at promoters where the TATA box
is located at -30 (Figure 6c,d). Promoters where the TATA box
is located elsewhere exhibit a considerable skew, which is
fully consistent with the location of the sites, because they are
skewed in the direction of more favorable spacings; promot-
ers where the TATA box is located at positions -28 and -29
have alternative TSSs located downstream of the main TSS.
Conversely, promoters with the TATA box at -32, -33, and -34
have alternative TSSs upstream of the main TSS (Figure 6). In
both cases, the effect of choosing the indicated alternative
TSSs would be a TATA-TSS spacing of 30 or 31 bp. In the case
of promoters where the TATA-box is located at -34, there is
potential for usage of both alternative TSSs and alternative
TATA-boxes, as discussed above.
TBP binding strength has minor effects on
transcriptional specificity compared to spacing
Having established that the spacing between TATA box and
TSS is associated with transcriptional specificity, we
investigated whether the strength of the TBP-TATA interac-
tion has similar properties. The score of a predictive position
weight matrix model is highly correlated with the strength of
the protein-DNA interaction [40,49]. We only considered
promoters with one or more TATA predictions having posi-
tion weight matrix scores over the threshold of 75% [50], and
focused first on the strongest TATA box. We could find no glo-
bal correlation between binding strength and tissue specifi-
city (R
2
= 1.5 × 10
-2
; Figure 9a), and neither could we establish
any corresponding correlation when we subdivided the TATA
boxes with respect to spacing (R
2
values from 6.5 × 10
-4
to 3.2
× 10
-1
, none of which is significant; Figure 9c).
Next, we investigated whether the existence of several, possi-
bly overlapping bona fide TATA boxes in a single core pro-
moter can influence the expression specificity, by analyzing
the correlation between the sum of scores for all predicted
TATA boxes, exceeding a 75% score threshold along the pro-
moter (see Materials and methods, below), and their
transcriptional specificity (Figure 9b). As above, we found no
correlation (R
2
= 6.1 × 10
-3
). Finally, we repeated the same
analysis with no score constraints in order to investigate
whether the total binding potential for TBP along the pro-
R78.8 Genome Biology 2006, Volume 7, Issue 8, Article R78 Ponjavic et al. />Genome Biology 2006, 7:R78
moter might have a significant influence (data not shown),
but we found no correlation (R
2
= 8.1 × 10
-3
).
Taken together, these results imply that there exists a certain
operational range of dissociation constant values for TBP-
DNA interaction that is required for efficient TATA box
guided transcription, but that there is no preferred strength of
interaction within that range.
Promoter shape modulates TATA-driven expression
Apart from the TATA-TSS distance, we found that the overall
shape of the promoters within the SP class is indicative of
transcriptional specificity and/or other promoter characteris-
tics. We have focused on two 'borderline' subtypes of promot-
ers found within the SP class set defined by Carninci and
coworkers [8].
The first subtype includes promoters with a single peak in
combination with a uniform distribution of CAGE tags
stretching over 50 bp. We refer to these as 'shallow-TSS' pro-
moters. This set is a subset of the single-TSS set analyzed
above for TATA spacing properties.
The second subtype includes promoters with two dominant
peaks with a spacing of 0-3 bp. We refer to these as 'twin-TSS'
promoters. This set is disjoint from the single-TSS set.
Representative examples of tag clusters of the shallow-TSS
and twin-TSS promoter subclasses are shown in Figure 1.
Shallow-TSS promoters are less effective for driving context-specific
expression
We previously showed that promoters where the CAGE tags
are distributed shallowly (the broad class [BR]) are associated
with ubiquitously expressed genes and have high over-repre-
sentation of CpG islands [8]. Therefore, it is not unreasonable
that SP promoters with BR-like characteristics would be less
suitable for directing specific expression. As described above,
we tested the subset of 76 shallow-TSS promoters harboring
TATA boxes against the remaining set of 708 single-TSS pro-
moters harboring TATA boxes. The overall transcriptional
selectivity of shallow-TSS promoter subset is lower (P = 4.0 ×
10
-2
; one-tail Wilcoxon test), although the P value is margin-
ally significant. Interestingly, this is also true if we only con-
sider the dominant peak of the promoters in both sets (we
ignore the flanking tags; P = 4.1 × 10
-2
; one-tail Wilcoxon
test). Within a shallow-TSS promoter, the dominant peak
generally has a higher transcriptional specificity than the
flanking tags (P = 1.32 × 10
-4
; one-tail paired Wilcoxon test).
Unexpectedly, the transcriptional specificity of the dominant
peaks are highly correlated with that of the flanking tags (P <
2.2 × 10
-16
; two-sided Spearman rank correlation test), sug-
gesting that the shape of these promoters cannot be explained
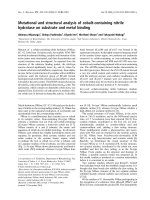
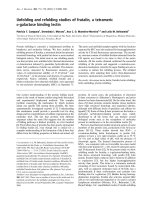
The spacing between TATA box and the dominant TSS is associated with transcriptional specificityFigure 3
The spacing between TATA box and the dominant TSS is associated with transcriptional specificity. (a) Tissue specificity (measured as median relative
entropy) for promoters with different TATA-TSS spacing. Positions with 20 counts or more are shown as red dots with standard error bars. (b)
Histogram showing number of promoters with the TATA box located at a given position. In both plots, only the most prominent TATA box is considered
in each promoter. Both representations indicate that most functional TATA boxes reside in a narrow 4 bp window from positions -32 to -29, dominated
by positions -31 and -30. The rapid decrease in site counts and transcriptional specificity downstream of -29 suggests that 28 bp is the minimal TATA-TSS
distance for TATA-driven initiation; it might also have functional properties distinct from more favorable spacings (see main text). bp, base pair; TSS,
transcription start site.
TATA - box position
-24-25-26-27-28-29-30-31-32-33-34-35-36-37-38-39
Number of promoters
0 50 100 150
200
0.4 0.8 1.2
Median relative entropy
(a)
(b)
Genome Biology 2006, Volume 7, Issue 8, Article R78 Ponjavic et al. R78.9
comment reviews reports refereed researchdeposited research interactions information
Genome Biology 2006, 7:R78
by two overlaid tag distributions with different levels of tissue
specificity.
Spacing between TSSs in twin-TSS promoters affects promoter
structure
As discussed above, the analysis of TATA-TSS spacing was
focused on promoters where almost all TSSs are confined to a
single nucleotide position. When preparing this set, we
noticed a substantial number of promoters (465) that have
two closely spaced dominant peaks (distance smaller than
four nucleotides). We refer to this class of promoters as 'twin-
TSS'. To investigate whether the TSS distribution can affect
the promoter structure, we asked whether both peaks are
associated with a TATA-like sequence about 30 bp upstream,
or whether other mechanisms are employed, such as specific
initiation site motifs. Regardless of TATA content, we subdi-
vided the twin-TSS promoters with respect to the spacing
between the two peaks, and constructed sequence logos by
aligning each promoter centered on the peak located the fur-
thest upstream (Figure 10). In the logos, we defined the +1
position to be the location of the first of the peaks. This defi-
nition is arbitrary and illustrates the disadvantage with the
traditional annotation of the TSS as +1, in light of the CAGE
data presented here and previously [8].
We found that promoters with a genomic spacing of 1-3 bp
between the peaks have an unmistakable TATA consensus
starting at around -30 and exhibit PyPu consensus initiation
sites (Figure 10b-d). Conversely, promoters with two adjacent
peaks (no spacing) have a significant under-representation of
TATA boxes compared with the other twin-TSS promoters (P
= 5.6 × 10
-6
; two-tailed Fisher's exact test [see Materials and
methods, below]). These promoters also have a radically dif-
ferent signal near the initiation site: a GGG consensus, where
the last G is located at position +1 (Figure 10a). Although the
consensus is similar to the initiation site motif found previ-
ously in transcripts starting in 3' untranslated regions of pro-
tein encoding genes [8], we can at present only speculate on
whether the mechanisms governing these types of promoters
are similar.
We also investigated whether the transcriptional specificity of
TATA-driven twin-TSS promoters is significantly different
from that of single-TSS promoters. Intriguingly, the twin-TSS
promoters might have a greater transcriptional specificity
than the single-TSS promoters (P = 4.5 × 10
-2
; one-tail Wil-
coxon test). However, because relative entropy values for the
twin-TSS set are dominated by a few extreme outliers, it is
unclear whether this observation holds in general. This
implies that there are highly tissue-specific promoters that
use two closely located TSSs, but it is unclear whether these
are guided by two overlapping TATA boxes or by a mecha-
nism in which the PIC chooses between the two comparably
favorable TSSs (see Discussion, below).
Discussion
Determination of optimal TATA-TSS spacing
We have found that the spacing of the TATA-TSS is associated
with tissue-specific expression (Figure 3). In particular, posi-
tions -31 and -30 are most strongly associated with context-
specific transcription.
In comparison with the TATA-TSS spacing, the strength of
TBP-TATA interaction does not appear to be correlated with
the tissue specificity, only requiring that the interaction
strength between TBP and a potential TATA box exceeds
some threshold level.
The effects of TATA-TSS spacing on transcriptional specifi-
city have been studied in depth within a few plant promoters.
Zhu and coworkers [16] showed that, in Oryza sativa, the
phenylalanine-lyase promoter activity in vitro was eliminated
when a 6 bp element was either deleted from positions -21 to
-16 or inserted between positions -18 and -19. This is entirely
consistent with our more comprehensive study, because
transferring the TATA box 6 bp upstream or downstream
would take its starting locations outside the range of accepta-
ble TSSs, as defined above. In a more detailed study of the
developmentally important β-phaseolin gene promoter [17],
multiple insertions and deletions were used to dissect the
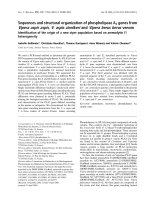
TATA-TSS spacing influences initiation site usageFigure 4
TATA-TSS spacing influences initiation site usage. Histogram showing the
distribution of the four possible dinucleotides (PyPu, PyPy, PuPy, and PuPu)
at the initiation site [-1, +1] for promoters with the TATA box located at
each position in the -34 to -28 range. As described previously [8], initiation
sites composed of PyPu dinucleotides are the most prominent, regardless
of spacing. The dinucleotide distribution is significantly different for
promoters where the TATA box starts at -28. Pu, purine; Py, pyrimidine.
-34 -33 -32 -31 -30 -29 -28
0.0 0.2 0.4 0.6 0.8 1.0
PyPu PuPy PyPy PuPu
Fraction of dinucleotides
TATA-box position
R78.10 Genome Biology 2006, Volume 7, Issue 8, Article R78 Ponjavic et al. />Genome Biology 2006, 7:R78
promoter function. Insertions between the TATA boxes and
the initiation sites conferred either a significant decrease in
transcription or creation of new TSS with a more favorable
spacing (30 or 31 bp) relative to the TATA box, which is con-
sistent with our analysis. Similarly, O'Shea-Greenfield and
coworkers [15] showed that maximal expression in an in vitro
system using human cell nuclear extracts was achieved when
the TATA-TSS distance was 30 bp, and that when extending
the distance from 30 to 35 or 40 nucleotides the start site was
dislocated to a position 30 bp downstream of the TATA box.
Although our study shows the functional importance of the
distance separating the TATA box and the TSS, the
underlying mechanism that determines the start site selec-
tion is not fully understood, despite high-resolution X-ray
structure determinations of the PIC and the polymerase II
complex [5]. In TATA-driven promoters in higher eukaryotes,
the TATA box functions as an anchor for the rest of the PIC,
thus sterically focusing the selection of initiation sites to a
limited range of positions. It is important to note that at
present it is not fully understood whether the TATA-TSS
spacing in itself contributes to changes in transcriptional spe-
cificity, or whether the observed spacings are consequences of
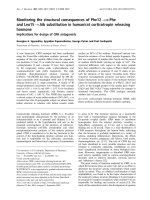
Extended TATA-TSS distances require unambiguous PyPu initiation sitesFigure 5
Extended TATA-TSS distances require unambiguous PyPu initiation sites. The fraction of PyPu dinucleotides in a sliding 2 bp wide window was calculated
for each TATA spacing class in the [-5, +5] promoter region. Promoters with extended TATA-TSS distances (32-34 bp) are depleted of PyPu dinucleotides
immediately upstream of the dominant TSS [-1,+1] (namely, [-2,-1] and [-3,-2]; fraction of PyPu dinucleotides shown as grey bars) and have a PyPu
consensus at this site. Introduction of PyPu dinucleotides in this region would probably create new TSSs with a more favored distance to the TATA box.
The PyPu distribution is largely symmetrical in promoters where the TATA box is located at position -31 to -29, indicating a possible intrinsic stretching
mechanism within the PIC for selecting strong initiation sites located further away than the most favored distance (30 or 31 bp). bp, base pairs; PIC, pre-
initiation complex; Pu, purine; Py, pyrimidine; TSS, transcription start site.
0.0 0.2 0.4 0.6 0.8 1.0
0.0 0.2 0.4 0.6 0.8 1.0
0.0 0.2 0.4 0.6 0.8 1.0
0.0 0.2 0.4 0.6 0.8 1.0
0.0 0.2 0.4 0.6 0.8 1.0
0.0 0.2 0.4 0.6 0.8 1.0
0.0 0.2 0.4 0.6 0.8 1.0
[-5,-4]
[-3,-2]
[+2,+3]
[-1,+1]
[+4,+5]
Position
[-4,-3]
[-2,-1]
[+1,+2]
[+3,+4]
[-5,-4]
[-3,-2]
[+2,+3]
[-1,+1]
[+4,+5]
Position
[-4,-3]
[-2,-1]
[+1,+2]
[+3,+4]
[-5,-4]
[-3,-2]
[+2,+3]
[-1,+1]
[+4,+5]
Position
[-4,-3]
[-2,-1]
[+1,+2]
[+3,+4]
[-5,-4]
[-3,-2]
[+2,+3]
[-1,+1]
[+4,+5]
Position
[-4,-3]
[-2,-1]
[+1,+2]
[+3,+4]
[-5,-4]
[-3,-2]
[+2,+3]
[-1,+1]
[+4,+5]
Position
[-4,-3]
[-2,-1]
[+1,+2]
[+3,+4]
[-5,-4]
[-3,-2]
[+2,+3]
[-1,+1]
[+4,+5]
Position
[-4,-3]
[-2,-1]
[+1,+2]
[+3,+4]
[-5,-4]
[-3,-2]
[+2,+3]
[-1,+1]
[+4,+5]
Position
[-4,-3]
[-2,-1]
[+1,+2]
[+3,+4]
Fraction PyPuFraction PyPu
TATA at -31
TATA at -33
TATA at -32
TATA at -29
TATA at -30
TATA at -28
TATA at -34
Genome Biology 2006, Volume 7, Issue 8, Article R78 Ponjavic et al. R78.11
comment reviews reports refereed researchdeposited research interactions information
Genome Biology 2006, 7:R78
other events, such as the mechanistic constraints imposed by
the PIC and other trans-acting regulatory proteins.
A recent genome-wide survey of Arabidopsis thaliana core
promoters [51] indicates that plant TATA box driven promot-
ers probably share the spatial constraints presented herein.
The authors estimated that the ideal TATA-TSS spacing in A.
thaliana is 32 bp, but this analysis lacked the depth and
resolution of TSS data that now are available for mouse [7,8].
The allowed TATA-box position distribution is similar to that
of mouse, in which TATA boxes at positions closer than -29
are rarely observed, and larger distances are tolerated more
often. The results in A. thaliana clearly show an immediate
application for the insights we have presented in this study;
the precise rules established here are valid across many
eukaryotes, and can be applied for annotation of TATA-
driven TSSs of those genomes in which the TSS data are not
available or not precise enough.
Promoter shape and initiation site consensus
As discussed, our results indicate that the TATA box must lie
within a narrow 4 bp region (-32 to -29) in order to achieve
high transcriptional specificity. When the TATA box is
located within this region, the initiation site at [-1, +1] is dom-
inated by a PyPu dinucleotide consensus. In the case of TATA
motifs located upstream of -32, the PyPu consensus is
retained but extended for TATA boxes at positions -33 and -
34 (Figure 6f,g and Figure 7), which is due to an absence of
PyPu initiation sites at more favorable distances upstream of
the actual TSS (Figure 5). In these promoters there is also an
evident skew in the CAGE tag distribution, indicating that if
alternative minor start sites exist then they preferentially use
more favorable spacings (closer to positions -30 and -31).
Our interpretation of these extended spacing classes can be
divided into two different but not mutually exclusive hypoth-
eses. First, because the TATA motif is more expanded and
variable at these positions, there is a possibility that a weaker
TATA box 2 bp downstream is used instead of the site indi-
cated in our analysis. However, a consistent use of the down-
stream TATA box would not explain the high scoring TATA
boxes at position -34 or -33, the skew of usage of minor initi-
ation sites towards canonical spacing, or the depletion of
PyPu dinucelotides at positions [-2, -3] (Figure 5), which is
not present at other positions. A more likely explanation is
the parallel use of both TATA boxes in the promoter. Only
experimental follow up can resolve which of the putative sites
is preferentially used.
A second, alternative explanation is that there is an intrinsic
'stretching' potential in the PIC anchored to the TATA box,
resulting in the possibility of selecting TSS located further
downstream when no suitable initiation site is present at the
canonical distance. Promoters with a TATA box located at
position -28 have a significantly different initiation site distri-
bution in terms of PyPu (Figure 4). Because the PyPu
initiation site is ambiguous in these promoters, it is reasona-
ble to believe that the PIC stretching potential suggested
above can accommodate extended but not decreased TATA-
TSS distances. As in the case of more extended spacings, there
is a skew in the CAGE distribution toward more canonical
spacings.
These results suggest that the mechanism for TATA-TSS
interaction by the PIC is comparable for promoters where the
TATA box is located at positions -34 to -29. Conversely, the
combination of atypical initiation sites and radically
decreased transcriptional specificity for promoters where the
TATA-box is located at position -28 suggests that this type of
interaction is governed by at least partially different
mechanisms.
Correlation between CAGE distribution and TATA
occurrence
In the concluding part of our analysis we looked at two related
classes or promoters that depart from the 'ideal' single-
peaked distributions. Our data indicate that the shallow-TSS
class promoter might have a lower transcriptional specificity
than the remaining single-peak class; this seems to be true
also for the dominant TSS position.
The twin-TSS class promoters have a TATA box pattern when
the spacing of the two dominant TSS peaks ranges from 1 to 3
bp. However, if the two TSS peaks have no spacing, then the
promoters are TATA depleted and have a novel initiation site
sequence motif (Figure 10).
TATA-TSS spacing is correlated with promoter and initiation site characteristicsFigure 6 (see following page)
TATA-TSS spacing is correlated with promoter and initiation site characteristics. (a-g) Sequence logos [43] for promoters divided into spacing subclasses
based on the location of the most prominent TATA box. CAGE tag distribution trends in each spacing subclasses are shown below each logo; specifically,
the median fraction of CAGE tags within each promoter for each spacing class is plotted using a log-scaled y-axis (see Materials and methods). The
locations of the dominant TSS and the TATA-box start are indicated with black arrows. Both the initiation site (positions -3 to +1) consensus and CAGE
tag distributions differ between the different classes. Of particular interest is the extended initiation site motif for promoters located at -33 and -34, as well
as the different consensus for promoters with TATA boxes located at -28. The CAGE tag distribution is skewed in a direction that is consistent with
alternative start sites at a more favorable spacing (closer to position -30 or -31). CAGE, cap analysis of gene expression; TSS, transcription start site.
R78.12 Genome Biology 2006, Volume 7, Issue 8, Article R78 Ponjavic et al. />Genome Biology 2006, 7:R78
Figure 6 (see legend on previous page)
-10 1 10 20-20-30
-10 1 10 20-20-30
-10 1 10 20-20-30
-10 1 10 20-20-30
-10 1 10 20-20-30
-10 1 10 20-20-30
-10 1 10 20-20-30
TATA at -32
TATA at -33
TATA at -29
TATA a t - 3 0
TATA at -31
TATA a t - 2 8
TATA at -34
BitsBits
BitsBits
BitsBits
Bits
0.01
0.10
1.00
0.01
0.10
1.00
0.01
0.10
1.00
0.01
0.10
1.00
0.01
0.10
1.00
0.01
0.10
1.00
0.01
0.10
1.00
(a) (e)
(b) (f)
(c) (g)
(d)
Median fraction
of CAGE tags
in promoters
Median fraction
of CAGE tags
in promoters
Median fraction
of CAGE tags
in promoters
Median fraction
of CAGE tags
in promoters
Genome Biology 2006, Volume 7, Issue 8, Article R78 Ponjavic et al. R78.13
comment reviews reports refereed researchdeposited research interactions information
Genome Biology 2006, 7:R78
The presented results demonstrate that the interdependence
of TATA motifs and the associated TSSs reflect underlying
promoter architecture and mechanisms.
Conclusion
The underlying features of the CAGE data used in this study
have enabled the discovery that TATA-TSS spacing is associ-
ated with the transcriptional specificity of the downstream
transcript, the TSS distribution of the promoters, and initia-
tion site motifs. Although our understanding of the functional
mechanism that governs core promoters in general and the
TATA-TSS interaction in particular is still limited, the results
presented here will provide fertile ground for more detailed
studies of core promoters. Our findings can be also used to
resolve a substantial subset of ambiguities that arise from
unreliable determination of TSSs, and will be an asset when
annotating putative TATA boxes in uncharacterized promot-
ers. The rules inferred for TATA boxes are directly applicable
to the design of expression vectors in vertebrate systems, and
suggest further directions in experimental investigation of
transcriptional initiation from TATA-dependent promoters.
The combination of accurate, high-throughput TSS determi-
nation, systematic detection of cis-acting elements (for
instance, ChIP2-chip [52,53]), and computational analysis
offers a breadth of targets with a sufficient data depth to
explore genome-wide principles. CAGE tag distributions
reveal patterns of TSS usage in core promoters that will
greatly advance our understanding of core promoter function
and help to guide future promoter annotation and character-
ization experiments, both individual and genome wide.
Materials and methods
Experimental data sources
We used the FANTOM3 CAGE collection [7,8] for assessing
TSSs in mouse (Mus musculus). The experimental procedure
for production and mapping of CAGE tags to the genome Is
described elsewhere [8,21]. The full set of 7,151,511 mapped
CAGE tags was derived from 209 different RNA libraries and
23 tissues.
In our analysis we used a restricted set based on the 5,655,682
mapped tags originating from the 15 tissues, each containing
at least 10,000 mapped tags. We removed tags from whole-
Non-optimal TATA-TSS spacing is compensated for by increased signal strength in the TSS regionFigure 7
Non-optimal TATA-TSS spacing is compensated for by increased signal
strength in the TSS region. The signal strength around the initiation site [-
5,+5] (measured as information content in bits [45]) is lowest in
promoters that have the most favored TATA-TSS spacings (30 and 31 bp).
The signal strength is increased in promoters with a TATA-TSS spacing
ranging from 32 to 34 bp. This increase is due to an extended initiation
site motif, as shown in corresponding sequence logos in Figure 6. bp, base
pairs; TSS, transcription start site. bp, base pairs; TSS, transcription start
site.
-28-29-30-31-32-33-34
1.6 1.8 2.0 2.2 2.4 2.6 2.8
Information content (bits)
TSS region (-5 to +5)
TATA -box po s iti o n
HMM simulations demonstrate increased signal strength as a result of PyPu depletionFigure 8
HMM simulations demonstrate increased signal strength as a result of
PyPu depletion. Sequence logos resulting from sequence generation using
an HMM incorporating rules for describing PyPu usage (see Materials and
methods). Specifically, PyPu dinucleotides are not allowed in positions
where they would introduce new initiation sites with more favorable
TATA-TSS distances (-31, -32, and so on until the known spacing occurs).
This results in an increase of Py nucleotides upstream of the TSS. bp, base
pairs; HMM, Hidden Markov Model; Pu, purine; Py, pyrimidine; TSS,
transcription start site.
TATA at -32
Position
Bits
1
2
-7 -6 -5 -4 -3 -2 -1
TATA at -33
Position
Bits
1
2
TATA at -34
Position
Bits
1
2
(a)
(b)
(c)
+1 +2 +3
-7 -6 -5 -4 -3 -2 -1
+1 +2 +3
-7 -6 -5 -4 -3 -2 -1
+1 +2 +3
R78.14 Genome Biology 2006, Volume 7, Issue 8, Article R78 Ponjavic et al. />Genome Biology 2006, 7:R78
Exploration of the effects of TATA-TBP interaction strength on tissue specificityFigure 9
Exploration of the effects of TATA-TBP interaction strength on tissue specificity. We investigated possible dependencies between tissue specificity
measured by relative entropy and three aspects of TATA-TBP interaction potential in the -40 to -19 region of each promoter: (a) the predicted TATA
box with the highest score fulfilling the score threshold criteria defined in Materials and methods; (b) the sum of all predicted TATA boxes each fulfilling
the specified score criteria; and (c) the predicted TATA box with the highest score fulfilling certain score threshold criteria, given TATA box location. For
clarity, each plot in panel c corresponds to one type of TATA-TSS spacing, and can be considered a subset of the data points in panel a. The subdivision of
the TATA-containing promoters into the different TATA-TSS spacing classes confers no additional support for a significant relation between TBP-TATA
interaction strength and transcriptional specificity. In combination with panel a, this strongly suggests that TATA-TSS distance is more strongly linked to
tissue specificity than the TATA-TBP interaction strength within TATA-driven core promoters. TBP, TATA box binding protein; TSS, transcription start
site.
46810121416
5 10 15202530
0
1
2
3
4
5
6
7
0
1
2
3
4
5
6
7
TBP binding potential (sum of the scores of all predicted TATA
sites when score is >75% of max)
TBP binding potential (score of best predicted TATA
site in promoter when score is >75% of max)
Relative entropy
Relative entropy
TBP binding potential (score of best predicted TATA
site in promoter when score is >75% of maxima)
0
2
4
6
0
2
4
6
0
2
4
6
4 6 8 101214
16
468101214
16
4 6 8 10 12 14
16
TATA at -29
TATA at - 27
TATA at - 30TATA at - 31
TATA at -34
TATA at -28
TATA at - 33
TATA at - 32
TATA at - 35
R
2
=0.02198 R
2
=0.06828 R
2
=0.1567
R
2
=0.009551R
2
=0.001078
R
2
=0.01325
R
2
=0.3205
R
2
=0.0006524
R
2
=0.00497
R
2
= 0.01481 R
2
=0.006107
(a)
(c)
(b)
Genome Biology 2006, Volume 7, Issue 8, Article R78 Ponjavic et al. R78.15
comment reviews reports refereed researchdeposited research interactions information
Genome Biology 2006, 7:R78
body libraries, as well as macrophage libraries, because mac-
rophages are present in almost all tissues and macrophage-
specific genes have purine-rich proximal promoters that are
not TATA associated [54]. The CAGE data are described by
Kawaji and coworkers [55] and publicly available on the inter-
net [56]. We consistently used the G-correction algorithm, as
presented and used by Carninci and coworkers [8], for TSS
locations.
Promoter sets used in analyses
As in our previous study, CAGE TCs were used to define core
promoter locations. Briefly, a CAGE TC consists of CAGE tags
overlapping by at least 1 bp on the same strand [8]. Mouse
TCs, containing at least 50 tags from the CAGE set defined
above, were assigned a single peak shape (SP) if the distance
between the 25 and 75 tag density percentile was less than 4
bp. A total of 2863 core promoters fulfilled this classification
criterion and formed the initial set for selecting TATA-driven
promoters; this is the same definition as was used by Carninci
and coworkers [8], although that study used TCs with at least
100 tags. The reason for using the same initial definition was
to make it possible to reflect our findings here with those
made previously [8]. From this initial set we analyzed three
subsets.
Twin-TSS promoters
A promoter was classed as twin-TSS if it fulfilled the following
criteria: one of the neighboring TSSs (± 4 bp) relative to the
highest TSS peak must contain at least 25% of CAGE tags of
the highest TSS peak; and these two start site positions must
contain more than 75% of the total CAGE tags within the TC.
In total, 465 promoters were classed as twin-TSS, in which
the lowest observed tag count for any of the two peaks was
nine.
Single-TSS promoters
This is equivalent to the initial set of SP core promoters,
excluding the twin-TSS promoters defined above. In total,
2398 promoters were classed as single-TSS, in which the low-
est observed tag count of the main peak was 16.
Shallow-TSS promoters
This is a subset of the single-TSS promoters that fulfilled the
following criteria: the TC must consist of at least 30 start site
positions spanning a region greater than 50 bp; the sum of all
tags within the TC, excluding those contained in the highest
TSS peak, must be at least 100; and except for the dominant
peak, each distinct start site must contain 20% or fewer of
CAGE tags of the most dominant peak. In total, 185 promot-
ers were classed as shallow-TSS.
Determination of TATA box locations
We determined the occurrence of TATA boxes upstream 40 to
19 bp of the most dominant tag peak of these promoters by
using the TATA model constructed by Bucher [41] deposited
in the JASPAR database [57] and the TFBS Perl programming
module [58] for predicting potential TBP binding sites. For
clarity, the start of the TATA box was annotated as the first T
of the TATA motif and the second position of Bucher's model.
For selecting likely TBP-binding sites we only accepted site
predictions on the same strand as the transcript and
exceeding a relative score threshold of 75%. For the different
types of analysis in this work, we distinguished between three
cases: we considered the best scoring TATA box prediction
using the thresholds as above, the sum of all predicted sites
with each site scoring greater than the defined threshold, or
the sum of all predicted sites in the specified region without
any relative score threshold constraint.
The vast majority of the analyses were made on the single-
TSS promoter set. In total, 784 TCs in this set were assigned
Exploration of SP-class promoters with twin-TSSFigure 10
Exploration of SP-class promoters with twin-TSS. (a-d) Sequence logo
representations of promoters with two close, dominant peaks separated
by 0-3 bp. In contrast to previous sequence logos, we applied no
constraint on TATA presence for promoter inclusion. Black arrows
denote the location of the two dominant TSSs. The +1 position is
arbitrarily defined as the position of the TSS located the furthest
upstream. When there is no spacing between the peaks, promoters are
depleted of TATA boxes. This type of promoter has an atypical initiation
site consensus closely resembling that of transcripts in 3' untranslated
region promoters [8]. More diverged peaks have a higher amount of
TATA-like motifs around position -30 with respect to the most upstream
peak. bp, base pairs; TSS, transcription start site.
0 bp TSS spacing
1 bp TSS spacing
2 bp TSS spacing
3 bp TSS spacing
(a)
(b)
(c)
(d)
Bits
1
0
Bits
1
0
Bits
1
0
Bits
1
0
-40
-35
-30 -25 -20
-15 -10 -5
5
10
15
20
25
-40
-35
-30 -25 -20
-15 -10 -5
5
10
15
20
25
-40
-35
-30 -25 -20
-15 -10 -5
5
10
15
20
25
-40 -35 -30 -25 -20 -15 -10 -5 5 10 15 20 25
R78.16 Genome Biology 2006, Volume 7, Issue 8, Article R78 Ponjavic et al. />Genome Biology 2006, 7:R78
a predicted best scoring TATA box, whereas 2114 TCs in this
set were considered when applying no relative score thresh-
old criteria.
Measuring transcriptional specificity using CAGE
Transcriptional specificity was measured by the relative
entropy (the Kullback-Leibler distance) [22,59] of the tissue
distribution of a sample TC with respect to the tissue distribu-
tion of all 5,655,682 CAGE tags:
where k is the number of different tissues (n = 15), p is the dis-
crete probability distribution of tissues in the sample tag clus-
ter, and q is the discrete probability distribution of tissues for
all tags. The distance cannot be negative, and if p = q then the
distance d will be 0.
Measuring transcriptional specificity using ESTs
In a comparative study, we measured the transcriptional spe-
cificity based on EST clusters from the UniGene database;
more specifically, the Mm.profiles file from the UniGene ftp
repository [60] was used as a data source. It summarizes the
expression profile of ESTs in each cluster from libraries with
curated and controlled vocabulary tissue annotation, in
which each cluster has at least 10 tags. Relative entropy was
calculated using the equation given above, where k is the
number of tissues, p is the discrete probability distribution of
tissues in the sample EST cluster, and q is the discrete proba-
bility distribution of tissues for all ESTs.
Extraction of tissue-specific genes from literature and
Internet sources
The gene sets were taken from the supplementary material of
each publication, except for the GNF-derived data, which
were retrieved using the SymAtlas web tool [61]; we selected
all mouse genes from the Mouse GeneAtlas U74A [32] set,
which had an expression fold over 30 of the median using the
web retrieval tool for liver and adipose separately. The same
procedure was repeated for lung using a 25-fold threshold.
For all gene sets, we only included genes that were covered
both by CAGE and EST data. To be able to compare EST clus-
ters and CAGE TCs, we used the official mouse gene symbol
names for linking purposes. In cases in which several alterna-
tive promoters existed in the CAGE database, we selected the
TC with the largest number of tags. Within this analysis, we
did not exclude macrophage and whole body libraries,
because it was unreasonable to treat CAGE and EST sets dif-
ferently. We also used a CAGE tag count threshold of 30 tags
for TCs included in the analysis in order to be closer to the 10
EST threshold used in the UniGene cluster database.
Analysis of differential initiation site distribution for
promoters with the TATA box located at -28
We applied the χ
2
test for the frequency distribution, as
implemented by Ihaka and Gentleman [62], of the four differ-
ent dinucleotide classes (PyPu, PyPy, PuPy, and PuPu) at the
initiation site [-1, +1] in order to determine whether the initi-
ation site distribution from promoters in which the TATA box
is located at -28 can be considered significantly different from
the initiation site distribution from all promoters with the
TATA box situated at position -34 to -29.
Analysis of PyPu dinucleotide usage in the vicinity of
observed TSS
We wished to assess the occurrence of PyPu dinucleotides
immediately upstream and downstream of the TSS [-1, +1] in
the different TATA-TSS spacing classes (-34 to -28). Using a
2 bp sliding window, we counted the PyPu dinucleotides in
the region ± 5 bp of the TSS for each TATA-dependent
promoter sequence, normalized by the number of promoters
in each spacing class.
Specific TATA-TSS sequence logos and corresponding
CAGE tag distributions
We classified each TC in terms of the spacing between the best
scoring TATA box prediction that fulfilled the selection crite-
ria listed above, and the initiation site (the highest CAGE peak
within the TC, for convenience referred to as 'TSS' and located
at +1). We only considered TATA boxes in a restricted spacing
interval from position -34 to -28, because the absolute major-
ity of functional TATA boxes reside in this region (Figure 3b).
We then extracted the -40 to +25 sequence region relative to
Pseudo-code corresponding to the Hidden Markov model simulationFigure 11
Pseudo-code corresponding to the Hidden Markov model simulation.
*The PyPu depletion region, bounded by a and b, varies with the spacer
analyzed:
-4 to -2 if TATA TSS spacing is 34
-3 to -2 if TATA TSS spacing is 33
-2 if TATA TSS spacing is 32
i is an integer denoting position in the promoter
seq is a vector describing the emitted promoter sequence*
GENERATE-PROMOTER(a,b)
for(i = -7 -1, 1 3){
if (i >= a AND i <= b ){
randomly assign a nucleotide to n so that S[i-1]∉{C,T} AND
n ∉{A, G}
}
elseif (i == -1){
randomly assign a nucleotide to n so that n
∈{C, T}
}
elseif (i == 1){
randomly assign a nucleotide to n so that n
∈{A, G}
}
else {
randomly assign a nucleotide to n
}
S[i] = n
}
return S
dp
p
q
k
k
k
k
=
∑
log ,
2
Genome Biology 2006, Volume 7, Issue 8, Article R78 Ponjavic et al. R78.17
comment reviews reports refereed researchdeposited research interactions information
Genome Biology 2006, 7:R78
the TSS and created a sequence logo [43] for each TATA-TSS
spacing class using the TFBS programming modules [58].
Small sample correction was applied as described Schneider
and coworkers [43,44] and implemented by Lenhard and
Wasserman [58]. We measured the signal strength of the
region surrounding the initiation site by calculating the total
information content [46] of the -5 to +5 sequence region for
each given spacing class.
In order to visualize the CAGE tag distributions in that region,
the frequency distribution of CAGE tags was obtained for
each TC (one bin per bp) and then normalized by its total
number of CAGE tags within the TC. For each position in the
logo, we calculated the median tag density from the array of
vectors defined above.
Hidden Markov model simulation for exploring signal
strength effects of PyPu depletion
To investigate how the signal strength immediately upstream
of the observed TSS is affected by depletion of PyPu dinucle-
otides, we constructed a simple HMM that generates
sequences according to a set of rules. The rules are a simplifi-
cation of the biologic reality, because the goal is just to
explore the principal effects of PyPu depletion. The HMM
generates a sequence corresponding to the regions surround-
ing the TSS (-7 to +3) from left to right using the following
rule set: there must be a PyPu at [-1, +1]; when selecting a
nucleotide at position i in the region immediately upstream of
the [-1, +1] region, nucleotides [i-1, i] must not form a PyPu
dinucleotide; and aside from these constraints, all nucle-
otides are considered equally likely for selection.
The length of the region subjected to PyPu depletion in the
second rule is dependent on TATA location; if the TATA-box
is located at -33, then PyPu dinucleotides introduced at posi-
tions -3 or -2 would correspond to new TSSs with more
favorable spacings (-31 and -32, respectively). For promoters
where TATA is located at -32 or -34 the region is [-2] and [-2,
-3, -4], respectively. This process can also be expressed in
pseudo-code, as shown in Figure 11.
Software libraries
Unless otherwise indicated, we used the R language [62] for
statistical analysis and graph visualization. We used the TFBS
[58] library for promoter pattern analysis and sequence logo
drawing, and the AT libraries (Engström P, Andersen M,
Sandelin A, Fredman D, Lenhard B, unpublished data) for
sequence handling and genome informatics.
Acknowledgements
We thank Ann Karlsson at the Genome Exploration Research Group
(Genome Network Project Core Group), RIKEN Genomic Sciences
Center (GSC), RIKEN Yokohama Institute, and Chris Ponting at the MRC
Functional Genetics Unit, University of Oxford for help with editing of the
manuscript. JP gratefully acknowledges a joint research grant from the Stu-
dienstiftung des deutschen Volkes and the RIKEN Institute, a graduate
Clarendon Award, Oxford Balliol College Domus Award, and a graduate
scholarship by the Studienstiftung des deutschen Volkes. BL was supported
by Pharmacia Corporation (now Pfizer), the Swedish Research Council, and
The National Programme for Research in Functional Genomics in Norway
(FUGE) of the Research Council of Norway. This work is supported by a
Research Grant for the RIKEN Genome Exploration Research Project from
the Ministry of Education, Culture, Sports, Science and Technology of the
Japanese Government to YH; a grant of the Genome Network Project
from the Ministry of Education, Culture, Sports, Science and Technology,
Japan to YH; and a grant for the Strategic Programs for R&D of RIKEN to
YH. We thank two anonymous referees for constructive criticism.
References
1. Kadonaga JT: Regulation of RNA polymerase II transcription
by sequence-specific DNA binding factors. Cell 2004,
116:247-257.
2. Butler JE, Kadonaga JT: The RNA polymerase II core promoter:
a key component in the regulation of gene expression. Genes
Dev 2002, 16:2583-2592.
3. Smale ST, Kadonaga JT: The RNA polymerase II core promoter.
Annu Rev Biochem 2003, 72:449-479.
4. Hampsey M: Molecular genetics of the RNA polymerase II
general transcriptional machinery. Microbiol Mol Biol Rev 1998,
62:465-503.
5. Hahn S: Structure and mechanism of the RNA polymerase II
transcription machinery. Nat Struct Mol Biol 2004, 11:394-403.
6. Wasserman WW, Sandelin A: Applied bioinformatics for the
identification of regulatory elements. Nat Rev Genet 2004,
5:276-287.
7. Carninci P, Kasukawa T, Katayama S, Gough J, Frith MC, Maeda N,
Oyama R, Ravasi T, Lenhard B, Wells C, et al.: The transcriptional
landscape of the mammalian genome. Science 2005,
309:1559-1563.
8. Carninci P, Sandelin A, Lenhard B, Katayama S, Shimokawa K, Ponjavic
J, Semple CA, Taylor MS, Engstrom PG, Frith MC, et al.: Genome-
wide analysis of mammalian promoter architecture and
evolution. Nat Genet 2006, 38:626-635.
9. Schug J, Schuller WP, Kappen C, Salbaum JM, Bucan M, Stoeckert CJ
Jr: Promoter features related to tissue specificity as meas-
ured by Shannon entropy. Genome Biol 2005, 6:R33.
10. Taylor MS, Kai C, Kawai J, Carninci P, Hayashizaki Y, Semple CA:
Heterotachy in mammalian promoter evolution. PLoS Genet
2006, 2:e30.
11. Frith MC, Ponjavic J, Fredman D, Kai C, Kawai J, Carninci P, Hay-
shizaki Y, Sandelin A: Evolutionary turnover of mammalian
transcription start sites. Genome Res 2006, 16:713-722.
12. Bushnell DA, Westover KD, Davis RE, Kornberg RD: Structural
basis of transcription: an RNA polymerase II-TFIIB cocrystal
at 4.5 Angstroms. Science 2004, 303:983-988.
13. Grosveld GC, Shewmaker CK, Jat P, Flavell RA: Localization of
DNA sequences necessary for transcription of the rabbit
beta-globin gene in vitro. Cell 1981, 25:215-226.
14. Kovacs BJ, Butterworth PH: The effect of changing the distance
between the TATA-box and cap site by up to three base
pairs on the selection of the transcriptional start site of a
cloned eukaryotic gene in vitro and in vivo. Nucleic Acids Res
1986, 14:2429-2442.
15. O'Shea-Greenfield A, Smale ST: Roles of TATA and initiator ele-
ments in determining the start site location and direction of
RNA polymerase II transcription. J Biol Chem 1992,
267:1391-1402.
16. Zhu Q, Dabi T, Lamb C: TATA box and initiator functions in the
accurate transcription of a plant minimal promoter in vitro.
Plant Cell 1995, 7:1681-1689.
17. Grace ML, Chandrasekharan MB, Hall TC, Crowe AJ: Sequence and
spacing of TATA box elements are critical for accurate initi-
ation from the beta-phaseolin promoter. J Biol Chem 2004,
279:8102-8110.
18. Ren D, Nedialkov YA, Li F, Xu D, Reimers S, Finkelstein A, Burton ZF:
Spacing requirements for simultaneous recognition of the
adenovirus major late promoter TATAAAAG box and initi-
ator element. Arch Biochem Biophys 2005, 435:347-362.
19. Wolffe AP, Guschin D: Review: chromatin structural features
and targets that regulate transcription. J Struct Biol 2000,
129:102-122.
20. Shiraki T, Kondo S, Katayama S, Waki K, Kasukawa T, Kawaji H,
R78.18 Genome Biology 2006, Volume 7, Issue 8, Article R78 Ponjavic et al. />Genome Biology 2006, 7:R78
Kodzius R, Watahiki A, Nakamura M, Arakawa T, et al.: Cap analysis
gene expression for high-throughput analysis of transcrip-
tional starting point and identification of promoter usage.
Proc Natl Acad Sci USA 2003, 100:15776-15781.
21. Kodzius R, Kojima M, Nishiyori H, Nakamura M, Fukuda S, Tagami M,
Sasaki D, Imamura K, Kai C, Harbers M, et al.: CAGE: cap analysis
of gene expression. Nat Methods 2006, 3:211-222.
22. Kullback S, Leibler R: On information and sufficiency. Ann Math
Stat 1951, 22:79-86.
23. Steuer R, Kurths J, Daub CO, Weise J, Selbig J: The mutual infor-
mation: detecting and evaluating dependencies between
variables. Bioinformatics 2002, 8(Suppl 2):S231-S240.
24. Tseng YY, Liang J: Are residues in a protein folding nucleus
evolutionarily conserved? J Mol Biol 2004, 335:869-880.
25. Liu Z, Lin S: Multilocus LD measure and tagging SNP selection
with generalized mutual information. Genet Epidemiol 2005,
29:353-364.
26. Prakash P, Yellaboina S, Ranjan A, Hasnain SE: Computational pre-
diction and experimental verification of novel IdeR binding
sites in the upstream sequences of Mycobacterium tuberculo-
sis open reading frames. Bioinformatics 2005, 21:2161-2166.
27. Fuhrman S, Cunningham MJ, Wen X, Zweiger G, Seilhamer JJ, Som-
ogyi R: The application of shannon entropy in the identifica-
tion of putative drug targets. Biosystems 2000, 55:5-14.
28. Kasturi J, Acharya R, Ramanathan M: An information theoretic
approach for analyzing temporal patterns of gene
expression. Bioinformatics 2003, 19:449-458.
29. Pollet N, Schmidt HA, Gawantka V, Niehrs C, Vingron M: In silico
analysis of gene expression patterns during early develop-
ment of Xenopus laevis. Pac Symp Biocomput 2000:443-454.
30. Stekel DJ, Git Y, Falciani F: The comparison of gene expression
from multiple cDNA libraries. Genome Res 2000, 10:2055-2061.
31. Yan X, Deng M, Fung WK, Qian M: Detecting differentially
expressed genes by relative entropy. J Theor Biol 2005,
234:395-402.
32. Su AI, Cooke MP, Ching KA, Hakak Y, Walker JR, Wiltshire T, Orth
AP, Vega RG, Sapinoso LM, Moqrich A, et al.: Large-scale analysis
of the human and mouse transcriptomes. Proc Natl Acad Sci
USA 2002, 99:4465-4470.
33. Haverty PM, Weng Z, Best NL, Auerbach KR, Hsiao LL, Jensen RV,
Gullans SR: HugeIndex: a database with visualization tools for
high-density oligonucleotide array data from normal human
tissues. Nucleic Acids Res 2002, 30:214-217.
34. Kanehisa M, Goto S, Hattori M, Aoki-Kinoshita KF, Itoh M,
Kawashima S, Katayama T, Araki M, Hirakawa M: From genomics
to chemical genomics: new developments in KEGG. Nucleic
Acids Res 2006, 34(Database issue):D354-D357.
35. Plotkin JB, Robins H, Levine AJ: Tissue-specific codon usage and
the expression of human genes. Proc Natl Acad Sci USA 2004,
101:12588-12591.
36. Hsiao LL, Dangond F, Yoshida T, Hong R, Jensen RV, Misra J, Dillon
W, Lee KF, Clark KE, Haverty P, et al.: A compendium of gene
expression in normal human tissues. Physiol Genomics 2001,
7:97-104.
37. Megy K, Audic S, Claverie JM: Heart-specific genes revealed by
expressed sequence tag (EST) sampling. Genome Biol 2002,
3:RESEARCH0074.
38. Warrington JA, Nair A, Mahadevappa M, Tsyganskaya M: Compari-
son of human adult and fetal expression and identification of
535 housekeeping/maintenance genes. Physiol Genomics 2000,
2:143-147.
39. Wheeler DL, Barrett T, Benson DA, Bryant SH, Canese K,
Chetvernin V, Church DM, DiCuccio M, Edgar R, Federhen S, et al.:
Database resources of the National Center for Biotechnol-
ogy Information. Nucleic Acids Res 2006, 34(Database
issue):D173-D180.
40. Stormo GD: DNA binding sites: representation and discovery.
Bioinformatics 2000, 16:16-23.
41. Bucher P: Weight matrix descriptions of four eukaryotic RNA
polymerase II promoter elements derived from 502 unre-
lated promoter sequences. J Mol Biol 1990, 212:563-578.
42. Burke TW, Kadonaga JT: The downstream core promoter ele-
ment, DPE, is conserved from Drosophila to humans and is
recognized by TAFII60 of Drosophila. Genes Dev 1997,
11:3020-3031.
43. Schneider TD, Stephens RM: Sequence logos: a new way to dis-
play consensus sequences. Nucleic Acids Res 1990, 18:6097-6100.
44. Schneider TD, Stormo GD, Gold L, Ehrenfeucht A: Information
content of binding sites on nucleotide sequences. J Mol Biol
1986, 188:415-431.
45. Schneider TD: Evolution of biological information. Nucleic Acids
Res 2000, 28:2794-2799.
46. Shannon CE: A mathematical theory of communication. Bell
Syst Tech J 1948, 27:379-423.
47. Eddy SR: Profile hidden Markov models. Bioinformatics 1998,
14:755-763.
48. Durbin R, Eddy S, Krogh H, Mitchison G: Biological Sequence Analysis
Cambridge: Cambridge University Press; 1999.
49. Berg OG, von Hippel PH: Selection of DNA binding sites by reg-
ulatory proteins. Statistical-mechanical theory and applica-
tion to operators and promoters. J Mol Biol 1987, 193:723-750.
50. Sandelin A, Wasserman WW, Lenhard B: ConSite: web-based
prediction of regulatory elements using cross-species com-
parison. Nucleic Acids Res 2004, 32(Web Server
issue):W249-W252.
51. Molina C, Grotewold E: Genome wide analysis of Arabidopsis
core promoters. BMC Genomics 2005, 6:25.
52. Martone R, Euskirchen G, Bertone P, Hartman S, Royce TE, Lus-
combe NM, Rinn JL, Nelson FK, Miller P, Gerstein M, et al.: Distribu-
tion of NF-kappaB-binding sites across human chromosome
22. Proc Natl Acad Sci USA 2003, 100:12247-12252.
53. Mukherjee S, Berger MF, Jona G, Wang XS, Muzzey D, Snyder M,
Young RA, Bulyk ML: Rapid analysis of the DNA-binding specif-
icities of transcription factors with DNA microarrays. Nat
Genet 2004, 36:1331-1339.
54. O'Reilly D, Addley M, Quinn C, MacFarlane AJ, Gordon S, McKnight
AJ, Greaves DR: Functional analysis of the murine Emr1 pro-
moter identifies a novel purine-rich regulatory motif
required for high-level gene expression in macrophages.
Genomics 2004, 84:1030-1040.
55. Kawaji H, Kasukawa T, Fukuda S, Katayama S, Kai C, Kawai J, Carninci
P, Hayashizaki Y: CAGE Basic/Analysis Databases: the CAGE
resource for comprehensive promoter analysis. Nucleic Acids
Res 2006, 34(Database issue):D632-D636.
56. The CAGE basic viewer [ />mm5/]
57. Vlieghe D, Sandelin A, De Bleser PJ, Vleminckx K, Wasserman WW,
van Roy F, Lenhard B: A new generation of JASPAR, the open-
access repository for transcription factor binding site
profiles. Nucleic Acids Res 2006, 34(Database issue):D95-D97.
58. Lenhard B, Wasserman WW: TFBS: computational framework
for transcription factor binding site analysis. Bioinformatics
2002, 18:1135-1136.
59. Cover TM, Thomas JA: Elements of Information Theory New York:
Wiley; 1991.
60. UniGene ftp repository [ />Gene/]
61. GNF SymAtlas [ />62. Ihaka R, Gentleman R: R: a language for data analysis and
graphics. J Comput Graph Stat 1996, 5:299-314.