Báo cáo y học: "How complete are current yeast and human protein-interaction networks" pdf
Bạn đang xem bản rút gọn của tài liệu. Xem và tải ngay bản đầy đủ của tài liệu tại đây (185.07 KB, 9 trang )
Genome Biology 2006, 7:120
comment
reviews
reports
deposited research
interactions
information
refereed research
Opinion
How complete are current yeast and human protein-interaction
networks?
G Traver Hart*, Arun K Ramani*
†
and Edward M Marcotte*
Addresses: *Center for Systems and Synthetic Biology, Institute for Cellular and Molecular Biology, University of Texas at Austin,
2500 Speedway, Austin, TX 78712, USA.
†
Current address: The Wellcome Trust Sanger Institute, Wellcome Trust Genome Campus, Hinxton,
Cambridge CB10 1SA, UK.
Correspondence: Edward M Marcotte. Email:
Published: 1 December 2006
Genome Biology 2006, 7:120 (doi:10.1186/gb-2006-7-11-120)
The electronic version of this article is the complete one and can be
found online at />© 2006 BioMed Central Ltd
Networks are invaluable models for bettering our under-
standing of biological systems. Whether its constituent parts
are molecules, cells, or living organisms, a network provides
an organizing framework amenable to modeling the complex
events that emerge from interactions among the parts. In
functional genomics, concerted efforts over the past decade
or so have produced rudimentary maps of the networks of
genes, proteins, and metabolites controlling cells and, with
these maps, have offered the promise of predictive, rather
than just descriptive, models of molecular biology. Already,
the network of physical interactions (the ‘interactome’)
among yeast proteins, generated through a succession of
experimental and algorithmic reconstructions, has proved
its usefulness for discovering protein function [1,2], predic-
ting cellular behavior [3,4], and the analysis of complex gene
regulation [5-7]. Similar efforts for protein-interaction
networks for Caenorhabditis elegans and Drosophila
melanogaster are ongoing. We expect the human protein-
interaction network to be equally informative; like the
sequencing of the human genome, the construction of this
map will represent a major step along the path towards
understanding the functions of our genes.
Even in its current incomplete state, with interactions com-
piled from the literature, focused screens, and first-generation
high-throughput interaction maps, the human protein-protein
interaction network should be able to provide information
about gene function and relevance to human health. For
example, the emergent properties of proteins that are
revealed in networks, as opposed to considering each protein
in isolation, may identify genes and proteins critical to
disease. Such a trend has been observed in yeast: a yeast
gene’s tendency to be essential correlates with the count of
the encoded protein’s interaction partners (the ‘degree’) [8].
Although not without its critics [9,10], this correlation would
be exciting if present in animals. We have examined the
current human protein-interaction network and find that this
trend does indeed hold in humans (Figure 1). Among many
other contributions, the human protein-interaction network
will therefore focus attention on important hub proteins.
Such proteins are likely to be essential to cell function and
their disruption will often be lethal. Likewise, the network
may focus attention on particularly important interactions:
not all interactions are equally critical to the cell, and we
might expect the network context of interactions (such as
their centrality or association with essential proteins) to allow
essential interactions to be identified.
Although maps of both the yeast and human protein-
interaction networks are well under way, their completion
poses many problems, not least because of the anticipated
scale of the human network, which could require multiple
Abstract
We estimate the full yeast protein-protein interaction network to contain 37,800-75,500 interactions
and the human network 154,000-369,000, but owing to a high false-positive rate, current maps are
roughly only 50% and 10% complete, respectively. Paradoxically, releasing raw, unfiltered assay data
might help separate true from false interactions.
testing of all possible pairs of around 20,000-25,000 human
proteins - roughly 200 million to 300 million pairs. The
scale of this effort raises many questions. How do we even
measure completion? The network is, after all, unknown.
How close are we to completing the networks? How do we
assess errors in the maps? Would maps obtained using only
a single technique suffice?
In this article, we discuss the techniques used up to now,
describe strategies for recognizing network completion, and
estimate our progress towards finished yeast and human
protein-interaction maps. Even though large numbers of
interactions have been mapped, we argue that assay false-
positive rates are so high that only about half of the expected
yeast network has been defined to date, and considerably
less for the human one. Like whole-genome shotgun
sequencing [11], interaction networks will require multiple-
fold coverage for completion. We argue that raw interaction
data should be released, pooled, and analyzed as a set, as
was the case for the human genome sequence. Coverage is
low enough and errors common enough in individual
datasets to mean that the human interactome will only be
fully mapped through integration of repeated analyses from
many groups.
Current interaction mapping strategies and
their potential for scaling
The primary approach to mapping human protein inter-
actions is the same one that initiated the yeast interactome -
the yeast two-hybrid assay [12,13]. This classic assay involves
the creation of two fusion proteins, the ‘bait’ protein fused to
a DNA-binding domain and the ‘prey’ protein fused to a
transcriptional activator domain. An interaction between
bait and prey reconstitutes a complete transcription factor,
detected by transcription of a reporter gene. This approach
has already identified more than 5,000 interactions between
human proteins [14,15].
The second major approach is affinity purification followed
by mass spectrometry [16,17]. Here, epitope-tagged proteins
are purified by affinity chromatography, and their co-
purified interaction partners are identified by mass spectro-
metry. This assay excels at identifying in vivo protein
complexes in yeast and other systems [18], particularly when
used with tandem affinity purification (TAP) [19] and
genomic knock-in of tags [16] rather than overexpression of
transgenes. Most importantly, this technique bypasses
exhaustive trials of all binary protein pairs and may scale up
well to the size of the human interactome. On the downside,
the assay may be biased toward abundant proteins [20].
Also, human cells present more difficulties than yeast,
especially in expressing tagged libraries of human genes and
the need to grow large volumes of cells. Initial screens in
human cells [21] have used transgenes, rather than genomic
knock-ins, to simplify cloning.
120.2 Genome Biology 2006, Volume 7, Issue 11, Article 120 Hart et al. />Genome Biology 2006, 7:120
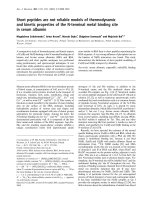
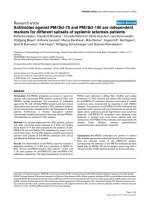
Figure 1
The tendency for a human gene to be essential correlates well with the
number of its protein-interaction partners, suggesting that essential
human genes can be identified directly from protein-interaction networks.
(a) For a set of around 31,000 human protein interactions [49], the
number of interactions per protein (the ‘degree’) is plotted for 907
essential vertebrate proteins known from mouse knockouts [50], human
small interfering (si)RNA screens [51,52], and zebrafish random
mutagenesis [53] and for the remaining 6,661 proteins in the network,
considering only the largest connected network component. (b) The
likelihood of being essential increases with increasing degree. Proteins
were sorted by degree and divided into bins of 100 proteins each (filled
diamonds). The observed frequency of essential genes in the bin is plotted
against the average degree of the proteins in the bin, showing high
correlation (R
2
= 0.78) between degree and essentiality.
Essential genes
All other genes
10
0
10
–1
10
–2
10
–3
10
–4
0.30
0.25
0.20
0.15
0.10
0.05
0.00
1 10 100 1,000
Frequency of degree in network (log scale)Frequency of essential genes in bin
(a)
(b)
Degree (log scale)
1 10 100 1,000
Mean degree of genes in bin, n = 100 (log scale)
The remaining main approaches to mapping yeast and
human protein interactions are computational - inferring
protein interactions by integrating evidence from
comparative and functional genomics (see, for example
[20,22-25]). Although these are in silico rather than in vivo
or in vitro interaction assays, they use experimental data
such as DNA microarrays or genome sequences to infer
protein interactions, and are, therefore, ultimately based on
experimental observations [26]. As large amounts of data
are available, these data-mining methods scale-up easily and
offer both in vivo relevance and the ability to detect stable
and transient interactions. Disadvantages include the
importance of measuring associated error rates and the need
for independent validation to verify error rates.
Although the approaches described above are complemen-
tary, the differences between them have caused some confu-
sion within the scientific community. The term ‘protein-
protein interaction’ carries two meanings: direct physical
binding or membership of the same multiprotein complex.
The latter usage is common in the field at large: for example,
both major efforts to map protein complexes in yeast
describe “interactions” between co-complexed proteins
[27,28]. Part of the ambiguity in usage arises from the fact
that few biochemical assays, apart from in vitro binding
assays, truly distinguish the two cases. Currently, only yeast
two-hybrid assays are regarded as measuring direct physical
interaction between proteins and, at least in principle, even
these interactions might occasionally be mediated through
other members of a nuclear protein complex. Protein co-
immunoprecipitation, often considered a definitive test of
direct physical interactions, more typically measures co-
complex interactions, much like the closely related affinity
purification/mass spectrometry interaction assays. In
addition, for the mass spectrometry interactions, one can
consider the bait-prey interactions (the ‘spoke’ model [29])
as well as the prey-prey interactions (the ‘matrix’ model),
with the latter typically of lower accuracy.
Estimating the scale of the yeast and human
protein interaction networks
Computational and experimental approaches have now
mapped a great many yeast and human protein interactions,
but how many interactions should we expect? We argue here
that the sizes of the complete yeast and human protein
interaction networks will be larger than most early estimates.
We do not yet know the size of any complete protein-
interaction network. We can, however, roughly estimate the
expected sizes for the yeast network using two different
approaches that agree reasonably well. These estimates are
derived from considering the interactions shared between each
pair of large-scale protein interaction assays published so far.
First, provided two large-scale assays sample the same
portion of ‘interaction space’ (that is, they sample the same
pairs of interacting proteins - usually a subset of the
interactome), then the number of interactions detected by
both assays should be distributed according to the
hypergeometric distribution, well-approximated for large
populations by the binomial distribution. Given two assays
of size n
1
and n
2
interactions, respectively, with k in
common, as well as estimates of the false-positive rates of
the two assays (fpr
1
and fpr
2
), the maximum likelihood
estimate of the number of interactions, N, within that
subspace is [n
1
(1 - fpr
1
) × n
2
(1 - fpr
2
)]/k, provided n
1
and n
2
are sufficiently large (n
1
(1 - fpr
1
) × n
2
(1 - fpr
2
) >> N; see
Additional data file 1 for a derivation of the statistics). This
intersection analysis (Figure 2) has a rich history in other
fields, such as mark-recapture methods for estimating the
size of an animal population [30], and has recently been
applied to protein-interaction networks [31].
In order to use this method, the datasets must be corrected
for their error rates. One method for estimating the false-
positive rates of large-scale assays, described by D’haeseleer
and Church [32], involves comparing the two datasets to each
other and to a reference dataset. The method does not require
a gold-standard reference; only that the reference not be
biased toward either of the samples being measured. This
requirement is met by comparing two similar assays: that is,
comment
reviews
reports
deposited research
interactions
information
refereed research
Genome Biology 2006, Volume 7, Issue 11, Article 120 Hart et al. 120.3
Genome Biology 2006, 7:120
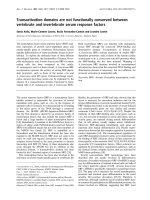
Figure 2
The method of intersection analysis for estimating interactome size. In an
interactome, or subspace of an interactome, of N true interactions, two
independent assays of n
1
and n
2
interactions are expected, under the
hypergeometric distribution, to share k interactions by random chance.
As described in the text, we can use the observed intersection of
interaction assays to estimate N.
N = true positive interactions
(the ‘interactome’)
False positives
n
1
n
2
k
either two mass spectrometry or two two-hybrid datasets.
The method, described in Figure 3a, uses the ratio of the
intersections of the three datasets to estimate the number of
true positives in each sample. An example using the
interactions derived from the two recent genome-scale
TAP/mass spectrometry assays published by Gavin et al. [27]
and Krogan et al. [28], compared to the Munich Information
Center for Protein Sequences (MIPS) reference set [33], is
presented in Figure 3b. In this and all subsequent analyses,
the interaction data were used as published: for Krogan et al.
[28] bait-prey pairs; for Gavin et al. [27] bait-prey pairs
derived from lists of prey associated with each bait.
To estimate the interactome size by intersection analysis, we
first take the interactions in each dataset that are derived
from the common sample space of the two assays. (Figure 3b
shows only the interactions in this common sample space.)
Each group purified around 2,000 TAP-tagged strains for
mass spectrometry, with the common set of baits numbering
1,243, of which 1,128 yielded at least one identical inter-
action. While a true ‘apples-to-apples’ comparison of these
results is difficult given the data that these two groups have
published, as discussed by Goll and Uetz [34], we tried to
extract the interactions derived from these common baits for
this analysis from the published filtered datasets. After
calculating error rates and subtracting false positives from
the two datasets, their intersection was used to predict the
number of interactions within the subspace they sample.
That prediction was then scaled up to the size of the whole
interactome (around 5,800
2
/2) to estimate the total number
of protein-protein interactions in the organism.
The error estimates for Gavin et al. [27] and Krogan et al.
[28], as well as those for other large-scale yeast interaction
datasets, are shown in Table 1. The false-positive rate of the
computationally derived Jansen dataset [22] was determined
by comparing it to Gavin et al. [27] and Krogan et al. [28]
individually, although these comparisons may violate the no-
bias requirement for the reference dataset. Table 2 shows the
interactome size predictions derived from these pairs of mass
spectrometry assays, which give an average interactome size
of about 53,000 interactions, although the Gavin-Krogan
pairwise estimate has the largest intersection and is,
therefore, likely to be the most accurate estimate of the three.
The two-hybrid assays [35,36] share too few interactions to
give a meaningful estimate of interactome size.
120.4 Genome Biology 2006, Volume 7, Issue 11, Article 120 Hart et al. />Genome Biology 2006, 7:120
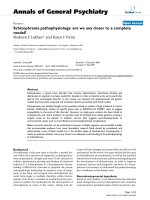
Figure 3
Estimating false-positive rates of large-scale assays. (a) As described by D’haeseleer and Church [32], the number of true positives in an interaction
dataset can be estimated by examining the ratio of intersections of two similar datasets (A and B) and a reference dataset. If intersections contain all true
positives, then the ratio of areas I and II is equal to the ratio of areas III and IV, where IV contains true positives (and V false positives, not shown to
scale). The number of false positives can then be determined by simple subtraction, repeating the calculation for the other dataset. (b) Calculation of
false-positive rates for the most recent yeast mass spectrometry assays of Gavin et al. [27] and Krogan et al. [28] within the interactome subspace
sampled by both experiments (1,243 baits) and using MIPS as the reference sample [33]. Intersections (regions I, II, II) were determined by examining the
data, and true- and false-positive populations (regions IV and V) were calculated as described in (a).
I
II
III
IV
V
Reference
Experiment B
Experiment A
(b)(a)
347
1771
220
IV = 1,123
V = 14,676
MIPS (7,020)
Gavin et al. [27]
18,137
Krogan et al. [28]
14,317
154
IV = 786
V = 11,259
These projected interactome sizes agree with those
generated by a simple, very approximate, scaling argument:
we observe approximately 5-10 unique interactions per yeast
protein in current networks; multiplying these values by
around 5,800 yeast genes gives estimates of approximately
29,000-58,000 interactions. These values are somewhat
larger than previous estimates of 10,000-30,000 total yeast
interactions [20,29,31,37-39].
Unfortunately, applying these techniques to high-through-
put assays of human protein-protein interactions is still
problematic. The two large-scale yeast two-hybrid screens
published recently [14,15] share only six interactions, too
small an intersection to generate reliable error rate or inter-
actome size estimates; similarly, data from Stelzl et al. [15]
share only 5 and 13 interactions with orthology-transferred
interactions from Lehner and Fraser [40] and the compu-
tationally derived set of Rhodes et al. [23], ruling out these
comparisons for estimating interactome size. However,
comparison of the Rual et al. [14] data with those of Lehner
and Fraser [40] and Rhodes et al. [23] yielded consistent
false-positive estimates, suggesting that reference bias is
minimal (Table 3). The human interactome estimates gener-
ated from these pairs of datasets are shown in Table 4. These
projections, while consistent with the estimate of approxi-
mately 260,000 interactions offered by Rual et al. [14], still
stem from small intersections and limited information about
sample space, and should be considered very rough estimates.
The critical importance of measuring error rates
This analysis, with many others [20,32,37,41-45], only
reinforces the importance of measuring error rates when
mapping protein interactions. Observing an interaction
experimentally (for example, as in a yeast two-hybrid assay)
does not guarantee a true positive interaction; that is, one
that occurs in vivo under native conditions during the life of
the organism. All assays, experimental and computational,
show errors and should be accompanied by measures of
confidence. Many published methods exist for estimating
comment
reviews
reports
deposited research
interactions
information
refereed research
Genome Biology 2006, Volume 7, Issue 11, Article 120 Hart et al. 120.5
Genome Biology 2006, 7:120
Table 1
Yeast protein-interaction assay false-positive rates: yeast datasets
Number of Derived false-positive Published false-positive Average false-positive
Dataset interactions rate* (%) rate (%) rate (%)
Uetz et al. [35] 854 46 [32] 32 [24]
†
,47 [44], 50 [37], 51 [42] 45
Ito [36] 4,393 89 [32] 71 [24]
†
, 78[41], 85 [37], 91 [44] 83
Gavin et al. [16] 3,180 68 [32] 14 [24]
†
, 22 [4], 35
<72 (upper bound [20])
Ho et al. [17] 3,618 83 [32], 81, 82, 80 55 [24]
†
, <97 (upper bound [20]) 76
Jansen et al. [22] 15,922 81, 79 - 80
Gavin et al. [27] 18,137 78, 82, 86
‡
-82
Krogan et al. [28] 14,317 75, 79, 66
‡
- 73
(7,123 core) (59, 65, 37
‡
core) (54 core)
Overall 51,419 72
*This interaction assay false-positive rate is taken from D’haeseleer and Church [32] or derived using the method therein. Multiple values derive from
choosing either the GRID [2] or MIPS [33] reference sets.
‡
This interaction assay false-positive rate is calculated with the EPR server of Deane et al. [42].
†
The mean of four values estimated from Table S3 of Lee et al. [24] by fitting the interaction set as a linear combination of true-positive (small scale
interactions) and false-positive (random pairs) interactions.
Table 2
Prediction of the size of the yeast interactome
Estimated interactions in
Dataset pair Common baits common search space Projected interactome size (95% CI)
Gavin-Krogan (core) [27,28] 1,128 3,642 38,600 (37,800-39,500)
Ho-Gavin [16,17] 241 718 50,000 (47,700-53,000)
Ho-Krogan (core) [17,28] 282 1,109 69,000 (63,300-75,500)
Mean 52,500 (37,800-75,500)*
*The range of interactome sizes is the minimum and maximum from the confidence intervals (CI) generated from pairwise estimates.
interaction assay error rates [20,22,37,41-45] and for scoring
individual protein-protein interactions. These latter scores
either exploit assay-specific features [46] or use simple, but
surprisingly effective, statistical criteria for separating true
from false-positive interactions [43,47,48]. For example,
although the full Ito et al. [36] yeast two-hybrid set has a
measured false-positive rate of around 80%, a statistical
measure based on the hypergeometric distribution can select
a subset of around 45% of the interactions whose false-
positive rate is only around 30% [43].
These high error rates underscore the difficulty in
evaluating progress towards complete interactomes. Given
these false-positive rates, and the resulting relatively small
number of interactions detected in multiple assays, how far
have we actually progressed towards the complete protein-
interaction networks of yeast and humans?
How do we know when we’re done?
As we can only approximate true interactome sizes, we have
few sure measures of interactome completion beyond simply
testing for coverage of confident interactions from the litera-
ture [2,20]. However, two empirical methods, assay satura-
tion and dead reckoning, suggest that we are far from finished
with either the yeast or human interactomes.
Assay saturation captures the notion that, early in
interaction-network mapping, each new interaction assay
largely discovers novel interactions, as was observed for the
first two large-scale yeast two-hybrid assays [36]. Provided
false-positive rates are well controlled, later assays should
reveal proportionally fewer novel interactions, with the new
interaction discovery rate dropping as interaction saturation
approaches 100%. At this time, the portion of the interactome
accessible to these assays will be complete, although this
approach says nothing about how well this accessible portion
covers the entire interactome. The saturation can be revealed
by plotting, for each additional assay, the total interactions
mapped versus the novel interactions mapped. Early assays
fall along the diagonal (all interactions are new); later assays
provide fewer new interactions, with the slope of the line
decreasing, ultimately approaching zero for error-free, com-
pletely redundant assays.
We tested for assay saturation in yeast and humans (Figure 4).
Not surprisingly, we detect no evidence of saturation in
humans. In yeast, however, there appears to be some: the
most recent yeast dataset from Krogan et al. [28] discovers
66% new interactions, on a par with the estimated false-
positive rate of the dataset. As with previous screens [20],
both recent large-scale mass spectrometry assays may be
biased toward interactions between abundant proteins, and
120.6 Genome Biology 2006, Volume 7, Issue 11, Article 120 Hart et al. />Genome Biology 2006, 7:120
Table 3
Human protein-interaction assay false-positive rates: human datasets
Number of Derived false-positive Published false-positive Average false-positive
Dataset unique interactions rates* (%) rates (%) rates (%)
Lehner and 58,700 96, 94, 93 - 94
Fraser [40] (9,396 core) (86, 81, 69 core) (79 core)
Rhodes et al. [23] 38,379 87, 86, 83 - 85
Stelzl et al. [15] 3,150 98, 98 70 [45] 98
(902 core) (94,95 core) (86 core)
Rual et al. [14] 2,611 87, 93 8-66 [14]
†
, 54 [45] 58
Overall 100,242 90
*This interaction assay false-positive rate is derived using the method of D’haeseleer and Church [32] and a reference set of 20,296 unique interactions
from HPRD [54], BIND [55], Reactome [56], and Ramani et al. [49]. Multiple values derive from different choices of comparison sets.
†
A range of six
values (mean 48%) estimated from Table 1 of Rual et al. [14] by fitting the interaction set CCSB-HI1 as a linear combination of true positive (LCI-core)
and false positive (all possible) interactions.
Table 4
Prediction of the size of the human interactome
Estimated interactions in
Dataset pair Interactions in both datasets common search space Projected interactome size (95% CI)
Rual-Lehner (core) [14,40] 35 28,200 261,000 (191,000-369,000)
Rual-Rhodes [14,23] 59 20,200 189,000 (154,000-239,000)
Mean 225,000 (154,000-369,000)*
*The range of interactome sizes is the minimum and maximum from the confidence intervals (CI) generated from pairwise estimates.
saturation is likely to be confined to interactions of abundant
proteins. Nevertheless, achieving this level of completeness
for a major fraction of yeast proteins is a worthy accomplish-
ment, and serves as a guide for future large-scale assays
exploring the rest of the yeast interactome.
The method of dead reckoning measures total interactome
completion from the number of interactions assayed and
their associated false-positive rates, just as sailors on the
high seas estimated distances from the ship’s speed and the
time traveled. For this approach, we assume all interactions
observed by more than one assay are true positives. When
assays are uncorrelated, this assumption holds for about
99.9% of the time for both yeast and human, given our
estimates of interactome size. The number of additional true
positives contributed by an assay of size n is n(1 - fpr) - x,
where x is the number of interactions already observed in
previous assays. By this measure, the yeast experiments in
Tables 1 and 2 plus the comprehensive literature databases
have contributed 24,800 true-positive interactions, or around
50% of the estimated interactome. Of this total, nearly
18,000 interactions come from curated literature databases
[2,33], and 5,800 were detected in more than one high-
throughput assay. Human protein-interaction assays have
similarly covered about 25,000 true-positive interactions, or
around 11% of the estimated interactome, with over 80%
coming from sources based on literature mining. Note that
these estimates assume that the literature sources are error-
free, which is certainly not the case [14].
For both organisms, a number of factors could extend the
current datasets to cover more of the interactome, such as
considering the matrix model of interactions discovered by
mass spectrometry [29]. Although this increases the false
positives, statistical scores can identify true positives [43],
increasing the overall quality and number of interactions.
Raw data release could be the way forward
High error rates in large-scale assays dictate that the com-
munity must oversample the interactome in order to approach
completion. Whole-proteome interactome mapping is, there-
fore, analogous to whole-genome shotgun sequencing [11]:
each assay reveals a subset of the interactions (sequence),
requiring multiple-fold coverage of the interactome (genome)
for completion of the true-positive set. In shotgun sequen-
cing, assembly of sequencing reads is the algorithmically
difficult step. By contrast, controlling and measuring error
rates is currently the more challenging step in ‘shotgun’
interactome mapping. With false-positive rates exceeding
50%, and false-negative rates (the proportion of true inter-
actions missed) for two-hybrid assays in particular approa-
ching 90%, it is clear that each subspace must be sampled
many times to provide complete coverage - and the problem
remains of separating the true interactome from the false
positives.
comment
reviews
reports
deposited research
interactions
information
refereed research
Genome Biology 2006, Volume 7, Issue 11, Article 120 Hart et al. 120.7
Genome Biology 2006, 7:120
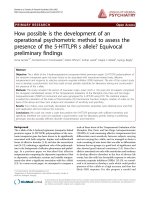
Figure 4
Comparison of the degree of completion of the yeast and human protein-
interaction networks. Neither (a) the yeast nor (b) the human protein-
interaction network is near completion as judged by the extent of assay
saturation for the studies indicated here, although the yeast network
shows higher saturation. With repeating assays on a finite set of
interactions, we expect the rate of discovery of new interactions (gray
line) to fall below 100% (black diagonal line) and asymptotically to
approach the false-positive discovery rate. If false-positive rates are
properly controlled, the rate of new interactions should level out,
indicating the complete network assayable by these methods. In yeast, the
most recent mass spectrometry study of Krogan et al. [28] (core set)
shows 66% new interactions, suggesting initial saturation. Human protein
interactions are under-sampled; the most recent study, Rual et al. [14],
assayed 95% new interactions.
Krogan
[28]
Gavin [27]
Jansen [22]
Ho [17]
Gavin [16]
Ito [36]
Uetz [35]
Lehner [40]
Stelzl [15]
Rhodes [23]
Rual [14]
Literature
Literature
8,0000
70,000
60,000
50,000
40,000
30,000
20,000
10,000
0
Cumulative unique yeast interactionsCumulative unique human interactions
0
0
25,000
50,000
75,000
100,000
125,000
10,000
20,000
30,000
40,000
50,000
60,000
70,000
80,000
Cumulative yeast interactions assayed
Cumulative human interactions assayed
125,000
100,000
75,000
50,000
25,000
0
(a) Ye a s t
(b) Human
This last problem has made it clear that many alternative
approaches will be required to complete the network. Com-
paring results from different approaches will continue to be
crucial for validating interactions and estimating error rates,
as the biases of one technique are easily overcome by
integrating interactions from other methods. To this end, we
strongly encourage all participants in interactome mapping
to make public their raw data as well as their analyzed and
filtered high-confidence interactions, as weak signals
detected across multiple assays can be integrated to help
distinguish real from spurious interactions. To further this
discussion, many of the primary groups mapping the human
protein interaction network met last August at the Joint Cold
Spring Habor/Wellcome Trust Conference on Interactome
Networks in Hinxton, UK, to compare results and coordinate
efforts and announced plans to meet again next August. This
effort may yet coalesce into a collaborative consortium like
the human genome sequencing consortium, and an open
forum now exists as the mapping proceeds.
Additional data files
Additional data on the statistics used are available online as
Additional data file 1.
References
1. Bandyopadhyay S, Sharan R, Ideker T: Systematic identification
of functional orthologs based on protein network compari-
son. Genome Res 2006, 16:428-435.
2. Reguly T, Breitkreutz A, Boucher L, Breitkreutz BJ, Hon GC, Myers
CL, Parsons A, Friesen H, Oughtred R, Tong A, et al.: Comprehen-
sive curation and analysis of global interaction networks in
Saccharomyces cerevisiae. J Biol 2006, 5:11.
3. Almaas E, Kovacs B, Vicsek T, Oltvai ZN, Barabasi AL: Global orga-
nization of metabolic fluxes in the bacterium Escherichia
coli. Nature 2004, 427:839-843.
4. Herrgard MJ, Lee BS, Portnoy V, Palsson BO: Integrated analysis
of regulatory and metabolic networks reveals novel regula-
tory mechanisms in Saccharomyces cerevisiae. Genome Res
2006, 16:627-635.
5. Kharchenko P, Church GM, Vitkup D: Expression dynamics of a
cellular metabolic network. Mol Syst Biol 2005, doi:10.1038/-
msb4100023.
6. Maciag K, Altschuler SJ, Slack MD, Krogan NJ, Emili A, Greenblatt JF,
Maniatis T, Wu LF: Systems-level analyses identify extensive
coupling among gene expression machines. Mol Syst Biol 2006,
doi:10.1038/msb4100045.
7. Guido NJ, Wang X, Adalsteinsson D, McMillen D, Hasty J, Cantor
CR, Elston TC, Collins JJ: A bottom-up approach to gene regu-
lation. Nature 2006, 439:856-860.
8. Jeong H, Mason SP, Barabasi AL, Oltvai ZN: Lethality and central-
ity in protein networks. Nature 2001, 411:41-42.
9. Gandhi TK, Zhong J, Mathivanan S, Karthick L, Chandrika KN,
Mohan SS, Sharma S, Pinkert S, Nagaraju S, Periaswamy B, et al.:
Analysis of the human protein interactome and comparison
with yeast, worm and fly interaction datasets. Nat Genet 2006,
38:285-293.
10. Coulomb S, Bauer M, Bernard D, Marsolier-Kergoat MC: Gene
essentiality and the topology of protein interaction net-
works. Proc Biol Sci 2005, 272:1721-1725.
11. Weber JL, Myers EW: Human whole-genome shotgun
sequencing. Genome Res 1997, 7:401-409.
12. Fields S, Song O: A novel genetic system to detect protein-
protein interactions. Nature 1989, 340:245-246.
13. Golemis EA, Brent R: Fused protein domains inhibit DNA
binding by LexA. Mol Cell Biol 1992, 12:3006-3014.
14. Rual JF, Venkatesan K, Hao T, Hirozane-Kishikawa T, Dricot A, Li N,
Berriz GF, Gibbons FD, Dreze M, Ayivi-Guedehoussou N, et al.:
Towards a proteome-scale map of the human protein-
protein interaction network. Nature 2005, 437:1173-1178.
15. Stelzl U, Worm U, Lalowski M, Haenig C, Brembeck FH, Goehler H,
Stroedicke M, Zenkner M, Schoenherr A, Koeppen S, et al.: A
human protein-protein interaction network: a resource for
annotating the proteome. Cell 2005, 122:957-968.
16. Gavin AC, Bosche M, Krause R, Grandi P, Marzioch M, Bauer A,
Schultz J, Rick JM, Michon AM, Cruciat CM, et al.: Functional orga-
nization of the yeast proteome by systematic analysis of
protein complexes. Nature 2002, 415:141-147.
17. Ho Y, Gruhler A, Heilbut A, Bader GD, Moore L, Adams SL, Millar
A, Taylor P, Bennett K, Boutilier K, et al.: Systematic identifica-
tion of protein complexes in Saccharomyces cerevisiae by
mass spectrometry. Nature 2002, 415:180-183.
18. Butland G, Peregrin-Alvarez JM, Li J, Yang W, Yang X, Canadien V,
Starostine A, Richards D, Beattie B, Krogan N, et al.: Interaction
network containing conserved and essential protein com-
plexes in Escherichia coli. Nature 2005, 433:531-537.
19. Rigaut G, Shevchenko A, Rutz B, Wilm M, Mann M, Seraphin B: A
generic protein purification method for protein complex
characterization and proteome exploration. Nat Biotechnol
1999, 17:1030-1032.
20. von Mering C, Krause R, Snel B, Cornell M, Oliver SG, Fields S, Bork
P: Comparative assessment of large-scale data sets of
protein-protein interactions. Nature 2002, 417:399-403.
21. Bouwmeester T, Bauch A, Ruffner H, Angrand PO, Bergamini G,
Croughton K, Cruciat C, Eberhard D, Gagneur J, Ghidelli S, et al.: A
physical and functional map of the human TNF-alpha/NF-
kappa B signal transduction pathway. Nat Cell Biol 2004, 6:97-105.
22. Jansen R, Yu H, Greenbaum D, Kluger Y, Krogan NJ, Chung S, Emili
A, Snyder M, Greenblatt JF, Gerstein M: A Bayesian networks
approach for predicting protein-protein interactions from
genomic data. Science 2003, 302:449-453.
23. Rhodes DR, Tomlins SA, Varambally S, Mahavisno V, Barrette T,
Kalyana-Sundaram S, Ghosh D, Pandey A, Chinnaiyan AM: Proba-
bilistic model of the human protein-protein interaction
network. Nat Biotechnol 2005, 23:951-959.
24. Lee I, Date SV, Adai AT, Marcotte EM: A probabilistic functional
network of yeast genes. Science 2004, 306:1555-1558.
25. Mellor JC, Yanai I, Clodfelter KH, Mintseris J, DeLisi C: Predic-
tome: a database of putative functional links between pro-
teins. Nucleic Acids Res 2002, 30:306-309.
26. Fraser AG, Marcotte EM: A probabilistic view of gene function.
Nat Genet 2004, 36:559-564.
27. Gavin AC, Aloy P, Grandi P, Krause R, Boesche M, Marzioch M, Rau
C, Jensen LJ, Bastuck S, Dumpelfeld B, et al.: Proteome survey
reveals modularity of the yeast cell machinery. Nature 2006,
440:631-636.
28. Krogan NJ, Cagney G, Yu H, Zhong G, Guo X, Ignatchenko A, Li J,
Pu S, Datta N, Tikuisis AP, et al.: Global landscape of protein
complexes in the yeast Saccharomyces cerevisiae. Nature 2006,
440:637-643.
29. Bader GD, Hogue CW: Analyzing yeast protein-protein inter-
action data obtained from different sources. Nat Biotechnol
2002, 20:991-997.
30. Seber GAF: The Estimation of Animal Abundance and Related Parame-
ters. 2nd edition. Caldwell, NJ: Blackburn Press; 1982.
31. Grigoriev A: On the number of protein-protein interactions
in the yeast proteome. Nucleic Acids Res 2003, 31:4157-4161.
32. D’haeseleer P, Church GM: Estimating and improving protein
interaction error rates. In Proc IEEE Comput Syst Bioinform Conf:
August 16-19 2004; California.Edited by IEEE Computer Society;
2004:216-223.
33. Guldener U, Munsterkotter M, Oesterheld M, Pagel P, Ruepp A,
Mewes HW, Stumpflen V: MPact: the MIPS protein interaction
resource on yeast. Nucleic Acids Res 2006, 34(Database
issue):D436-D441.
34. Goll J, Uetz P: The elusive yeast interactome. Genome Biol 2006,
7:223.
35. Uetz P, Giot L, Cagney G, Mansfield TA, Judson RS, Knight JR, Lock-
shon D, Narayan V, Srinivasan M, Pochart P, et al.: A comprehen-
sive analysis of protein-protein interactions in
Saccharomyces cerevisiae. Nature 2000, 403:623-627.
120.8 Genome Biology 2006, Volume 7, Issue 11, Article 120 Hart et al. />Genome Biology 2006, 7:120
36. Ito T, Chiba T, Ozawa R, Yoshida M, Hattori M, Sakaki Y: A com-
prehensive two-hybrid analysis to explore the yeast protein
interactome. Proc Natl Acad Sci USA 2001, 98:4569-4574.
37. Sprinzak E, Sattath S, Margalit H: How reliable are experimental
protein-protein interaction data? J Mol Biol 2003, 327:919-923.
38. Tucker CL, Gera JF, Uetz P: Towards an understanding of
complex protein networks. Trends Cell Biol 2001, 11:102-106.
39. Legrain P, Wojcik J, Gauthier JM: Protein-protein interaction
maps: a lead towards cellular functions. Trends Genet 2001,
17:346-352.
40. Lehner B, Fraser AG: A first-draft human protein-interaction
map. Genome Biol 2004, 5:R63.
41. Bader JS, Chaudhuri A, Rothberg JM, Chant J: Gaining confidence
in high-throughput protein interaction networks. Nat Biotech-
nol 2004, 22:78-85.
42. Deane CM, Salwinski L, Xenarios I, Eisenberg D: Protein interac-
tions: two methods for assessment of the reliability of high
throughput observations. Mol Cell Proteomics 2002, 1:349-356.
43. Lee I, Narayanaswamy R, Marcotte EM: Bioinformatic prediction
of yeast gene function. In Yeast Gene Analysis. Edited by Stansfield
I, Stark M. Amsterdam: Elsevier Press; 2007. Preprint at
/>44. Mrowka R, Patzak A, Herzel H: Is there a bias in proteome
research? Genome Res 2001, 11:1971-1973.
45. Patil A, Nakamura H: Filtering high-throughput protein-
protein interaction data using a combination of genomic
features. BMC Bioinformatics 2005, 6:100.
46. Giot L, Bader JS, Brouwer C, Chaudhuri A, Kuang B, Li Y, Hao YL,
Ooi CE, Godwin B, Vitols E, et al.: A protein interaction map of
Drosophila melanogaster. Science 2003, 302:1727-1736.
47. Samanta MP, Liang S: Predicting protein functions from redun-
dancies in large-scale protein interaction networks. Proc Natl
Acad Sci USA 2003, 100:12579-12583.
48. Schlitt T, Palin K, Rung J, Dietmann S, Lappe M, Ukkonen E, Brazma
A: From gene networks to gene function. Genome Res 2003,
13:2568-2576.
49. Ramani AK, Bunescu RC, Mooney RJ, Marcotte EM: Consolidating
the set of known human protein-protein interactions in
preparation for large-scale mapping of the human interac-
tome. Genome Biol 2005, 6:R40.
50. Eppig JT, Bult CJ, Kadin JA, Richardson JE, Blake JA, Anagnostopoulos
A, Baldarelli RM, Baya M, Beal JS, Bello SM, et al.: The Mouse
Genome Database (MGD): from genes to mice-a commu-
nity resource for mouse biology. Nucleic Acids Res 2005,
33(Database issue):D471-D475.
51. Harborth J, Elbashir SM, Bechert K, Tuschl T, Weber K: Identifica-
tion of essential genes in cultured mammalian cells using
small interfering RNAs. J Cell Sci 2001, 114:4557-4565.
52. Kittler R, Putz G, Pelletier L, Poser I, Heninger AK, Drechsel D,
Fischer S, Konstantinova I, Habermann B, Grabner H, et al.: An
endoribonuclease-prepared siRNA screen in human cells
identifies genes essential for cell division. Nature 2004,
432:1036-1040.
53. Amsterdam A, Nissen RM, Sun Z, Swindell EC, Farrington S, Hopkins
N: Identification of 315 genes essential for early zebrafish
development. Proc Natl Acad Sci USA 2004, 101:12792-12797.
54. Mishra GR, Suresh M, Kumaran K, Kannabiran N, Suresh S, Bala P,
Shivakumar K, Anuradha N, Reddy R, Raghavan TM, et al.: Human
protein reference database - 2006 update. Nucleic Acids Res
2006, 34(Database issue):D411-D414.
55. Alfarano C, Andrade CE, Anthony K, Bahroos N, Bajec M, Bantoft K,
Betel D, Bobechko B, Boutilier K, Burgess E, et al.: The Biomolec-
ular Interaction Network Database and related tools 2005
update. Nucleic Acids Res 2005, 33(Database issue):D418-D424.
56. Joshi-Tope G, Gillespie M, Vastrik I, D’Eustachio P, Schmidt E, de
Bono B, Jassal B, Gopinath GR, Wu GR, Matthews L, et al.: Reac-
tome: a knowledgebase of biological pathways. Nucleic Acids
Res 2005, 33(Database issue):D428-D432.
comment
reviews
reports
deposited research
interactions
information
refereed research
Genome Biology 2006, Volume 7, Issue 11, Article 120 Hart et al. 120.9
Genome Biology 2006, 7:120