Báo cáo y học: " Identification of novel regulatory modules in dicotyledonous plants using expression data and comparative genomics" potx
Bạn đang xem bản rút gọn của tài liệu. Xem và tải ngay bản đầy đủ của tài liệu tại đây (573.83 KB, 15 trang )
Open Access
Volume
et al.
Vandepoele
2006 7, Issue 11, Article R103
Research
Klaas Vandepoele, Tineke Casneuf and Yves Van de Peer
comment
Identification of novel regulatory modules in dicotyledonous plants
using expression data and comparative genomics
Address: Department of Plant Systems Biology, Flanders Interuniversity Institute for Biotechnology (VIB), Ghent University, Technologiepark,
B-9052 Ghent, Belgium.
Correspondence: Yves Van de Peer. Email:
Genome Biology 2006, 7:R103 (doi:10.1186/gb-2006-7-11-r103)
Received: 14 June 2006
Revised: 15 September 2006
Accepted: 7 November 2006
reviews
Published: 7 November 2006
The electronic version of this article is the complete one and can be
found online at />
reports
© 2006 Vandepoele et al.; licensee BioMed Central Ltd.
This is an open access article distributed under the terms of the Creative Commons Attribution License ( which
permits unrestricted use, distribution, and reproduction in any medium, provided the original work is properly cited.
transcription factor binding sites and 139overrepresentation in co-regulated genes with comparative footprinting is applied to identify 80
A strategy combining classical
Regulatory modules in dicot plantsmotif regulatory modules in Arabidopsis thaliana.
Abstract
Background
ing sites (TFBSs; or DNA sequence motifs, or motifs for short)
are the functional elements that determine the timing and
location of transcriptional activity. In plants and other higher
eukaryotes, these elements are primarily located in the long
non-coding sequences upstream of a gene, although functional elements in introns and untranslated regions have
been described as well [3,4]. Moreover, regulatory motifs
organize into separable cis-regulatory modules (CRMs;
Genome Biology 2006, 7:R103
information
Regulation of gene expression plays an important role in a
variety of biological processes such as development and
responses to environmental stimuli. In plants, transcriptional
regulation is mediated by a large number (>1,500) of transcription factors (TFs) controlling the expression of tens or
hundreds of target genes in various, sometimes intertwined,
signal transduction cascades [1,2]. Transcription factor bind-
interactions
Conclusion: These results create a starting point to unravel regulatory networks in plants and to
study the regulation of biological processes from a systems biology point of view.
refereed research
Results: Here, we applied a detection strategy that combines features of classic motif
overrepresentation approaches in co-regulated genes with general comparative footprinting
principles for the identification of biologically relevant regulatory elements and modules in
Arabidopsis thaliana, a model system for plant biology. In total, we identified 80 TFBSs and 139
regulatory modules, most of which are novel, and primarily consist of two or three regulatory
elements that could be linked to different important biological processes, such as protein
biosynthesis, cell cycle control, photosynthesis and embryonic development. Moreover, studying
the physical properties of some specific regulatory modules revealed that Arabidopsis promoters
have a compact nature, with cooperative TFBSs located in close proximity of each other.
deposited research
Background: Transcriptional regulation plays an important role in the control of many biological
processes. Transcription factor binding sites (TFBSs) are the functional elements that determine
transcriptional activity and are organized into separable cis-regulatory modules, each defining the
cooperation of several transcription factors required for a specific spatio-temporal expression
pattern. Consequently, the discovery of novel TFBSs in promoter sequences is an important step
to improve our understanding of gene regulation.
R103.2 Genome Biology 2006,
Volume 7, Issue 11, Article R103
Vandepoele et al.
modules for sort), each defining the cooperation of several
TFs required for a specific spatio-temporal expression pattern (for a review, see [5]). As a consequence of this complex
organization, understanding the combinatorial nature of
transcriptional regulation at a genomic scale is a major challenge, as the number of possible combinations between TFs
and targets is enormous. On top of this, it is important to realize that not all motifs present in a promoter are functional elements or simultaneously active, since the cooperation
between TFs is context dependent [6]. In the absence of
already characterized TFBSs or systematic genome-wide
location (that is, chromatin immunoprecipitation-chip) data
revealing interactions between TFs and target genes,
sequence and expression data are the only sources of information that can be combined to identify CRMs [7-9].
The discovery of regulatory motifs and their organization in
promoter sequences is an important first step to improve our
understanding of gene expression and regulation. Since coexpressed genes are likely to be regulated by the same TF, the
identification of shared and thus overrepresented motifs in
sets of potentially co-regulated genes provides a practical
solution to discover new TFBSs. Complementarily, the identification of significantly conserved short sequences (or footprints) in the promoters of orthologous genes in related
species points to candidate regulatory motifs for a particular
gene [10]. In yeasts and animals both overrepresentation of
motifs in co-regulated genes and comparison of orthologous
sequences have been successfully applied to delineate regulatory elements (for an overview, see [11,12]); in plants, however, mainly analyses on co-regulated genes for particular
biological processes (for example, stress, hormone and lightresponse, cell cycle control) have been reported [2].
Two problems interfering with comparative approaches for
the detection of regulatory motifs in orthologous plant
sequences are the limited amount of genomic sequence information for related species (but see [13]) and the high frequency of both small- and large-scale duplication events that
hamper the delineation of correct orthologous relationships
[14,15]. Finally, the correct identification of functional TFBS
is more complex in higher eukaryotes compared to prokaryotes or yeast because of the longer intergenic sequences. Consequently, characterizing properties of regulatory elements
and modules is not trivial due to the inclusion of large
amounts of false positives in sets of putative target genes. To
overcome these problems, several approaches integrate local
sequence conservation between orthologous upstream
regions to exclude non-conserved regions from the search
space and to make more accurate predictions about the presence of regulatory signals [16-21]. Nevertheless, this methodology requires that genomic data from closely related species
are available and that correct (one-to-one) orthologous relationships can be identified for nearly all genes.
/>
Here, we present a detection strategy that integrates features
of classic approaches looking for overrepresented motifs with
general comparative footprinting principles for the systematic characterization of biologically relevant TFBSs and CRMs
in Arabidopsis thaliana, a dicotyledonous plant model system. In a first stage, a classic Gibbs-sampling approach is
used to identify TFBSs in sets of co-expressed genes. Next,
these TFBSs are presented to an evolutionary filter to select
functional regulatory elements based on the global conservation of TFBSs in target genes in a related species, Populus trichocarpa (poplar). In a second stage, a two-way clustering
procedure combining the presence/absence of motifs and
expression data is used to identify additional new TFBSs. The
Gene Ontology (GO) vocabulary combined with the original
expression data is used to functionally annotate sets of genes
containing a particular regulatory element or module. As a
result, 80 TFBSs are reported, of which more than half correspond with previously described plant cis-regulatory elements. More interesting, we were able to identify numerous
regulatory modules driving different biological processes,
such as protein biosynthesis, cell cycle, photosynthesis and
embryonic development. Finally, the physical properties of
some modules are characterized in more detail.
Results and discussion
General overview
The input data for our analysis were genome-wide expression
data and the genome sequence from Arabidopsis, plus
genomic sequence data from a related dicotyledon, poplar
[22]. Whereas the expression data are required for creating
sets of co-regulated genes that serve as input for the detection
of TFBSs using MotifSampler (see Materials and methods),
the genomic sequences are used to delineate orthologous
gene pairs between Arabidopsis and poplar, forming the basis
for the evolutionary conservation filter. This filter is used to
discriminate between potentially functional and false motifs
and is based on the network-level conservation principle,
which applies a systems-level constraint to identify functional
TFBSs [23,24]. Briefly, this method exploits the well-established notion that each TF regulates the expression of many
genes in the genome, and that the conservation of global gene
expression between two related species requires that most of
these targets maintain their regulation. In practice, this
assumption is tested for each candidate motif by determining
its presence in the upstream regions of two related species
and by calculating the significance of conservation over
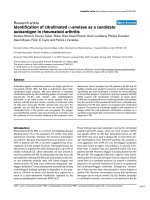
orthologous genes (see Materials and methods; Figure 1a).
Whereas the same principle of evolutionary conservation is
also applied in phylogenetic footprinting methods to identify
TFBSs, it is important to note that, here, the conservation of
several targets in the regulatory network is evaluated simultaneously. This is in contrast with standard footprinting
approaches, which only use sequence conservation in
upstream regions on a gene-by-gene basis to detect functional
DNA motifs.
Genome Biology 2006, 7:R103
/>
Genome Biology 2006,
(a)
Volume 7, Issue 11, Article R103
Vandepoele et al. R103.3
comment
3,167 orthologous
Arabidopsis-poplar pairs
378
77
296
-log(p)=27.3
random TFBS
AnAsGrTA
218
12
190
-log(p)=0.2
reviews
real TFBS
nTTCCCGC
Poplar
Arabidopsis
(b)
160
140
15
14
13
reports
random
phaseI (34TFBS)
phaseII (46TFBS)
12
120
11
10
TELOBOXATEEF1AA1
NT_E2Fa
UP1ATMSD
AT_G-box
BJ_CAAT-box
80
60
CR_MSA-like
9
8
7
6
5
4
40
deposited research
100
3
1
0
0
0.2
1.2
2.2
3.2
4.2
5.2
6.2
7.2
8.2
9.2
10.2
11.2
12.2
13.2
14.2
15.2
Network-level Conservation Score
sion profiles, additional TFBSs may exist that explain the
apparent discrepancy between motif content and expression
profile.
Whereas the procedure for detecting TFBS in co-expressed
genes combined with the evolutionary filter is highly similar
to the methodology described by Pritsker and co-workers
[23], the second stage of TFBS detection using the two-way
clustering procedure is, to our knowledge, novel. The
Genome Biology 2006, 7:R103
information
After applying motif detection on a set of co-expressed Arabidopsis genes in a first stage, all TFBSs retained by the network-level conservation filter are subsequently combined
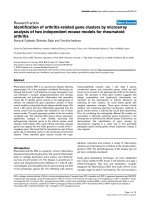
with the original expression data to identify CRMs and additional regulatory elements ('two-way clustering'; Figure 2).
Both objectives were combined because it has been demonstrated that the task of module discovery and motif estimation is tightly coupled [25]. We reasoned that, for a group of
genes with similar motif content but with dissimilar expres-
interactions
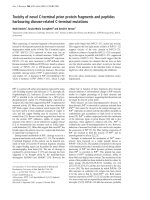
Figure 1
Network-level conservation filter
Network-level conservation filter. (a) The occurrence of a candidate TFBS in the set of orthologous Arabidopsis-poplar gene pairs was determined and the
significance of the overlap is measured using the hypergeometric distribution [24]. The NCS is defined as the negative logarithm of the hypergeometric p
value. (b) Distribution of NCS values for 1,000 randomly generated TFBSs (grey) and the motifs found using the co-expression (black) and the two-way
clustering (white) procedure. The left and right y-axis show the frequency for the random and the potentially functional TFBSs, respectively.
refereed research
2
20
R103.4 Genome Biology 2006,
Volume 7, Issue 11, Article R103
Vandepoele et al.
C
CG
TTA G
CCCT A
AG
/>
T
G
AC
Set of 34 TFBS identified
using co-expressed genes
Arabidopsis promoter
sequences
Genome-wide TFBS mapping
+
TFBS-based gene clustering
Module M713:
ST_G-box yyACrCGT
AT_G-box kCCACGTn
Genes
Genome-wide
expression data
Expression-based c lustering
on genes with similar
TFBS content
573 genes
Clusters of genes with similar
TFBS content (module)
1:n
Experiments
39 genes
33 genes
Clusters of genes
with similar TFBS content
& expression
22 genes
Experiments
TFBS detection (MotifSampler)
+
Network-level Conservation
filtering
new/updated set of TFBS
Figure 2 (see legend on next page)
Genome Biology 2006, 7:R103
HA_HSE2
/>
Genome Biology 2006,
Volume 7, Issue 11, Article R103
Vandepoele et al. R103.5
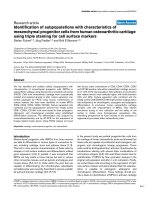
Figure 2 of previous page)
Detection(seeTFBSs using two-way clustering
Detection of TFBSs using two-way clustering. Starting from the available set of 34 TFBSs identified using sets of co-expressed genes (see text for details),
clusters of genes with similar TFBS combinations in their promoter are delineated. Next, within each set of genes with similar TFBS content, groups of coexpressed genes are identified. Finally, motif detection is applied and evolutionarily conserved TFBSs are retained. The panel on the right shows the
identification of the TFBS HA_HSE2 involved in zygotic embryogenesis. The top picture depicts a subset of all 573 Arabidopsis genes containing the module
consisting of two distinct G-boxes. The two images below show the three groups of co-expressed genes and the newly identified TFBSs found in a set of
22 genes containing both G-boxes in their promoter and showing embryo-specific expression. Note that the section indicated with the dotted line
corresponds with the motif-detection approach applied on co-expressed genes in the first stage.
comment
inference of regulatory modules is related to the work of Kreiman [18], although, in the current study, no a priori physical
constraints were used to exhaustively search for CRMs.
reviews
Identification of individual TFBSs using co-expressed
genes
interactions
information
Genome Biology 2006, 7:R103
refereed research
After running MotifSampler and the network-level conservation filter on all regulons, 46 new TFBSs were found (Additional data file 6). Again, the high fraction (25/46, or 54%) of
TFBSs with similarity to previously described ones indicates
deposited research
The telo-box (TELOBOXATEEF1AA1) is the TFBS with the
highest NCS value (40.06), indicating that this motif is highly
conserved in orthologous target genes between Arabidopsis
and poplar. The GO annotation reveals that this motif is
highly enriched in the promoter of genes involved in ribosome biogenesis and assembly (p value < 10-12; 4.4-fold
enrichment), confirming the role of the telo-box in regulating
components of the translational machinery [28]. Other
motifs with high NCS values together with their functional
annotation correspond to well-described plant TFBSs, such
as the E2F box and the MSA element involved in DNA replication and microtubule motor activity during the cell cycle
[29], the UP1 box mediating the transcription of protein synthesis [30], and the G box inducing the transcription of
photosynthesis genes in response to light [31]. The observation that 71% of these motifs are located within the first 500
base-pairs (bp) upstream of the translation start site (Additional data file 1) for conserved orthologous Arabidopsis-poplar targets confirms previous findings that Arabidopsis
promoters are generally compact [32,33].
Although the motif detection approach using co-expressed
genes revealed a first set of TFBSs, it is clear that expression
data alone are insufficient to unravel the complex nature of
transcriptional regulation in higher plants. Therefore, we
applied a two-way clustering procedure combining motif and
expression data to identify additional regulatory elements.
We again used MotifSampler combined with the networklevel conservation filter to identify potential TFBSs in clusters
of co-expressed genes, but now also incorporated the prior
knowledge about the presence of particular TFBSs in a gene's
promoter. Thus, first all genes with a particular motif combination (module) in the Arabidopsis genome were identified
after which the expression profiles of these genes were used to
delineate subgroups of co-expressed genes, which were then
again presented to the motif detection routine (MotifSampler
and network-level conservation filter; Figure 2). The rationale behind this approach is that additional TFBSs may exist
that explain the different expression patterns within the set of
genes containing the same module. As shown below, these
new motifs can be missed in the first detection stage on coexpressed genes since the fraction of genes containing this
TFBS within the set of co-expressed genes is too small for reliable detection by MotifSampler. By evaluating all possible
combinations (from two up to four motifs) using all 34 initial
TFBSs, we found 1,249 modules containing more than 40
genes. Next, we determined groups of co-expressed genes for
each set of genes characterized by a specific module using the
CAST algorithm (as described before). In total, 695 regulons,
containing genes with a particular module and similar
expression profiles, were found, covering 4,100 Arabidopsis
genes. Note that the way of grouping genes with identical
modules is compatible with the combinatorial nature of transcriptional control in higher eukaryotes, since the presence of
additional TFBSs in a gene's promoter does not interfere with
the gene clustering based on TFBS content (for example, gene
i with motifs A, B and C can theoretically occur in the clusters
containing module A-B, A-C, B-C and A-B-C; see Materials
and methods).
reports
Applying the Cluster Affinity Search Technique (CAST) algorithm to the data set measuring the expression of 19,173 Arabidopsis genes over 489 different experiments (1,168
Affymetrix ATH1 slides; see Additional data file 5) yielded 122
clusters of co-regulated genes covering 5,664 genes (see
Materials and methods). After running MotifSampler, applying the network-level conservation filter and removing
redundant motifs (see Materials and methods), 34 motifs
with a significant (p value < 0.01) Network-level Conservation score (NCS) were retained (Figure 1b). Interestingly, 25
of the identified TFBSs can be functionally annotated based
on overrepresented GO Biological Process or Molecular Function terms in the set of putative target genes (Table 1). Overall, nearly 60% (20/34) of all motifs correspond with known
plant regulatory elements. Throughout this paper, for motifs
corresponding with known regulatory elements described in
PLACE [26] and PlantCARE [27] the original name is used,
whereas for new elements the consensus motif will be used.
Combining motif and expression data to identify
additional TFBSs
R103.6 Genome Biology 2006,
Volume 7, Issue 11, Article R103
Vandepoele et al.
/>
Table 1
Overview of the TFBSs identified using co-expressed genes
TFBS motif*
NCS†
Known motif
Site‡
Functional enrichment targets: GO Biological
Process or Molecular Function§
nrCAAnTC (a)
5.77
BJ_CAAT-box
TGCAAATCT
GO:0008152 metabolism 8.58E-04 (1.2);
GO:0003824 catalytic activity 8.91E-05 (1.2)
GTACAwry (b)
5.64
TTCkwwTs
5.79
sGCrGAGA
5.77
kCCACGTn (4)
17.54
yCATTTnT (c)
8.7
GO:0007275 development 2.89E-02 (1.6);
GO:0003824 catalytic activity 2.98E-03 (1.2)
BOXIINTPATPB
ATAGAA
GO:0015980 energy derivation by oxidation of
organic compounds 4.82E-02 (2.7);
GO:0008152 metabolism 1.43E-03 (1.2);
GO:0003824 catalytic activity 2.89E-03 (1.1)
AT_G-box; HV_ABRE6; PH_boxII
GCCACGTGGA; GCCACGTACA; TCCACGTGGC
GO:0015979 photosynthesis 2.48E-04 (4.2);
GO:0048316 seed development 2.64E-03 (3.6);
GO:0009793 embryonic development (sensu
Magnoliophyta) 6.15E-03 (3.5)
GM_Unnamed_6
GCATTTTTATCA
GO:0003700 transcription factor activity 2.94E03 (1.3); GO:0030528 transcription regulator
activity 1.64E-02 (1.3); GO:0003677 DNA
binding 3.86E-02 (1.2)
ynTTATCC
6.75
SREATMSD; AT_I-box
TTATCC; CCTTATCCT
nGTTGACw (d)
5.31
ZM_O2-site
GTTGACGTGA
TTTGCnrA
6.13
rATyTGGG
9.35
GO:0016773 phosphotransferase activity,
alcohol group as acceptor 1.14E-02 (1.6);
GO:0016772 transferase activity, transferring
phosphorus-containing groups 2.60E-02 (1.5)
5.58
TrTwTATA
GO:0006952 defense response 2.99E-04 (1.9);
GO:0009607 response to biotic stimulus 3.56E04 (1.7); GO:0016301 kinase activity 7.52E-11
(1.7)
AT_TATA-box
TATATAA
GO:0019748 secondary metabolism 2.76E-02
(2.1); GO:0006519 amino acid and derivative
metabolism 1.35E-02 (1.8); GO:0003700
transcription factor activity 3.36E-02 (1.3)
ATArwACA (e)
5.79
OS_Unnamed_2
CCATGTCATATT
nTTCCCGC (5)
27.27
NT_E2Fa
TTTCCCGC
GO:0006261 DNA-dependent DNA
replication 6.48E-04 (6.2); GO:0000067 DNA
replication and chromosome cycle 1.06E-07
(5.5); GO:0006260 DNA replication 3.57E-05
(5.1)
TkAGAwnA
8.86
BO_TCA-element3
TCAGAAGAGG
GO:0006464 protein modification 4.52E-02
(1.7); GO:0003824 catalytic activity 5.20E-03
(1.1)
AAACCCTA
(13) (f)
40.06
TELOBOXATEEF1AA1
AAACCCTAA
Ribosome biogenesis and assembly 9.86E-13
(4.4); ribosome biogenesis 5.67E-12 (4.3); premRNA splicing factor activity 3.20E-04 (3.9)
mGnyAAAG (g)
6.38
GO:0003824 catalytic activity 2.93E-02 (1.1)
GAnCnkmG
6.29
GO:0003729 mRNA binding 1.00E-02 (3.1);
GO:0003735 structural constituent of
ribosome 3.69E-02 (1.7); GO:0006412 protein
biosynthesis 3.15E-03 (1.7)
TCnCTCTC
8.98
wmGTCmAm
7.16
ynCAACGG
8.39
nmGATyCr
5.66
LE_5UTRPy-richstretch
TTTCTCTCTCTCTC
GO:0003777 microtubule motor activity 9.90E03 (2.7); GO:0050789 regulation of biological
process 2.27E-03 (1.4); GO:0016772
transferase activity, transferring phosphoruscontaining groups 7.89E-03 (1.4)
CR_MSA-like
YCYAACGGYYA
GO:0003777 microtubule motor activity 3.17E03 (3.4); GO:0003774 motor activity 8.55E-03
(2.9)
GO:0003824 catalytic activity 4.51E-03 (1.1)
GO:0006944 membrane fusion 2.32E-02 (4.5);
GO:0003735 structural constituent of
ribosome 2.77E-03 (1.9); GO:0005198
structural molecule activity 7.11E-04 (1.9)
CGkCGmCn
7.68
OS_GC-motif5
CGGCGCCCT
AGGCCCAw
(9)
21.94
UP1ATMSD
GGCCCAWWW
AykyATwA
6.09
Genome Biology 2006, 7:R103
GO:0007046 ribosome biogenesis 3.56E-14
(4.3); GO:0042254 ribosome biogenesis and
assembly 2.28E-14 (4.3); GO:0003735
structural constituent of ribosome 8.66E-29
(3.3)
/>
Genome Biology 2006,
Volume 7, Issue 11, Article R103
Vandepoele et al. R103.7
Table 1 (Continued)
Overview of the TFBSs identified using co-expressed genes
6.91
GO:0016301 kinase activity 3.44E-02 (1.3);
GO:0003676 nucleic acid binding 3.48E-02
(1.2); GO:0005488 binding 2.60E-03 (1.2)
TsTCGnTT
7.22
TmAsTGAn
7.76
OS_GTCAdirectrepeat
TAAGTCATAACTGATGA
GO:0016491 oxidoreductase activity 3.85E-03
(1.5); GO:0008152 metabolism 5.74E-03 (1.2);
GO:0003824 catalytic activity 5.70E-04 (1.2)
yyACrCGT (2)
6.56
ST_G-box
TCACACGTGGC
comment
CTGnCTCy
GO:0009605 response to external stimulus
4.80E-02 (1.6); GO:0006950 response to stress
3.42E-02 (1.6)
GO:0003824 catalytic activity 5.10E-03 (1.1)
5.51
GM_Nodule-site1
GATATATTAATATTTTATTTTATA
5.78
CAATBOX1; HV_ATC-motif
CAAT; GCCAATCC
rkTCAwGm
5.42
ssCGCCnA (2)
9.13
E2F1OSPCNA
GCGGGAAA
TTTATGnG
GO:0003824 catalytic activity 6.17E-05 (1.2)
GO:0000067 DNA replication and
chromosome cycle 4.74E-02 (3.0);
GO:0006259 DNA metabolism 2.15E-03 (2.3);
GO:0007049 cell cycle 4.29E-02 (2.2)
7.1
TCAwATAA
GO:0008152 metabolism 2.01E-02 (1.2)
reviews
mATATTTT
CCAATnCm
6.74
Genome Biology 2006, 7:R103
information
Analyzing the topology of the motif synergy map reveals some
highly connected TFBSs (for example, UP1ATMSD,
TELOBOXATEEF1AA1,
sGCrGAGA,
BOXIINTPATPB,
AT_G-box kCCACGTn), which control, in cooperation with
other TFBSs, different biological processes. A set of modules
contain a G-box and confirm its role in controlling light-
interactions
To get a general overview of the involvement of all 80 TFBSs
(34 from co-expressed genes in the first stage plus 46 from
two-way clustering in the second stage) and the derived
CRMs in different biological processes, we identified all modules with two to four motifs (containing at least 20 Arabidopsis genes) and again used overrepresented GO terms for
functional annotation. Briefly, we selected all Arabidopsis
genes with a particular motif combination present in their
refereed research
Inferring functional regulatory modules
upstream regions and verified whether any GO Biological
Process term was significantly enriched within this set of
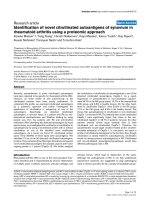
putative target genes. Figure 3 shows the motif synergy map
depicting the cooperation of different TFBSs for which the GO
enrichment score is stronger for the module than for the individual TFBS (within that module). Applying this criterion is
necessary to specifically identify the functional properties of
the module, because the GO enrichment for many modules is
caused by the presence of an individual TFBS and not by the
specific TFBS combination in the CRM. In total, 139 modules
with significant functional GO Biological Process enrichment
were identified, of which 97 consist of a combination of two
and 42 of three TFBSs (Additional data file 7). Moreover, 69
identified TFBSs in this study could be allocated to one or
more CRM with significant functional annotation. The module with the strongest GO enrichment in the synergy map consists of a telo-box and the UP1 motif and targets protein
biosynthesis (p value < 10-51) and ribosome biogenesis (p
value < 10-25) genes (for example, 40S and 60S ribosomal
proteins, translation initiator factors). In total, 851 Arabidopsis genes contain this module and the expression coherence
[9] of these genes (EC = 0.14; see Materials and methods)
illustrates that this module is responsible for similar expression profiles in a large number of these genes. Detailed information about target genes and functional annotation for the
different CRMs can be consulted on our website [35].
deposited research
that we most probably identified an extra set of genuine regulatory elements. As an illustration, we discuss the discovery
of the HA_HSE2 motif, which is an element inducing gene
expression during zygotic embryogenesis [34]. Initially, 573
Arabidopsis genes were grouped containing a combination of
two distinct G-boxes in their promoters (AT_G-box
kCCACGTn and ST_G-box yyACrCGT; Table 1). Subsequent
clustering of the expression profiles of these genes, enriched
for the GO terms embryonic development (sensu Magnoliophyta) and seed development (both with p value < 10-2; 7.4fold and 8.1-fold enrichment, respectively), yielded three regulons, of which one showed expression in seeds, a second one
expression in leaves and shoots, and a third one expression in
the globular and heart stage embryo. Running the motif
detection routine on the 22 genes in this last regulon resulted
in the discovery of the HA_HSE2 motif (NCS 7.91). This motif
was not identified in the first TFBS detection run using
expression data only, since the genes in this regulon were part
of a big set of 645 co-expressed genes not yielding any significant TFBSs. This finding confirms that splitting up coexpressed genes into smaller subsets based on prior knowledge of motif content can enhance the identification of new
TFBSs.
reports
*Numbers in parentheses indicate the number of clusters (containing co-expressed genes) in which the motif was independently identified. The
letters in parenthesis refer to the updated TFBS identified using the two-way clustering: (a) GCAAnTCn; (b) GTACmwGy; (c) yCATTTAT; (d)
mkTTGACT; (e) ATrrwACA; (f) AAACCCTA; (g) mGnCAAAG. †Network-level Conservation score. ‡Residues in bold indicate the matching
position between the known motif and the motif found in this study. Known motifs were retrieved from PLACE [26] and PlantCARE [27]. §Only the
first three GO categories according to the highest enrichment score are shown. The enrichment score is shown as number in parentheses.
R103.8 Genome Biology 2006,
Volume 7, Issue 11, Article R103
Vandepoele et al.
/>
GO:0019318 hexose metabolism
OS_Unnamed_2
sCCTyCm n
GO:0009793 embryonic development (sensu Magnoliophyta)
GO:0007049 cell cycle
GO:0040007 growth
GO:0009725 response to hormone stimulus
PC_P_box
GO:0006092 main pathways of carbohydrate metabolism
E2F1OSPCNA
NT_TC_richrepeat s3
GO:0009310 amine catabolism
GO:0000074 regulation of progression through cell cycle
OS_TGGCA
ST_4cl_CMA2a
GO:0006281 DNA repair
AykyATwA
GO:0007623 circadian rhythm
nykynCGT
GO:0008283 cell proliferation
NT_E2Fa
GO:0006511 ubiquitin-dependent protein catabolism
SA_chs_Unit1
BOXIINTPATPB
rATyTGGG
AS_RE1
GO:0042254 ribosome biogenesis and assembly
ST_G_box
BO_HSE3
AT_TATA_box
GO:0016192 vesicle-mediated transport
GO:0006944 membrane fusion
PC_4cl_CMA1b
TTTATGnG
GO:0006414 translational elongation
AT_I_box_lik e
mArTyGnr
mGnCAAAG
AT_G_box
rkTCAwGm
GO:0006073 glucan metabolism
SREATMSD
GO:0006638 neutral lipid metabolism
CAATBOX1
OS_AACA_motif
nmGATyCr
UP1ATMSD
GO:0009064 glutamine family amino acid metabolism
kCGAwTCn
OS_motifsI_IIa
GO:0006790 sulfur metabolism
LE_HSE2
GAAGAAAs
GO:0006396 RNA processing
OS_GC_motif5
GO:0015979 photosynthesis
kmTnTCGy
TwnCCGsG
GO:0019748 secondary metabolism
GO:0006261 DNA-dependent DNA replication
OS_GC_repeat 2
GO:0006412 protein biosynthesis
TyTAAAr k
GO:0042364 water-soluble vitamin biosynthesis
GO:0009908 flower development
ZM_O2-site
TA_rbcS_CMA6b
GO:0006886 intracellular protein transport
wmGTCmAm
GO:0006413 translational initiation
GAnCnkmG
TELOBOXATEEF1AA1
LE_5UTRPy_richstretc h
rGnCnyCT
GO:0005976 polysaccharide metabolism
GO:0000067 DNA replication and chromosome cycle
CGAsCnAn
sGCrGAGA
AS_PE3
GO:0006778 porphyrin metabolism
sTCTGCr m
wrrmGCGn
GO:0006323 DNA packaging
CGCnnnyC
AnCCnCkn
TA_sbp_CMA1c
GO:0006731 coenzyme and prosthetic group metabolism
OS_GTCAdirectrepeat
sCArwTTC
BO_TCA_element 3
GnCGrsTn
GO:0015031 protein transport
TsTCGnTT
ykyCGnnA
GO:0043037 translation
GTACmwGy
GM_Unnamed_ 6
OS_P_box
GO:0007028 cytoplasm organization and biogenesis
CTGnCTCy
GO:0006259 DNA metabolism
CR_MSA_lik e
GO:0006066 alcohol metabolism
GO:0030001 metal ion transport
OS_GC_motif
CkswGAss
GO:0009909 regulation of flower development
GO:0006096 glycolysis
GO:0006260 DNA replication
GO:0007046 ribosome biogenesis
GO:0046907 intracellular transport
Figure 3 (see legend on next page)
Genome Biology 2006, 7:R103
nAGAAGm C
/>
Genome Biology 2006,
Volume 7, Issue 11, Article R103
Vandepoele et al. R103.9
that these motif combinations are involved in (light-regulated) primary energy production.
The motif sGCrGAGA is involved in 26 different modules and
is, to our knowledge, a new TFBS. Whereas the full set of Arabidopsis genes containing this motif shows a functional
enrichment for 'energy derivation by oxidation of organic
refereed research
2.M1102 ribosome biogenesis
2.M3458 DNA replication and chromosome cycle
2.M4026 ribosome biogenesis
2.M547 DNA replication
2.M6069 photosynthesis
2.M6081 photosynthesis
2.M6086 embryonic development (sensu Magnoliophyta)
2.M6103 embryonic development (sensu Magnoliophyta)
2.M6107 photosynthesis
2.M6125 embryonic development (sensu Magnoliophyta)
2.M6144 photosynthesis
2.M6298 DNA replication
2.M6451 DNA-dependent DNA replication
2.M6460 DNA replication
2.M6470 DNA replication and chromosome cycle
2.M6502 DNA-dependent DNA replication
2.M6611 ribosome biogenesis
2.M6825 regulation of progression through cell cycle
2.M6881 ribosome biogenesis
2.M7000 DNA replication
2.M7003 ribosome biogenesis
2.M7007 ribosome biogenesis
2.M7008 ribosome biogenesis
2.M7009 ribosome biogenesis
2.M7010 ribosome biogenesis and assembly
2.M7014 ribosome biogenesis
2.M7023 ribosome biogenesis
2.M7032 ribosome biogenesis
2.M7044 ribosome biogenesis and assembly
2.M7051 ribosome biogenesis and assembly
2.M7196 ribosome biogenesis
2.M7541 ribosome biogenesis
2.M7595 ribosome biogenesis and assembly
2.M7700 ribosome biogenesis
2.M7801 DNA replication and chromosome cycle
2.M7850 ribosome biogenesis
2.M7898 ribosome biogenesis
2.M7945 ribosome biogenesis
2.M7991 translational initiation
2.M8039 ribosome biogenesis and assembly
2.M8040 ribosome biogenesis and assembly
2.M8058 ribosome biogenesis
2.M8059 ribosome biogenesis and assembly
2.M8060 translation
2.M8070 ribosome biogenesis and assembly
2.M8074 ribosome biogenesis and assembly
2.M8079 translation
2.M8081 translation
2.M973 protein biosynthesis
deposited research
interactions
7 very highly expressed during cell cycle progression (201)
18 widely expressed + very highly expressed during cell cycle progression (90)
36 very highly expressed during cell cycle progression (15)
51 constitutively expressed (54)
64 constitutively expressed (17)
3 widely expressed, not in roots, not stress-responsive (516)
9 expression in seeds w/o siliques, embryo and whole seedlings (278)
29 (153)
55 constitutively expressed (31)
34 highly expressed during cell cycle progression (33)
62 M-phase specific expression during cell cycle, expressed in shoot apex (43)
85 response to heat stress (46)
19 very highly expressed during cell cycle progression (52)
44 expression in shoot apex and during S-phase of cell cycle (20)
93 expressed during cell cycle progression (13)
p-value<10-4
reports
Three modules (2.M6086, 2.M6103 and 2.M6125) targeting
genes involved in embryonic development (>7-fold GO
enrichment; Additional data file 7) are strongly associated
with expression cluster 9, which shows high transcriptional
activity in seedlings and embryo (Figure 4). The presence of
these modules, all containing a G-box, in some well-described
embryogenesis genes within this expression cluster (for
example, late embryogenesis-abundant proteins, zinc-finger
protein PEI1 and NAM transcriptional regulators [37,38])
confirms our finding that these modules play an important
role in transcriptional control during embryo development.
reviews
dependent processes such as photosynthesis (module
2.M6107, AT_G-box kCCACGTn + I-box-like ATAATCCA;
module 2.M6144, AT_G-box kCCACGTn + OS_AACA_motif;
module 2.M6069, AT_G-box kCCACGTn + SREATMSD) and
embryonic development (module 2.M6103, AT_G-box
kCCACGTn + CGAsCnAn; module 2.M6125, AT_G-box
kCCACGTn + BO_HSE3 box). The cooperation between the
G-box and the I-box-like motif in the module with GO enrichment 'photosynthesis' targets genes coding for chlorophyll
binding proteins, different photosystem I reaction center subunits, photosystem II associated proteins, and ferredoxin.
The high expression of these genes in plant tissues exposed to
light suggests a function for this module as a composite lightresponsive unit [36]. Combining the clusters of co-expressed
genes used in the first detection stage with the targets of the
different modules (Figure 4) shows a highly significant overlap of expression cluster 3 with the photosynthesis modules
2.M6069, 2.M6144, 2.M6107 and 2.M6081 (AT_G-box
kCCACGTn + UP1 box). These strong associations indicate
comment
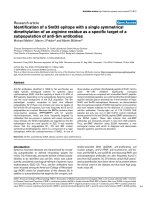
Motif synergy map for 139 modules with significant GO Biological Process annotation
Figure 3 (see previous page)
Motif synergy map for 139 modules with significant GO Biological Process annotation. The full and dotted lines connect motifs cooperating in modules
containing two and three TFBSs, respectively. Line colors indicate the GO Biological Process enrichment for Arabidopsis genes containing this module (see
also Additional data file 7).
p-value<10-20
Genome Biology 2006, 7:R103
information
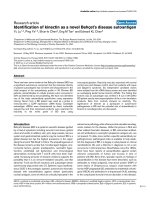
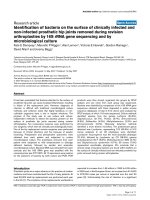
Figure 4
Correlation between cis-regulatory modules and clusters of co-expressed genes
Correlation between cis-regulatory modules and clusters of co-expressed genes. Rows depict co-expression clusters with their corresponding cluster
number and brief description, if available, whereas columns show modules with their corresponding GO descriptions. The number of genes within each
co-expression cluster is indicated in parentheses. Only expression clusters enriched for one (or more) modules are shown. Enrichment was calculated
using the hypergeometric distribution and p values were corrected for multiple hypotheses testing with the false discovery rate method (q-value) [76].
R103.10 Genome Biology 2006,
Volume 7, Issue 11, Article R103
Vandepoele et al.
compounds' (Table 1), more than a quarter of all modules (7/
26) containing this regulatory element seem to have a role in
transcriptional control of sugar, amino acid or alcohol metabolism. Examples of biosynthesis pathways mediated by these
modules according to the GO Biological Process annotation
include glycolysis, amine catabolism and branched chain
family amino acid metabolism (Additional data file 7).
Another module (2.M6825) controls the progression through
the cell cycle and consists of a combination of the known MSA
element together with the OS_GC motif. A large number of
genes associated with mitosis and cytokinesis, such as those
encoding B-type cyclins, kinesin motor proteins and microtubule and phragmoplast-associated proteins, contain this
CRM and are linked with expression cluster 62 (Figure 4).
Comparing the occurrence of this module in a set of approximately 1,000 periodically expressed genes determined in
Arabidopsis cell suspensions by Menges and co-workers [39]
confirms a strong enrichment towards M-phase specific
genes (hypergeometric probability distribution; p value < 1021). Nevertheless, because the frequency of the individual
MSA element is higher in the set of M-phase specific genes
compared to the occurrence of the module (87/198 MSA element and 40/198 module, respectively), this indicates that
the presence of the individual MSA box is sufficient for Mphase expression during cell division and that additional
cooperative elements only moderately mediate the level of
transcription, as recently shown [40]. Likewise, despite the
fact that several modules (for example, 2.M547, 2.M6460 and
2.M6451) consisting of the NT_E2Fa motif and one or more
cooperative TFBS are targeting genes involved in DNA replication (>10-fold enrichment) and are strongly associated
with expression cluster 44 (Figure 4) containing many DNA
replication genes (for example, DNA replication licensing factor, PCNA1-2), it is currently unclear whether additional
motifs, apart from one or more E2F elements, are essential
for transcriptional induction during S-phase in plants [33].
Another module driving endogenous light-regulated
response contains the ST_4cl-CMA2a and OS_TGGCA boxes
and targets genes involved in circadian rhythm (2.M8255,
'circadian rhythm' >24-fold enrichment). Examples of genes
containing this module are CONSTANS, a zinc finger protein
linking day length and flowering [41], as well as APRR5 and
APRR7, pseudo-response regulators subjected to a circadian
rhythm at the transcriptional level [42]. One of the TFBSs
within this module, motif OS_TGGCA with sequence [GT]C
[AT]A [AG]TGG, is highly similar to the SORLIP3 motif
(CTCAAGTGA; Pearson correlation coefficient (PCC) = 0.56
between linearized PWM and SORPLIP3), a sequence found
to be overrepresented in light-induced promoters [43].
Properties of cis-regulatory modules
Due to the frequent nature of large-scale duplication events in
plants, a one-to-one orthologous relationship with poplar
could be ensured for only a minority of Arabidopsis genes
/>
(17%). Therefore, applying across-species conservation on a
genome-wide scale to predict functional TFBSs, as done in
mammals and yeast, is not straightforward in plants. Similarly, studying cooperative TFBSs within regulatory modules
also suffers from the inclusion of potentially false-positives
when selecting genes in one species containing a putative
module. Therefore, we exploited the conservation of TFBSs
between Arabidopsis and poplar orthologs to study the
properties of some modules in more detail. Based on all 139
modules and the set of 3,167 (one-to-one) orthologous genes
between Arabidopsis and poplar, we only retained 30 modules with five or more conserved target genes for further
analysis. By applying this stringent filtering step of five or
more conserved orthologous targets, we wanted to study the
physical properties - motif order and spacing - of CRM in a set
of Arabidopsis target genes enriched for functional TFBSs
(and with a minimum number of false-positives; data not
shown). Since no a priori information about such properties
was included in the identification of TFBSs and CRMs, we
used this data set to verify whether such constraints exist and
are used by the transcriptional apparatus to control gene
expression in plants.
First, for each module the overrepresented motif order was
quantified in all conserved target genes (for example, 9/11 of
all conserved Arabidopsis target genes for module 2.M7010
contain pattern [TELOBOXATEEF1AA1 spacer UP1ATMSD
spacer start codon]). Grouping all these results indicates that,
on average, 68% (136/200) of all Arabidopsis targets contain
an overrepresented motif order (Additional data file 8). Nevertheless, the observation that, on average, approximately
64% of the orthologous poplar targets contain the same motif
order suggests that, although a preferred motif order might
be present for some modules (Additional data file 2), this configuration is evolutionarily rather weakly conserved. Measuring the distance between cooperative TFBSs reveals that, for
11/30 modules, the average distance is significantly smaller
than expected by chance (Additional data file 8). Moreover,
the overall distribution of distances between TFBSs measured
for all 200 targets within these 30 modules is, in both Arabidopsis and poplar, significantly different from a random distribution (Mann-Whitney U test p value < 0.001; Figure 5).
This indicates that, like in other eukaryotic species (for example, [18,44,45]), the distance between cooperative motifs
within a module is important for functionality.
Conclusion
The results of this study confirm that TFBS detection using
expression data within an evolutionary context offers a powerful approach to study transcriptional control [18,20,23].
Especially, the exploitation of sequence conservation between
related species offers a good control against false-positives
when performing motif detection on co-regulated genes [4649]. Using clusters of co-expressed genes, MotifSampler, twoway clustering and the network-level conservation principle,
Genome Biology 2006, 7:R103
/>
Genome Biology 2006,
100
35
Arabidopsis
90
Vandepoele et al. R103.11
100
Poplar
90
35
80
80
30
Frequency
25
70
60
20
50
15
40
70
25
60
20
50
40
15
30
10
comment
30
40
Volume 7, Issue 11, Article R103
30
10
20
20
0
25
50
7
10 5
120
155
170
205
220
255
270
305
320
355
370
405
420
455
470
505
520
555
570
605
620
655
670
705
720
755
770
805
820
855
870
905
920
955
970
5
0
5
10
0
0
reviews
10
25
50
75
10
0
12
5
15
0
17
5
20
0
22
5
25
0
27
5
30
0
32
5
35
0
37
5
40
0
42
5
45
0
47
5
50
0
52
5
55
0
57
5
60
0
62
5
65
0
67
5
70
0
72
5
75
0
77
5
80
0
82
5
85
0
87
5
90
0
5
Distance (bp)
Distance (bp)
Figure 5
Motif distance distributions for 30 conserved modules in orthologous target genes between Arabidopsis and poplar
Motif distance distributions for 30 conserved modules in orthologous target genes between Arabidopsis and poplar. For all modules, the distance (in bp)
between cooperative TFBS was measured in 200 conserved orthologous target genes and plotted in a histogram for Arabidopsis and poplar. The white
boxes denote the cumulative fraction.
To group genes with similar expression profiles, we used the
CAST algorithm with the PCC as affinity measure [56].
Advantages of CAST clustering over more classic algorithms
such as hierarchical or K-means clustering are that only two
parameters have to be specified (the affinity measure, here
defined as PCC ≥ 0.8, and the minimal number of genes
within a cluster, here set to 10) and that it independently
determines the total number of clusters and whether a gene
belongs to a cluster. We used an additional heuristic to choose
the gene with the maximum number of neighbors (that is, the
total number of genes having a similar expression profile) to
initiate a new cluster. An overview of the cluster stability
when randomly removing experiments from the complete
expression data set is given in Additional data file 3.
interactions
Detection of transcription factor binding sites
For each cluster S, grouping nS co-regulated genes returned
by the CAST algorithm, we used MotifSampler [57] to identify
an initial set of TFBSs. We restricted the search to the first
1,000 bp upstream of the translation start site. For some
genes the upstream sequence was shorter because the adjacent upstream gene is located within a distance smaller than
1,000 bp. The parameters used were 6th order background
model (computed from all Arabidopsis upstream sequences),
Genome Biology 2006, 7:R103
information
A total of 1,168 Affymetrix ATH1 microarrays monitoring the
transcriptional activity of more than 22,000 Arabidopsis
genes in different tissues and under different experimental
conditions were retrieved from the Nottingham Arabidopsis
Stock Centre (NASC [53]; 1,151 slides) and The Arabidopsis
Information Resource (TAIR [54]; 17 slides). An overview of
all data sets is shown in Additional data file 5. Raw data were
normalized using the MicroArray Suite 5.0 (MAS) implementation in Bioconductor ('mas5' function) [55]. To remove
potentially cross-hybridizing probes, only genes for which a
unique probe set is available on the ATH1 microarray (probe
sets with a '_at' extension without suffix) were retained. Next,
Clustering of expression data
refereed research
Expression data
deposited research
Materials and methods
the genes were filtered based on the detection call that is
assigned to each gene by the 'mas5calls' function implemented in Bioconductor. This software evaluates the abundance of each transcript and generates a detection p value
indicating whether a transcript is reliably detected (p value <
0.04 for present value). Only genes that were called present in
at least 2% of the experiments were retained for further analysis. Finally, the mean intensity value was calculated for the
replicated slides, resulting in 489 measurements for 19,173
genes in total.
reports
80 distinct TFBSs could be identified, of which 45 correspond
to known plant cis-regulatory elements. From these, 139 regulatory modules with biological functional annotation could
be inferred and several CRMs were highly associated with distinct expression patterns. Despite the limited amount of comparative sequence data for dicotyledonous plants, which
hinders the systematic identification of conserved and probably functional binding sites within a promoter, the regulatory
modules identified here suggest that, like in yeast and animals, combinatorial transcriptional control plays an important role in regulating transcriptional activity in plants. For
sure, the application of more advanced CRM detection methods (for example, [25,50,51]) integrating physical constraints
acting on CRMs (as shown here) on more detailed expression
data will lead to the discovery of additional plant CRMs.
Finally, the sequencing of additional and less diverged plant
species in the near future [52] should provide a more solid
comparative framework to study the organization and evolution of transcriptional regulation within the green plant
lineage.
R103.12 Genome Biology 2006,
Volume 7, Issue 11, Article R103
Vandepoele et al.
-n 2 (number of different motifs to search for), -r 100
(number of times the MotifSampler should be repeated) and
-w (length of the motif) set to 8nt. For each cluster, the 20
best and non-redundant motifs (represented as a position
weight matrix (PWM)) according to their log-likelihood score
were retained using MotifRanking (default parameters; shift
parameter -s set to 2).
To create a non-redundant set of all motifs found in the different clusters of co-expressed genes, we first compared the
similarity between two motifs as the PCC of their corresponding PWM. Each motif of length w was represented using a single vector, by concatenating the rows of its matrix (obtaining
a vector of length 4*w). Subsequently, the PCC between every
alignment of two motifs was calculated, as they are scanned
past each other, in both strands [18,58]. Then, all motifs with
a PCC >0.75 were considered as similar and only the motif
with the highest NCS (see below) was retained.
The presence of a motif (represented by its corresponding
PWM) in a DNA sequence was determined using MotifScanner, which uses a probabilistic sequence model (default
parameters; prior probability -p set to 0.1). Both MotifRanking and MotifScanner, together with MotifSampler, are part
of the INCLUSIVE package [59].
Clustering based on TFBS content
To group genes containing similar motifs in their promoter
and incorporating the possibility that not all motifs in a promoter are functional, we generated all groups of genes having
two or more motifs in common. Starting from the set of nonredundant motifs mapped on all promoters, all motif combinations from two to four motifs were generated and only clusters with at least 20 genes containing that combination were
retained. Note that, for a particular motif combination, the
presence of additional motifs in a gene's promoter was
ignored, resulting in the creation of overlapping clusters.
Network-level conservation score
We identified 3,167 orthologous Arabidopsis-poplar gene
pairs through phylogenetic tree construction (see below). Due
to the high frequency of gene duplication in both Arabidopsis
and poplar [60-62], we preferred to apply phylogenetic tree
construction to delineate orthologous relationships instead of
sequence similarity approaches based on reciprocal best hit
(for example, [24,63]). Whereas the latter only uses similarity
or identity scores to define putative orthology and is highly
sensitive to incomplete associations due to in-paralogs, tree
construction methods use an evolutionary model to estimate
evolutionary distances and give a significance estimate
through bootstrap sampling.
For each candidate TFBS and for all Arabidopsis-poplar
orthologs, we first identified the set of Arabidopsis genes that
have at least one occurrence matching the PWM in their
upstream regions. Then, we also identified the poplar genes
/>
that have at least one occurrence matching the PWM in their
upstream regions. Next, we calculated the overlap of matches
in orthologs between both sets of sequences. Note that the
matches can be anywhere in the upstream region and on any
strand. For both Arabidopsis and poplar, the search was
again restricted to the first 1,000 bp upstream from the translation start site or to a shorter region if the adjacent upstream
gene is located within a distance smaller than 1,000 bp. The
statistical significance of the overlap, which will be high for
PWM representing functional TFBSs according to the network-level conservation principle, is measured using the
hypergeometric distribution (for details, see [24]). Because
the NCS, which is defined as the negative logarithm of the
hypergeometric p value, is a relative measure of network-level
conservation, the observed scores are compared against a distribution of scores obtained from random motifs. Thousand
random motifs were generated by running the MotifSampler
on clusters containing randomly selected genes. All NCS values larger than 5.3, which correspond to the 99th percentile
of the random NCS distribution, were considered as
significant.
Orthology determination
The full proteomes (that is, all proteins in a genome) of Arabidopsis, poplar, rice, and Ostreococcus tauri, together with
proteins inferred from cDNA sequences for Pinus taeda,
Pinus pinaster and Physcomitrella patens were used to delineate gene families using protein clustering. First, an allagainst-all sequence comparison was performed using
BLASTP [64] and relevant hits were retained [65]. Briefly,
two proteins are considered homologous only when they
share a substantially conserved region on both molecules
with a minimum amount of sequence identity. In this manner, multi-domain proteins for which the sequence only partially overlaps because of shared single protein domains,
which occasionally leads to significant E-values in BLAST
searches, are not retained as homologs. The proportion of
identical amino acids in the aligned region between the query
and target sequence is recalculated to I' = I × Min(n1/L1, n2/
L2), where Li is the length of sequence i and ni is the number
of amino acids in the aligned region of sequence i. This value
I' is then used in the empirical formula for protein clustering
proposed by Rost [66]. Finally, all valid homologous protein
pairs are subject to a simple-linkage clustering routine to
delineate protein gene families. Arabidopsis and rice
sequences were downloaded from TIGR (releases 5.0 and 3.0,
respectively), Ostreococcus sequences from [67,68], poplar
sequences from the JGI consortium [69], and pine and moss
data from the Sequence platform for Phylogenetic analysis of
Plant Genes database (SPPG) [70]. The coding sequences for
Ostreococcus and poplar correspond to the genes predicted
by the EuGene gene prediction software [71].
For all 7,038 gene families containing one or more Arabidopsis and poplar gene (and covering in total 20,273 and 31,894
genes, respectively), protein multiple alignments were cre-
Genome Biology 2006, 7:R103
/>
Genome Biology 2006,
Vandepoele et al. R103.13
Additional data files
reviews
reports
The following additional data are available with the online
version of this paper. Additional data file 1 is a figure showing
the location of 34 conserved motifs (found in co-expressed
genes) in Arabidopsis promoters (2,445 genes) and of all conserved motifs in Arabidopsis promoters with more than 3 kb
un-annotated upstream space (with distance <1,000 bp
between position in Arabidopsis and poplar; 125 genes).
Additional data file 2 is a figure giving an overview of the
motif organization in orthologous Arabidopsis (left) and poplar (right) targets for module 2.M7010. Additional data file 3
is a figure showing the stability of clusters of co-expressed
genes when randomly removing experiments from the complete expression data set. Additional data file 4 is a figure that
gives an overview of the number of one-to-many and manyto-many orthologous relationships in the phylogenetic trees.
Additional data file 5 is a table giving an overview of the 489
Arabidopsis microarray experiments. Additional data file 6 is
a table giving an overview of the TFBSs identified using twoway clustering. Additional data file 7 is a table giving an overview of the 139 cis-regulatory modules. Additional data file 8
is a table showing the motif order and spacing for 30 cis-regulatory modules.
comment
ated using T-coffee [72]. Alignment columns containing gaps
were removed when a gap was present in >10% of the
sequences. To reduce the chance of including misaligned
amino acids, all positions in the alignment left or right of the
gap were also removed until a column in the sequence alignment was found where the residues were conserved in all
genes included in our analyses. This was determined as follows: for every pair of residues in the column, the BLOSUM62
value was retrieved. Next, the median value for all these values was calculated. If this median was ≥0, the column was
considered as containing homologous amino acids. Neighbor-Joining phylogenetic trees were constructed with
PHYLIP [73] using the Dayhoff PAM matrix and 100 bootstrap samples. Trees were rooted if a non-dicotyledonous species was present within the gene family. In total, 3,167
orthologous gene pairs were identified as speciation nodes in
the trees grouping one Arabidopsis and one poplar gene with
high bootstrap support (≥70). An overview of the one-tomany and many-to-many orthologous relationships is shown
in Additional data file 4. Note that these 3,167 orthologous
gene pairs are not biased towards a particular functional GO
class and thus can be used to estimate the conservation of
candidate TFBSs between both plant genomes.
Volume 7, Issue 11, Article R103
The Locationthe 1394 identified microarray Arabidopsis and
histogram clusters 3 co-expressed expression between
Motifhereof and34module for genes)promotersmore 3 kbposition
orthologous34filedenote thedistanceArabidopsis clusteringallgenes)
OverviewofdataspaceArabidopsisinorthologousco-expressedand kb
ingconservedrelationships completemodules inmodules.plotted inin
Stability offorof promotersmotifsingenes).with Location of than 3 of
AdditionalboxesTFBS the125 phylogenetic(b) experiments removClick upstreamconservedof and cis-regulatory many-to-many(left) a
andexperimentsfile of(with(2,445using2.M7010with moreun-annopoplar motifsmotifs5 Arabidopsis genes when promoters conArabidopsis motif targets 2.M7010 <1,000 bp
tated order(right) organization poplar two-waydata set
served targetsin 4896 spacepromotersfraction randomly
in white
(a) poplar andnumber
un-annotated upstream incumulative trees
all Arabidopsisforpoplar;forone-to-many and
Location
Arabidopsis 30
spacing
Arabidopsis motifs (found
from
conserved module
8
7
2
1
in
cis-regulatory
Functional annotation
Acknowledgements
We would like to thank Kathleen Marchal for stimulating discussions and
technical help with MotifSampler, Lieven Sterck and Stephane Rombauts for
help with the poplar gene annotation and the DoE Joint Genome Institute
and Poplar Genome Consortium for the poplar genomic sequence data.
This work was supported by a grant from the Fund for Scientific Research,
Flanders (3G031805). KV is a postdoctoral fellow of the Fund for Scientific
Research, Flanders.
1.
2.
3.
4.
5.
6.
7.
8.
9.
10.
Genome Biology 2006, 7:R103
information
The expression coherence, which is a measure of the amount
of expression similarity within a set of genes, was calculated
as described by Pilpel and co-workers [9]. Here, the PCC was
used as a measure for similarity between expression profiles
instead of the Euclidian distance used in the original implementation. Based on the similarity between expression profiles for 1,000 random genes (1,000 × 999 × 0.5 gene pairs),
a PCC threshold of 0.5 (corresponding with the 95th percentile of this random distribution) was used to detect significantly co-expressed genes.
interactions
Expression coherence
Venter M, Botha FC: Promoter analysis and transcription profiling: Integration of genetic data enhances understanding of
gene expression. Physiol Plant 2004, 120:74-83.
Wellmer F, Riechmann JL: Gene network analysis in plant development by genomic technologies. Int J Dev Biol 2005,
49:745-759.
Chaboute ME, Clement B, Philipps G: S phase and meristem-specific expression of the tobacco RNR1b gene is mediated by
an E2F element located in the 5' leader sequence. J Biol Chem
2002, 277:17845-17851.
Hong RL, Hamaguchi L, Busch MA, Weigel D: Regulatory elements
of the floral homeotic gene AGAMOUS identified by phylogenetic footprinting and shadowing.
Plant Cell 2003,
15:1296-1309.
Babu MM, Luscombe NM, Aravind L, Gerstein M, Teichmann SA:
Structure and evolution of transcriptional regulatory
networks. Curr Opin Struct Biol 2004, 14:283-291.
Harbison CT, Gordon DB, Lee TI, Rinaldi NJ, Macisaac KD, Danford
TW, Hannett NM, Tagne JB, Reynolds DB, Yoo J, et al.: Transcriptional regulatory code of a eukaryotic genome. Nature 2004,
431:99-104.
Tavazoie S, Hughes JD, Campbell MJ, Cho RJ, Church GM: Systematic determination of genetic network architecture. Nat
Genet 1999, 22:281-285.
Bussemaker HJ, Li H, Siggia ED: Regulatory element detection
using correlation with expression. Nat Genet 2001, 27:167-171.
Pilpel Y, Sudarsanam P, Church GM: Identifying regulatory networks by combinatorial analysis of promoter elements. Nat
Genet 2001, 29:153-159.
Wasserman WW, Sandelin A: Applied bioinformatics for the
identification of regulatory elements. Nat Rev Genet 2004,
refereed research
References
deposited research
GO [74] associations for Arabidopsis proteins were retrieved
from TIGR [75]. The assignments of genes to the original GO
categories were extended to include parental terms (that is, a
gene assigned to a given category was automatically assigned
to all the parent categories as well). All GO categories containing less than 20 genes were discarded from further analysis.
Enrichment values were calculated as the ratio of the relative
occurrence in a set of genes to the relative occurrence in the
genome. The statistical significance of the functional enrichment within sets of genes was evaluated using the
hypergeometric distribution adjusted by the Bonferroni correction for multiple hypotheses testing. Corrected p values
smaller than 0.05 were considered significant. Only CRMs
with significant GO Biological Process annotation and an
enrichment score higher than 5 were retained in the final data
set.
R103.14 Genome Biology 2006,
11.
12.
13.
14.
15.
16.
17.
18.
19.
20.
21.
22.
23.
24.
25.
26.
27.
28.
29.
30.
31.
32.
33.
34.
35.
36.
Volume 7, Issue 11, Article R103
Vandepoele et al.
5:276-287.
Li H, Wang W: Dissecting the transcription networks of a cell
using computational genomics. Curr Opin Genet Dev 2003,
13:611-616.
Siggia ED: Computational methods for transcriptional
regulation. Curr Opin Genet Dev 2005, 15:214-221.
Inada DC, Bashir A, Lee C, Thomas BC, Ko C, Goff SA, Freeling M:
Conserved noncoding sequences in the grasses. Genome Res
2003, 13:2030-2041.
Van de Peer Y: Computational approaches to unveiling ancient
genome duplications. Nat Rev Genet 2004, 5:752-763.
Vandepoele K, Simillion C, Van de Peer Y: The quest for genomic
homology. Curr Genomics 2004, 5:299-308.
Chang LW, Nagarajan R, Magee JA, Milbrandt J, Stormo GD: A systematic model to predict transcriptional regulatory mechanisms based on overrepresentation of transcription factor
binding profiles. Genome Res 2006, 16:405-413.
Kellis M, Patterson N, Endrizzi M, Birren B, Lander ES: Sequencing
and comparison of yeast species to identify genes and regulatory elements. Nature 2003, 423:241-254.
Kreiman G: Identification of sparsely distributed clusters of
cis-regulatory elements in sets of co-expressed genes. Nucleic
Acids Res 2004, 32:2889-2900.
Wang T, Stormo GD: Identifying the conserved network of cisregulatory sites of a eukaryotic genome. Proc Natl Acad Sci USA
2005, 102:17400-17405.
van Noort V, Huynen MA: Combinatorial gene regulation in
Plasmodium falciparum. Trends Genet 2006, 22:73-78.
Van Hellemont R, Monsieurs P, Thijs G, de Moor B, Van de Peer Y,
Marchal K: A novel approach to identifying regulatory motifs
in distantly related genomes. Genome Biol 2005, 6:R113.
Tuskan GA, SP DiFazio, Hellsten U, Jansson S, Rombauts S, Putnam
N, Sterck L, Bohlmann J, Schein J, Ralph S, et al.: The genome of
black cottonwood, Populus trichocarpa (Torr. & Gray ex
Brayshaw). Science 2006, 313:1596-1604.
Pritsker M, Liu YC, Beer MA, Tavazoie S: Whole-genome discovery of transcription factor binding sites by network-level
conservation. Genome Res 2004, 14:99-108.
Elemento O, Tavazoie S: Fast and systematic genome-wide discovery of conserved regulatory elements using a non-alignment based approach. Genome Biol 2005, 6:R18.
Zhou Q, Wong WH: CisModule: de novo discovery of cis-regulatory modules by hierarchical mixture modeling. Proc Natl
Acad Sci USA 2004, 101:12114-12119.
Higo K, Ugawa Y, Iwamoto M, Korenaga T: Plant cis-acting regulatory DNA elements (PLACE) database: 1999. Nucleic Acids
Res 1999, 27:297-300.
Lescot M, Dehais P, Thijs G, Marchal K, Moreau Y, Van de Peer Y,
Rouze P, Rombauts S: PlantCARE, a database of plant cis-acting
regulatory elements and a portal to tools for in silico analysis
of promoter sequences. Nucleic Acids Res 2002, 30:325-327.
Tremousaygue D, Manevski A, Bardet C, Lescure N, Lescure B: Plant
interstitial telomere motifs participate in the control of gene
expression in root meristems. Plant J 1999, 20:553-561.
De Veylder L, Joubes J, Inze D: Plant cell cycle transitions. Curr
Opin Plant Biol 2003, 6:536-543.
Tatematsu K, Ward S, Leyser O, Kamiya Y, Nambara E: Identification of cis-elements that regulate gene expression during initiation of axillary bud outgrowth in Arabidopsis. Plant Physiol
2005, 138:757-766.
Weisshaar B, Armstrong GA, Block A, da Costa e Silva O, Hahlbrock
K: Light-inducible and constitutively expressed DNA-binding
proteins recognizing a plant promoter element with functional relevance in light responsiveness. EMBO J 1991,
10:1777-1786.
Bennetzen JL: Comparative sequence analysis of plant nuclear
genomes:m microcolinearity and its many exceptions. Plant
Cell 2000, 12:1021-1029.
Vandepoele K, Vlieghe K, Florquin K, Hennig L, Beemster GT, Gruissem W, Van de Peer Y, Inze D, De Veylder L: Genome-wide identification of potential plant E2F target genes. Plant Physiol 2005,
139:316-328.
Carranco R, Almoguera C, Jordano J: A plant small heat shock
protein gene expressed during zygotic embryogenesis but
noninducible by heat stress. J Biol Chem 1997, 272:27470-27475.
Bioinformatics and Evolutionary Genomics: Supplementary
Data [ />Arguello-Astorga GR, Herrera-Estrella LR: Ancestral multipartite
37.
38.
39.
40.
41.
42.
43.
44.
45.
46.
47.
48.
49.
50.
51.
52.
53.
54.
55.
56.
57.
58.
59.
/>
units in light-responsive plant promoters have structural features correlating with specific phototransduction pathways.
Plant Physiol 1996, 112:1151-1166.
Li Z, Thomas TL: PEI1, an embryo-specific zinc finger protein
gene required for heart-stage embryo formation in Arabidopsis. Plant Cell 1998, 10:383-398.
Takada S, Hibara K, Ishida T, Tasaka M: The CUP-SHAPED
COTYLEDON1 gene of Arabidopsis regulates shoot apical
meristem formation. Development 2001, 128:1127-1135.
Menges M, Hennig L, Gruissem W, Murray JA: Genome-wide gene
expression in an Arabidopsis cell suspension. Plant Mol Biol 2003,
53:423-442.
Li C, Potuschak T, Colon-Carmona A, Gutierrez RA, Doerner P:
Arabidopsis TCP20 links regulation of growth and cell division control pathways.
Proc Natl Acad Sci USA 2005,
102:12978-12983.
Suarez-Lopez P, Wheatley K, Robson F, Onouchi H, Valverde F, Coupland G: CONSTANS mediates between the circadian clock
and the control of flowering in Arabidopsis. Nature 2001,
410:1116-1120.
Matsushika A, Makino S, Kojima M, Mizuno T: Circadian waves of
expression of the APRR1/TOC1 family of pseudo-response
regulators in Arabidopsis thaliana: insight into the plant circadian clock. Plant Cell Physiol 2000, 41:1002-1012.
Hudson ME, Quail PH: Identification of promoter motifs
involved in the network of phytochrome A-regulated gene
expression by combined analysis of genomic sequence and
microarray data. Plant Physiol 2003, 133:1605-1616.
Sudarsanam P, Pilpel Y, Church GM: Genome-wide co-occurrence of promoter elements reveals a cis-regulatory cassette of rRNA transcription motifs in Saccharomyces
cerevisiae. Genome Res 2002, 12:1723-1731.
Johnson DS, Zhou Q, Yagi K, Satoh N, Wong W, Sidow A: De novo
discovery of a tissue-specific gene regulatory module in a
chordate. Genome Res 2005, 15:1315-1324.
Wang T, Stormo GD: Combining phylogenetic data with coregulated genes to identify regulatory motifs. Bioinformatics
2003, 19:2369-2380.
Grad YH, Roth FP, Halfon MS, Church GM: Prediction of similarly
acting cis-regulatory modules by subsequence profiling and
comparative genomics in Drosophila melanogaster and D.
pseudoobscura. Bioinformatics 2004, 20:2738-2750.
Sinha S, Blanchette M, Tompa M: PhyME: a probabilistic algorithm for finding motifs in sets of orthologous sequences.
BMC Bioinformatics 2004, 5:170.
Monsieurs P, Thijs G, Fadda AA, De Keersmaecker SC, Vanderleyden
J, De Moor B, Marchal K: More robust detection of motifs in
coexpressed genes by using phylogenetic information. BMC
Bioinformatics 2006, 7:160.
Aerts S, Van Loo P, Moreau Y, De Moor B: A genetic algorithm
for the detection of new cis-regulatory modules in sets of
coregulated genes. Bioinformatics 2004, 20:1974-1976.
Gupta M, Liu JS: De novo cis-regulatory module elicitation for
eukaryotic genomes. Proc Natl Acad Sci USA 2005, 102:7079-7084.
Paterson AH: Leafing through the genomes of our major crop
plants: strategies for capturing unique information. Nat Rev
Genet 2006, 7:174-184.
Nottingham Arabidopsis Stock Centre [bi
dopsis.info/]
The Arabidopsis Information Resource [bidop
sis.org/]
Gentleman RC, Carey VJ, Bates DM, Bolstad B, Dettling M, Dudoit S,
Ellis B, Gautier L, Ge Y, Gentry J, et al.: Bioconductor: open software development for computational biology and
bioinformatics. Genome Biol 2004, 5:R80.
Ben-Dor A, Shamir R, Yakhini Z: Clustering gene expression
patterns. J Comput Biol 1999, 6:281-297.
Thijs G, Marchal K, Lescot M, Rombauts S, De Moor B, Rouze P,
Moreau Y: A Gibbs sampling method to detect overrepresented motifs in the upstream regions of coexpressed genes.
J Comput Biol 2002, 9:447-464.
Xie X, Lu J, Kulbokas EJ, Golub TR, Mootha V, Lindblad-Toh K,
Lander ES, Kellis M: Systematic discovery of regulatory motifs
in human promoters and 3' UTRs by comparison of several
mammals. Nature 2005, 434:338-345.
Thijs G, Moreau Y, De Smet F, Mathys J, Lescot M, Rombauts S, Rouze
P, De Moor B, Marchal K: INCLUSive: integrated clustering,
upstream sequence retrieval and motif sampling. Bioinformat-
Genome Biology 2006, 7:R103
/>
60.
62.
63.
64.
66.
67.
68.
71.
73.
74.
75.
76.
deposited research
72.
reports
69.
70.
Vandepoele et al. R103.15
reviews
65.
refereed research
ics 2002, 18:331-332.
Simillion C, Vandepoele K, Van Montagu MC, Zabeau M, Van De Peer
Y: The hidden duplication past of Arabidopsis thaliana. Proc
Natl Acad Sci USA 2002, 99:13627-13632.
Sterck L, Rombauts S, Jansson S, Sterky F, Rouze P, Van de Peer Y:
EST data suggest that poplar is an ancient polyploid. New
Phytol 2005, 167:165-170.
De Bodt S, Theissen G, Van de Peer Y: Promoter analysis of
MADS-Box genes in eudicots through phylogenetic
footprinting. Mol Biol Evol 2006, 23:1293-1303.
Frazer KA, Elnitski L, Church DM, Dubchak I, Hardison RC: Crossspecies sequence comparisons: a review of methods and
available resources. Genome Res 2003, 13:1-12.
Altschul SF, Madden TL, Schaffer AA, Zhang J, Zhang Z, Miller W, Lipman DJ: Gapped BLAST and PSI-BLAST: a new generation of
protein database search programs. Nucleic Acids Res 1997,
25:3389-3402.
Li WH, Gu Z, Wang H, Nekrutenko A: Evolutionary analyses of
the human genome. Nature 2001, 409:847-849.
Rost B: Twilight zone of protein sequence alignments. Protein
Eng 1999, 12:85-94.
Bioinformatics and Evolutionary Genomics: Genomes
[ />Derelle E, Ferraz C, Rombauts S, Rouzé P, Worden AZ, Robbens S,
Partensky F, Degroeve S, Echeynié S, Cooke R, et al.: Genome analysis of the smallest free-living eukaryote Ostreococcus tauri
unveils many unique features. Proc Natl Acad Sci USA 2006,
103:11647-11652.
DOE Joint Genome Institute [ />Vandepoele K, Van de Peer Y: Exploring the plant transcriptome
through phylogenetic profiling. Plant Physiol 2005, 137:31-42.
Schiex T, Moisan A, Rouzé P: EuGène: An eukaryotic gene finder
that combines several sources of evidence. In Computational
Biology: Selected Papers (Lecture Notes in Computer Science) Volume
2066. Edited by: Gascuel O, Sagot M-F. Berlin: Springer-Verlag;
2001:111-125.
Notredame C, Higgins DG, Heringa J: T-Coffee: A novel method
for fast and accurate multiple sequence alignment. J Mol Biol
2000, 302:205-217.
Felsenstein J: Phylogeny Inference Package (version 3.2). Cladistics 1989, 5:164-166.
Gene Ontology Consortium: The Gene Ontology (GO) project
in 2006. Nucleic Acids Res 2006, 34:D322-326.
The TIGR Arabidopsis thaliana Database [ />tdb/e2k1/ath1/]
Storey JD, Tibshirani R: Statistical significance for genomewide
studies. Proc Natl Acad Sci USA 2003, 100:9440-9445.
Volume 7, Issue 11, Article R103
comment
61.
Genome Biology 2006,
interactions
information
Genome Biology 2006, 7:R103