Báo cáo y học: " Wesleyan University, Middletown, CT 06459, USA. #Divisions of Human Biology and Clinical" docx
Bạn đang xem bản rút gọn của tài liệu. Xem và tải ngay bản đầy đủ của tài liệu tại đây (1.37 MB, 15 trang )
Genome Biology 2006, 7:R106
comment reviews reports deposited research refereed research interactions information
Open Access
2006Kinget al.Volume 7, Issue 11, Article R106
Method
Analysis of the Saccharomyces cerevisiae proteome with
PeptideAtlas
Nichole L King
*
, Eric W Deutsch
*
, Jeffrey A Ranish
*
, Alexey I Nesvizhskii
†
,
James S Eddes
*
, Parag Mallick
‡
, Jimmy Eng
*§
, Frank Desiere
¶
, Mark Flory
¥
,
Daniel B Martin
*#
, Bong Kim
*
, Hookeun Lee
**
, Brian Raught
††
and
Ruedi Aebersold
***
Addresses:
*
Institute for Systems Biology, N 34th Street, Seattle, WA 98103, USA.
†
Department of Pathology, University of Michigan, Catherine
Road, Ann Arbor, MI 48109, USA.
‡
Louis Warschaw Prostate Cancer Center, Cedars-Sinai Medical Center, W. Third St, Los Angeles, CA 90048,
USA.
§
PHSD, Fred Hutchinson Cancer Research Center, Seattle, WA 98109, USA.
¶
Nestlé Research Center, 1000 Lausanne 26, Switzerland.
¥
Department of Molecular Biology and Biochemistry, Wesleyan University, Middletown, CT 06459, USA.
#
Divisions of Human Biology and
Clinical Research, Fred Hutchinson Cancer Research Center, Seattle, WA 98109-1024, USA.
**
IMSB, ETH Zurich and Faculty of Science,
University of Zurich, Zurich, Switzerland.
††
University Health Network, Ontario Cancer Institute and McLaughlin Centre for Molecular
Medicine, College Street, Toronto, ON M5G 1L7, Canada.
Correspondence: Nichole L King. Email:
© 2006 King et al.; licensee BioMed Central Ltd.
This is an open access article distributed under the terms of the Creative Commons Attribution License ( which
permits unrestricted use, distribution, and reproduction in any medium, provided the original work is properly cited.
The yeast proteome<p>The <it>S. cerevisiae </it>PeptideAtlas, composed from 47 diverse experiments and nearly 5 million tandem mass spectra, is described.</p>
Abstract
We present the Saccharomyces cerevisiae PeptideAtlas composed from 47 diverse experiments and
4.9 million tandem mass spectra. The observed peptides align to 61% of Saccharomyces Genome
Database (SGD) open reading frames (ORFs), 49% of the uncharacterized SGD ORFs, 54% of S.
cerevisiae ORFs with a Gene Ontology annotation of 'molecular function unknown', and 76% of
ORFs with Gene names. We highlight the use of this resource for data mining, construction of high
quality lists for targeted proteomics, validation of proteins, and software development.
Background
The field of genomics is slowly reaching maturity. The
genomes of many organisms have now been sequenced and
the effort to annotate these genomes is now well underway.
Transcriptomes are routinely investigated, as mRNA expres-
sion can be measured with highly sensitive microarrays and
other methods. In contrast, the measurement and annotation
of proteomes remains challenging. Proteome analysis is pri-
marily based on mass spectrometry (MS) and is not as mature
as gene expression analysis. However, proteomic measure-
ments are preferable in some situations because, while
mRNA expression studies indicate the potential for protein
expression, they do not directly measure proteome character-
istics. For example, mRNA expression levels do not always
correlate well with protein expression levels due to variations
in translation efficiencies [1] and targeted degradation of pro-
teins in the cell [2,3]. Additionally, proteins are subjected to
numerous post-transcriptional modifications that alter the
chemical composition of the protein. Proteins also interact
with other proteins in a highly dynamic way.
Proteomics by MS has emerged as an effective tool for prob-
ing those properties of expressed genes that are not directly
apparent from the mRNA sequence or transcript abundance,
including the subcellular location of a protein of interest [4-
6], the identification of post-translational modifications
Published: 13 November 2006
Genome Biology 2006, 7:R106 (doi:10.1186/gb-2006-7-11-r106)
Received: 5 July 2006
Revised: 2 October 2006
Accepted: 13 November 2006
The electronic version of this article is the complete one and can be
found online at />R106.2 Genome Biology 2006, Volume 7, Issue 11, Article R106 King et al. />Genome Biology 2006, 7:R106
[7,8], the characterization of interacting proteins or ligands
[9], and the measurement of changes in these protein proper-
ties throughout the cell cycle or in response to a given stimuli
or stress [10-12]. Coupled with various types of isotopic labe-
ling reagents, MS can also be used to directly determine rela-
tive and absolute protein abundances [13]. Abundance
measurements in proteomics are difficult, however, com-
pared to mRNA studies as there are no amplification strate-
gies such as PCR to increase the concentration of low
abundance analytes.
In the present study, we attempt to characterize the Saccha-
romyces cerevisiae proteome using MS based proteomics. S.
cerevisiae is a widely used and important model organism
with a relatively large, but structurally simple, genome for
which a high quality and well annotated sequence is available.
It exhibits many of the same pathways and cellular functions
as higher Eukaryotes. The largest published S. cerevisiae pro-
tein expression study used epitope tagging to detect 73% of
the annotated Saccharomyces Genome Database (SGD) open
reading frames (ORFs), which is 83% of SGD ORFs with Gene
names [14,15]. Another recent study identified 72% of the
predicted yeast proteome [16]. In this paper we combine the
data from 47 different MS experiments that collectively gen-
erated 4.9 million spectra, into a single structure, the Saccha-
romyces cerevisiae PeptideAtlas.
The PeptideAtlas Project provides software tools and an
infrastructure for the integration, visualization and analysis
of multiple MS datasets [17-19]. This resource can be used to
design future, more efficient experiments, to assist in the
exploration of the proteome, and to support the development
of proteomics software by making the data publicly accessi-
ble. We additionally demonstrate how this resource can be
used in the construction of high quality lists of observable
peptides for synthesis as reference molecules for targeted
proteomics. This novel resource improves as more research-
ers contribute datasets.
Results and discussion
PeptideAtlas construction
The S. cerevisiae PeptideAtlas is composed of 47 datasets
(Table 1) from many different sources that were generated by
using a variety of protocols and separation techniques. All
samples in this atlas were proteolytically digested with
trypsin, and many were treated with one of the isotope-coded
affinity tagging (ICAT) reagents [10] or iodoacetamide. All
samples were acquired using LC-ESI instruments (liquid
chromatography separation, and electrospray ionization cou-
pled with MS) - no matrix-assisted laser desorption ioniza-
tion time-of-flight (MALDI-TOF) instrument datasets were
available for inclusion. The PeptideAtlas can, however, accept
and be expanded with data from any type of instrument using
the mzXML data format (see below). A variety of protein or
peptide separation techniques were employed in these exper-
iments, including SDS-PAGE, free-flow electrophoresis and
strong cation exchange chromatography, to generate frac-
tions that were then subjected to reversed-phase HPLC sepa-
ration prior to mass spectrometric analysis.
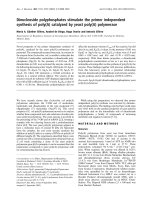
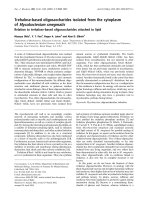
Processing of the acquired spectra and construction of a Pep-
tideAtlas are briefly summarized in Figure 1 and described in
more detail in previous publications [17-19]. For each submit-
ted yeast dataset, all spectra were first converted to the
mzXML format [20] irrespective of the original file format
and then searched using SEQUEST [21] against a non-redun-
dant S. cerevisiae reference protein database (the union of
the SGD, Ensembl, NCI, and GenBank databases as detailed
in Additional data file 1, plus keratin and trypsin). Redundant
ORF sequences were coalesced to single entries with com-
bined description fields. The union of the five protein
sequence files yielded 13,748 distinct ORF sequences. Many
ORF sequences differed by only a few amino acid residues,
but all differences were retained in order to maximize the
number of sequence assignments.
For each experiment the primary database search results
were assigned statistical probabilities using the Peptide-
Prophet program [22] implemented in the Trans-Proteomic-
Pipeline [23]. Table 2 lists the number of spectra per experi-
ment in total and with a PeptideProphet assignment P ≥ 0.9,
and the number of distinct peptide identifications cumula-
tively added by each experiment. The experiments are sorted
approximately in the order submitted; the latter experiments
will naturally make a smaller contribution to the total list of
distinct peptides as many of the peptides identified in the lat-
ter experiments were also identified in earlier experiments.
Search results and spectra were stored in the Systems Biology
Experiment Analysis Management System (SBEAMS), and all
files were retained in an archive area.
To create the S. cerevisiae PeptideAtlas, all peptide informa-
tion in contributed datasets was filtered to retain only those
identifications with a PeptideProphet probability above 0.9.
The remaining peptide sequences were then aligned with the
SGD reference protein database using the NCBI program
BLASTP [24] with arguments to achieve the highest scores for
identities of 100% without gaps. Chromosomal coordinates
were then calculated using the BLAST-provided coding
sequence (CDS) coordinates of the peptide combined with the
chromosomal coordinates of the protein features (where fea-
tures are the contents of the SGD_features table that contain
elements present in the GFF3 guidelines [25]). Peptide infor-
mation along with the chromosomal coordinates were loaded
into the PeptideAtlas database.
Summary statistics of the current yeast PeptideAtlas build are
presented in Table 3. The build was constructed with a lower
limit threshold of peptide assignments with P ≥ 0.9, but the
build may be searched with higher thresholds and those sum-
Genome Biology 2006, Volume 7, Issue 11, Article R106 King et al. R106.3
comment reviews reports refereed researchdeposited research interactions information
Genome Biology 2006, 7:R106
Table 1
List of experiments
Experiment Instrument Treatment/labeling Separation Strain Data contributors Affiliation Reference
gricat LCQ Classic ICAT SCX BY4741 J Ranish, T Ideker ISB [42]
cdc15_cdc23_newICAT LCQ DECA clICAT SCX BY4742 B Raught ISB -
cdc15_cdc23_oldICAT LCQ DECA ICAT SCX BY4742 B Raught ISB -
cdc15_cdc23_ICAT LCQ DECA clICAT SCX BY4742 B Raught ISB -
cdc23_amf_newICAT LCQ DECA clICAT SCX BY4742 B Raught ISB -
contFFE2Murea LCQ DECA clICAT SCX BY4741 ? F Kregenow, R Aebersold ISB -
FFEY1 LCQ DECA FFE Unknown BY4741 ? F Kregenow, R Aebersold ISB -
FFEY1Scx LCQ DECA FFE SCX BY4741 ? F Kregenow, R Aebersold ISB -
FFEY2 LCQ DECA XP FFE Unknown BY4741 ? F Kregenow, R Aebersold ISB -
PeteryeastIcatstdFFE LCQ DECA XP clICAT Unknown BY4741 ? F Kregenow, R Aebersold ISB -
TSAAT000c LCQ DECA XP clICAT SCX BY2125 M Flory et al.ISB [43]
TSAAT030c LCQ DECA XP clICAT SCX BY2125 M Flory et al.ISB [43]
TSAAT060c LCQ DECA XP clICAT SCX BY2125 M Flory et al.ISB [43]
TSAAT090c LCQ DECA XP clICAT SCX BY2125 M Flory et al.ISB [43]
TSAAT120c LCQ DECA XP clICAT SCX BY2125 M Flory et al.ISB [43]
TSAAxT000old LCQ DECA ICAT SCX BY2125 M Flory ISB [43]
T00 LCQ DECA XP ICAT SCX BY2125 M Flory ISB [43]
T30 LCQ DECA XP ICAT SCX BY2125 M Flory ISB [43]
T50 LCQ DECA XP ICAT SCX BY2125 M Flory ISB [43]
opd00034_YEAST LCQ DECA XP None SCX DBY8724 P Lu University of Texas [44]
opd00035_YEAST LCQ DECA XP None SCX DBY8724 P Lu University of Texas [44]
peroximalPrep0702 LCQ Classic ICAT SCX BY4743 M Marelli et al.ISB [45]
Comp12vs12sizefrac LCQ DECA Iodoacetemide SCX BY4741 DB Martin ISB -
pxproteome LCQ DECA clICAT SCX BY4743 M Marelli et al.ISB [45]
Comp12vs12standSCX LCQ DECA Iodoacetemide SCX BY4741 DB Martin ISB -
YeastICAT LCQ Classic ICAT SCX Derivative of BY4741 J Ranish ISB -
PvM1 LCQ Classic ICAT SCX BY4743 M Marelli et al.ISB [45]
peroximal_clICAT LCQ Classic clICAT SCX BY4743 M Marelli et al.ISB [45]
Ac30 LCQ DECA XP clICAT SCX BY1782, BY2125 KR Serikawa et al. University of
Washington
[46]
yeast LCQ DECA Iodoacetemide SCX YPH499 Gygi et al.Harvard Medical
School
[47]
gel_msms LCQ DECA Iodoacetemide Gel, SCX BY4742 Ho et al.MDS Proteomics[30]
mudpit LCQ DECA XP PLUS Iodoacetemide SDS-PAGE,
SCX
YRP480 P Haynes et al. University of
Arizona
[48]
ipg_ief LCQ DECA XP PLUS Iodoacetemide SDS-PAGE,
IEF
YRP480 P Haynes et al. University of
Arizona
[48]
rp_int_selected LCQ DECA XP PLUS Iodoacetemide SDS-PAGE YRP480 P Haynes et al. University of
Arizona
[48]
rp_mass_selected LCQ DECA XP PLUS Iodoacetemide SDS-PAGE YRP480 P Haynes et al. University of
Arizona
[48]
sdspage LCQ DECA XP PLUS Iodoacetemide SDS-PAGE YRP480 P Haynes et al. University of
Arizona
[48]
YM_N14N15_DAYGly LCQ Classic None Unknown DBY8724 P Lu University of Texas [44]
YM_N14N15_DAYSer LCQ Classic None Unknown DBY8724 P Lu University of Texas [44]
YM_N14N15_SCYGly LCQ Classic None Unknown DBY8724 P Lu University of Texas [44]
YM_N14N15_SCYSer LCQ Classic None Unknown DBY8724 P Lu University of Texas [44]
APEX_04-22 LCQ Classic None Unknown DBY8724 P Lu University of Texas [44]
APEX_04-23 LCQ Classic None Unknown DBY8724 P Lu University of Texas [44]
APEX_04-24 LCQ Classic None Unknown DBY8724 P Lu University of Texas [44]
APEX_04-28 LCQ Classic None Unknown DBY8724 P Lu University of Texas [44]
YeastSCXReps LCQ Classic Iodacetimide SCX BY4741 Maynard et al. NIH [49]
FFE_nonICAT LCQ Classic Iodacetimide FFE BY2125? Mingliang Ye ISB
clICAT is acid cleavable ICAT D0227/D9236 and ICAT is the older ICAT reagent D0422/D8450. FFE, free flow electrophoresis; IEF, is isoelectric
focusing; SCX, strong cation exchange; SDS-PAGE, sodium dodecyl (lauryl) sulfate-polyacrylamide gel electrophoresis.
R106.4 Genome Biology 2006, Volume 7, Issue 11, Article R106 King et al. />Genome Biology 2006, 7:R106
mary statistics are also reported in Table 3. The number of
distinct peptide sequences identified in these spectra (with P
> 0.9) is 36,133. The number of SGD proteins with which
these peptides display perfect alignment is 4,063, which is
61% of all ORFs in the SGD protein database. If we apply a
stricter criteria of removing identifications in which a peptide
PeptideAtlas processing, creation, and interfacesFigure 1
PeptideAtlas processing, creation, and interfaces. The first column outlines experiment level processing with SEQUEST [21] and PeptideProphet [22], the
second column shows major stages in the construction of a PeptideAtlas [18] using BLAST [24] to obtain coding sequence (CDS) coordinates, and the
third column shows the data, business logic, and presentation tiers for a PeptideAtlas.
Genome Biology 2006, Volume 7, Issue 11, Article R106 King et al. R106.5
comment reviews reports refereed researchdeposited research interactions information
Genome Biology 2006, 7:R106
Table 2
The number of spectra acquired and peptides identified per experiment
Experiment numSpec(P > 0.0) numSpec(P > 0.9) numDistinctPeptides(cumulative, P
> 0.9)
gricat 24,833 2,585 734
cdc15_cdc23_newICAT 172,938 22,269 2,889
cdc15_cdc23_oldICAT 156,353 8,281 3,184
cdc15_cdc23_ICAT 21,392 3,337 3,293
cdc23_amf_newICAT 127,673 25,861 4,096
contFFE2Murea 105,686 5,473 4,430
FFEY1 64,880 2,966 5,994
FFEY1Scx 7,045 796 6,396
FFEY2 60,140 7,159 8,877
PeteryeastIcatstdFFE 136,563 4,680 9,375
TSAAT000c 217,919 43,628 11,423
TSAAT030c 249,774 42,519 12,042
TSAAT060c 214,851 28,089 12,424
TSAAT090c 198,057 31,428 13,247
TSAAT120c 179,408 26,182 13,588
TSAAxT000old 101,166 6,311 13,728
T00 94,208 9,206 13,840
T30 83,758 8,758 13,935
T50 106,572 4,606 14,026
opd00034_YEAST 24,049 4,554 14,557
opd00035_YEAST 23,715 3,931 14,862
peroximalPrep0702 24,209 3,197 15,236
Comp12vs12sizefrac 28,926 11,703 17,553
pxproteome 23,720 1,552 17,724
Comp12vs12standSCX 31,652 12,103 18,966
YeastICAT 55,922 6,760 19,577
PvM1 3,796 323 19,623
peroximal_clICAT 92,721 3,693 19,778
Ac30 255,937 37,873 20,025
yeast 140,567 29,411 24,548
gel_msms 343,654 43,022 32,450
mudpit 36,599 10,811 32,859
ipg_ief 136,209 27,792 33,383
rp_int_selected 53,358 14,669 33,684
rp_mass_selected 71,151 4,881 33,857
sdspage 92,802 19,208 34,734
YM_N14N15_DAYGly 38,951 1,658 34,806
YM_N14N15_DAYSer 39,315 1,862 34,843
YM_N14N15_SCYGly 37,124 1,364 34,861
YM_N14N15_SCYSer 37,658 2,238 34,902
APEX_04-22 38,334 1,732 34,926
APEX_04-23 38,175 1,775 34,949
APEX_04-24 36,407 1,359 34,963
APEX_04-28 40,612 2,248 34,995
YeastSCXReps 118,083 60,568 35,446
FFE_nonICAT 21,054 6,870 36,133
Column 1 is the experiment name, column 2 is the number of spectra associated with PeptideProphet probabilities >0, column 3 is the number of
spectra associated with PeptideProphet probabilities >0.9, and column 4 is the cumulative number of distinct peptides with PeptideProphet
probabilities >0.9.
R106.6 Genome Biology 2006, Volume 7, Issue 11, Article R106 King et al. />Genome Biology 2006, 7:R106
was only observed once in the entire S. cerevisiae PeptideAt-
las, we then find that 43% of all SGD ORFs have been seen
(with P > 0.9). If we also apply another criterion, that we
count only the peptide to protein mappings that are not
degenerate and that have P ≥ 0.9, we observe 59% of SGD
ORFs. The same criteria applied to peptides that have been
seen more than once results in an observation of 41% of SGD
ORFs. The number of peptides with perfect alignment to pro-
tein sequences in files other than SGD is 110 (Additional data
file 1). Some of these identifications correspond to records
that NCBI has discontinued or are identifications to
appended contaminant sequences such as keratin or trypsin
identified in the search, but are not present in the target
genome (S. cerevisiae in this case).
Expected errors are calculated with equation 14 of the Pepti-
deProphet paper using the summation of (1 - P
i
) divided by N
i
.
This is applied to four cases, summarized as rows in Table 4,
and three PeptideProphet probability limits, shown as col-
umns in Table 4. The cases are: one, the assigned probability
P of each MS/MS is used for all P
i
≥ P
limit
; two, the assigned
probability P of each MS/MS is used for all P
i
≥ P
limit
where the
associated peptide has been seen in the S. cerevisiae Peptide-
Atlas more than once; three, the best probability for each
unique peptide sequence is used for all P ≥ P
limit
; and four, the
best probability for each unique peptide sequence is used for
all P ≥ P
limit
when the peptide has been seen in the S. cerevi-
siae PeptideAtlas more than once. Note that cases three and
four make an assumption that the peptide identifications can
be represented by the best identification probability for that
peptide. There are many methods to score groups of peptides,
and we adopt the simplest in this paper for cases three and
four as they represent the data as we have used it. For more
detailed discussions on group scoring, please see [26,27].
Table 4 shows that the expected error rate for the S. cerevisiae
PeptideAtlas as a whole is 9%. As an aside, one can construct
subsets of the build with smaller error rates by using a higher
PeptideProphet probability threshold (see changes along a
row in Table 4) or by reducing the number of peptides one is
counting (see changes along a column in Table 4) by only
using those peptides that have been observed more than once,
and further removing information from multiple instances of
those peptides.
In summary, the S. cerevisiae PeptideAtlas expected error
rate is 9%, but the user is able to construct subset exports of
the build with reduced error rates if desired.
To what extent do the peptides in the S. cerevisiae
PeptideAtlas represent the S. cerevisiae proteome?
The coverage of the S. cerevisiae proteome by the PeptideAt-
las is high, but not complete. Using only peptide identifica-
tions possessing a PeptideProphet score of P > 0.9, we have
mapped to 61% of all SGD ORFs with at least one peptide hit.
In Table 5 we present the observed ORFs categorized by
feature type annotations. Of the 'uncharacterized' ORFs, 49%
are represented in the S. cerevisiae PeptideAtlas (Additional
data file 2). Uncharacterized ORFs are defined as putative
gene products with homologs in another species that have,
however, not been experimentally observed in S. cerevisiae.
Of the 'verified' ORFs, 74% are represented in the PeptideAt-
las. Verified ORFs are those that have been experimentally
confirmed to exist in S. cerevisiae. A small percentage of
ORFs are annotated as 'dubious'; only very few of these ORFs
were found in the PeptideAtlas. Dubious ORFs are putative
gene products that do not have homologs in other Saccharo-
myces species, and for which there is no experimental evi-
dence of existence in S. cerevisiae. (Additional data file 3). Of
the ORFs annotated as pseudogenes, 19% are represented in
the PeptideAtlas. An SGD pseudogene has a functional
homolog in another organism, and is predicted to no longer
Table 3
Statistics for the current S. cerevisiae PeptideAtlas
P
limit
= 0.9, N
obs
> 0 P
limit
= 0.95, N
obs
> 0 P
limit
= 0.99, N
obs
> 0 P
limit
= 0.9, N
obs
> 1 P
limit
= 0.95, N
obs
> 1 P
limit
= 0.99, N
obs
> 1
# Experiments 47 47 47 47 47 47
# MS runs 2,579 2,579 2,579 2,579 2,579 2,579
# MS/MS 4.9 M 4.9 M 4.9 M 4.9 M 4.9 M 4.9 M
# MS/MS with P ≥ P
limit
600,960 565,217 472,234 586,708 552,434 461,827
# Distinct peptides with P ≥ P
limit
36,133 33,377 27,909 21,840 21,646 20,251
# Distinct peptides with perfect
SGD alignment
35,434 32,790 27,499 21,469 21,281 19,942
# SGD ORFs seen in PeptideAtlas 4,249 (62%) 3,903 (57%) 3,476 (51%) 3,069 (45%) 3,049 (45%) 2,935 (43%)
# SGD ORFs unambiguously seen in
PeptideAtlas
3,980 (59%) 3644 (54%) 3,224 (47%) 2,795 (41%) 2,778 (41%) 2,672 (39%)
The percentage of SGD ORFs seen in PeptideAtlas is shown as a function of lower limit PeptideProphet probabilities and number of times peptide has
been observed above lower limit. Using the most generous parameters of the build, we see 62% of the SGD ORFs. As an aside, 68% of SGD ORFs
have Systematic gene names and we observe 76% of those. This is comparable to the 83% of ORFs with Systematic gene names that Ghaemmaghami
et al. [14] observed in their protein expression study.
Genome Biology 2006, Volume 7, Issue 11, Article R106 King et al. R106.7
comment reviews reports refereed researchdeposited research interactions information
Genome Biology 2006, 7:R106
function because mutations prevent its transcription or
translation. The pseudogene classification is based upon
observations of ORFs from the S288C strain. Of the ORFs
annotated as transposable elements, 20% are present in the
PeptideAtlas (Additional data file 4). Note that the coverage
of the ORFs in these categories decreases if we remove those
peptides that have only been observed once in the entire atlas.
With the single hit peptides removed, we see 56% of SGD ver-
ified ORFs in PeptideAtlas, 29% of the uncharacterized ORFs,
none of the ORFs from verified/silenced_genes, 2% of the
dubious ORFs, 5% of ORFs from pseudogenes, and 15% of
ORFs from genes categorized as transposable element genes.
The assignments to dubious ORFs should be viewed skepti-
cally as the numbers of observations are extremely small and
within error of the atlas.
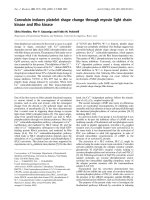
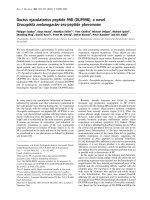
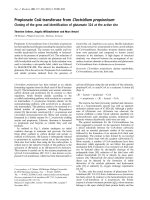
A histogram of ORF sequence coverage is shown in Figure 2;
the PeptideAtlas distribution is represented by the shaded
distribution on the left, while an in silico digested SGD refer-
ence ORF distribution filtered to retain peptides with average
molecular weights between 500 and 4,000 Da is seen on the
right. About 40% of the ORFs in PeptideAtlas have sequence
coverage greater than 20%. Importantly, the entire yeast pro-
teome is not expected to be observable by current tandem MS
techniques. This is not an impediment to protein identifica-
tion, as the entire set of measurable peptides for a given pro-
tein is not necessary for an unambiguous identification of the
protein. Some of the reasons that perfect sequence coverage
is not possible are inherent in the instruments (discussed fur-
ther in the next section) and in the search techniques. For
example, we may miss identifications of sequences from post-
translationally modified proteins in the search strategy
applied.
Biases in the S. cerevisiae PeptideAtlas
Since all the data in the PeptideAtlas were acquired using LC-
ESI-MS/MS, we examined peptide hydrophobicity, mass and
charge distributions to characterize any inherent biases in the
peptide dataset.
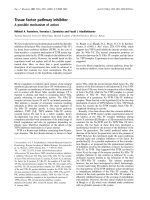
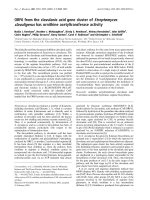
Using the Guo [28] and Krokhin et al. parameters [29] we
created hydrophobicity histograms for the S. cerevisiae Pep-
tideAtlas peptides (darker hatched bars), overlaid on an in sil-
ico digest of the entire SGD database (lighter hatched bars)
allowing one missed tryptic cleavage (Figure 3). While pep-
tides of moderate hydrophobicity were efficiently observed,
the S. cerevisiae PeptideAtlas is clearly lacking in the most
hydrophilic peptides - presumably because these peptides do
not efficiently bind to standard HPLC columns and proceed to
waste instead of entering the mass spectrometer. Other types
of upstream separation techniques or modification of HPLC
solvent conditions will most likely be required to improve the
Table 4
Expected errors
Case Expected errors P
limit
= 0.9 Expected errors P
limit
= 0.95 Expected errors P
limit
= 0.99
MS/MS P
i
≥ P
limit
0.00915 (9%) 0.00517 (5%) 0.00137 (1%)
MS/MS P
i
≥ P
limit
, N
peptide observed
> 1 0.00884 (9%) 0.00506 (5%) 0.00136 (1%)
Consensus peptide best P
i
, P
i
≥ P
limit
0.01027 (10%) 0.00510 (5%) 0.00120 (1%)
Consensus peptide best P
i
, P
i
≥ P
limit
,
N
peptide observed
>1
0.00272 (3%) 0.00215 (2%) 0.00078 (1%)
Expected errors in the Saccharomyces PeptideAtlas are calculated for four cases and lower probability limits (P
limit
= 0.9, 0.95, 0.99): the assigned
probability P of each MS/MS is used for all P
i
≥ P
limit
; the assigned probability P of each MS/MS is used for all P
i
≥ P
limit
where the associated peptide has
been seen in the S. cerevisiae PeptideAtlas more than once'; the best probability for each unique peptide sequence is used for all P
i
≥ P
limit
; the best
probability for each unique peptide sequence is used for all P
i
≥ P
limit
when the peptide has been seen in the S. cerevisiae PeptideAtlas more than once.
Table 5
Numbers of proteins matching SGD ORF annotation categories
ORF annotation SGD PeptideAtlas P > 0.9, N
obs
> 0 PeptideAtlas P > 0.9, N
obs
> 1
Uncharacterized 1,414 695 (49%) 405 (29%)
Verified 4,366 3,250 (74%) 2,449 (56%)
Verified | silenced gene 4 1 (25%) 0 (0%)
Dubious 820 95 (12%) 13 (2%)
Pseudogene 21 4 (19%) 1 (5%)
Transposable element gene 89 18 (20%) 13 (15%)
Total 6,714 4,063 (61%) 2,881 (43%)
The percent of SGD ORFs seen in the PeptideAtlas are shown in columns 3 and 4. Column 3 uses all peptides with probabilities ≥ 0.9, while column
4 excludes peptides that have only been seen once in the S. cerevisiae PeptideAtlas.
R106.8 Genome Biology 2006, Volume 7, Issue 11, Article R106 King et al. />Genome Biology 2006, 7:R106
detection of these hydrophilic peptides. Similarly, the most
hydrophobic peptides are also not as efficiently observed as
peptides with more moderate hydrophobicity scores, presum-
ably because these peptides do not elute efficiently under
standard LC gradient conditions.
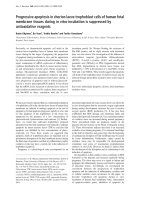
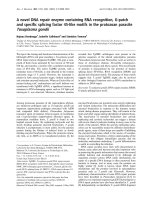
A bias is also present in the distribution of peptide masses.
Figure 4 shows histograms of S. cerevisiae PeptideAtlas aver-
age molecular weights (solid bars) overlaid on an in silico
digest of the entire SGD database (hatched bars). The
acquisition settings for MS/MS instruments are typically in
the range of 400 to 2,000 m/z which, accounting for charge
states, limits the peptide mass detection range to 400 to
6,000 Da. The database searches, however, have a range of
roughly 600 to 4,200 Da. The in silico digest reference distri-
bution suggests that there would be a peak at a mass of
approximately 700 amu, but the observed peak is near 1,500
amu. In the PeptideAtlas, we appear to be missing many of
the peptides with masses less than 1,400 Da, largely because
these smaller peptides are more difficult to identify using
standard database search tools. Importantly, however,
smaller peptides are often not as useful in protein identifica-
tion as the longer peptides, since the short amino acid
sequences are less likely to be unique to a single protein.
Histrograms of protein sequence coverageFigure 2
Histrograms of protein sequence coverage. A histogram of the sequence coverage of the S. cerevisiae ORFs by PeptideAtlas (darker filled bars) and an in
silico tryptic digestion of the reference protein database with a mass range of 500 to 4,000 Da (lighter diagonal pattern filled bars) is shown. Of the
PeptideAtlas ORFs, 61% have coverage below 20%, while 39% have a coverage above 20%.
0 20 40 60 80 100
Sequence coverage (%)
0
1000
2000
3000
4000
Number of ORFs
Genome Biology 2006, Volume 7, Issue 11, Article R106 King et al. R106.9
comment reviews reports refereed researchdeposited research interactions information
Genome Biology 2006, 7:R106
Additionally, larger peptides tend to have more than one
chance of being observed, as charge states of +2 or +3 can put
the peptides within range of the acquisition settings of the
instrument. Figure 4 shows that there are a larger number of
peptides in charge states of +2 and +3, with only a small per-
centage of peptide identifications derived from a +1 charge
state. This is expected given that the datasets in this version
of the PeptideAtlas are from ESI instruments. We do not cur-
rently search the spectra for ions with charge states larger
than +3 and it could be expected that many of the missed
larger peptides might generate higher charge state ions. The
addition of MALDI-TOF datasets to the atlas will populate the
database with identifications from ions in the +1 charge state.
Krogan et al. [16] find high protein discovery rates using
MALDI, so this approach is promising.
In summary, a sizable fraction of the yeast proteome has been
identified using LC-ESI MS/MS. The smallest peptides are
not well represented in the PeptideAtlas. Additionally, the
most hydrophilic peptides and hydrophobic peptides are
Hydrophobicity histrogamsFigure 3
Hydrophobicity histrogams. (a) Mean hydrophobicity histogram for peptides in the S. cerevisiae PeptideAtlas (darker hashed bars) and an in silico tryptic
digest of the SGD reference protein database allowing one missed cleavage (lighter hashed bars). (b) The reference peptides' hydrophobicities divided by
the observed peptides' hydrophobicities. The lowest hydrophobicity peptides are generally washed off the column in the reverse phase stage of the HPLC
process and hence not measured.
-4 -2 0 2 4 6 8 10
Peptide mean hydrophobicity
0
1,000
2,000
3,000
4,000
Number of peptides (norm)
-4 -2 0 2 4 6 8 10
Peptide mean hydrophobicity
0
5
10
15
Fraction (=ref/obs)
(a)
(b)
R106.10 Genome Biology 2006, Volume 7, Issue 11, Article R106 King et al. />Genome Biology 2006, 7:R106
under represented. It will be interesting to determine how
these distributions change as more diverse types of data are
added to the atlas.
The relationship between number of spectra and
number of identified peptides
As the PeptideAtlas is continually populated with new data-
sets, we expect that, at some stage, the addition of new spectra
will produce few new peptide identifications. We are thus
tracking the number of unique peptides contributed by each
additional experiment. From a total of 4.9 million MS/MS
spectra, we have 36,133 distinct peptides with
PeptideProphet scores >0.9 (Table 3). As an aside, the
number of distinct peptides from an in silico tryptic digestion
of the SGD protein database, allowing one missed cleavage,
and counting those peptides whose masses are in the range
500 to 4,000 Da, is 436,445, so we currently observe roughly
10% of what we might expect if all peptides had equal possi-
bility of being observed. The current rate of inclusion of
unique peptide identifications with P > 0.9 is shown in Figure
Mass histogramsFigure 4
Mass histograms. (a) Average molecular weight of unique peptide sequences in PeptideAtlas (solid filled bars) and the in silico tryptically digested SGD
protein database (hashed bars) allowing one missed cleavage. (b-d) Mass histograms of spectra, separated by charge. The large number of peptides with
masses less than 1,000 Da are difficult to identify in database searches, and hence are not present in the PeptideAtlas. CID, collision-induced dissociation.
0 1000 2000 3000 4000 5000
Peptide average molecular weight [Da]
0
1000
2000
3000
4000
5000
# peptides (PA scale)
0 1000 2000 3000 4000 5000
0
1•10
4
2•10
4
3•10
4
4•10
4
# spectra
CIDs with Z=+1
0 1000 2000 3000 4000 5000
0
1•10
4
2•10
4
3•10
4
4•10
4
# spectra
CIDs with Z=+2
0 1000 2000 3000 4000 5000
Peptide average molecular weight [Da]
0
1•10
4
2•10
4
3•10
4
4•10
4
# spectra
CIDs with Z=+3
(a)
(b)
(c)
(d)
Genome Biology 2006, Volume 7, Issue 11, Article R106 King et al. R106.11
comment reviews reports refereed researchdeposited research interactions information
Genome Biology 2006, 7:R106
5. In general, there is one peptide added for every 125 spectra.
Flattened areas of the curve are due to overlapping identifica-
tion of peptides from similar experiments (and instrument),
rather than the expected final trend of saturation of the pro-
teome sequences. Remarkable increases in distinct peptide
yields are seen from the Gygi et al. [10] yeast dataset and the
Ho et al. [30] gel_msms dataset. In summary, we have
identified roughly ten percent of the peptides predicted from
an in silico digested protein database, and have not yet
reached saturation of novel additions. Novel additions are
expected with the inclusion of results from new experiment
designs and instrument platforms.
What new information does the PeptideAtlas
contribute about the S. cerevisiae proteome and
genome?
Having characterized some observational biases in peptide
content of the PeptideAtlas, we now briefly examine charac-
teristics of the identifications in relation to predictions based
on codon bias and gene ontology categories. Figure 6 illus-
trates the codon enrichment correlation (CEC) for all ORFs in
the S. cerevisiae PeptideAtlas and all ORFs in Ghaemma-
ghami et al. [14]. CEC is a parameter constructed by
Ghaemmaghami et al. [14] to represent a measurement of the
deviation of observed protein codon-usage from codon-usage
in a randomly generated ORF. These distributions are both
skewed toward high positive values, typically greater than
0.25, signifying that their sequences deviate significantly
from that of ORFs derived from random codons; these are
thus likely to be true ORFs and not spurious predictions.
Figure 6b is a histogram of CEC for ORFs not observed in the
Ghaemmaghami et al. expression sets, and for all ORFs not
present in PeptideAtlas. Their distributions are evenly dis-
tributed around the origin, suggesting that both datasets are
missing bona fide ORFs as well as ORFs that are not likely to
code for proteins.
The proteins identified in the yeast PeptideAtlas are generally
evenly distributed with respect to Gene Ontology (GO)
molecular function categories (Figure 7). Interestingly, we
observe 52% of yeast ORFs annotated as 'molecular function
unknown'. If we filter out peptides that have been observed
only once in the PeptideAtlas, the percent of 'molecular func-
tion unknown' genes we see is 32% (approximately 659
genes). The same trend is seen in the GO 'cellular compo-
nents' and the GO 'biological processes' categories. Figures 8
and 9 show that a significant fraction of ORFs in PeptideAtlas
are present in the catgories 'cellular component unknown'
and 'biological process unknown'.
The S. cerevisiae PeptideAtlas, by verifying that these unan-
notated ORFs produce identifiable proteins, could stimulate
interest in determining their function.
PeptideAtlas user interface
Summary statistics and query interfaces for the PeptideAtlas
are available at [31]. Perl cgi-bin programs and Java servlets
and JSP pages enable public queries of the database and
public archive area flat files. From the PeptideAtlas front page
[31], atlas data may be accessed by links on the navigation
bar. The 'Data Repository' link leads to a form where the user
can retrieve all publicly available datasets and search results.
The 'Search Database' link leads to several pages where the
user can either search the atlas for keywords, find the infor-
mation summary for a given peptide in the atlas, or produce a
tailored list of peptides from the atlas by specifying a variety
of constraints.
The S. cerevisiae PeptideAtlas user interface thus allows for
an extremely large number of diverse tandem MS datasets to
be searched, processed, and combined in a user-specifiable
fashion.
Uses of the S. cerevisiae PeptideAtlas
The S. cerevisiae PeptideAtlas represents an extremely useful
data mining tool. Here, we present two examples of how the
database may be used. The first example demonstrates the
creation of a list for construction of synthetic peptides, and
the second example demonstrates validation of predicted
SGD introns.
Using quantitative MS techniques, synthetic peptides may be
utilized to determine subunit stoichiometry within a given
Cumulative number of MS/MS spectra versus the number of unique peptide identifications with P > 0.9Figure 5
Cumulative number of MS/MS spectra versus the number of unique
peptide identifications with P > 0.9. The slope is nearly horizontal in
regions of the curve where similar experiments were performed. The
curve is expected to show saturation when additional spectra provide no
new peptides above P > 0.9. The number of distinct peptides from an in
silico trypic digestion of the SGD protein database, allowing one missed
cleavage, and counting those peptides whose masses are in the range 500
to 4,000 Da, is 436,445.
0 1•10
6
2•10
6
3•10
6
4•10
6
5•10
6
Cumulative number of MS/MS spectra
0
10,000
20,000
30,000
40,000
Cumulative number of distinct peptides (P>0.9)
R106.12 Genome Biology 2006, Volume 7, Issue 11, Article R106 King et al. />Genome Biology 2006, 7:R106
multi-protein complex [32] or to determine the absolute
quantity of a protein in a sample [33,34]. To design such
peptides, one could use the S. cerevisiae PeptideAtlas to:
identify those peptides of member proteins that have been
observed most often in the mass spectrometer; identify those
that are specific for a single protein; and determine which of
these peptides contain amino acids necessary for a given type
of labeling reagent and suitable for peptide synthesis. For
example, if the stoichiometry of the general transcription fac-
tor TFIIF complex was to be determined, the user would go to
the PeptideAtlas URL [31], enter %tfIIf% into the search box
and select 'GO'. The results are links to PeptideAtlas pages
corresponding to the three SGD ORFs that are part of the
TFIIF transcription factor complex in this organism [35,36].
One may either follow the links to the individual pages for the
three ORFs, or open a new 'Browse Peptides' page using the
tab located near the top of the page to query the atlas in more
detail. In the new 'Browse Peptides' page, the user can enter
the three SGD ORFs into the 'Protein Name Constraint' text
box (separated by semi-colons: YPL129W; YGR186W;
YGR005C). Further useful constraints to enter are '>0.9' for
'Best Probability Constraint', '>1' for 'Number of Observa-
tions Constraint', and ' = 1' for 'Number of Proteins Mapped
Constraint'. Following selection of 'Query' near the bottom of
the page, results are returned below the form. To tailor the list
to ICAT experiments, one could also enter %C% in the 'Pep-
tide Sequence Constraint' text box above and select 'Query'
again. The returned list consists of five cysteine-containing
peptides whose sequences have been observed more than
once with high confidence, and which are present in only one
Comparison of codon enrichment correlation (CEC) distributionsFigure 6
Comparison of codon enrichment correlation (CEC) distributions. (a) Histogram of CEC for all ORFs listed in Ghaemmaghami et al. [14], for all ORFs
seen in PeptideAtlas (PA), and for all ORFs not seen in PeptideAtlas; and (b) histogram of CEC for ORFs not seen in the Ghaemmaghami et al. expression
sets and for all ORFs not seen in PeptideAtlas. Observed proteins in PeptideAtlas and in Ghaemmaghami et al. show a positive skew in CEC showing that
they deviate significantly from that expected from a random sequence of codons, while the unobserved proteins show more uniformly distributed CEC
values.
-1.0 -0.5 0.0 0.5 1.0
CEC
0
200
400
600
800
ORFs in bin
Ghaemmaghami
PA
not in PA
-1.0 -0.5 0.0 0.5 1.0
CEC
0
50
100
150
200
250
ORFs in bin
not in Ghaemmaghami
not in PA
(a) (b)
The number of genes identified in GO Molecular Function terms (more specifically, the first level children of molecular function)Figure 7
The number of genes identified in GO Molecular Function terms (more
specifically, the first level children of molecular function). The bars are
annotated with the number of SGD genes annotated in that term and the
number of SGD genes seen in PeptideAtlas for that term. Many annotated
as unknown are present in the PeptideAtlas.
0
20
40
60
80
100
120
140
% GO molecular function
Molecular function unknown
1107/ 2061
Signal transducer activity
42/ 61
Transporter activity
296/ 427
Transcription regulator activity
228/ 318
Motor activity
13/ 18
Enzyme regulator activity
128/ 175
Chaperone regulator activity
6/ 8
Binding
841/ 1053
Catalytic acti
vity
1583/ 1896
Antioxidant activity
17/ 20
Structural molecule activity
291/ 336
Translation regulator activity
51/ 57
Protein tag
9/ 9
Genome Biology 2006, Volume 7, Issue 11, Article R106 King et al. R106.13
comment reviews reports refereed researchdeposited research interactions information
Genome Biology 2006, 7:R106
protein. The resulting list may be exported to the user's desk-
top in Excel, xml, tsv, or csv file formats.
As an example of a bioinformatics use of the S. cerevisiae
PeptideAtlas, one could search for all experimentally
observed splice forms predicted in the SGD database that are
present in the S. cerevisiae PeptideAtlas. In this case, the user
would select 'Search Database' from the navigation bar on the
left, select the latest Saccharomyces atlas from the 'Atlas
Build' list, then in the text box 'Does Mapping Span Exons
Constraint' (which is to indicate that the peptide sequence is
aligned to the exons on both sides of an intron) enter 'y', and
select 'QUERY'. Rows of data are returned for the latest yeast
build. That list can be saved and compared against a list of
SGD introns to find that the atlas contains 13% of the 367 SGD
yeast ORF introns. Two of these intron validations are for
uncharacterized (experimentally unobserved) ORFs,
YPR063C and YBL059C-A. To visualize the resulting infor-
mation in the Ensembl Genome browser, the user may click
on the coordinates in the results table (instructions on
enabling the visualization are present on the navigation bar of
the PeptideAtlas web pages).
Reverse look-ups of PeptideAtlas peptides are also possible
from the Ensembl Genome browser website. For example,
while browsing the genome view centered around the unchar-
acterized ORF YNL010W at [37] one can select the S. cerevi-
siae PeptideAtlas as a distributed annotation system (DAS)
source, resulting in a large number of PeptideAtlas entries
confirming portions of this predicted ORF sequence. Select-
ing any of these links can bring the user back to the Peptide-
Atlas summary pages for more detail.
Conclusion
We have demonstrated that MS/MS spectra from a large
number of diverse sources can be uniformly processed and
combined to create a large dataset useful for exploring and
validating the yeast proteome. The public interfaces allow
creation of high quality peptide lists that can be used to syn-
thesize reference molecules for targeted proteomics. The
datasets are also useful to examine MS based proteomics in
general, can be used for software development, and can be
used by other researchers to validate hypothetical proteins for
examples. The S. cerevisiae PeptideAtlas possesses the high-
est degree of proteome coverage for any eukaryotic organism
to date in a single public database offering entire datasets as
validation, and, as such, is a growing resource that will con-
tinue to improve as more researchers contribute data.
The number of genes identified in GO Cellular Component terms (more specifically, the first level children)Figure 8
The number of genes identified in GO Cellular Component terms (more
specifically, the first level children). The bars are annotated with the
number of SGD genes and the number of SGD genes in PeptideAtlas for
that term. Many annotated as unknown are present in the PeptideAtlas.
0
20
40
60
80
100
120
140
% GO Cellular component term
Cellular component unknown
310/ 866
Extracellular region
12/ 19
Envelope
205/ 302
Cell
3751/ 4894
Organelle
2826/ 3683
Protein complex
1131/ 1379
Membrane-enclosed lumen
589/ 681
The number of genes identified in GO Biological Process terms (more specifically, the first level children)Figure 9
The number of genes identified in GO Biological Process terms (more
specifically, the first level children). The bars are annotated with the
number of SGD genes and the number of SGD genes in PeptideAtlas for
that term.
0
20
40
60
80
100
120
140
% GO Biological process term
Biological process unknown
736/ 1434
Reproduction
189/ 260
Interaction between organisms
84/ 115
Regulation of biological process
447/ 603
Growth
94/ 125
Development
290/ 383
Cellular process
3268/ 4241
Physiological process
3277/ 4247
Response to stimulus
428/ 551
R106.14 Genome Biology 2006, Volume 7, Issue 11, Article R106 King et al. />Genome Biology 2006, 7:R106
Materials and methods
Experiment processing
Some of the process level details of the experiment processing
are provided here. The mzXML [20] conversions from vendor
format files to mzXML files were performed using software
available at our Sashimi software site [38]. The SEQUEST
parameters used in MS/MS assignment were for semi-tryptic
digestion and one static modification of methionine due to
oxidation. Additional parameters were required for some
datasets, such as those labeled with ICAT or samples treated
with iodoacetemide. All sequest.params files can be found in
the searched archive files at our repository [39] for the public
datasets. (Datasets that researchers have requested to be kept
as private until they have published are not present in the
data repository, but are included in the PeptideAtlas database
with minimum sample annotation.)
The PeptideProphet software is available at our Sashimi soft-
ware site [23]. The SBEAMS database application and the
Proteomics module and PeptideAtlas modules within it are
available at our SBEAMS software site [40] as downloads
from a subversion code repository. The code is browsable
from the worldwide web [41]. The BLAST algorithm was used
with the parameters for 100% identity matches to a small
peptide in a protein reference database:
blastp -F F -W 2 -M PAM30 -G 9 -E 1 -e 10 -K 50 -b 50
Additional data files
The following additional data are available with the online
version of this paper. Additional data file 1 is a comma-sepa-
rated text file containing a table of S. cerevisiae ORF fasta
files used to create the reference database. The table includes
the ftp addresses of the datasets and the number of ORFs
unique to each dataset. Additional data file 2 is a comma-sep-
arated text file containing a table of the uncharacterized ORFs
seen in S. cerevisiae PeptideAtlas. Included are the number of
times their peptides were observed and the best Peptide-
Prophet probability associated with their peptides. Additional
data file 3 is a comma-separated text file containing a table of
the dubious ORFs seen in S. cerevisiae PeptideAtlas.
Included are the number of times their peptides were
observed, and the best PeptideProphet probability associated
with their peptides. Additional data file 4 is a comma-sepa-
rated text file containing a table of the ORFs from transposa-
ble element genes seen in S. cerevisiae PeptideAtlas, the
number of times their peptides were observed, and the best
PeptideProphet probability associated with their peptides.
Additional data file 1S. cerevisiae ORF fasta files used to create the reference databaseA comma-separated text file. The table includes the ftp addresses of the datasets and the number of ORFs unique to each dataset.Click here for fileAdditional data file 2Uncharacterized ORFs seen in S. cerevisiae PeptideAtlasA comma-separated text file. Included are the number of times their peptides were observed and the best PeptideProphet proba-bility associated with their peptides.Click here for fileAdditional data file 3Dubious ORFs seen in S. cerevisiae PeptideAtlasA comma-separated text file. Included are the number of times their peptides were observed, and the best PeptideProphet proba-bility associated with their peptides.Click here for fileAdditional data file 4ORFs from transposable element genes seen in S. cerevisiae Pepti-deAtlasA comma-separated text file. Included are the number of times their peptides were observed, and the best PeptideProphet proba-bility associated with their peptides.Click here for file
Acknowledgements
The research reported in this article was supported in part by contract No.
N01-HV-28179 from the National Heart, Lung, and Blood Institute. We
thank Olga Vitek and Julian Watts for their advice and consultation. We
thank Steve Stein (NIST) and are grateful to all of the researchers who have
made their datasets publicly available, specifically, Marcello Marelli and col-
laborators (ISB), Peng Lu (OPD, University of Texas), P Haynes and collab-
orators (University of Arizona), KR Serikawa and collaborators (University
of Washington), S Gygi and collaborators (Harvard Medical School), Ho and
collaborators (MDS Proteomics, Samuel Lunenfeld Research Institute, Uni-
versity of Toronto, Kings College Circle), and Trey Ideker (ISB).
References
1. Sonenberg N, Hershey WB, Mathews MB: Translational Control of Gene
Expression (Cold Spring Harbor Monograph) Cold Spring Harbor: Cold
Spring Harbor Laboratory Press; 2001.
2. Hershko A, Ciechanover A: The ubiquitin system. Annu Rev
Biochem 1998, 67:425-479.
3. Pickart CM: Mechanisms underlying ubiquitination. Annu Rev
Biochem 2001, 70:503-533.
4. Dreger M: Subcellular proteomics. Mass Spectrom Rev 2003,
22:27-56.
5. Washburn MP, Wolters D, Yates JR 3rd: Large-scale analysis of
the yeast proteome by multidimensional protein
identification technology. Nat Biotechnol 2001, 19:242-247.
6. Gavin AC, Aloy P, Grandi P, Krause R, Boesche M, Marzioch M, Rau
C, Jensen LJ, Bastuck S, Dumpelfeld B, et al.: Proteome survey
reveals modularity of the yeast cell machinery. Nature 2006,
440:631-636.
7. Gruhler A, Olsen JV, Mohammed S, Mortensen P, Faergeman NJ,
Mann M, Jensen ON: Quantitative phosphoproteomics applied
to the yeast pheromone signaling pathway. Mol Cell Proteomics
2005, 4:310-327.
8. Jensen ON: Modification-specific proteomics: characteriza-
tion of post-translational modifications by mass
spectrometry. Curr Opin Chem Biol 2004, 8:33-41.
9. Gingras AC, Aebersold R, Raught B: Advances in protein com-
plex analysis using mass spectrometry. J Physiol 2005,
563:11-21.
10. Gygi SP, Rist B, Gerber SA, Turecek F, Gelb MH, Aebersold R: Quan-
titative analysis of complex protein mixtures using isotope-
coded affinity tags. Nat Biotechnol 1999, 17:994-999.
11. Blagoev B, Kratchmarova I, Ong SE, Nielsen M, Foster LJ, Mann M: A
proteomics strategy to elucidate functional protein-protein
interactions applied to EGF signaling. Nat Biotechnol 2003,
21:315-318.
12. Brand M, Ranish JA, Kummer NT, Hamilton J, Igarashi K, Francastel
C, Chi TH, Crabtree GR, Aebersold R, Groudine M: Dynamic
changes in transcription factor complexes during erythroid
differentiation revealed by quantitative proteomics. Nat
Struct Mol Biol 2004, 11:73-80.
13. Von Haller PD, Yi E, Donohoe S, Vaughn K, Keller A, Nesvizhskii AI,
Eng J, Li XJ, Goodlett DR, Aebersold R, Watts JD: The application
of new software tools to quantitative protein profiling via
isotope-coded affinity tag (ICAT) and tandem mass spec-
trometry: I. Statistically annotated datasets for peptide
sequences and proteins identified via the application of ICAT
and tandem mass spectrometry to proteins copurifying with
T cell lipid rafts. Mol Cell Proteomics 2003, 2:426-427.
14. Ghaemmaghami S, Huh WK, Bower K, Howson RW, Belle A,
Dephoure N, O'Shea EK, Weissman JS: Global analysis of protein
expression in yeast. Nature 2003, 425:737-741.
15. Huh WK, Falvo JV, Gerke LC, Carroll AS, Howson RW, Weissman
JS, O'Shea EK: Global analysis of protein localization in bud-
ding yeast. Nature 2003, 425:686-691.
16. Krogan NJ, Cagney G, Yu H, Zhong G, Guo X, Ignatchenko A, Li J, Pu
S, Datta N, Tikuisis AP, et al.: Global landscape of protein com-
plexes in the yeast Saccharomyces cerevisiae. Nature 2006,
440:637-643.
17. Desiere F, Deutsch EW, King NL, Nesvizhskii AI, Mallick P, Eng J,
Chen S, Eddes J, Loevenich SN, Aebersold R: The PeptideAtlas
project. Nucleic Acids Res 2006, 34:D655-658.
18. Desiere F, Deutsch EW, Nesvizhskii AI, Mallick P, King NL, Eng JK,
Aderem A, Boyle R, Brunner E, Donohoe S, et al.: Integration with
the human genome of peptide sequences obtained by high-
throughput mass spectrometry. Genome Biol 2005, 6:R9.
19. Deutsch EW, Eng JK, Zhang H, King NL, Nesvizhskii AI, Lin B, Lee H,
Yi EC, Ossola R, Aebersold R: Human plasma PeptideAtlas. Pro-
teomics 2005, 5:3497-3500.
20. Pedrioli PG, Eng JK, Hubley R, Vogelzang M, Deutsch EW, Raught B,
Pratt B, Nilsson E, Angeletti RH, Apweiler R, et al.: A common open
representation of mass spectrometry data and its
Genome Biology 2006, Volume 7, Issue 11, Article R106 King et al. R106.15
comment reviews reports refereed researchdeposited research interactions information
Genome Biology 2006, 7:R106
application to proteomics research. Nat Biotechnol 2004,
22:1459-1466.
21. Eng JK, McCormack AL, Yates JR 3rd: An approach to correlate
tandem mass spectral data of peptides with amino acid
sequences in a protein database. J Am Soc Mass Spectrom 1994,
5:976-989.
22. Keller A, Nesvizhskii AI, Kolker E, Aebersold R: Empirical
statistical model to estimate the accuracy of peptide identi-
fications made by MS/MS and database search. Anal Chem
2002, 74:5383-5392.
23. Keller A, Eng J, Zhang N, Li XJ, Aebersold R: A uniform proteom-
ics MS/MS analysis platform utilizing open XML file formats.
Mol Syst Biol 2005, 1:2005.0017.
24. Altschul SF, Gish W, Miller W, Myers EW, Lipman DJ: Basic local
alignment search tool. J Mol Biol 1990, 215:403-410.
25. Generic Feature Format Version 3. [rce
forge.net/gff3.shtml]
26. Nesvizhskii AI, Aebersold R: Interpretation of shotgun pro-
teomic data: the protein inference problem. Mol Cell
Proteomics 2005, 4:1419-1440.
27. Nesvizhskii AI, Keller A, Kolker E, Aebersold R: A statistical model
for identifying proteins by tandem mass spectrometry. Anal
Chem 2003, 75:4646-4658.
28. Guo D: Prediction of peptide retention times in reversed-
phase high-performance liquid chromatography I. Determi-
nation of retention coefficients of amino acid residues of
model synthetic peptides. J Chromatography A 1986, 359:499-518.
29. Krokhin OV, Craig R, Spicer V, Ens W, Standing KG, Beavis RC,
Wilkins JA: An improved model for prediction of retention
times of tryptic peptides in ion pair reversed-phase HPLC:
its application to protein peptide mapping by off-line HPLC-
MALDI MS. Mol Cell Proteomics 2004, 3:908-919.
30. Ho Y, Gruhler A, Heilbut A, Bader GD, Moore L, Adams SL, Millar A,
Taylor P, Bennett K, Boutilier K,
et al.: Systematic identification
of protein complexes in Saccharomyces cerevisiae by mass
spectrometry. Nature 2002, 415:180-183.
31. PeptideAtlas. []
32. Ranish JA, Yi EC, Leslie DM, Purvine SO, Goodlett DR, Eng J, Aeber-
sold R: The study of macromolecular complexes by quantita-
tive proteomics. Nat Genet 2003, 33:349-355.
33. Gerber SA, Rush J, Stemman O, Kirschner MW, Gygi SP: Absolute
quantification of proteins and phosphoproteins from cell
lysates by tandem MS. Proc Natl Acad Sci USA 2003,
100:6940-6945.
34. Lu Y, Bottari P, Turecek F, Aebersold R, Gelb MH: Absolute quan-
tification of specific proteins in complex mixtures using visi-
ble isotope-coded affinity tags. Anal Chem 2004, 76:4104-4111.
35. Myer VE, Young RA: RNA polymerase II holoenzymes and
subcomplexes. J Biol Chem 1998, 273:27757-27760.
36. Rani PG, Ranish JA, Hahn S: RNA polymerase II (Pol II)-TFIIF
and Pol II-mediator complexes: the major stable Pol II com-
plexes and their activity in transcription initiation and
reinitiation. Mol Cell Biol 2004, 24:1709-1720.
37. Ensembl: S. cerevisiae Contig View. [ />Saccharomyces_cerevisiae/contigview?c=XIV:614000.5;w=100]
38. Sashimi. []
39. PeptideAtlas Data Repository. [ />repository]
40. Systems Biology Experiment Analysis Management System.
[]
41. SBEAMS CVS Trunk. [ />viewcvs.cgi/sbeams/trunk/]
42. Ideker T, Thorsson V, Ranish JA, Christmas R, Buhler J, Eng JK, Bum-
garner R, Goodlett DR, Aebersold R, Hood L: Integrated genomic
and proteomic analyses of a systematically perturbed meta-
bolic network. Science 2001, 292:929-934.
43. MacKay VL, Li X, Flory MR, Turcott E, Law GL, Serikawa KA, Xu XL,
Lee H, Goodlett DR, Aebersold R, et al.: Gene expression ana-
lyzed by high-resolution state array analysis and quantitative
proteomics: response of yeast to mating pheromone.
Mol Cell
Proteomics 2004, 3:478-489.
44. Prince JT, Carlson MW, Wang R, Lu P, Marcotte EM: The need for
a public proteomics repository. Nat Biotechnol 2004, 22:471-472.
45. Marelli M, Smith JJ, Jung S, Yi E, Nesvizhskii AI, Christmas RH, Saleem
RA, Tam YY, Fagarasanu A, Goodlett DR, et al.: Quantitative mass
spectrometry reveals a role for the GTPase Rho1p in actin
organization on the peroxisome membrane. J Cell Biol 2004,
167:1099-1112.
46. Serikawa KA, Xu XL, MacKay VL, Law GL, Zong Q, Zhao LP, Bum-
garner R, Morris DR: The transcriptome and its translation
during recovery from cell cycle arrest in Saccharomyces
cerevisiae. Mol Cell Proteomics 2003, 2:191-204.
47. Peng J, Elias JE, Thoreen CC, Licklider LJ, Gygi SP: Evaluation of
multidimensional chromatography coupled with tandem
mass spectrometry (LC/LC-MS/MS) for large-scale protein
analysis: the yeast proteome. J Proteome Res 2003, 2:43-50.
48. Breci L, Hattrup E, Keeler M, Letarte J, Johnson R, Haynes PA: Com-
prehensive proteomics in yeast using chromatographic frac-
tionation, gas phase fractionation, protein gel
electrophoresis, and isoelectric focusing. Proteomics 2005,
5:2018-2028.
49. Maynard DM, Masuda J, Yang X, Kowalak JA, Markey SP: Character-
izing complex peptide mixtures using a multi-dimensional
liquid chromatography-mass spectrometry system: Saccha-
romyces cerevisiae as a model system. J Chromatogr B Analyt Tech-
nol Biomed Life Sci 2004, 810:69-76.