Báo cáo y học: "Systematic screening of polyphosphate (poly P) levels in yeast mutant cells reveals strong interdependence with primary metabolism" potx
Bạn đang xem bản rút gọn của tài liệu. Xem và tải ngay bản đầy đủ của tài liệu tại đây (539.15 KB, 9 trang )
Genome Biology 2006, 7:R109
comment reviews reports deposited research refereed research interactions information
Open Access
2006Freimoseret al.Volume 7, Issue 11, Article R109
Research
Systematic screening of polyphosphate (poly P) levels in yeast
mutant cells reveals strong interdependence with primary
metabolism
Florian M Freimoser
*
, Hans Caspar Hürlimann
*
, Claude A Jakob
†
,
Thomas P Werner
*
and Nikolaus Amrhein
*
Addresses:
*
Institute of Plant Sciences, ETH Zurich, 8092 Zurich, Switzerland.
†
Institute of Microbiology, ETH Zurich, Zurich, Switzerland.
Correspondence: Florian M Freimoser. Email:
© 2006 Freimoser et al.; licensee BioMed Central Ltd.
This is an open access article distributed under the terms of the Creative Commons Attribution License ( which
permits unrestricted use, distribution, and reproduction in any medium, provided the original work is properly cited.
Polyphosphate metabolism in yeast<p>A systematic analysis of polyphosphate levels in yeast knockout strains for almost every non-essential gene identified 255 genes involved in the maintenance of normal polyphosphate content and provides insights into phosphate homeostasis.</p>
Abstract
Background: Inorganic polyphosphate (poly P) occurs universally in all organisms from bacteria
to man. It functions, for example, as a phosphate and energy store, and is involved in the activation
and regulation of proteins. Despite its ubiquitous occurrence and important functions, it is unclear
how poly P is synthesized or how poly P metabolism is regulated in higher eukaryotes. This work
describes a systematic analysis of poly P levels in yeast knockout strains mutated in almost every
non-essential gene.
Results: After three consecutive screens, 255 genes (almost 4% of the yeast genome) were found
to be involved in the maintenance of normal poly P content. Many of these genes encoded proteins
functioning in the cytoplasm, the vacuole or in transport and transcription. Besides reduced poly P
content, many strains also exhibited reduced total phosphate content, showed altered ATP and
glycogen levels and were disturbed in the secretion of acid phosphatase.
Conclusion: Cellular energy and phosphate homeostasis is suggested to result from the
equilibrium between poly P, ATP and free phosphate within the cell. Poly P serves as a buffer for
both ATP and free phosphate levels and is, therefore, the least essential and consequently most
variable component in this network. However, strains with reduced poly P levels are not only
affected in their ATP and phosphate content, but also in other components that depend on ATP
or free phosphate content, such as glycogen or secreted phosphatase activity.
Background
Inorganic polyphosphate (poly P) is a linear polymer that
consists of phosphoanhydride linked phosphate residues and
occurs ubiquitously in all organisms and living cells [1]. The
functions of poly P range from its role as a phosphate store
and buffer [2-4] to the activation of enzymes [5,6] and regu-
lation of chromatin condensation, gene expression and trans-
lation [1,7,8]. Poly P is also involved in bacterial pathogenicity
[9,10], survival during stationary phase in bacteria and yeast
[9,11,12], or the adaptation to alkaline and osmotic stress
Published: 15 November 2006
Genome Biology 2006, 7:R109 (doi:10.1186/gb-2006-7-11-r109)
Received: 2 August 2006
Revised: 4 October 2006
Accepted: 15 November 2006
The electronic version of this article is the complete one and can be
found online at />R109.2 Genome Biology 2006, Volume 7, Issue 11, Article R109 Freimoser et al. />Genome Biology 2006, 7:R109
[13-15]. In the slime mold Dictyostelium discoideum, poly P
regulates development and predation behavior [16], and in
humans blood coagulation is accelerated and fibrinolysis is
delayed by poly P [17]. At the cellular level, poly P has been
detected in the cytosol, the nucleus, mitochondria, as well as
the endoplasmic reticulum [7,18,19]. Poly P is particularly
prominent in the acidocalcisomes of trypanosomatids [20],
and in Saccharomyces cerevisiae almost the entire poly P
pool resides in the vacuole [21,22].
Despite its universal occurrence and its broad functions, very
little is known about poly P metabolism and its regulation. In
S. cerevisiae (and all higher eukaryotes) it is, for example, still
not known how poly P is synthesized, despite the fact that
more than 20% of this organism's dry weight can be com-
posed of poly P [1]. To gain a broad view of poly P metabolism
in yeast and to identify pathways involved in the regulation of
poly P levels, we extracted and quantified poly P in the knock-
out strains of almost all non-essential yeast genes.
Results
Altogether, 4,765 strains from the YKO collection [23], con-
sisting of knockouts of non-essential yeast genes, were ini-
tially screened. Strains that either hypo- or hyper-
accumulated poly P were subjected to three consecutive
rounds of screening. After the third round, 255 strains from
the YKO collection had altered poly P levels in all three exper-
iments (a complete list of all data is available online as Addi-
tional data file 1). Almost all of these 255 strains had reduced
poly P levels and only occasionally, at specific time-points
during growth, poly P hyper-accumulation relative to the
wild-type strain was observed.
All cellular compartments are involved in maintenance
of poly P levels
All 255 discovered genes were categorized with the Gene
Ontology (GO) Slim terminology and significantly overrepre-
sented terms (relative to their occurrence in the whole yeast
genome) were determined (Figure 1a-c). The cellular com-
partments with the highest number of proteins important for
poly P content were the cytoplasm (59 proteins), the nucleus
(56 proteins), the mitochondrion and the mitochondrial
envelope (33 and 9 proteins, respectively), the vacuole (20
proteins) and the endoplasmic reticulum (13 proteins) (Fig-
ure 1a). Other genes found to be important for poly P content
encoded membrane and ribosomal proteins (12 and 11 pro-
teins, respectively) or proteins functioning in the Golgi appa-
ratus (5 proteins), the peroxisome or the cell wall (4 proteins
each) (Figure 1a). But only the terms 'vacuole' and 'mem-
brane' were significantly overrepresented in the 255 genes
that were found to be important for the maintenance of poly
P levels. The representation of cellular compartments was
also reflected in the highly overrepresented biological and
molecular function terms: transport and vesicle mediated
transport (36 and 22 proteins, respectively), transcription (16
proteins) and cell homeostasis (2 proteins) for biological
function terms; and transporter activity (30 proteins) as the
only significantly overrepresented molecular function term
(Figure 1b,c). Other proteins encoded by the identified genes
participate in biological processes such as organelle and cell
wall organization and biogenesis (24 and 10 proteins, respec-
tively), protein biosynthesis and modification (17 and 12 pro-
teins, respectively), DNA and RNA metabolism (10 and 7
proteins, respectively) or are involved in the response to
stress (11 proteins). Additional molecular functions that were
prevalent among the discovered proteins included activities
of hydrolases, transferases, transcription regulators and
structural molecules (18, 17, 16 and 14 proteins, respectively)
or protein and DNA binding proteins (15 and 8 proteins,
respectively) (Figure 1c).
Vacuolar proteins are most important in determining
poly P levels
All 255 genes were ranked according to their impact on poly P
content. The mutant cells most strongly affected in their poly
P content were highly enriched for knockouts of genes that
encode vacuolar proteins (6 out of the 20 vacuolar proteins
among the 10 most strongly affected mutants). Vacuolar func-
tion depends on the acidification of the vacuolar lumen,
which is mediated by the vacuolar H
+
-ATPase (V-ATPase)
complex. In this poly P screen, 9 out of the 14 V-ATPase sub-
units were required for normal poly P content (Vma5 (14),
Vma8 (10), Vma10 (13), Vma13 (34), Vph1 (1), Cup5 (5), Tfp3
(15), Ppa1 (20), Vma6 (27); ranks given in parentheses). In
addition, regulators (Rav1 (43), Vps34 (30), Fab1 (150) and
Vac14 (213)) and assembly factors (Vma22 (16), Vph2 (23)) of
the V-ATPase were also discovered as being important for
normal poly P levels.
Next to the VPH1 knockout, the VTC4 and VTC1 deletion
strains were the second and third most affected mutants, and
the knockout of VTC2 also hypo-accumulated poly P (rank
219). Together with Vtc3, these are the four subunits of the
vacuolar transporter chaperon (Vtc) complex, which was pre-
viously shown to be required for maintenance of poly P levels
[3]. Other proteins involved in the hypo-accumulation of poly
P are involved in membrane docking and fusion at the Golgi-
to-endosome and the endosome-to-vacuole steps (Vps33,
ninth most affected mutant), or represent an alternative path-
way from the Golgi to the vacuole (effected by the AP-3 com-
plex that consists of Apm3, Apl5, Apl6 and Aps3; ranks 21, 59,
57 and 55, respectively). Vam3, a vacuolar t-SNARE protein
that traffics to the vacuole via the AP-3 complex [24], was also
important for maintenance of poly P levels (rank 8).
In other strongly affected strains, genes encoding either of the
two phosphofructokinase subunits (PFK1 and PFK2, ranks 28
and 17) or the pyruvate kinase PYK2 (rank 7) were knocked
out. In three additional strains, other components of glycoly-
sis were identified (GCR2, GPM3, YOR283W; 63, 201 and
181, respectively).
Genome Biology 2006, Volume 7, Issue 11, Article R109 Freimoser et al. R109.3
comment reviews reports refereed researchdeposited research interactions information
Genome Biology 2006, 7:R109
Poly P profiles of the identified mutant strains
For the 255 discovered strains poly P data from six different
experiments/time-points were available: the first and second
screen (performed at the 4 h time-point) and the four samples
from the third screen (2 h, 4 h, 8 h and 24 h samples). Hier-
archical clustering of the six experiments with all log
2
-trans-
formed poly P data revealed that the 4 h samples of the three
experiments grouped together (Figure 2d). The 2 h time-
point was more similar to the 4 h time-point than to the 8 h
and 24 h samples (Figure 2). Clustering of the genes resolved
distinct groups of genes with similar poly P patterns. One
cluster of genes (Figure 2, cluster 1) comprised seven genes
that caused elevated poly P levels at the 2 h and 4 h time-
points when deleted. Three of the seven genes in this cluster
(KRE1, ECM33 and RIM21) encode proteins that function in
cell wall biosynthesis or organization, but no GO Slim cate-
gory was significantly enriched in this cluster (Figure 2a). In
two other clusters (Figure 2, clusters 2 and 4) the relative poly
P content was, on average, minimal at the 4 h time-point and
higher at 2 h and 24 h (Figure 2b). Cluster 2 was significantly
enriched (compared to the complete genome) in cytoplasmic
and mitochondrial proteins and in proteins functioning in
organelle organization and biogenesis (Figure 2a). The mito-
chondrial proteins in cluster 2 comprised, for example, a
mitochondrial phosphate transporter (Mir1) or three mito-
chondrial ribosomal proteins (Mrpl33, Mrp51 and Mrpl27).
Cluster 4 contained the genes that caused the most dramatic
effect on poly P levels when deleted: 22 genes in this cluster
(out of a total of 39) were among the 30 most important genes
for the maintenance of poly P levels. This group of genes also
included six of the nine V-ATPase subunits (Vma8, Ppa1,
Cup5, Vma10, Vph1, Vma5) that we discovered and many
additional components of the vacuole. Correspondingly, this
cluster was significantly enriched in vacuolar, membrane and
cytoplasmic proteins that are involved in transport, cell
homeostasis and vesicle mediated transport or exhibit trans-
porter or hydrolase activity (Figure 2a). In the distinct cluster
3, membrane proteins that function in transport were also
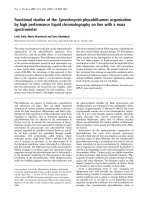
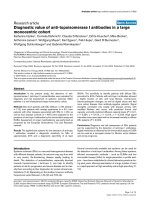
All cellular compartments are involved in the maintenance of poly P levelsFigure 1
All cellular compartments are involved in the maintenance of poly P levels. Categorization of the 255 genes important for poly P levels by using the GO
Slim terminology to: (a) cellular component, (b) a biological process and (c) a molecular function. Categories that were significantly overrepresented (P ≤
0.05; red bars) are marked by an asterisk. Only the 15 most abundant categories are shown (all other genes are summarized as 'other').
02040
(a) Cellular component (b) Biological process
Number of genes
per category
Number of genes
per category
03060
02060
Number of genes
per category
Unknow n
*Transporter act.
Hydrolas e act.
Transferase act.
Transcript. reg. act
Protein binding
Structural mol. act.
DNA binding
Ligase act.
Oxidoreductase act.
Protein kinase act.
Translation reg . act.
Enzyme reg. act.
Peptidase act.
Signal transducer act.
Other
//
//
Cytoplasm
Nucleus
Mitochondrion
*Vacuole
ER
*Membrane
Unknown
Ribsome
Mitochond. envelope
Endomembrane sys.
Golgi apparatus
Cell w all
Nucleolous
Peroxisome
PM
Other
*Transport
Unknow n
*Transcription
*Vesicle-mediated transport
Protein biosynthesis
Response to stress
Protein modification
DNA metabolism
Meiosis
Cell wall org. & biogen.
Membrane org. & biogen.
RNA metabolism
Sporulation
Lipid metabolis m
Other
Organelle org. & biogen.
-
.
.
(c) Molecular function
R109.4 Genome Biology 2006, Volume 7, Issue 11, Article R109 Freimoser et al. />Genome Biology 2006, 7:R109
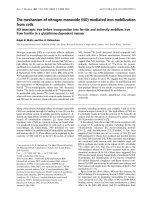
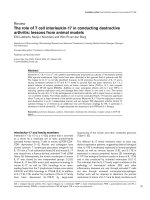
Clustering of all 255 genes found in this poly P screen resolved distinct groups with similar poly P profilesFigure 2
Clustering of all 255 genes found in this poly P screen resolved distinct groups with similar poly P profiles. (a) Hierarchical clustering (uncentered Pearson
correlation, complete linkage) of all log
2
-transformed data (relative to the wild-type). Clusters significantly enriched (P ≤ 0.05) for any GO Slim category
are marked by colored bars and branches. (b) Average poly P values (log
2
-transformed, relative to the wild type) for all genes in the four distinct clusters
in (a) at the four time-points.
2
Cell. component: cytoplasm, mitochondrium
Biol . process : organelle org. & biogen.
Cell. component : vacuole, membrane, cytoplasm
Biol . process : transport, cell homeostasis, vesicle
mediated transport
Mol. function : transporter act., hydrolase act.
-3.0 3.00
Poly P ratio (log
2
)
-3.0 3.00-3.0 3.00
Poly P ratio (log
2
)
2h
1
st
screen (4h)
2
nd
screen (4h)
4h
8h
24h
Cell. component: membrane
Biol . process : transport
-4
-3
-2
-1
0
1
2h 4h 8h 24h
Relative poly P content (log
2
)
Cluster 1
Cluster 2
Cluster 3
Cluster 4
3
(a)
(b)
1
4
Genome Biology 2006, Volume 7, Issue 11, Article R109 Freimoser et al. R109.5
comment reviews reports refereed researchdeposited research interactions information
Genome Biology 2006, 7:R109
significantly overrepresented, but, on average, the relative
poly P content varied only slightly or even increased during
growth of the corresponding deletion strains (Figure 2b).
Many strains with altered poly P levels are also affected
in their total phosphate content, ATP levels, acid
phosphatase activity and glycogen accumulation
Comparison of the 255 non-essential ORFs found to be
important for poly P content with the results from published
large scale analyses revealed that 56 strains were also affected
in glycogen accumulation [25], but that only 4 strains with
reduced poly P levels had previously been found in a screen
for altered PHO5 (acid phosphatase (rAPase)) regulation,
which serves as an indicator of the activation state of the PHO
pathway [26,27]. To verify the data from the screen, and to
test if a poly P phenotype is accompanied by other complex
phenotypes, we measured cell density, poly P levels, total
phosphate content, ATP concentrations, glycogen levels and
rAPase activity in the 30 most affected knockout strains.
Overall, cell density and ATP content were the least affected
characteristics, poly P and total phosphate content were gen-
erally reduced, and glycogen levels and rAPase activity were
increased (Figure 3).
Cell density was slightly reduced (to roughly half the OD
600
)
in most strains, but only at the 2 h and 5 h time-points (Figure
3). Poly P content and total phosphate levels were strongly
reduced in all 30 non-essential mutants except in the knock-
out of TFP3 (only slightly reduced poly P and total phosphate
levels) and the Δecm14, Δmrp51,Δapm3 and Δsir3 strains had
almost normal content of total phosphate (Figure 3). The ATP
levels exhibited the highest variability at the 0 h time-point,
with a cluster of knockouts having an increased content
(knockouts of ERG6, VTC4, VTC1, PYK2, VPH1, CUP5 and
ECM14). Strongly reduced ATP levels were only measured in
the knockouts of the dubious open reading frame (ORF)
YPR099c and the uncharacterized ORF YOL019w (Figure 3).
Almost all of the 30 knockouts hyper-accumulated glycogen,
either at the 2 h or the 0 h and 24 h time-points. An exception
was again the mutation in the dubious ORF YPR099c, which
had undetectable glycogen levels at the 0 h and 2 h time-
points (which could be explained by the effect on MRPL51,
which is encoded on the opposite strand). Most of the 30
knockout mutants also exhibited strongly increased rAPase
activity at the 0 h and 24 h time-points. Exceptions were only
the knockouts of ECM14, VTC4, VTC1 and VAM3 (Figure 3).
Discussion
Previous to the screen described here, only very few yeast
mutant cells had been analyzed with respect to their poly P
content and, to our knowledge, this is the first time that a
specific metabolite, that is, poly P, was isolated and quantified
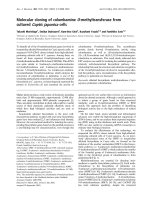
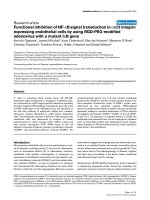
Many strains with altered poly P levels are also affected in their total phosphate content, ATP levels, rAPase activity and glycogen accumulationFigure 3
Many strains with altered poly P levels are also affected in their total phosphate content, ATP levels, rAPase activity and glycogen accumulation. All
measurements (OD
600
, total phosphate content, ATP levels, rAPase activity and glycogen content) in the 30 strains most affected in their poly P levels are
given relative to the wild type (log
2
-transformed). The data were hierarchically clustered (uncentered Pearson correlation, average linkage).
ypr099c
reg1
vma22
vps33
ykl118w
vma8
vma10
vma5
yol019w
tfp3
pfk2
pfk1
ecm14
mrp5 1
apm3
sir3
ppa1
pep5
vph2
vma6
tat2
erg6
vtc4
vtc1
pyk2
vph1
cup5
vam3
ypt7
vps34
0 2 5 24 0 2 5 24 0 2 5 24 0 2 5 24 0 2 5 24 0 2 5 24
Time [h] Time [h] Time [h] Time [h] Time [h] Time [h]
OD
600
Poly P Pi
tot
ATP Glycogen rAPase
-2.0 2.00
Ratio (log
2
)
-2.0 2.00
Ratio (log
2
)
-2.0 2.00-2.0 2.00
R109.6 Genome Biology 2006, Volume 7, Issue 11, Article R109 Freimoser et al. />Genome Biology 2006, 7:R109
in an almost complete mutant cell collection. After three
consecutive screens, 255 knockout mutant strains with
altered poly P levels were identified. The genes affected in
these mutant cells encode proteins from all intracellular com-
partments and components functioning in many processes of
primary metabolism. This broad analysis thus defined novel
biological functions for about 250 yeast genes and allowed,
for the first time, a global view of the pathways and processes
affecting poly P metabolism in yeast. But not only were many
genes required for the maintenance of a normal poly P con-
tent, strains that hypo- or hyper-accumulated poly P had
often a reduced total phosphate content, altered ATP and gly-
cogen levels and an up-regulated rAPase secretion. From this
analysis we conclude that poly P content is an extremely sen-
sitive parameter that is highly intertwined with primary
metabolism.
However, the number of knockout mutant cells with reduced
poly P levels was probably even underestimated: Several of
the few mutants previously identified to hypo-accumulate
poly P were not found in this screen. For example, the knock-
outs of VMA4, VTC3, ARG82 or KCS1 were not discovered, as
well as all knockouts of members of the PHO pathway (PHO3,
PHO4 or, for example, PHO84), which have been shown to
convey hypo-accumulation of poly P [3,26,28]. This is an
indication of the stringency of the screening conditions and
selection criteria and suggests that the true number of non-
essential genes involved in poly P metabolism is even higher
than the 255 genes reported here. The reliability of the high-
throughput screening procedure was also confirmed by the
fact that all 30 strains from the YKO collection that were indi-
vidually tested indeed showed strongly reduced poly P levels.
Although poly P has been observed in and functions in differ-
ent organelles [7,18,19,29], 90% to 99% of all poly P is local-
ized in the vacuole [1,21,22]. Consequently, we measure
almost exclusively vacuolar poly P and the proteins from
other organelles that were found in this screen must affect
vacuolar poly P levels. Poly P storage is thus a central function
of the yeast vacuole and, thus, mutants affected in vacuolar
functions or morphology are likely to be impaired in their
capability to store polyP. Important vacuolar functions
include the maturation and activation of different proteins
and physiological functions in the storage of metabolites and
in cell homeostasis [30-32] that all depend on the V-ATPase.
This large multimeric, partly membrane-embedded complex
is conserved from yeast to man and is also relevant in human
diseases such as osteopetrosis and distal renal tubular acido-
sis [33,34]. In this screen, nine subunits of the V-ATPase and
several of its regulators were identified. In addition, V-
ATPase activity is also glucose regulated; in the presence of
glucose, the V-ATPase is functional while the absence of glu-
cose causes reversible dissociation of the V0 and V1 subunits
and thus V-ATPase is inactivated [35]. This phenomenon
could explain the decline of poly P levels as soon as the growth
medium is depleted for glucose [36]. However, based on these
data it is impossible to conclude whether V-ATPase activity
regulates poly P levels directly or indirectly. As poly P levels
in a VMA4 knockout strain could be slightly restored by
growing the cells in acid buffered growth medium, Ogawa et
al. [3] concluded that V-ATPase itself was not essential for
poly P metabolism. Instead, these authors suggested that the
Vtc complex (consisting of Vtc1, Vtc2, Vtc3 and Vtc4), which
regulates vacuolar membrane fusion, morphology and func-
tion [37,38], is directly involved in the synthesis of poly P in
yeast [3]. The fact that mutants affected in various stages of
retrograde and forward vesicle trafficking, as well as in
autophagy, indicate that an intact secretory pathway is
required for normal poly P content and supports the hypoth-
esis that the Vtc complex influences poly P levels indirectly
[38]. This secondary effect on poly P metabolism can be
caused by: the mislocalization or misregulation of vacuolar
proteins that are important for poly P synthesis and storage;
or the impairment of poly P synthesis and transport along the
secretory pathway. Thus, many pathways could indirectly
affect poly P content via their impact on the vacuole or secre-
tory pathway and, thereby, link seemingly unrelated path-
ways to poly P metabolism. The reduced poly P content in
mutants of any one of the four subunits of the AP-3 complex,
which mediates an alternative pathway from the Golgi to the
vacuole [39] and is also medically relevant for one type of
Hermansky-Pudlak syndrome [40], is another such case of
indirect effects; mutations in proteins that are targeted to the
vacuole via the AP-3 complex or that contain a putative di-
leucine signal for AP-3 targeting hypo-accumulated poly P
(data not shown).
Although deletion of genes that encode vacuolar proteins
caused the most severe reduction in poly P levels, only a frac-
tion of all discovered genes encoded proteins that function in
the vacuole. The remaining 235 genes encode proteins func-
tioning in all cellular compartments. Assessing poly P metab-
olism within the larger picture of phosphate and energy
homeostasis may help explain the involvement of this multi-
tude of pathways. PolyP, which can constitute almost 50% of
the total phosphate content in yeast (data not shown), is thus
seen as another form of cellular phosphate besides free phos-
phate, DNA, RNA, nucleotides or phospholipids (Figure 4).
Considering the example of poly P metabolism in Escherichia
coli and the evidence for an ATP-dependent poly P kinase
activity in yeast [7], it is assumed that the majority of yeast
poly P is synthesized from ATP (Figure 4). The poly P pool is
thus in direct equilibrium with the ATP pool, but can also be
hydrolyzed to buffer free phosphate levels (Figure 4). ATP
itself can also be hydrolyzed (for example, by the V-ATPase to
assure vacuolar acidification). But more importantly, the ATP
pool directly or indirectly sustains most cellular activities and
processes such as DNA and RNA metabolism, ribosome bio-
genesis and assembly, transcription or protein biosynthesis,
as well as synthesis of storage carbohydrates (Figure 4).
Hence, these pathways are also indirectly associated with
poly P metabolism. Ribosome biogenesis, for example, claims
Genome Biology 2006, Volume 7, Issue 11, Article R109 Freimoser et al. R109.7
comment reviews reports refereed researchdeposited research interactions information
Genome Biology 2006, 7:R109
about 60% of total transcription, 90% of mRNA splicing, the
requirement of all three RNA polymerases and the dedication
of almost 200 different proteins and, thus, considerably
affects energy homeostasis [41,42].
Intervention at any point within this phosphate-energy-net-
work inevitably causes many side effects that require read-
justment of the allocation of resources between the different
phosphate and energy pools. In this context, 'interventions'
could represent genetic changes but also externally induced
physiological changes as they occur, for example, during the
progression through different growth phases. Both types of
changes were found to affect poly P levels strongly, but also
other characteristics were altered. Many mutants that failed
to accumulate poly P seemed to invest more in the accumula-
tion of storage carbohydrates (glycogen) and could no longer
buffer the expression of phosphate regulated genes (as
indicated by elevated rAPase activity). In contrast, total phos-
phate content closely followed poly P levels, but even in this
case the correlation coefficient between all relative poly P and
all total phosphate values (log
2
-transformed) was only 0.65.
Even ATP levels per se were sometimes significantly altered,
but compared to the other characteristics that were meas-
ured, these changes were smaller, confirming, at least partly,
the general notion that, in viable and growing cells, ATP levels
remain constant [43].
Conclusion
PolyP metabolism and primary metabolism are strongly
interdependent: On one hand, poly P levels depend necessar-
ily on the integrity of primary metabolism and reflect the
physiological state of a cell. On the other hand, poly P itself
influences cell metabolism through its importance for energy
and phosphate homeostasis. This first genome-wide analysis
of poly P content thus also implies poly P as an indirect link
between different cellular pathways such as phosphate,
energy and carbohydrate metabolism or transcription and
translation activities.
Materials and methods
Strains and culturing conditions
The haploid yeast knock-out strains (YKO [23], based on the
strain BY4741: MAT a his3
Δ
1 leu2
Δ
0 met15
Δ
0 ura3
Δ
0) were
grown in 96-well deep well plates at 30°C in YPD medium (1%
w/v yeast extract, 2% w/v peptone, 2% w/v glucose, with
optional addition of 200 mg/l G418). For the screen, fresh
YPD medium was inoculated with 40 μl of the precultured
(3d) stationary cells and cells were harvested after 4 h (first
and second round of screen) or after 2 h, 4 h, 8 h and 24 h
(third round of screen). Growth and cell number was moni-
tored by measuring the light scattering at 600 nm (OD
600
) in
a BioTek PowerWave™ XS microplate spectrophotometer
(BioTEK Instruments Inc., Vermont, USA). For detailed poly
P measurements in selected strains, the culture was inocu-
lated at a cell density of 1 OD
600
/ml (approximately 10
7
cells/
ml), and at each time-point 1 OD
600
equivalent of cells was
collected for poly P quantification.
Poly P purification and quantification
Poly P extraction, purification and quantification were per-
formed as described previously [36]. In short, cells were pel-
leted in deep well plates by centrifugation (approximately
640 g, 15 minutes, 4°C), the supernatant was discarded, 50 μl
1 M sulphuric acid were added and the suspension was neu-
tralized with 50 μl 2 M NaOH and 100 μl Tris-malate buffer (1
M, pH 7.5, 6% neutral red solution (0.1% neutral red in 70%
ethanol)). Cell fragments were pelleted by centrifugation
(approximately 640 g, 15 minutes, 4°C) and 100 μl of the
supernatant were removed. Poly P was purified, enzymati-
cally digested and quantified using a colorimetric assay [36].
Screening procedure and data analysis
For all poly P measurements the poly P raw data were normal-
ized to the cell density (OD
600
) measured for each corre-
sponding culture. The poly P content was then expressed
relative to either the median of all cultures in one 96-well
plate (first screen) or the poly P content in the wild-type
strain BY4741 (second and third screens). All strains with a
relative poly P content 1.5-fold higher or a relative poly P con-
tent 0.67-fold lower were selected for the second and the third
round of screening. In the third screen, data were collected at
four different time points (2 h, 4 h, 8 h, 24 h). Only strains
Poly P links energy and phosphate metabolism in a 'phosphate-energy-network'Figure 4
Poly P links energy and phosphate metabolism in a 'phosphate-energy-
network'. Enzymatic reactions between the main phosphate/energy pools,
ATP and poly P (shown by black arrows) are (at least partly) hypothesized.
Flow to different organic phosphate/energy pools is indicated by the gray
arrows. In contrast to ATP, poly P is less directly interconnected with the
other phosphate pools and, therefore, its levels fluctuate more.
ATP
poly P
Pi
NTPs
DNA / RNA
Phospholipids
Phosphorylated
sugars & proteins
Pho4
(PHO pathway)
Storage
carbohydrates
Pi
R109.8 Genome Biology 2006, Volume 7, Issue 11, Article R109 Freimoser et al. />Genome Biology 2006, 7:R109
that fulfilled at least one of the following criteria were selected
for subsequent data analysis: relative poly P content through-
out the 24 h time-course varied more than two-fold; at least
one time-point differed more than two-fold from the wild-
type poly P content. Strains that did not grow were excluded.
In some strains, the affected gene was reintroduced and
expressed from a plasmid, which restored poly P levels (data
not shown).
The poly P data of all selected strains and all screens and
time-points were combined and clustered hierarchically (with
the Pearson uncentered or Pearson correlation distance
measure, respectively, and complete or average linkage in
Genesis [44]). The selected strains were also ranked accord-
ing to how strongly poly P levels were affected (calculated as
the sum of the squares of the log
2
-transformed poly P ratios
at the four time-points of the third screen).
The genes that were deleted in the strains with altered poly P
content were categorized and studied by different computa-
tional tools and in comparison with available data sets. All
genes were categorized according to the GO terminology by
using the annotation given in the go_slim_mapping.tab file
available from the Saccharomyces Genome Database [45].
Significantly overrepresented GOSlim terms (compared to
their representation in the complete yeast genome) were
determined by using Cytoscape and the BiNGO plugin (set-
tings: hypergeometric test statistic, false discovery rate cor-
rection for multiple tests, P ≤ 0.05 confidence limit) [46,47].
All data manipulations were performed in Microsoft Excel
and FileMaker.
Measurement of total phosphate, ATP, glycogen and
acid phosphatase activity
Detailed measurements of several metabolites and activities
were performed in selected strains at various time-points (0
h, 2 h, 5 h, 24 h). Individual cultures for each time-point were
inoculated to an OD
600
= 1 (approximately 10
7
cells/ml). At
each time point 1OD
600
equivalent of cells was harvested and
used for subsequent measurements. All data were obtained
from duplicate measurements.
For measurement of total phosphate, cells were pelleted,
resuspended in 200 μl of 1 MH
2
SO
4
and heated in a boiling
water bath for 20 minutes. Released phosphate was quanti-
fied with molybdate and malachite green as described [36].
For ATP quantification the same neutralized cell extract as for
poly P quantification was prepared, and ATP was quantified
by a method adapted from Hyswert et al. [48]. The neutral-
ized sample (20 μl) were added to 80 μl Tris buffer (20 mM,
pH8, 2 mM EDTA) and 4 μl phosphoenol pyruvate were
added (2.5 mM, pH8, 0.125 M MgSO
4
, 0.312 M K
2
SO
4
). For
the quantification of ATP, 5 μl of the sample were added to 45
μl luciferase buffer (10 mM Tris-H
2
SO
4
, pH 7.4, 3.5 mM
MgSO
4
). After the addition of 50 μl luciferase solution (Roche
ATP Bioluminescence Assay kit CLS II, Roche Diagnostics
GmbH, Mannheim, Germany) relative light units emitted
were measured in a luminometer (Lumat LB 9507, Berthold
Technologies GmBH and Co. KG, Bad Wildbad, Germany).
To quantify glycogen the cell pellet was first frozen and glyco-
gen was extracted as described [49]. The extracted glycogen
was then digested by adding 10 U alpha-amylase and 12.6 U
amyloglucosidase in a sodium acetate buffer (pH 4.8, 220
mM) at 55°C for 16 h. Released glucose was quantified with
the D-Glucose HK kit (Megazyme International Ireland Ltd.,
Bray, Ireland).
Acid phosphatase activity was assayed according to Huang
and O'Shea [27] in 50 μl cell suspension by adding 200 μl p-
nitrophenyl-phosphate (20 mM). After 15 minutes at room
temperature, 200 μl of 10% ice-cold trichloracetic acid and
400 μl sodium carbonate solution (2 M) were added and the
OD
420
was measured. All results were expressed relative to
the respective values of the wild-type cells (BY4741).
Additional data files
The following additional data are available with the online
version of this paper. Additional data file 1 contains all poly P
data of the three screens.
Additional data file 1All poly P data of the three screensAll poly P data of the three screens.Click here for file
Acknowledgements
We thank S Eicke, M Stadler, S Ernst, C Neupert and S Clerc for help at
different stages of this research. M Aebi is acknowledged for helpful and
motivating discussions, SZeeman and his group for providing a spectropho-
tometer and help with glycogen quantification, and W Gruissem and J Füt-
terer for making a luminometer available. M Peter and M Sohrmann are
given thanks for providing yeast strains. This work was supported by the
Swiss National Science Foundation (grant 3100A0-112083/1) and ETH
Zurich.
References
1. Kornberg A, Rao NN, Ault-Riché D: Inorganic polyphosphate: a
molecule of many functions. Annu Rev Biochem 1999, 68:89-125.
2. Neef DW, Kladde MP: Polyphosphate loss promotes SNF/SWI-
and Gcn5-dependent mitotic induction of PHO5. Mol Cell Biol
2003, 23:3788-3797.
3. Ogawa N, DeRisi J, Brown PO: New components of a system for
phosphate accumulation and polyphosphate metabolism in
Saccharomyces cerevisiae revealed by genomic expression
analysis. Mol Biol Cell 2000, 11:4309-4321.
4. Thomas MR, O'Shea EK: An intracellular phosphate buffer fil-
ters transient fluctuations in extracellular phosphate levels.
Proc Natl Acad Sci USA 2005, 102:9565-9570.
5. Kuroda A, Nomura K, Ohtomo R, Kato J, Ikeda T, Takiguchi N,
Ohtake H, Kornberg A: Role of inorganic polyphosphate in pro-
moting ribosomal, protein degradation by the Lon protease
in E. coli. Science 2001, 293:705-708.
6. Wang L, Fraley CD, Faridi J, Kornberg A, Roth RA: Inorganic
polyphosphate stimulates mammalian TOR, a kinase
involved in the proliferation of mammary cancer cells. Proc
Natl Acad Sci USA 2003, 100:11249-11254.
7. Kulaev IS, Vagabov VM, Kulakovskaya TV: The Biochemistry of Inorganic
Polyphopshates 2nd edition. Chichester, West Sussex: John Wiley and
Sons, Ltd; 2004.
8. McInerney P, Mizutani T, Shiba T: Inorganic polyphosphate inter-
acts with ribosomes and promotes translation fidelity in vitro
and in vivo. Mol Microbiol 2006, 60:438-447.
9. Kim KS, Rao NN, Fraley CD, Kornberg A: Inorganic
Genome Biology 2006, Volume 7, Issue 11, Article R109 Freimoser et al. R109.9
comment reviews reports refereed researchdeposited research interactions information
Genome Biology 2006, 7:R109
polyphosphate is essential for long-term survival and viru-
lence factors in Shigella and Salmonella spp. Proc Natl Acad Sci
USA 2002, 99:7675-7680.
10. Rashid MH, Rumbaugh K, Passador L, Davies DG, Hamood AN,
Iglewski BH, Kornberg A: Polyphosphate kinase is essential for
biofilm development, quorum sensing, and virulence of Pseu-
domonas aeruginosa. Proc Natl Acad Sci USA 2000, 97:9636-9641.
11. Crooke E, Akiyama M, Rao NN, Kornberg A: Genetically altered
levels of inorganic polyphosphate in Escherichia coli. J Biol
Chem 1994, 269:6290-6295.
12. Sethuraman A, Rao NN, Kornberg A: The endopolyphosphatase
gene: essential in Saccharomyces cerevisiae. Proc Natl Acad Sci
USA 2001, 98:8542-8547.
13. Pick U, Weiss M: Polyphosphate hydrolysis within acidic vacu-
oles in response to amine-induced alkaline stress in the halo-
tolerant alga Dunaliella salina. Plant Physiol 1991, 97:1234-1240.
14. Rohloff P, Montalvetti A, Docampo R: Acidocalcisomes and the
contractile vacuole complex are involved in osmoregulation
in Trypanosoma cruzi. J Biol Chem 2004, 279:52270-52281.
15. Weiss M, Bental M, Pick U: Hydrolysis of polyphosphates and
permeability changes in response to osmotic shocks in cells
of the halotolerant alga Dunaliella. Plant Physiol 1991,
97:1241-1248.
16. Zhang H, Gomez-Garcia MR, Brown MR, Kornberg A: Inorganic
polyphosphate in Dictyostelium discoideum : influence on
development, sporulation, and predation. Proc Natl Acad Sci
USA 2005, 102:2731-2735.
17. Smith SA, Mutch NJ, Baskar D, Rohloff P, Docampo R, Morrissey JH:
Polyphosphate modulates blood coagulation and fibrinolysis.
Proc Natl Acad Sci USA 2006, 103:903-908.
18. Beauvoit B, Rigoulet M, Guerin B, Canioni P: Polyphosphates as a
source of high energy phosphates in yeast mitochondria: a
31
P NMR study. FEBS Lett 1989, 252:17-21.
19. Harold FM, Miller A: Intracellular localization of inorganic
polyphsophate in Neurospora crassa. Biochim Biophys Acta 1961,
50:261-270.
20. Docampo R, de Souza W, Miranda K, Rohloff P, Moreno SN: Acido-
calcisomes - conserved from bacteria to man. Nat Rev
Microbiol 2005, 3:251-261.
21. Indge KJ: Polyphosphates of the yeast cell vacuole. J Gen
Microbiol 1968, 51:447-455.
22. Urech K, Durr M, Boller T, Wiemken A, Schwencke J: Localization
of polyphosphate in vacuoles of Saccharomyces cerevisiae.
Arch Microbiol 1978, 116:275-278.
23. Winzeler EA, Shoemaker DD, Astromoff A, Liang H, Anderson K,
Andre B, Bangham R, Benito R, Boeke JD, Bussey H, et al.: Func-
tional characterization of the S. cerevisiae genome by gene
deletion and parallel analysis. Science 1999, 285:901-906.
24. Darsow T, Burd CG, Emr SD: Acidic di-leucine motif essential
for AP-3-dependent sorting and restriction of the functional
specificity of the Vam3p vacuolar t-SNARE. J Cell Biol 1998,
142:913-922.
25. Wilson WA, Wang Z, Roach PJ: Systematic identification of the
genes affecting glycogen storage in the yeast Saccharomyces
cerevisiae : implication of the vacuole as a determinant of gly-
cogen level. Mol Cell Proteomics 2002, 1:232-242.
26. Auesukaree C, Tochio H, Shirakawa M, Kaneko Y, Harashima S:
Plc1p, Arg82p, and Kcs1p, enzymes involved in inositol pyro-
phosphate synthesis, are essential for phosphate regulation
and polyphosphate accumulation in Saccharomyces
cerevisiae. J Biol Chem 2005, 280:25127-25133.
27. Huang S, O'Shea EK: A systematic high-throughput screen of a
yeast deletion collection for mutants defective in PHO5
reg-
ulation. Genetics 2005, 169:1859-1871.
28. Auesukaree C, Homma T, Tochio H, Shirakawa M, Kaneko Y, Har-
ashima S: Intracellular phosphate serves as a signal for the reg-
ulation of the PHO pathway in Saccharomyces cerevisiae. J Biol
Chem 2004, 279:17289-17294.
29. Lichko LP, Kulakovskaya TV, Kulaev IS: Inorganic polyphosphate
and exopolyphosphatase in the nuclei of Saccharomyces cere-
visiae: dependence on the growth phase and inactivation of
the PPX1 and PPN1 genes. Yeast 2006, 23:735-740.
30. Kane PM: The where, when, and how of organelle acidification
by the yeast vacuolar H
+
-ATPase. Microbiol Mol Biol Rev 2006,
70:177-191.
31. Klionsky DJ, Herman PK, Emr SD: The fungal vacuole: composi-
tion, function, and biogenesis. Microbiol Rev 1990, 54:266-292.
32. Eide DJ, Clark S, Nair TM, Gehl M, Gribskov M, Guerinot ML, Harper
JF: Characterization of the yeast ionome: a genome-wide
analysis of nutrient mineral and trace element homeostasis
in Saccharomyces cerevisiae. Genome Biol 2005, 6:R77.
33. Sobacchi C, Frattini A, Orchard P, Porras O, Tezcan I, Andolina M,
Babul-Hirji R, Baric I, Canham N, Chitayat D, et al.: The mutational
spectrum of human malignant autosomal recessive
osteopetrosis. Hum Mol Genet 2001, 10:1767-1773.
34. Stover EH, Borthwick KJ, Bavalia C, Eady N, Fritz DM, Rungroj N,
Giersch AB, Morton CC, Axon PR, Akil I, et al.: Novel ATP6V1B1
and ATP6V0A4 mutations in autosomal recessive distal
renal tubular acidosis with new evidence for hearing loss. J
Med Genet 2002, 39:796-803.
35. Parra KJ, Kane PM: Reversible association between the V1 and
V0 domains of yeast vacuolar H
+
-ATPase is an unconven-
tional glucose-induced effect. Mol Cell Biol 1998, 18:7064-7074.
36. Werner TP, Amrhein N, Freimoser FM: Novel method for the
quantification of inorganic polyphosphate (iPoP) in Saccharo-
myces cerevisiae shows dependence of iPoP content on the
growth phase. Arch Microbiol 2005, 184:129-136.
37. Cohen A, Perzov N, Nelson H, Nelson N: A novel family of yeast
chaperons involved in the distribution of V-ATPase and
other membrane proteins. J Biol Chem 1999, 274:26885-26893.
38. Müller O, Neumann H, Bayer MJ, Mayer A: Role of the Vtc pro-
teins in V-ATPase stability and membrane trafficking. J Cell
Sci 2003, 116:1107-1115.
39. Odorizzi G, Cowles CR, Emr SD: The AP-3 complex: a coat of
many colours. Trends Cell Biol 1998, 8:282-288.
40. Huizing M, Boissy RE, Gahl WA: Hermansky-Pudlak syndrome:
vesicle formation from yeast to man. Pigment Cell Res 2002,
15:405-419.
41. Rudra D, Warner JR: What better measure than ribosome
synthesis? Genes Dev 2004, 18:2431-2436.
42. Warner JR: The economics of ribosome biosynthesis in yeast.
Trends Biochem Sci 1999, 24:437-440.
43. Ditzelmüller G, Wohrer W, Kubicek CP, Rohr M: Nucleotide pools
of growing, synchronized and stressed cultures of Saccharo-
myces cerevisiae. Arch Microbiol 1983, 135:63-67.
44. Sturn A, Quackenbush J, Trajanoski Z: Genesis: Cluster analysis of
microarray data. Bioinformatics 2002, 18:207-208.
45. Saccharomyces Genome Database [n
ford.edu/pub/yeast/data_download/literature_curation/]
46. Maere S, Heymans K, Kuiper M: BiNGO: a Cytoscape plugin to
assess overrepresentation of Gene Ontology categories in
biological networks. Bioinformatics 2005, 21:3448-3449.
47. Shannon P, Markiel A, Ozier O, Baliga NS, Wang JT, Ramage D, Amin
N, Schwikowski B, Ideker T: Cytoscape: a software environment
for integrated models of biomolecular interaction networks.
Genome Res 2003, 13:2498-2504.
48. Hyswert DW, Morrison NM: Studies on ATP, ADP, and AMP
concentrations in yeast and beer. J Am Soc Brew Chem 1977,
35:160-167.
49. Wang Z, Wilson WA, Fujino MA, Roach PJ: Antagonistic controls
of autophagy and glycogen accumulation by Snf1p, the yeast
homolog of AMP-activated protein kinase, and the cyclin-
dependent kinase Pho85p. Mol Cell Biol 2001, 21:5742-5752.