Báo cáo y học: "Recurrent insertion and duplication generate networks of transposable element sequences in the Drosophila melanogaster genome." pps
Bạn đang xem bản rút gọn của tài liệu. Xem và tải ngay bản đầy đủ của tài liệu tại đây (1021.34 KB, 21 trang )
Genome Biology 2006, 7:R112
comment reviews reports deposited research refereed research interactions information
Open Access
2006Bergmanet al.Volume 7, Issue 11, Article R112
Research
Recurrent insertion and duplication generate networks of
transposable element sequences in the Drosophila melanogaster
genome
Casey M Bergman
*†
, Hadi Quesneville
‡
, Dominique Anxolabéhère
§
and
Michael Ashburner
*
Addresses:
*
Department of Genetics, University of Cambridge, Cambridge CB2 3EH, UK.
†
Faculty of Life Sciences, University of Manchester,
Manchester M13 9PT, UK.
‡
Laboratoire de Bioinformatique et Génomique, Institut Jacques Monod, place Jussieu, 75251 Paris cedex 05,
France.
§
Laboratoire Dynamique du Génome et Évolution, Institut Jacques Monod, place Jussieu, 75251 Paris cedex 05, France.
Correspondence: Casey M Bergman. Email:
© 2006 Bergman et al.; licensee BioMed Central Ltd.
This is an open access article distributed under the terms of the Creative Commons Attribution License ( which
permits unrestricted use, distribution, and reproduction in any medium, provided the original work is properly cited.
Networks of transposable elements in fly<p>An analysis of high-resolution transposable element annotations in Drosophila melanogaster suggests the existence of a global surveil-lance system against the majority of transposable elements families in the fly.</p>
Abstract
Background: The recent availability of genome sequences has provided unparalleled insights into
the broad-scale patterns of transposable element (TE) sequences in eukaryotic genomes.
Nevertheless, the difficulties that TEs pose for genome assembly and annotation have prevented
detailed, quantitative inferences about the contribution of TEs to genomes sequences.
Results: Using a high-resolution annotation of TEs in Release 4 genome sequence, we revise
estimates of TE abundance in Drosophila melanogaster. We show that TEs are non-randomly
distributed within regions of high and low TE abundance, and that pericentromeric regions with
high TE abundance are mosaics of distinct regions of extreme and normal TE density. Comparative
analysis revealed that this punctate pattern evolves jointly by transposition and duplication, but not
by inversion of TE-rich regions from unsequenced heterochromatin. Analysis of genome-wide
patterns of TE nesting revealed a 'nesting network' that includes virtually all of the known TE
families in the genome. Numerous directed cycles exist among TE families in the nesting network,
implying concurrent or overlapping periods of transpositional activity.
Conclusion: Rapid restructuring of the genomic landscape by transposition and duplication has
recently added hundreds of kilobases of TE sequence to pericentromeric regions in D. melanogaster.
These events create ragged transitions between unique and repetitive sequences in the zone
between euchromatic and beta-heterochromatic regions. Complex relationships of TE nesting in
beta-heterochromatic regions raise the possibility of a co-suppression network that may act as a
global surveillance system against the majority of TE families in D. melanogaster.
Background
Nearly all eukaryotic genomes contain a substantial fraction
of middle repetitive, transposable element (TE) sequences
interspersed with the unique sequences encoding genes and
cis-regulatory elements. The broad-scale patterns of TE
abundance and distribution in various model organisms have
Published: 29 November 2006
Genome Biology 2006, 7:R112 (doi:10.1186/gb-2006-7-11-r112)
Received: 31 July 2006
Revised: 13 November 2006
Accepted: 29 November 2006
The electronic version of this article is the complete one and can be
found online at />R112.2 Genome Biology 2006, Volume 7, Issue 11, Article R112 Bergman et al. />Genome Biology 2006, 7:R112
become increasingly well-understood with the recent availa-
bility of essentially complete genome sequences (for example,
[1-4]). Despite these general advances, however, a detailed
understanding of the evolutionary forces that control the
abundance and distribution of TEs remains elusive, owing in
part to the dynamic nature of this component of the genome
as well as to the inherent problems that TE sequences present
for genome assembly and annotation.
As with all unfinished whole-genome shotgun assemblies,
uncertainty in the assembly of repetitive DNA in the first two
releases of the Drosophila melanogaster genome sequence
posed difficulties for analysis of TE sequences [5-8]. The
improved assembly of repetitive regions in the D. mela-
nogaster Release 3 genome sequence presented the first
opportunity to study TEs in a finished whole genome shotgun
sequence [2,9], revealing the true challenge that these
sequences pose for their systematic annotation [10,11]. With
further improvements in the Release 4 genome sequence
made possible by the efforts of the Berkeley Drosophila
Genome Project [12] (especially in regions of high TE density
where several gaps have been completed), we are now in a
position to establish more stable trends in TE abundance for
D. melanogaster. In addition to having access to improved
genome sequence data, we have recently developed an
improved TE annotation pipeline that uses the combined evi-
dence of multiple computational methods to predict 'TE mod-
els' in genome sequences [10]. We have shown that this
pipeline identifies a large number of predicted TEs that were
omitted from the Release 3 genome annotations, and subse-
quently applied this system to the D. melanogaster Release 4
sequence [10]. Here we analyze the results of this effort in
detail, which allows an extremely high-resolution view of the
structure and location of TEs in one of the highest quality
metazoan genome sequences currently available.
We first revised baseline estimates of the TE abundance in the
Drosophila genome sequence, based on the fact that TEs
show a strikingly non-random distribution across the
genome. We then used this baseline to identify specific
regions of extremely high TE density in the genome sequence.
This analysis showed that regions of the genome broadly
known to have high TE abundance, such as pericentromeric
regions and the fourth chromosome, are in fact often charac-
terized by distinctly localized regions of extremely high TE
density interrupted by regions of lower TE density. Compara-
tive sequence analysis showed that this punctate pattern is
unlikely to have arisen in the D. melanogaster genome by
inversion of TE-rich heterochromatic sequences, but can
evolve in situ by the joint action of recurrent transposition
and duplication. Finally, we analyzed in detail the patterns of
TE nesting in the genome sequence, taking advantage of the
improved joining of fragments from the same TE insertion
event in our new annotation. We framed the process of TE
nesting as a directed graph and borrowed techniques from
network analysis to study genome-wide patterns of TE nest-
ing. This work demonstrates the added value of high-resolu-
tion annotations for understanding how TEs impact genome
organization and evolution, and preludes the interpretation
of TE-rich heterochromatic regions currently being
sequenced by the Drosophila Heterochromatin Genome
Project [13].
Results
Abundance and distribution of TEs in the Release 4
genome sequence
Using a recently completed combined-evidence annotation of
the Release 4 genome sequence [10], we revised estimates of
the overall abundance of TE sequences in D. melanogaster
(Table 1) from those based on the Release 3 sequence [2].
Excluding foreign elements based on query sequences from
other species (see Materials and methods), the estimated
number of TEs in the D. melanogaster Release 4 genome
sequence (n = 5,390) is over three-fold higher than in Release
3 (n = 1,572). In contrast, the amount of sequence annotated
as TE increased by only approximately 44% in Release 4 (6.51
Mb, 5.50% of genome) relative to Release 3 (4.51 Mb, 3.86%
of genome). (We note that the proportion of the Release 4
genome estimated here as TE is calculated as the sum of non-
redundant annotation spans including unique sequences
inserted into TEs; this procedure differs slightly from our pre-
vious estimates for Release 4, which only included sequences
strictly homologous to TE query sequences [10].) The discrep-
ant changes in these two metrics of TE abundance across
releases results from the fact that almost all new TEs in
Release 4 are either small fragments and/or annotations of
the highly abundant but degenerated INE-1 element (also
known as DINE-1 or DNAREP1_DM) [14], a family that was
omitted from the Release 3 annotation. The inclusion of these
new small fragments is also reflected in the fact that the pro-
portion of TEs estimated to be full-length (defined as ± 3% of
the canonical element including the length of inserted
sequences) has declined from 30.5% in Release 3 to 9.83% in
Release 4. The number of TEs involved in nests (n = 785) has
more than doubled in Release 4 relative to Release 3 because
of newly annotated sequences and improved joining of TE
fragments belonging to the same insertion, although the esti-
mated proportion of TEs involved in nests (14.6%) in Release
4 has decreased relative to Release 3 as a consequence of the
increased total number of TEs annotated.
The major patterns of TE abundance identified in previous
releases of the D. melanogaster genome sequence
[2,7,8,15,16] are also observed in Release 4, suggesting that
these trends are stable features of the D. melanogaster
genomic landscape. As shown in Figure 1, both the pericen-
tromeric regions of the major chromosome arms and the
entirety of chromosome 4 have higher densities of TE inser-
tions, relative to non-pericentromeric regions [2,7,15]. Densi-
ties over the non-pericentromeric regions are roughly equal,
with no general increase in TE density in telomeric regions
Genome Biology 2006, Volume 7, Issue 11, Article R112 Bergman et al. R112.3
comment reviews reports refereed researchdeposited research interactions information
Genome Biology 2006, 7:R112
(Figure 1) [7,15], excluding TEs that are directly involved in
telomere structure/function or in the subtelomeric arrays
(see below). There is no general decrease in the abundance of
TEs on the X chromosome [2,15], as expected if TE insertions
generate deleterious recessive mutations [17]. Long terminal
repeat (LTR) retrotransposons occupy the greatest propor-
tion of the genome sequence (3.29%), as has been observed
previously [2,7], but the current annotation reveals that the
INE-1 family is the most numerous category of TEs (n =
2,238) in the D. melanogaster genome [16]. (We note that
throughout this work, non-LTR retrotransposon is abbrevi-
ated as 'non-LTR', which is referred to as LINE-like in [2,7].)
INE-1 has previously been suggested to be a retrotransposon
on the basis of homology to the D. virilis Penelope element
[16]; however, we found that this reported homology between
Penelope and INE-1 is spurious and restricted to flanking
sequences in GenBank:U49102
(see also [18]). From the per-
cent genome sequence occupied, our analysis indicates that
INE-1 distribution most closely fits the terminal inverted
repeat (TIR) transposon class of TEs (Table 1), supporting the
conclusion that INE-1 is a TIR element based on structural
features of an improved consensus sequence [19].
This set of 5,390 TEs defined 4,684 TE-free regions (TFRs)
[20] in the Release 4 genome sequence; 94.5% (111.9 Mb of
118.4 Mb) of the Release 4 genome sequence can be found in
TFRs, with 89.8% (106.2 Mb) and 56.1% (66.4 Mb) of the
genome found in TFRs of greater than 10 Kb (n = 1,393) and
100 Kb (n = 357), respectively. The longest TFR in D. mela-
nogaster is 855,890 base-pairs (bp) in length on chromo-
some 2R from 14,374,883-15,230,772, contains 106 genes,
and is over 10 times longer than the longest TFR in the human
genome [20]. The mean TFR length of 23,878 bp is consistent
with the genome-wide minimum estimate of the distance
between middle-repetitive interspersed repeats (>13 Kb)
based on reassociation kinetics [21]; however, the median
TFR length of 1,992 bp is much smaller. The distribution of
TFR lengths departs significantly from an exponential distri-
bution parameterized on this mean length using an adjusted
Kolmogorov-Smirnov test (D = 0.4513, p < 0.001), which is
based on the maximal difference between observed and
expected cumulative distributions and accounts for the fact
that the rate parameter for the exponential distribution has
been estimated from the data [22]. Similar results are
obtained if the rate parameter for the exponential is calcu-
lated from the number of TE insertions divided by the total
Table 1
Abundance of D. melanogaster TEs annotated in Release 4 genome sequence by genomic region
Class Total bp TE % TE No. of TEs No. of TE per Mbp No. of TE full length % TE full length No. of TE nested % TE nested
Genome LTR 3,896,903 3.29 1,321 11.16 325 24.60 327 24.75
Non-LTR 1,502,997 1.27 1,019 8.61 121 11.87 197 19.33
TIR 559,234 0.47 752 6.35 57 7.58 157 20.88
INE-1 490,996 0.41 2,238 18.91 26 1.16 91 4.07
FB 60,509 0.05 60 0.51 1 1.67 13 21.67
Total 6,510,639 5.50 5,390 45.54 530 9.83 785 14.56
Non-pericentromeric LTR 2,510,569 2.42 515 4.96 250 48.54 80 15.53
Non-LTR 646,020 0.62 336 3.24 80 22.92 9 2.68
TIR 151,997 0.15 214 2.06 25 11.68 12 5.61
INE-1 106,597 0.10 660 6.36 5 0.76 8 1.21
FB 28,125 0.03 23 0.22 1 4.35 3 13.04
Total 3,443,308 3.32 1,748 16.85 361 20.48 112 6.41
Pericentromeric LTR 1,324,428 9.94 776 58.24 70 9.02 241 31.06
Non-LTR 802,040 6.02 623 46.75 42 6.58 169 27.13
TIR 323,226 2.43 436 32.72 29 6.65 115 26.38
INE-1 300,615 2.26 1,234 92.61 17 1.38 71 5.75
FB 27,773 0.21 32 2.40 0 0.00 9 28.13
Total 2,778,082 20.85 3,101 232.72 158 5.06 605 19.51
Chromosome 4 LTR 61,906 4.83 30 23.41 5 16.67 6 20.00
Non-LTR 54,937 4.29 60 46.82 3 5.00 19 31.67
TIR 84,011 6.55 102 79.59 3 2.94 30 29.41
INE-1 83,784 6.54 344 268.41 4 1.16 12 3.49
FB 4,611 0.36 5 3.90 0 0.00 1 20.00
Total 289,249 22.57 541 422.12 15 2.77 68 12.57
Overall abundance was partitioned into pericentromeric and non-pericentromeric regions according to the text. Full-length elements were defined
as ± 3% of the canonical element. Both inner and outer components of a TE nest were considered nested.
R112.4 Genome Biology 2006, Volume 7, Issue 11, Article R112 Bergman et al. />Genome Biology 2006, 7:R112
Figure 1 (see legend on next page)
10
20
30
40
50
5101520
10
20
30
40
50
1
10
20
30
40
50
5101520
10
20
30
40
50
5101520
10
20
30
40
50
5 101520
10
20
30
40
50
510152025
0
10
20
30
40
50
20 21 22
0
10
20
30
40
50
20 21 22
0
10
20
30
40
50
123
0
10
20
30
40
50
21 22 23
0
10
20
30
40
50
123
0
10
20
30
40
50
1
X
4
2L 2R
3L
3R
1
2
4
3
5
6
7
8
9-10
11
14
15
12
13
16
17
# non-INE-1 TEs/50kb
# INE-1 TEs/50kb
~ het eu. boundary
~ reduced-null boundary
~ centromere
~ high-reduced boundary
flamenco
Histone
Hsp70
TA
S
Genome Biology 2006, Volume 7, Issue 11, Article R112 Bergman et al. R112.5
comment reviews reports refereed researchdeposited research interactions information
Genome Biology 2006, 7:R112
length of TFRs (as in [20]), both including (adjusted Kol-
mogorov-Smirnov test, D = 0.4719, p < 0.001) or excluding
(adjusted Kolmogorov-Smirnov test, D = 0.4456, p < 0.001)
TEs nested in other TEs. These results are not simply a result
of a high density in pericentromeric regions (see below) and
demonstrate that the location of TEs is non-randomly distrib-
uted at the level of the complete D. melanogaster genome
sequence, confirming previous results [7,8,15]. We note that
TFRs in the D. melanogaster genome are likely to vary among
individuals since most TE insertions are not fixed in the spe-
cies [23]; however, these results should be representative of
other strains to the extent that the TE composition of the
genome sequence reflects general properties of the species
[2].
Pericentromeric regions, non-pericentromeric regions
and the fourth chromosome differ drastically in TE
content
Since non-random distribution of TEs can lead to greater
than one order of magnitude differences in TE abundance in
pericentromeric and non-pericentromeric regions
[2,7,8,15,24], overall genome-wide summary statistics do not
accurately reflect TE abundance for any region of the genome
sequence. To account for this heterogeneity, we attempted to
partition the major chromosome arms into regions of high
(pericentromeric) and low (non-pericentromeric) TE density
using an independent criterion that is not based on TE con-
tent. Our primary goal here was to estimate the TE content in
non-pericentromeric regions of the genome as accurately as
possible, to understand baseline levels of TE abundance
throughout the majority of the genome. Initially we investi-
gated using a partition based on the cytologically defined
boundaries between euchromatin and β-heterochromatin
estimated in Hoskins et al. [25]. As shown in Figure 1 (red tri-
angles), the cytologically defined limits of the euchromatin/β-
heterochromatin boundaries correspond almost exactly to
the most distal pericentromeric region of high TE density on
chromosome arms 3L and 3R. However, on chromosome
arms 2L, 2R and X the most distal pericentromeric regions of
extreme TE density are up to 2 Mb from the estimated
euchromatin/β-heterochromatin boundary. Thus, using this
cytological criterion to partition the genome into regions of
high and low TE density still leads to an over-estimate of the
true TE abundance for the majority of the genome.
We next evaluated whether genetically defined regions of dif-
ferent recombination rates estimated by Charlesworth [26]
could partition the genome into high and low TE density
regions. For all chromosome arms (excluding the fourth chro-
mosome), we found that the estimated boundaries between
'reduced' and 'null' (that is, very low) recombination rates in
pericentromeric regions (Figure 1, orange triangles) were
located extremely close to the cytologically defined bounda-
ries between euchromatin and β-heterochromatin. Thus, the
same tendency to bias estimates of TE abundance exists if the
boundary between reduced and null recombination rates is
used to partition the genome as for the cytological criterion
above. In contrast, the estimated transitions between 'high'
and 'reduced' recombination rates in pericentromeric regions
(Figure 1, green triangles) are approximately 1 to 2 Mb distal
to estimated euchromatin/β-heterochromatin boundaries for
all major chromosome arms. Virtually all regions with high
TE density were included in the 11% of the genome sequence
labeled under this definition as 'pericentromeric' (Figure 1),
and, therefore, this partition was used to estimate TE abun-
dance in different regions of D. melanogaster genome.
Because our aim was to estimate the TE content in non-peri-
centromeric regions as a baseline to identify regions of
extremely high TE content elsewhere in the genome, the
inclusion of some low TE content regions in pericentromeric
regions on chromosome arms 3L and 3R using this partition
should not bias estimates of the background TE abundance
throughout the euchromatin.
Non-pericentromeric regions
A 'typical' region of the D. melanogaster Release 4 genome
sequence (that is, the 88% of the genome in non-pericentro-
meric, high recombination regions on the major chromosome
arms) contains approximately 3.32% TE sequences, with an
average of 16.9 TEs per Mb (Table 1). Previous estimates
based on Release 1 and 2 are not meaningful because of
assembly errors [7,15], and those based on Releases 3 and 4
were computed across the entire genome [2,10], thus the cur-
rent figures represent the first unbiased estimates of TE con-
tent for the majority of the D. melanogaster genome
sequence. As observed in previous releases of the D. mela-
nogaster genome sequence [2,7], the rank order of abun-
dance of major TE classes in non-pericentromeric regions is:
LTR elements (2.42%, 4.96/Mb) > non-LTR elements
(0.62%, 3.24/Mb) > TIR elements (0.15%, 2.06/Mb). INE-1
elements account for only 0.10% of a typical region of the D.
melanogaster genome, but contribute 6.36 TEs/Mb. Approx-
imately 20.5% of the TEs in non-pericentromeric regions are
estimated to be full-length (± 3% of the canonical element
including the length of inserted sequences), although this
value will undoubtedly change with different definitions of
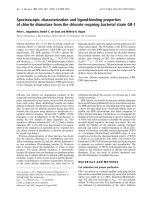
Distribution of TEs along the D. melanogaster Release 4 chromosome armsFigure 1 (see previous page)
Distribution of TEs along the D. melanogaster Release 4 chromosome arms. Numbers of TEs per 50 Kb window are plotted as a function of position along
a chromosome arm. Abundance for all families excluding the INE-1 is shown in black for the main and inset panels, and in blue for the INE-1 family in inset
panels. Positions of the cytologically estimated boundaries between euchromatin and heterochromatin in pericentromeric regions are shown as red
triangles. Positions of genetically estimated boundaries between high and reduced recombination, and between reduced and null recombination, in
pericentromeric regions are shown as green and orange triangles respectively. Filled circles indicate centromeric regions that are currently not included in
the Release 4 genome sequence. HDRs on the major chromosome arms are numbered in purple.
R112.6 Genome Biology 2006, Volume 7, Issue 11, Article R112 Bergman et al. />Genome Biology 2006, 7:R112
what constitutes a full-length element. Virtually every TE in
non-pericentromeric regions exists as an individual insertion,
with only 6.41% involved in nests of TEs inserted into other
TEs. The majority of TE families (97/121, 80.2%) present in
the genome sequence have copies in non-pericentromeric
regions.
Pericentromeric regions
In stark contrast, the 11% of the genome sequence in pericen-
tromeric, low-recombination regions on major chromosome
arms contains 57.5% (n = 3,101) of the 5,390 TEs annotated
and 42.7% (2.78 Mb) of the 6.51 Mb of sequence annotated as
TE. On average, pericentromeric regions are composed of
20.9% TE sequences, with 233 TEs/Mb (Table 1). Overall,
there is approximately 6-fold enrichment in amount of DNA
and a 14-fold increase in TE density in pericentromeric
regions relative to non-pericentromeric regions. It must be
noted, however, that average values of TE content for pericen-
tromeric regions are more variable than for non-pericentro-
meric regions, because of heterogeneity both within a given
pericentromeric region (Figure 1, see below) and among
pericentromeric regions on different chromosome arms. For
example, the pericentromeric region of chromosome arm 3R
had a much lower TE density than other chromosome arms,
perhaps relating to the lack of β-heterochromatic sequences
in polytene chromosomes at the base of this chromosome arm
[27,28]. TE abundance in the pericentromeric region of the X
chromosome is likely to be underestimated because of an
unsized and unsequenced physical gap in cytological division
20 [9,12], which is embedded in a region of extremely high TE
density. Because of these effects and the inclusion of some low
TE content regions on 3L and 3R that arise from our use of the
high-reduced recombination rate boundary (see above), esti-
mates of TE abundance in pericentromeric regions should be
treated as approximate. The rank order of abundance for the
major classes of TEs is the same in the pericentromeric
regions as in non-pericentromeric regions (% TE sequence:
LTR > non-LTR > TIR > INE-1; number of TEs/Mb: INE-1 >
LTR > non-LTR > TIR). Four-fold fewer pericentromeric TEs
were full-length (5.1%) relative to non-pericentromeric
regions, with 3-fold greater numbers involved in nests
(19.5%) (see Table 1). Virtually all TE families (118/121,
97.5%) present in the genome sequence have copies in peri-
centromeric regions.
Chromosome 4
Like pericentromeric regions, the fourth chromosome has a
much higher TE abundance than is typical of the genome as a
whole: although the fourth chromosome is only 1% of the
genome sequence, approximately 10% of TEs annotated are
found on chromosome 4. Overall, there is approximately 7-
fold enrichment in amount of DNA and a 25-fold increase in
TE density on the fourth chromosome relative to regions of
normal TE abundance. Important differences in TE abun-
dance between pericentromeric regions and the fourth chro-
mosome were also observed [2,7] (Table 1). Relative to
pericentromeric regions, the fourth chromosome has a higher
number of TEs per unit of physical distance (422 TEs/MB),
but a similar proportion of genome sequence annotated as TE
(22.6%). As noted previously [2,7], the rank order abundance
of the major TE classes on chromosome 4 differs from the rest
of the genome, with TIR elements as the most abundant class
of TE (% TE sequence: TIR ~ INE-1 > LTR > non-LTR;
number of TEs/Mb: INE-1 > TIR > non-LTR > LTR). To test
the robustness of this pattern, we removed the most numer-
ous family from each of the major TE classes on the fourth
chromosome: LTR, 297 (n = 3); non-LTR, Cr1a (n = 17); TIR,
1360 (n = 62). In the absence of these three highly abundant
families, the rank order percent TE sequence (INE-1 > LTR >
non-LTR > TIR) and number of TEs/Mb (INE-1 > TIR ~ non-
LTR > LTR) change for the fourth chromosome. This result
indicates that patterns of abundance by class on the fourth
chromosome are heavily influenced by a few highly abundant
families, suggesting that Cr1a in addition to INE-1 and 1360
may play an important role in defining the unusual features of
this chromosome [18,29]. Fewer TEs on the fourth chromo-
some are full-length (2.77%) relative to pericentromeric
regions, and a lower proportion of TEs are involved in nests
(12.6%). Less than half of all TE families (55/121, 45.5%)
present in the genome sequence have copies on the fourth
chromosome.
Clear differences were also observed in the distribution of
TFRs in these three genomic compartments. Consistent with
TE densities, non-pericentromeric regions have on average
the largest uninterrupted regions of unique sequence (mean
60,320 bp; median 29,280 bp; n = 1,663), relative to pericen-
tromeric regions (mean 4,147 bp; median 726 bp; n = 2,541)
and the fourth chromosome (mean 2,067 bp; median 1,150
bp; n = 480). Nevertheless, separate analyses of TFR distribu-
tions within each compartment revealed non-random distri-
bution of TEs based on mean TFR lengths in non-
pericentromeric regions (adjusted Kolmogorov-Smirnov test,
D = 0.1627, p < 0.001), pericentromeric regions (adjusted
Kolmogorov-Smirnov test, D = 0.3501, p < 0.001) and chro-
mosome 4 (adjusted Kolmogorov-Smirnov test, D = 0.1541, p
< 0.001). We note that finding of non-random distribution of
TEs in non-pericentromeric regions in the genome sequence
differs from previous conclusions based on cytological esti-
mates [30]. Our results indicate that the non-random distri-
bution of TEs across the entire genome is not explained solely
by overall differences in TE abundance between genomic
compartments and suggest that the mechanisms that deter-
mine the location of TE insertions, such as gene density and
ectopic recombination [7,15,31], may be decoupled from over-
all TE abundance.
Localized regions of extremely high TE density
With this improved calibration of the background TE abun-
dance that is typical of the major chromosome arms, we
sought to identify specific regions of the genome with an
extremely high local TE density (we abbreviate such high-
Genome Biology 2006, Volume 7, Issue 11, Article R112 Bergman et al. R112.7
comment reviews reports refereed researchdeposited research interactions information
Genome Biology 2006, 7:R112
density regions as HDRs). We omitted INE-1 from this analy-
sis to prevent this very abundant family from dominating the
overall genomic trends. Additionally, since it has been postu-
lated that INE-1 underwent a burst of transposition prior to
speciation and has subsequently become immobilized
[16,32], INE-1 elements are predicted to be fixed (barring
subsequent deletion). As such, their distribution in the
sequenced strain should represent a more stable baseline of
ancestral TE content to compare with other more recently
active TE families. We identified 24 HDRs containing 10 or
more (non-INE-1) TEs in a 50 Kb window, a cut-off of roughly
20-fold higher density of TEs than the majority of the genome
(Figure 1, Table 2). Two HDRs have been previously reported:
HDR8 at cytological division 38 [33] and HDR3 at cytological
division 20A, which is likely to be fixed in D. melanogaster
[34].
As expected, nearly all HDRs are located in pericentromeric
regions or on chromosome 4, consistent with the general
observation that heterochromatic and/or low-recombination
rate regions of the genome sequence have high TE densities
(see above) [2,7,15]. Three HDRs (1, 16, 17) on the major chro-
mosome arms are located in regions not defined as pericen-
tromeric; however, HDR1 on the X-chromosome is found
very close to the boundary demarcating these regions and
could probably be classified as pericentromeric. HDRs total
4.27 Mb of sequence and, therefore, comprise only 3.6% of
the genome, but contain one-third (1,822/5,390; 33.8%) of
annotated TEs. Interestingly, one of the most extreme regions
of localized TE density in the D. melanogaster genome
sequence (HDR4) contains the insertion site for a P-element
induced allele (flam
py+(P)
) of the as-yet-uncharacterized gene
flamenco [35], one of the few genetic loci shown to regulate
the activity of transposable elements in Drosophila [36].
HDR4 (which includes the physical gap in cytological division
20) occupies over 230 Kb of DNA and contains at least 104
TEs and 6 genes, including DIP1, which has been excluded as
being the gene that is causal for the flamenco mutation [35].
We note that the COM locus also in 20A2-3, which is known
to regulate the ZAM and Idefix families of LTR elements, is
genetically separable from flamenco [37] and, therefore,
unlikely to correspond to the same region.
Table 2
Regions with extreme TE density in the D. melanogaster Release 4 genome sequence
HDR Chromosome Start End No. of families No. of TEs No. nested Duplicated TEs Collinear Genes
1 X 19,744,508 19,790,060 7 22 0 + + 2 (8)
2 X 20,958,143 20,988,686 13 18 2 + + 1
3* X 21,332,555 21,366,773 13 14 13 - + 0
4
†
X 21,434,542 21,663,556 42 104 39 + + 6
5 X 21,726,082 21,780,371 10 12 4 - + 5
6 X 21,883,728 21,974,732 16 21 0 - + 0
7 X 22,085,438 22,224,390 19 38 12 + Base 9
8 2L 20,100,865 20,210,447 27 61 18 + + 1
9
‡§
2L 21,312,749 21,403,782 20 29 6 + + 7 (3)
10
‡§
2L 21,527,053 21,725,165 36 55 17 - + 10 (1)
11 2L 22,064,386 22,407,834 61 157 52 + Base 19 (1)
12* 2R 387 1,185,590 103 571 156 + Base 45
13
§
2R 1,744,145 2,011,104 42 92 46 + - 2
14 3L 22,910,473 23,771,865 91 411 128 + Base 17
15 3R 310,015 436,430 22 37 8 - + 9
16* 3R 8,294,200 8,327,684 5 38 33 + + 1
17 3R 27,888,358 27,905,053 2 20 12 + Tip 1
18 4 1 46,860 12 14 4 - Base 2 (2)
19 4 201,177 269,428 10 16 9 - + 6
20 4 303,028 348,412 7 10 2 - + 4
21 4 433,967 496,527 10 20 7 + + 4
22 4 926,385 997,041 12 18 3 - + 5
23 4 1,163,173 1,281,586 18 44 13 - Tip 9
HDRs were defined as having >10 non-INE-1 TEs in a 50 Kb window. Numbers of distinct families, numbers of TEs, number of TEs involved in nests,
and the presence of duplicated TEs all exclude INE-1. A plus indicates that unique sequences flanking a HDR are in the collinear orientation in the D.
yakuba genome. Orthologous regions could not be obtained for both flanking regions for HDRs at the tip or base of chromosome arms. Numbers of
genes include coding and non-coding genes, with numbers of pseudogenes indicated in parentheses. *Likely to be fixed in D. melanogaster.
†
Physical
gap present in HDR.
‡
HDRs 9 and 10 flank the Histone gene cluster and likely represent a single HDR.
§
'Weak points' in polytene chromosomes.
R112.8 Genome Biology 2006, Volume 7, Issue 11, Article R112 Bergman et al. />Genome Biology 2006, 7:R112
Two exceptional HDRs are found on chromosome arm 3R.
HDR16 contains a set of duplicated, nested TEs in the inter-
genic region between Hsp70Ba and Hsp70Bb in division 87C
(Figure 2a). This region contains the
αβ
repeat [38], which
our results indicate corresponds to a duplicated nest of Dm88
and invader1 sequences (see also [34,39]. The fact that the
αβ
repeat is composed of TE sequences, as predicted by Hackett
and Lis [40], explains the observation that components of the
αβ
repeat are dispersed in multiple heterochromatic locations
[40] and share homology with 'clustered, scrambled' arrange-
ments of middle repetitive DNA located elsewhere in the
genome [41]. This region also contains the non-coding RNA
gene known as the
αγ
-element, which is transcribed in
response to heat shock [38,42] and is a chimeric transcript
composed of Dm88 and invader1 sequences emanating from
a fragment of the Hsp70 promoter [43]. It is likely that the
unusually high abundance of TE insertions in this region has
arisen in part because of the unusual chromatin architecture
of heat-shock promoters [44,45]. The peculiarity of this
region is underscored by the fact that
αβ
repeat has evolved
since the divergence of D. melanogaster from its sister spe-
cies D. simulans [42,46], but yet appears to be fixed in D. mel-
anogaster [47].
The second exceptional HDR (17) on chromosome arm 3R
corresponds to a tandemly duplicated array of invader4 ele-
ments embedded within the sub-telomeric mini-satellites
called telomere-associated sequences ('TAS'). We also found
that TAS repeats from chromosome arm 2R [48] and the orig-
inal TAS repeat derived from the Dp1187 X-minichromosome
[49] also contain invader4 sequences (results not shown),
although no homology to invader4 (or any other TE) is
observed in the TAS repeat derived from chromosome arms
2L or 3L [48,50], suggesting that TE sequences are not func-
tionally constitutive components of TAS repeats. The pres-
ence of mobile TE sequences in TAS repeats may explain non-
telomeric hybridization signal to TAS probes in the chromo-
center and basal euchromatic locations [49]. No HDRs are
observed at the ends of other chromosome arms, despite the
fact that, in Drosophila, the retrotransposons Het-A, TART
and TAHRE function as telomeric repeats to ensure proper
integrity of the chromosome ends [51-53]. In the Release 4
sequence, only the X chromosome and fourth chromosome
[9] terminate with small clusters of telomeric TE sequences.
Mechanisms that generate localized regions of high TE
density
Surprisingly, the improved resolution provided by our new
annotation showed that TE density is not uniformly high in
pericentromeric regions, nor is TE density simply an increas-
ing function of proximity to centromeric regions (Figure 1,
inset panels). This is especially true for chromosome arms X,
2L and 2R, where pericentromeric HDRs are interspersed
with regions of normal TE density, creating a ragged, punc-
tate increase in TE abundance in the direction of the centro-
mere. Chromosome 4 also exhibits discrete regions of
different TE density (Table 2), despite a higher overall level of
TE abundance. Some HDRs (for example, 1, 8, 13, 16) clearly
occur in regions of low INE-1 density, which suggests a recent
origin for the high TE density in these regions, assuming that
INE-1 represents the ancestral TE distribution at the time of
its major burst activity prior to the split of D. melanogaster
from its sister species D. simulans [16,32]. Other HDRs (9,
10, 15 and those on the fourth chromosome) co-occur with
regions of high INE-1 density, suggesting these regions of the
genome have permitted a high density of TEs, at least as far
back as the ancestor of the D. melanogaster species subgroup
[16,32]. This also is likely to hold true for HDRs 11, 12 and 14
at the bases of chromosome arms 2L, 2R and 3L, where non-
INE-1 TEs occupy virtually all of the sequence, creating an
apparent negative association with INE-1 density.
What evolutionary mechanisms cause such a localized pat-
tern of extreme TE density? Clearly, transposition is the ulti-
mate source of all TE insertions in the genome, and
accordingly HDRs typically contain a mix of different TE fam-
ilies and nested elements (Table 2), both hallmarks of recur-
rent transposition. However, it is possible that other
mechanisms of genome evolution - such as inversion or dupli-
cation - might have contributed to the origin of HDRs. To
investigate whether this punctate pattern of HDRs arose from
chromosomal inversions that bring TE-rich, heterochromatic
DNA into euchromatic regions, we extracted orthologous
regions from the D. yakuba genome sequence and assayed
whether the unique sequences flanking HDRs are collinear in
the two species. We found that unique sequences flanking
HDRs were collinear for 15 of the 16 HDRs (93.8%) that are
internal to the ends of the chromosome arms, for which both
flanking sequences can unambiguously be identified (Table 2,
Figure 3a,b). Intriguingly, HDR 13 does occur in the same
region as an inversion breakpoint between D. melanogaster
and D. yakuba, but outgroup analyses place this inversion
event on the D. yakuba lineage, not the D. melanogaster lin-
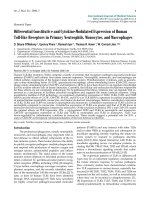
Example regions of extreme TE densityFigure 2 (see following page)
Example regions of extreme TE density. (a) Structure of HDR16 in the Hsp70B region showing tandem arrays of an invader1
→
DM88 nest interrupted by
1360 and micropia insertions and flanked by S-element insertions. Duplicate Hsp70 genes are shown at the bottom of the panel along with the non-coding
RNA
αγ
-element. (b) Structure of HDR1 showing tandem arrays of clustered jockey+Rt1c and Stalker4+invader3 elements interrupted by invader2, F-element
and mdg3 insertions. This region also generates eight CG32821-like gene duplicates. Note that colors for TE families differ in (a,b).
Genome Biology 2006, Volume 7, Issue 11, Article R112 Bergman et al. R112.9
comment reviews reports refereed researchdeposited research interactions information
Genome Biology 2006, 7:R112
Figure 2 (see legend on previous page)
8300000 8310000 8320000 8330000
Hsp70Ba
Hsp70Bbb
Hsp70Bb
Hsp70Bc
a-γ-element
19750000 19760000 19770000 19780000 19790000
CG32821
CG12655
DM88
invader1
micropia
1360
S-element
jockey
Rt1c
invader2
Stalker4
F-element
mdg-3
invader3
CG32821-like
(a)
(b)
R112.10 Genome Biology 2006, Volume 7, Issue 11, Article R112 Bergman et al. />Genome Biology 2006, 7:R112
eage (JM Ranz, D Maurin, YS Chan, LW Hillier, J Roote, M
Ashburner and CM Bergman, personal communication).
Thus, we found no evidence indicating that inversions
carrying TE-rich DNA from heterochromatic regions gener-
ate HDRs, but remarkably we did find evidence that a region
of the D. melanogaster genome that permits a high TE den-
sity can tolerate inversion breakpoints in other Drosophila
lineages. It is important to note, however, that the majority of
HDRs do not correspond to inversion breakpoint regions and
vice versa.
We did, however, find a relatively high incidence of dupli-
cated sequences in HDRs, suggesting that tandem or segmen-
tal duplication plays an important role in the genesis of TE-
rich regions of the genome: 13 of 23 HDRs show evidence of
duplication (Table 2, Figures 2 and 3c,d). Duplications in
HDRs can contain multiple TEs from different families, often
nested, sometimes with different copies of the duplicated
region containing additional TE insertions (Figure 2). Dupli-
cations in HDRs also amplified cellular genes as well as TE
sequences: for example, eight partial and complete duplicates
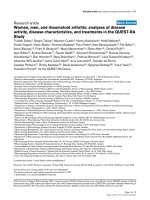
Comparative sequence analysis of two regions of extreme TE densityFigure 3
Comparative sequence analysis of two regions of extreme TE density. (a,b) Pairwise comparison of D. melanogaster HDRs with the orthologous segments
from the D. yakuba genome. (c,d) Self-comparison of D. melanogaster HDRs. Note that the flanking sequences between species are collinear (a,b) and the
presence of complex duplicated sequences (c,d).
HDR 16
HDR 16
HDR 1
HDR 1
D. melanogasterD. melanogaster
D. melanogaster
D. melanogaster
D. yakuba
D. yakuba
D. melanogaster
D. melanogaster
(a) (b)
(c) (d)
Genome Biology 2006, Volume 7, Issue 11, Article R112 Bergman et al. R112.11
comment reviews reports refereed researchdeposited research interactions information
Genome Biology 2006, 7:R112
of the gene CG32381 are present in HDR1 (Figure 2b). HDRs
may also include retrotransposed gene duplicates, such as the
Mgst1-like CG12628 [54], which is found in a nest of TEs in
HDR11. The series of events leading to tandem duplication of
TEs in HDRs is often highly complex, with repeat structures
present at different scales (Figure 3c,d). Duplication of TE
sequences could also be observed in other regions of the
genome with lower TE density, such as duplication of Rt1c
elements interspersed between the SDIC gene duplicates
[55,56]. A more thorough analysis of the interplay between
TEs and segmental duplications will be the subject of a sepa-
rate study (A-S Fiston, D Anxolabehere and H Quesneville,
personal communication).
Global nesting graph at the level of individual TEsFigure 4
Global nesting graph at the level of individual TEs. Nesting relationships among TEs are depicted as a directed, acyclic graph. Nodes (blue circles) represent
individual TEs and directed edges (green arrows) represent transposition events that create primary nesting relationships, with complex nesting events
represented as connected components of the graph. The majority of nests in the genome are characterized by one or more primary nesting relationships,
while some larger nests are composed of secondary or tertiary nesting relationships. The largest nest (*) currently annotated in the genome is found on
chromosome 2R at coordinates 1,763,561-1,829,561. The second largest nest (**) currently annotated in the genome has been described in detail
previously by Maside et al. [34] and is found on chromosome X at coordinates 21,366,773-21,333,853.
*
**
R112.12 Genome Biology 2006, Volume 7, Issue 11, Article R112 Bergman et al. />Genome Biology 2006, 7:R112
A graph-based approach to analyze patterns of TE
nesting
Regions of extremely high TE density typically contain a high
proportion of TEs inserted into other TEs, and our new anno-
tation allowed us to examine patterns of TE nesting in greater
detail than has previously been possible. Few methods exist
to analyze TE nesting, partly because of limitations in accu-
rately joining fragments of a TE insertion that become
separated in the genome by a subsequent nested TE insertion,
and partly because analysis of TE nesting is complicated by
the redundancies inherent in complex nesting relationships.
For example, if one TE (A) is nested within a second (B) that
is in turn nested within a third (C), simply analyzing overlap-
ping ranges of TEs in the genome will erroneously yield three
nesting events (A→B, A→C, and B→C), when only two
occurred historically (A→B and B→C). We found that com-
Global nesting graph at the level of TE familiesFigure 5
Global nesting graph at the level of TE families. Nodes (blue circles) represent TE families and directed edges (green arrows) represent observed instances
of primary nesting relationships. Redundant edges that arise from the different instances in the genome of the same primary nesting event are not shown.
Essentially all families of TEs form a single connected component. Note that cycles within and between families at the family level are formed from nests of
individuals from different genomic locations.
Genome Biology 2006, Volume 7, Issue 11, Article R112 Bergman et al. R112.13
comment reviews reports refereed researchdeposited research interactions information
Genome Biology 2006, 7:R112
plex nesting relationships could best be analyzed by identify-
ing 'primary' nesting relationships (A→B and B→C in the
example above) and assembly of these simple binary events
into more complex nesting relationships by applying concepts
from network analysis to describe and quantify patterns of TE
nesting. In this formulation of the problem, TE nesting rela-
tionships are represented as a graph having TEs as nodes and
transposition events as directed edges. The directed nature of
this graph implies both the spatial relationships of nested TEs
in the genome as well as temporal relationships implied in TE
nesting resulting from the fact that the outer TE in a nest
must have existed in the genome prior to the insertion of the
inner TE [57]. This 'nesting graph' is amenable to standard
computation and can be recast in several forms, since each
annotated TE node can be analyzed at the individual, family
or class level. (We chose not to analyze the degree of distribu-
tion of nesting graphs for 'small-world' properties because of
biases resulting from duplicated nests, and because the
subgraphs in the sequenced portion of the genome may not
reflect properties of the entire nesting graph [58].)
At the individual TE level, nesting relationships form a
sparse, acyclic graph of 785 nodes and 491 edges that pro-
vides a detailed overview of the global pattern of TE nesting
in the D. melanogaster genome (Figure 4). These 785 TEs
(14.6% of all 5,390 TEs annotated) are found in 294 distinct
nests, which can be calculated from the number of sink TEs
(nodes in the graph that have an out-degree of zero). These
294 nests are formed by 448 source TEs (nodes in the graph
with an in-degree of zero), and 43 TEs that act as internal
nodes in the graph (with both non-zero in-degree and out-
degree). The vast majority of TE nests in D. melanogaster
(263/294, 89.4%) are composed of simple 'primary' nests
with a maximal path length of one, consisting mainly of one
(203/263, 77.2%) or sometimes greater than one (60/263,
22.8%) inner TE nesting into a single outer TE. Of the 31 nests
with more complex nesting relationships, 25 have a maximal
path length of two ('secondary' nests), and only 6 have a max-
imal path length of three ('tertiary' nests) (Figure 4). Relative
to the proportion of the genome in each compartment, nests
are highly enriched in pericentromeric regions (215/294,
73.1%), as well as on the fourth chromosome (27/294, 9.2%),
but rare in non-pericentromeric regions (52/294, 17.7%).
The nesting graph at the individual level provides details
about the structures of all TE nests in the genome, but since
individual TEs are members of distinct families nesting rela-
tionships can also be analyzed at the family level by relabeling
nodes with family identifiers and collapsing redundant edges.
Recasting the same set of TEs as a nesting graph at the family
level provides novel means to study the physical proximity
and historical co-existence of all TE families at a global level.
Nesting relationships at the family level form a highly con-
nected cyclic graph of 110 nodes and 334 edges (Figure 5),
involving the vast majority (90.1%) of the 121 TE families rep-
resented in the Release 4 genome annotation. This result
implies that nested TEs provide paths of sequences that con-
nect virtually all families, and that a large diversity of novel
chimeric sequences between different families exists in the
junction regions between TEs in nests. Most TE families (80/
110, 72%) are internal nodes in the graph acting as both inner
and outer components of nests, with only 22 source families
and 8 sink families. The majority of families (97/110, 88%)
also form nested relationships with more than one other fam-
ily. Fifteen families have members that transpose into
another member of same family, forming self-loops (or
cycles) in the graph. Self-nests require a genomic copy to be
present into which another family member can insert, and are
consistent with multiple bursts of transposition for a given
family or a burst that extends over multiple host generations.
Directed cycles other than those from self-nests were also
observed in the family-level nesting graph, clearly indicating
either continuous or discrete periods of overlapping transpo-
sitional activity for different TE families in the lineage leading
to D. melanogaster. Exhaustive enumeration detected 12 dis-
tinct cycles of length two (A→B→A), and 43 distinct cycles of
length three (A→B→C→A), in the family-level nesting graph,
with tens of thousands of distinct cycles of length less than
ten. The complexity of the family-level nesting graph is such
that it is not feasible to enumerate all cycles in reasonable
time; however, a set of independent cycles that do not use the
same edge can be extracted efficiently. Figure 6 shows the set
of edge-disjoint cycles of length greater than three in the fam-
ily-level nesting graph, and provides examples of the complex
periods of contemporaneous TE activity that must be invoked
to explain the global pattern of nesting at the family level.
These procedures detect many novel examples of nesting
among families, in addition to classical examples such as
NOF
→
FB nesting [59,60].
The complexity of nesting among TEs observed at the individ-
ual and family levels simplifies at the class level (Table 3). The
nesting graph at the class level is complete save for events
involving the rare Foldback (FB) class of TEs, with instances
of all possible types of nesting between LTR, non-LTR, TIR
and INE-1 elements observed in the genome. The most fre-
quent type of nesting event at the class level is LTR→LTR
(151/491, 30.7%) and LTR elements form both the most fre-
quent inner (233/491, 47.4%) and outer (207/491, 42.1%)
components of nests, extending the finding based on Release
3 that LTR elements are most often involved in nests or clus-
ters [2]. The rank order of abundance for both inner and outer
members of nests is LTR > non-LTR > TIR > INE-1 > FB,
which follows the trend for amount of TE sequence in the
genome by class rather than number of TEs, indicating that
target size influences class level nesting patterns (Table 1).
The observed number of nests for pairwise combinations of
classes departs significantly from the random expectation
based on the marginal counts of inner and outer nests for
each class (χ
2
= 144.9, 16 degrees of freedom (df), p < 10
-16
).
Non-random patterns of nesting are observed just for the
R112.14 Genome Biology 2006, Volume 7, Issue 11, Article R112 Bergman et al. />Genome Biology 2006, 7:R112
three major classes of TEs (χ
2
= 81.8, 4 df, p < 10
-16
), suggest-
ing that neither the low FB counts nor undue influence by
INE-1 causes this pattern. The non-random pattern of nesting
appears in large part to be the result of preferences for TEs to
nest in other TEs of the same class, which may represent some
sort of a 'homing effect' mediated through protein complexes
shared by the TEs belonging to the same class. Alternatively,
the non-random pattern of nesting among TE classes may
Directed cycles in the family-level TE nesting graphFigure 6
Directed cycles in the family-level TE nesting graph. Shown are the set of edge-disjoint directed cycles of path length greater than three. Nodes (blue
circles) represent TE families and directed edges (green arrows) represent observed instances of primary nesting relationships. Note that many thousands
of distinct directed cycles that share edges in common can be enumerated in the family-level nesting graph in addition to those shown here.
Table 3
Patterns of nesting among different classes of TE in the D. melanogaster Release 4 genome sequence
LTR Non-LTR TIR INE-1 FB Outer total
LTR 151 39 12 4 1 207
Non-LTR 46461017 0119
TIR 28293218 6113
INE-1 8198 9 347
FB 040105
Inner total 233137624910
Observed numbers of 25 possible categories of TE nests from 5 classes of TEs (LTR, non-LTR, TIR, INE-1 and FB) from 491 total nests.
Cr1a
Cr1a
Stalker4 G5A
Doc
baggins
Cr1a
FB
Doc
1360
invader4 Rt1b
1360
gypsy
invader3
gypsy
transib1
INE-1
Max-element
1360
INE-1
NOF
Cr1a
G4
Stalker2
Stalker4
invader6
BS3
X-element
S-element
baggins
Tc3
diver2
F-element
Dm88
mdg3
BS3
G5A
1360
I-element
transib2
jockey
Doc2-element
Cr1a
gypsy8
Fw2
1360
gypsy7
diver2
1360
gypsy12
Rt1c
accord2
gypsy9
FB
Max-element
jockey2
INE-1
INE-1
Ivk
FB
copia
diver2
opus
Burdock
INE-1
Cr1a
Cr1a
gypsy8
HB
rooA
GATE
roo
Quasimodo
Genome Biology 2006, Volume 7, Issue 11, Article R112 Bergman et al. R112.15
comment reviews reports refereed researchdeposited research interactions information
Genome Biology 2006, 7:R112
also result from complex historical factors, including the total
amount of pre-existing TE sequence present in the genome as
targets for insertion, and/or a non-random order of transpo-
sitional events among families and classes of TEs.
Discussion
Organization of TEs in β-heterochromatic regions
The nature of the transition zone between euchromatin and
heterochromatin in D. melanogaster has been the subject of
much controversy, in part because heterochromatic regions
(as defined in mitotic chromosomes) can be further subdi-
vided into α-heterochromatin and β-heterochromatin [61]. β-
heterochromatic regions are cytologically visible in polytene
chromosomes, although their banding pattern is 'diffuse' or
'mesh-like,' suggesting under-replication relative to the finely
banded euchromatic regions (reviewed in [28]). Under-repli-
cated regions are observed elsewhere in polytene
chromosomes and co-localize with regions referred to as
'weak points' or 'intercalary heterochromatin' that form
ectopic contacts and are subject to chromosome breakage
[62,63]. The amount and degree of polytenization in β-hete-
rochromatic regions is subject to both environmental and
genetic factors [64], as most conclusively shown by the
appearance of several large banded regions in the chromo-
center of salivary gland chromosomes of the Su(UR) mutant
[65]. Charlesworth et al. estimate that 10% of the D. mela-
nogaster genome is composed of β-heterochromatin [24] and
large amounts of β-heterochromatic DNA are found in peri-
centromeric regions of most (but not all) chromosome arms
[27,28], a fraction of which is captured in the Release 4
genome sequence (Figure 1).
Analysis of the first draft of the D. melanogaster genome
sequence offered the first glimpse of the contiguous molecu-
lar organization of β-heterochromatin, and suggested that
"there is no clear boundary between heterochromatin and
euchromatin" but rather that the transition is characterized
by "a gradual increase in the density of transposable elements
and other repeats" [66]. The view that the β-heterochromatic
regions exhibit a gradual increase in TE density has been sub-
sequently reiterated [25,67], although our results call this
view into question for three of the five major chromosome
arms. Far from a gradual transition, our high-resolution TE
annotation provides evidence for discretely localized regions
of extremely high TE density at the base of chromosome arms
X, 2L and 2R overlain on a background of increased TE abun-
dance, such that the increase in TE content is not monotonic
in the direction of the centromere. This result represents the
inverse of, and provides an explanation for, previous observa-
tions that the distribution of genes on these chromosome
arms alternates between low and high density in the centro-
mere proximal direction [66,67]. We note that the alternating
pattern of high and low TE (versus unique) sequences
reported here in β-heterochromatic regions differs from the
'islands' of complex (TE) sequences surrounded by 'seas' of
satellite DNA observed deeper in α-heterochromatic regions
[68].
How does the ragged, punctate pattern of TE density affect
the interpretation of the transition zone between euchroma-
tin and heterochromatin? If TE density is directly responsible
for heterochromatin formation, then such discrete regions of
extreme TE density may argue against a gradual transition
between euchromatin and heterochromatin, and would sup-
port the model of Lifschytz [69], who suggested several dis-
tinct transitions between euchromatin and heterochromatin
in cytological divisions 19-20 of the X chromosome. However,
as noted by Yamamoto et al
. [70], the interpretation of multi-
ple, discrete transitions between euchromatin and hetero-
chromatin by Lifschytz [69] was based indirectly on the
distribution of X-ray induced deletions, rather than direct
HDRs are hotspots for X-ray induced deletionFigure 7
HDRs are hotspots for X-ray induced deletion. Alignment of the genetic map adapted from Figure 1 of Lifschytz [69] and the Release 4 genome annotation
in the interval from Hlc (= A112) to fog (= M67) shows a one-to-one correspondence between HDRs 3, 4, 5 and 6 with X-ray hotspot intervals 12, 11, 9
and 7, respectively. Additional HDRs and X-ray hotspots discussed in the text are omitted for clarity.
21300000 21500000 21700000 21900000
HDRs
TEs
Genes
34 5 6
A112
E54
Lifschytz (1978)
Q464
R9-13
YT1
Q465
M67
12
11
Hlc
fog
97
adapted from
R112.16 Genome Biology 2006, Volume 7, Issue 11, Article R112 Bergman et al. />Genome Biology 2006, 7:R112
cytological evidence for heterochromatic properties. We inte-
grated our annotation of HDRs in the Release 4 genome
sequence with the genetic map of Lifschytz [69] and found a
striking correspondence between our HDRs and 'hotspots' for
X-ray induced deletions in his analysis. Based on the few
complementation groups that can be mapped to the genome
(A112 = Hlc, M67 = fog, and X-3 = stn), we hypothesize that
our HDRs 2, 3, 4, 5, 6, and 7 correspond to hotspot intervals
18, 12, 11, 9, 7, and 6, respectively, in [69] (Figure 7). The
major hot-spot for X-ray induced breakage in this region
(interval 11 in 20A) most likely corresponds to HDR4, which
we find to be the region of highest TE density in the genome
sequence. Together, these results suggest that the Lifschytz
[69] data may simply reflect preferential breakpoint use in
TE-rich regions devoid of genic function, rather than multiple
distinct transitions between euchromatin and hetero-
chromatin. These conclusions support those of Ashburner et
al. [71], who showed that the distribution of rearrangement
breakpoints in the Adh region correlates with the amount of
DNA in an interval rather than with any property of the
sequence itself.
Further evidence that discrete regions of extreme TE density
outside of β-heterochromatic regions may have unusual cyto-
logical properties can be found on chromosome 2. Discrete
HDRs can be observed in the vicinity of the Histone cluster in
39E (HDRs 9+10) and just distal to the major tRNA cluster at
42A (HDR13). Both of these regions are known to be 'weak
points' in polytene chromosomes, which form breaks and
ectopic contacts with other weak points in the genome that
are alleviated by the Su(UR) mutation, suggesting that these
regions are under-replicated in polytene chromosomes [65].
These observations, together with the generally poor banding
patterns in high TE density pericentromeric regions and on
the fourth chromosome, suggest that high TE density may
directly interfere with the process of polytenization, either
through stalling replication forks [72] or through DNA elimi-
nation [73]. Thus, high TE densities may not be directly
responsible for heterochromatin formation per se, but may
simply inhibit the ability to detect bona fide euchromatic
regions that are TE dense, at least in salivary gland polytene
chromosomes. The formation of large blocks of TE-rich,
banded material deep in heterochromatic regions in under-
replication suppressing strains like Su(UR) supports this
view [65,74]. Moreover, if regions of high TE density affect
polytenization, ectopic contact among 'weak points' may
occur via homology between sequences of the same TE fam-
ily. Additionally, the inherent mobility of TEs provides a
mechanism to explain differences in the presence or absence
of β-heterochromatin on homologous chromosome arms
among Drosophila species [28].
Origin of 'clustered scrambled repeats'
Although the predominant organization of middle repetitive
DNA such as TE sequences in D. melanogaster is character-
ized by individual repeats found within long regions of single
copy DNA (the 'long period interspersion' pattern) [21], direct
evidence has long existed for an alternative organization
characterized by 'clustered scrambled repeats' [21,41]. Wen-
sink et al. [41] estimated that the genome of D. melanogaster
contained over 1,000 such clustered scrambled repeats and
predicted that these regions were created by recurrent mobile
element insertion. The HDRs and TE nests detected in the
present study likely correspond to a subset of the clustered,
scrambled repeats detected by Wensink et al. [41], with the
remainder yet to be discovered in currently unfinished or
unsequenced heterochromatic regions. Clustered, scrambled
TE nests are generally thought to arise through the serial
transposition of individual elements into previously inserted
TEs, as shown by the analysis of nested TEs in maize, which
demonstrated that the ages of inner TEs are younger than the
outer TEs into which they insert [57]. Such serial transposi-
tion is ultimately responsible for the origin of nested TEs,
though once formed, nests may be subsequently copied and
Examples of potentially transposed TE nestsFigure 8
Examples of potentially transposed TE nests. Four copies of related jockey2
→
Cr1a nests in HDR7 at the base of the X chromosome, with the two
proximal copies nested within 297-elements. We note that a large number of additional TEs in this region are omitted for clarity. Simple tandem
duplication of jockey2
→
Cr1a nests cannot explain nesting in the 297-element, and duplication of a jockey2
→
Cr1a
→
297 nest would require two subsequent
complete losses of 297 sequences from the distal copies. An equally or more parsimonious explanation involves transposition of a jockey2
→
Cr1a nest into
a 297-element and subsequent duplication.
22100000 22150000
22200000
7
Cr1a
jockey2
jockey2
297
Cr1a
jockey2
297
Cr1a
jockey2
Cr1a
Genes
TEs
CG40500
CG41106
CG40486
CG40485
HDRs
Genome Biology 2006, Volume 7, Issue 11, Article R112 Bergman et al. R112.17
comment reviews reports refereed researchdeposited research interactions information
Genome Biology 2006, 7:R112
amplified. Therefore, it is possible other mechanism may play
an important role in the genome-wide pattern of clustered
scramble repeats, such as the transposition or duplication of
previously nested elements.
Evidence for duplication of clustered or nested TEs is clearly
observed in our data (Figures 2 and 3), as was predicted by
Charlesworth et al. [24], who argued for duplication of TEs on
the basis of high variance in heterochromatic TE copy
number among strains of Drosophila. Duplication of clus-
tered or nested TEs has also been reported previously in het-
erochromatic regions of the Drosophila genome not studied
here [39,68,75], as well as in the barley [76,77] and Arabidop-
sis [78] genomes. Although the phenomenon of duplicated
clusters/nests in TE dense regions appears to be a recurrent
pattern, the exact mechanism(s) that create duplicated
clusters/nests is (are) less clear. In some cases, tandem dupli-
cation is sufficient to explain the pattern of identical or
related TE clusters/nests in the same local region (for exam-
ple, the Hsp70 region). However, some examples of dupli-
cated clusters/nests do not seem to fit with a model of simple
tandem duplication. One such example is found in four iden-
tical instances of a jockey2
→
Cr1a nest at the base of the X
chromosome in HDR7 (Figure 8). The two proximal copies of
this repeated nest are themselves nested within 297 elements
(FBti0062438→FBti0062418→FBti0062352;
FBti0062439→FBti0062435→FBti0062353) and are sepa-
rated by unique sequence containing the genes CG40485 and
CG40486. The two distal copies of this nest are not inserted
into 297 or any other TE (FBti0062436→FBti0062415;
FBti0062437→FBti0062417) and are separated from each
other by approximately 45 Kb of other TE and unique
sequences, with the most distal copy found in the intron of the
gene CG40500. No evidence of tandem duplication can be
observed in comparisons of the D. melanogaster region with
itself or the orthologous D. yakuba region (results not
shown), nor is there any relic of 297 sequence surrounding
the two distal copies, as would be expected if they arose by
simple tandem duplication.
Such observations are difficult to explain without proposing
that the duplicated copies of this jockey2
→
Cr1a nest arose by
transposition of a pre-existing nested element, as was pro-
posed to occur by Wensink et al. [41]. Other potential exam-
ples of transposition of clustered, scrambled repeats can also
be observed in our data, such as a jockey-Rt1c cluster present
in both HDR1 and HDR2, which are separated by over a
megabase of DNA, and a BS3-X-element cluster present near
su(f) and that is also found in HDR7 [39]. Though it may seem
unlikely, the transposition of nested TEs is indeed plausible
since DNA-based elements can transpose when additional
sequences are inserted between TIRs [79], and retroelements
may reverse transcribe mRNAs arising from nested or rear-
ranged TEs, a mechanism that has been invoked previously
for the formation of new TE families [80]. Moreover, the raw
material for retrotransposition of nested elements is available
in the fly transcriptome, as reflected in the chimeric
transcripts that arise from two or more TEs found in D. mel-
anogaster EST/cDNA libraries (results not shown).
Do β-heterochromatic regions permit the evolution of
co-suppression networks?
A growing body of evidence implicates RNA silencing mecha-
nisms in regulating the activity of TE expression and transpo-
sition in Drosophila. Expression of TE-derived transcripts is
elevated in mutations for genes involved in RNA silencing,
including spn-E, aubergine and piwi [81-84]. The capacity of
telomeric P-element insertions to induce the repressive P-
cytotype is also impaired in aubergine mutants [85]. All
major classes of TE in Drosophila produce small repeat asso-
ciated RNAs (rasiRNAs) [86] that may be used to silence TE
expression using a dicer-independent RNA silencing pathway
[84]. Moreover, the Argonaute family member piwi regulates
expression from copia and gypsy reporter transgenes [82,83]
and rates of mdg1 transposition are elevated in a piwi mutant
background [82]. Similarly, resistance to invasion by the I-
element can be provided by strains carrying a transgene con-
taining I-element sequences in a dose-, length- and transcrip-
tion-dependent manner [87]. Heterologous reporter genes
carrying transcribed gypsy sequences are also sensitive to
regulation by flamenco [83], suggesting the possibility of an
RNA dependent mechanism of action for this locus, which is
known to regulate rates of gypsy transposition.
Regulation of TE transposition may rely on endogenous TE
sequences present in the genome as well as the RNA silencing
machinery. Jensen et al. [88] proposed an indirect model of
co-suppression through 'relay' sequences derived from defec-
tive I-elements located in pericentromeric regions. Likewise,
mapping of factors controlling rates of gypsy, ZAM and Idefix
transposition to a β-heterochromatic location at the base of
the X chromosome has led Desset et al. [89] to propose that
transcription from remnants of TEs in 20A may provide the
critical substrate for co-suppression of these transposable
element families. Our work demonstrates that the Drosophila
genome contains ample material for co-suppression within
virtually all TE families, given the fact that transcription is
known to occur in β-heterochromatin regions [90].
In addition to the possibility of co-suppression among differ-
ent copies of the same TE family, our analysis of nesting rela-
tionships among different TE families suggests the possibility
of an extensive network of co-suppression among essentially
all families in the genome (Figure 5). We propose that expres-
sion of chimeric sequences from TE nests may simultaneously
co-suppress multiple TE families by acting as relay sequences
that co-suppress transcripts from other nests or individual
elements located in the euchromatic arms. Evidence for such
a 'co-suppression network' is found in the
COM locus, which
appears to control the activity of more than one TE family
simultaneously. Even in the absence of direct co-suppression
on a family, once a member of a newly invading TE family
R112.18 Genome Biology 2006, Volume 7, Issue 11, Article R112 Bergman et al. />Genome Biology 2006, 7:R112
transposes into the nesting network, the entire family could
become regulated by co-suppression mechanisms. This
model proposes that the accumulation of clustered, nested
TEs in β-heterochromatic regions may incidentally provide a
trap for the regulation of TEs across the genome, and solves
the need for the host to evolve separate genic changes to
regulate the transposition of each new family that invades the
genome. Such a co-suppression network could act as a global
TE surveillance mechanism, with the highly nested structure
of TEs in β-heterochromatic regions intrinsically providing a
systems-level 'adaptive immunity' from invasion by
horizontal transfer. Moreover, since nesting can bring several
TE promoters in close proximity to each other and thereby
increase the probability of transcription, TE nesting may
facilitate a more effective co-suppression network than would
be possible through the cumulative effects among isolated
TEs within single families. Finally, since as a TE family
increases in number the chance it participates in the co-sup-
pression network is likely to increase, pervasive nesting may
also generate a pressure on TE families to diversify (as has
previously been proposed for the mechanism of ectopic
recombination [91]), potentially providing an explanation for
the large diversity of TE families in the Drosophila genome.
Conclusion
By accounting for the non-random distribution of TEs across
the genome, we provide an accurate estimate of TE abun-
dance for the vast majority of the genome sequence in high-
recombination, non-pericentromeric regions. We confirm
that regions of extreme TE density are mostly in the pericen-
tromeric and/or low-recombination regions of the genome
that are known broadly to have high TE abundance. However,
we show that regions of high TE density within pericentro-
meric regions are often distinctly localized and interrupted by
regions of normal TE density in the transition zone from
euchromatic to β-heterochromatic regions. Through compar-
ative analysis with D. yakuba, we found no evidence that this
ragged, punctate pattern of highly localized TE abundance
arises via inversion of TE-rich sequences from deeper in het-
erochromatic regions. We did find, however, that duplication
of TE sequences plays an important role in the rapid evolution
of localized regions of extreme TE abundance. We introduced
network analysis techniques to study patterns of TE nesting,
providing a comprehensive view of the spatial and temporal
interactions among TEs at the individual, family and class
levels. We show the existence of a highly connected family-
level nesting network, which suggests the possibility of an
intrinsic 'co-suppression network' acting to regulate the vast
majority of TE families in D. melanogaster genome. The
results presented here provide a framework for comparison
with finished heterochromatic sequences being produced by
the Drosophila Heterochromatin Genome Project [13].
Materials and methods
Dataset of TE annotations
The combined-evidence method used to identify TE
sequences has been described previously [10]. Briefly, bor-
rowing concepts from gene annotation, we have developed a
TE annotation pipeline that integrates multiple lines of com-
putational evidence to generate 'TE models.' The 6,013 pre-
dicted TE models of Quesneville et al. [10] were used with the
following exceptions. Three TE annotations were removed
(FlyBase IDs: FBti0062904, FBti0060950 and
FBti0060875) that have subsequently been shown to be
redundant entries that resulted from edge effects in overlap-
ping contigs. In addition, all TE models based on non-D. mel-
anogaster canonical elements were removed with the
exception of those from D. simulans, the sister species to D.
melanogaster, to be conservative in our analyses. These 620
annotations from foreign elements account for over 10% of
the TE models but only 82,229 bp (1.2%) of sequence of the
sequence annotated as TE in [10].
Testing a model of random TE distribution
Under the null hypothesis that TEs are distributed uniformly
throughout a genomic region, distances between TEs (TE-
free regions, abbreviated as TFRs) should follow a negative
exponential distribution [20]. In contrast to the analysis of
Simons et al. [20] who evaluate the number of TFRs above an
arbitrary length cutoff, we test the fit of observed TFR lengths
to the full negative exponential distribution. The rate param-
eter for the negative exponential can be estimated in two
ways, either as the inverse of the mean of observed TFR
lengths, or by dividing the number of TE insertions by the
total length of TFRs, as in [20]. In the first case, the observed
TFR distribution can be tested directly against the expected
distribution computed from the negative exponential distri-
bution. In the second case, since nested elements contribute
to the number of TE insertions but not the length of TFRs, the
number of inner nested TEs (491) must be discounted from
the total number of insertions before computing the average
TFR length, or an equivalent number of 0-length TFRs must
be added to the observed TFR length distribution. Goodness-
of-fit to the negative exponential distribution was calculated
using the Kolmogorov-Smirnov one-sample statistic in R
[92], which computes the maximal difference between the
observed and expected cumulative distributions. We have
used adjusted critical values taken from [22] to account for
the fact that the rate parameter of the expected distribution
was estimated from the data.
Definition of chromatin and recombination boundaries
Cytological boundaries of the pericentromeric euchromatin/
heterochromatin boundary were estimated from the mitotic
FISH data in [25], as mapped to Release 4 (Chris D Smith,
personal communication). Boundaries between 'high,'
'reduced,' and 'null' recombination rates in pericentromeric
regions [26] were estimated by mapping cytological locations
to the Release 4 sequence using the 'cytolocation' search in
Genome Biology 2006, Volume 7, Issue 11, Article R112 Bergman et al. R112.19
comment reviews reports refereed researchdeposited research interactions information
Genome Biology 2006, 7:R112
FlyBase gbrowser [93]. Ranges of cytological divisions were
grouped into genome coordinates following Bartolome et al.
[7]. Boundaries of pericentromeric regions were operation-
ally defined for the major chromosome arms as regions of
reduced recombination as the proximal positions of bands
19D3 on chromosome arm X (20,369,021), 38A1 on chromo-
some arm 2L (19,669,505), and 77E1 on chromosome arm 3L
(20,545,022), and the distal positions of bands 42F3 on
chromosome arm 2R (2,692,485) and 84B1 on chromosome
arm 3R (2,811,816).
Definition and analysis of regions of high TE density
Sliding window analysis to identify HDRs was done using 50
Kb windows with a 25 Kb offset. The number of TEs per win-
dow, rather than percent TE sequence, was used to identify
regions of high TE density. Windows having 10 or more TEs/
50 Kb (that is, 200 TEs/Mb), a density that is approximately
20-fold the average of non-pericentromeric regions were
used to seed HDRs. Neighboring windows were then merged
to define the final set of HDRs, allowing intervening windows
of 9 or more TEs/50 Kb to account for small fluctuations in
TE abundance. Orthologous regions in the D. yakuba
(droYak1, April 2004) genome sequence of HDRs in D. mela-
nogaster ± 50 Kb were extracted from the Berkeley pipeline
whole-genome alignments [94] and updated to the most
recent version of the D. yakuba genome sequence (droYak2,
November 2005) using BLAT [95]. Dotplot analysis of orthol-
ogous regions was performed on both forward and reverse
strands or HDRs and their orthologues using the dottup pro-
gram in the EMBOSS package [96].
Graphical analysis of TE nesting
Patterns of TE nesting were analyzed using network analysis
techniques, with nesting events represented as directed edges
between two TE nodes. The Release 4 annotation represents
nested TEs as overlapping spans among sets of genome
coordinates, where the range of an inner TE in a nest is fully
subsumed within the range of an outer TE. For each inner TE
in the genome that met these conditions, we identified the
'primary' nesting relationship among the single outer TE
immediately present on both sides of the inner TE span, and
created a directed edge in the nesting graph labeled
inner→outer. The inner and outer labels were individual,
family or class identifiers, depending on the biological level of
analysis. These primary nesting relationships provide a suffi-
cient and non-redundant description of TE nesting in the
genome, and can be used to reconstruct more complex nest-
ing relationships at the individual, family or class levels.
Manipulation, analysis and visualization of nesting graphs
were conducted using the PERL Graph module version 0.69
[97], the Combinatorica package in Mathematica 5.1 [98] and
Cytoscape 2.2 [99]. Enumeration of all directed cycles of a
fixed path length was performed using the method described
in [100].
Acknowledgements
We thank Chris Smith for supplying Release 4 estimates of the euchroma-
tin/heterochromatin boundaries, Brian Charlesworth for advice on esti-
mated boundaries of recombination rates, and the Washington University
Genome Sequencing Center for the D. yakuba genome sequences. We
thank Douda Bensasson, Brian Charlesworth, Scott Hawley, Roger
Hoskins, Gary Karpen and Steve Russell for insightful discussions and Brian
Charlesworth, Roger Hoskins, Max Reuter, Chris Smith and one anony-
mous reviewer for comments on the manuscript. This work was supported
by a USA Research Fellowship from the Royal Society to CMB; by the 'Cen-
tre National de Recherche Scientifique' (CNRS), the Universities P and M
Curie and D Diderot (Institut Jacques Monod, UMR 7592) and by the 'Pro-
gramme Bio-Informatique' (CNRS); and by a MRC Programme Grant to
MA and S Russell.
References
1. The Arabidopsis Genome Initiative: Analysis of the genome
sequence of the flowering plant Arabidopsis thaliana. Nature
2000, 408:796-815.
2. Kaminker JS, Bergman CM, Kronmiller B, Carlson J, Svirskas R, Patel
S, Frise E, Wheeler DA, Lewis SE, Rubin GM, et al.: The transposa-
ble elements of the Drosophila melanogaster euchromatin: a
genomics perspective. Genome Biol 2002, 3:RESEARCH0084.
3. Lander ES, Linton LM, Birren B, Nusbaum C, Zody MC, Baldwin J,
Devon K, Dewar K, Doyle M, FitzHugh W, et al.: Initial sequencing
and analysis of the human genome. Nature 2001, 409:860-921.
4. Yu J, Hu S, Wang J, Wong GK, Li S, Liu B, Deng Y, Dai L, Zhou Y,
Zhang X, et al.: A draft sequence of the rice genome (Oryza
sativa L. ssp. indica). Science 2002, 296:79-92.
5. Myers EW, Sutton GG, Delcher AL, Dew IM, Fasulo DP, Flanigan MJ,
Kravitz SA, Mobarry CM, Reinert KH, Remington KA, et al.: A
whole-genome assembly of Drosophila. Science 2000,
287:2196-2204.
6. Benos PV, Gatt MK, Murphy L, Harris D, Barrell B, Ferraz C, Vidal S,
Brun C, Demaille J, Cadieu E, et al.: From first base: the sequence
of the tip of the X chromosome of Drosophila melanogaster,
a comparison of two sequencing strategies. Genome Res 2001,
11:710-730.
7. Bartolome C, Maside X, Charlesworth B: On the abundance and
distribution of transposable elements in the genome of Dro-
sophila melanogaster. Mol Biol Evol 2002, 19:926-937.
8. Blumenstiel JP, Hartl DL, Lozovsky ER: Patterns of insertion and
deletion in contrasting chromatin domains. Mol Biol Evol 2002,
19:2211-2225.
9. Celniker SE, Wheeler DA, Kronmiller B, Carlson JW, Halpern A,
Patel S, Adams M, Champe M, Dugan SP, Frise E, et al.: Finishing a
whole genome shotgun sequence assembly: release 3 of the
Drosophila euchromatic genome sequence. Genome Biol 2002,
3:RESEARCH0079.
10. Quesneville H, Bergman CM, Andrieu O, Autard D, Nouaud D, Ash-
burner M, Anxolabehere D: Combined evidence annotation of
transposable elements in genome sequences. PLoS Comput Biol
2005, 1:e22.
11. Caspi A, Pachter L: Identification of transposable elements
using multiple alignments of related genomes. Genome Res
2006, 16:260-270.
12. Berkeley Drosophila Genome Project: Release 4 Notes
[ />13. Drosophila Heterochromatin Genome Project [http://
www.dhgp.org/]
14. Locke J, Howard LT, Aippersbach N, Podemski L, Hodgetts RB: The
characterization of DINE-1, a short, interspersed repetitive
element present on chromosome and in the centric hetero-
chromatin of Drosophila melanogaster. Chromosoma 1999,
108:356-366.
15. Rizzon C, Marais G, Gouy M, Biemont C: Recombination rate and
the distribution of transposable elements in the Drosophila
melanogaster genome. Genome Res 2002, 12:400-407.
16. Kapitonov VV, Jurka J: Molecular paleontology of transposable
elements in the Drosophila melanogaster genome. Proc Natl
Acad Sci USA 2003, 100:6569-6574.
17. Montgomery E, Charlesworth B, Langley CH: A test for the role of
natural selection in the stabilization of transposable element
copy number in a population of Drosophila melanogaster.
Genet Res 1987, 49:31-41.
R112.20 Genome Biology 2006, Volume 7, Issue 11, Article R112 Bergman et al. />Genome Biology 2006, 7:R112
18. Slawson EE, Shaffer CD, Malone CD, Leung W, Kellmann E, Shevchek
RB, Craig CA, Bloom SM, Bogenpohl J 2nd, Dee J, et al.: Comparison
of dot chromosome sequences from D. melanogaster and D.
virilis reveals an enrichment of DNA transposon sequences in
heterochromatic domains. Genome Biol 2006, 7:R15.
19. Yang HP, Hung TL, You TL, Yang TH: Genome-wide comparative
analysis of the highly abundant transposable element DINE-
1 suggests a recent transpositional burst in Drosophila
yakuba. Genetics 2005, 173:189-96.
20. Simons C, Pheasant M, Makunin IV, Mattick JS: Transposon-free
regions in mammalian genomes. Genome Res 2006, 16:164-172.
21. Manning JE, Schmid CW, Davidson N: Interspersion of repetitive
and nonrepetitive DNA sequences in the Drosophila mela-
nogaster genome. Cell 1975, 4:141-155.
22. Srinivasan R: An approach to testing the goodness of fit of
incompletely specified distributions. Biometrika 1970,
57:605-611.
23. Charlesworth B, Langley CH: The population genetics of Dro-
sophila transposable elements. Annu Rev Genet 1989,
23:251-287.
24. Charlesworth B, Jarne P, Assimacopoulos S: The distribution of
transposable elements within and between chromosomes in
a population of Drosophila melanogaster. III. Element abun-
dances in heterochromatin. Genet Res 1994, 64:183-197.
25. Hoskins RA, Smith CD, Carlson JW, Carvalho AB, Halpern A,
Kaminker JS, Kennedy C, Mungall CJ, Sullivan BA, Sutton GG,
et al.:
Heterochromatic sequences in a Drosophila whole-genome
shotgun assembly. Genome Biol 2002, 3:RESEARCH0085.
26. Charlesworth B: Background selection and patterns of genetic
diversity in Drosophila melanogaster. Genet Res 1996,
68:131-149.
27. Gall JG: Repetitive DNA in Drosophila. In Molecular Cytogenetics
Edited by: Hamkalo BA, Papaconstantinou J. New York: Plenum;
1973:59-74.
28. Miklos GL, Cotsell JN: Chromosome structure at interfaces
between major chromatin types: alpha- and beta-hetero-
chromatin. Bioessays 1990, 12:1-6.
29. Sun FL, Haynes K, Simpson CL, Lee SD, Collins L, Wuller J, Eissenberg
JC, Elgin SC: cis-Acting determinants of heterochromatin for-
mation on Drosophila melanogaster chromosome four. Mol
Cell Biol 2004, 24:8210-8220.
30. Charlesworth B, Lapid A, Canada D: The distribution of transpos-
able elements within and between chromosomes in a popu-
lation of Drosophila melanogaster. II. Inferences on the nature
of selection against elements. Genet Res 1992, 60:115-130.
31. Wright SI, Agrawal N, Bureau TE: Effects of recombination rate
and gene density on transposable element distributions in
Arabidopsis thaliana. Genome Res 2003, 13:1897-1903.
32. Singh ND, Petrov DA: Rapid sequence turnover at an inter-
genic locus in Drosophila. Mol Biol Evol 2004, 21:670-680.
33. Butler H, Levine S, Wang X, Bonyadi S, Fu G, Lasko P, Suter B, Doerig
R: Map position and expression of the genes in the 38 region
of Drosophila. Genetics 2001, 158:1597-1614.
34. Maside X, Assimacopoulos S, Charlesworth B: Fixation of trans-
posable elements in the Drosophila melanogaster genome.
Genet Res 2005, 85:195-203.
35. Robert V, Prud'homme N, Kim A, Bucheton A, Pelisson A: Charac-
terization of the flamenco region of the Drosophila mela-
nogaster genome. Genetics 2001, 158:701-713.
36. Prud'homme N, Gans M, Masson M, Terzian C, Bucheton A: Fla-
menco, a gene controlling the gypsy retrovirus of Drosophila
melanogaster. Genetics 1995, 139:697-711.
37. Desset S, Meignin C, Dastugue B, Vaury C: COM, a heterochro-
matic locus governing the control of independent endog-
enous retroviruses from Drosophila melanogaster. Genetics
2003, 164:501-509.
38. Lis JT, Prestidge L, Hogness DS: A novel arrangement of
tandemly repeated genes at a major heat shock site in D.
melanogaster. Cell 1978, 14:901-919.
39. O'Hare K, Chadwick BP, Constantinou A, Davis AJ, Mitchelson A,
Tudor M: A 5.9-kb tandem repeat at the euchromatin-hetero-
chromatin boundary of the X chromosome of Drosophila
melanogaster. Mol Genet Genomics 2002, 267:647-655.
40. Hackett RW, Lis JT: DNA sequence analysis reveals extensive
homologies of regions preceding hsp70 and alphabeta heat
shock genes in Drosophila melanogaster. Proc Natl Acad Sci USA
1981, 78:6196-6200.
41. Wensink PC, Tabata S, Pachl C: The clustered and scrambled
arrangement of moderately repetitive elements in Dro-
sophila DNA. Cell 1979, 18:
1231-1246.
42. Livak KJ, Freund R, Schweber M, Wensink PC, Meselson M:
Sequence organization and transcription at two heat shock
loci in Drosophila. Proc Natl Acad Sci USA 1978, 75:5613-5617.
43. Lipatov M, Lenkov K, Petrov DA, Bergman CM: Paucity of chi-
meric gene-transposable element transcripts in the Dro-
sophila melanogaster genome. BMC Biol 2005, 3:24.
44. Lerman DN, Michalak P, Helin AB, Bettencourt BR, Feder ME: Mod-
ification of heat-shock gene expression in Drosophila mela-
nogaster populations via transposable elements. Mol Biol Evol
2003, 20:135-144.
45. Walser JC, Chen B, Feder ME: Heat-shock promoters: targets
for evolution by P transposable elements in Drosophila. PLoS
Genet 2006, 2:e165.
46. Leigh Brown AJ: Variation at the 87A heat-shock loci in Dro-
sophila melanogaster. Proc Natl Acad Sci USA 1983, 80:5350-5354.
47. Maside X, Bartolome C, Charlesworth B: S-element insertions are
associated with the evolution of the Hsp70 genes in Dro-
sophila melanogaster. Curr Biol 2002, 12:1686-1691.
48. Abad JP, De Pablos B, Osoegawa K, De Jong PJ, Martin-Gallardo A,
Villasante A: Genomic analysis of Drosophila melanogaster tel-
omeres: full-length copies of HeT-A and TART elements at
telomeres. Mol Biol Evol 2004, 21:1613-1619.
49. Karpen GH, Spradling AC: Analysis of subtelomeric hetero-
chromatin in the Drosophila minichromosome Dp1187 by
single P-element insertional mutagenesis. Genetics 1992,
132:737-753.
50. Walter MF, Jang C, Kasravi B, Donath J, Mechler BM, Mason JM, Biess-
mann H: DNA organization and polymorphism of a wild-type
Drosophila telomere region. Chromosoma 1995, 104:229-241.
51. Biessmann H, Champion LE, O'Hair M, Ikenaga K, Kasravi B, Mason
JM: Frequent transpositions of Drosophila melanogaster HeT-
A transposable elements to receding chromosome ends.
EMBO J 1992, 11:4459-4469.
52. Levis RW, Ganesan R, Houtchens K, Tolar LA, Sheen FM: Trans-
posons in place of telomeric repeats at a Drosophila tel-
omere. Cell 1993, 75:1083-1093.
53. Abad JP, De Pablos B, Osoegawa K, De Jong PJ, Martin-Gallardo A,
Villasante A: TAHRE, a novel telomeric retrotransposon from
Drosophila melanogaster, reveals the origin of Drosophila tel-
omeres. Mol Biol Evol 2004, 21:1620-1624.
54. Betran E, Thornton K, Long M: Retroposed new genes out of the
X in Drosophila. Genome Res 2002, 12:1854-1859.
55. Nurminsky DI, Nurminskaya MV, De Aguiar D, Hartl DL: Selective
sweep of a newly evolved sperm-specific gene in Drosophila.
Nature 1998, 396:572-575.
56. Ponce R, Hartl DL: The evolution of the novel Sdic gene cluster
in Drosophila melanogaster. Gene 2006, 376:174-183.
57. SanMiguel P, Gaut BS, Tikhonov A, Nakajima Y, Bennetzen JL: The
paleontology of intergene retrotransposons of maize. Nat
Genet 1998, 20:43-45.
58. Stumpf MP, Wiuf C, May RM: Subnets of scale-free networks are
not scale-free: sampling properties of networks. Proc Natl Acad
Sci USA 2005,
102:4221-4224.
59. Harden N, Ashburner M: Characterization of the FB-NOF trans-
posable element of Drosophila melanogaster. Genetics 1990,
126:387-400.
60. Badal M, Portela A, Xamena N, Cabre O: Molecular and bioinfor-
matic analysis of the FB-NOF transposable element. Gene
2006, 371:130-135.
61. Heitz E: Uber a and b-heterochromatin sowie Konstanz und
Bau der Chromomeren bei Drosophila. Biologisches Zentralblatt
1934, 54:588-609.
62. Bridges CB: Salivary chromosome maps with a key to banding
of the chromsomes of Drosophila melanogaster. J Hered 1935,
26:60-64.
63. Kauffmann BP: Distribution of induced breaks along the X-
chromosome of Drosophila melanogaster. Proc Natl Acad Sci USA
1939, 25:571-577.
64. Koryakov DE, Alekseyenko AA, Zhimulev IF: Dynamic organiza-
tion of the beta-heterochromatin in the Drosophila mela-
nogaster polytene X chromosome. Mol Gen Genet 1999,
260:503-509.
65. Belyaeva ES, Zhimulev IF, Volkova EI, Alekseyenko AA, Moshkin YM,
Koryakov DE: Su(UR)ES: a gene suppressing DNA underrepli-
cation in intercalary and pericentric heterochromatin of
Drosophila melanogaster polytene chromosomes. Proc Natl
Genome Biology 2006, Volume 7, Issue 11, Article R112 Bergman et al. R112.21
comment reviews reports refereed researchdeposited research interactions information
Genome Biology 2006, 7:R112
Acad Sci USA 1998, 95:7532-7537.
66. Adams MD, Celniker SE, Holt RA, Evans CA, Gocayne JD, Amanati-
des PG, Scherer SE, Li PW, Hoskins RA, Galle RF, et al.: The
genome sequence of Drosophila melanogaster. Science 2000,
287:2185-2195.
67. Myster SH, Wang F, Cavallo R, Christian W, Bhotika S, Anderson CT,
Peifer M: Genetic and bioinformatic analysis of 41C and the
2R heterochromatin of Drosophila melanogaster: a window
on the heterochromatin-euchromatin junction. Genetics 2004,
166:807-822.
68. Sun X, Le HD, Wahlstrom JM, Karpen GH: Sequence analysis of a
functional Drosophila centromere. Genome Res 2003,
13:182-194.
69. Lifschytz E: Fine-structure analysis and genetic organization at
the base of the X chromosome in Drosophila melanogaster.
Genetics 1978, 88:457-467.
70. Yamamoto MT, Mitchelson A, Tudor M, O'Hare K, Davies JA, Miklos
GL: Molecular and cytogenetic analysis of the
heterochromatin-euchromatin junction region of the Dro-
sophila melanogaster X chromosome using cloned DNA
sequences. Genetics 1990, 125:821-832.
71. Ashburner M, Misra S, Roote J, Lewis SE, Blazej R, Davis T, Doyle C,
Galle R, George R, Harris N, et al.: An exploration of the
sequence of a 2.9-Mb region of the genome of Drosophila
melanogaster: the Adh region. Genetics 1999, 153:179-219.
72. Ashburner M: Some aspects of the structure and function of
the polytene chromosomes of the Diptera. In Insect Cytogenetics
Edited by: Blackman RL, Hewitt G, Ashburner M. Oxford: Blackwell
Scientific Publications; 1980:65-84.
73. Glaser RL, Karpen GH, Spradling AC:
Replication forks are not
found in a Drosophila minichromosome demonstrating a gra-
dient of polytenization. Chromosoma 1992, 102:15-19.
74. Moshkin YM, Belyakin SN, Rubtsov NB, Kokoza EB, Alekseyenko AA,
Volkova EI, Belyaeva ES, Makunin IV, Spierer P, Zhimulev IF: Micro-
dissection and sequence analysis of pericentric hetero-
chromatin from the Drosophila melanogaster mutant
Suppressor of Underreplication. Chromosoma 2002,
111:114-125.
75. Nurminsky DI, Shevelyov Y, Nuzhdin SV, Gvozdev VA: Structure,
molecular evolution and maintenance of copy number of
extended repeated structures in the X-heterochromatin of
Drosophila melanogaster. Chromosoma 1994, 103:277-285.
76. Wicker T, Stein N, Albar L, Feuillet C, Schlagenhauf E, Keller B: Anal-
ysis of a contiguous 211 kb sequence in diploid wheat (Triti-
cum monococcum L.) reveals multiple mechanisms of
genome evolution. Plant J 2001, 26:307-316.
77. Wicker T, Zimmermann W, Perovic D, Paterson AH, Ganal M,
Graner A, Stein N: A detailed look at 7 million years of genome
evolution in a 439 kb contiguous sequence at the barley Hv-
eIF4E locus: recombination, rearrangements and repeats.
Plant J 2005, 41:184-194.
78. Lippman Z, Gendrel AV, Black M, Vaughn MW, Dedhia N, McCombie
WR, Lavine K, Mittal V, May B, Kasschau KD, et al.: Role of trans-
posable elements in heterochromatin and epigenetic
control. Nature 2004, 430:471-476.
79. Rubin GM, Spradling AC: Genetic transformation of Drosophila
with transposable element vectors. Science 1982, 218:348-353.
80. Losada A, Abad JP, Agudo M, Villasante A: The analysis of Circe, an
LTR retrotransposon of Drosophila melanogaster, suggests
that an insertion of non-LTR retrotransposons into LTR ele-
ments can create chimeric retroelements. Mol Biol Evol 1999,
16:1341-1346.
81. Aravin AA, Naumova NM, Tulin AV, Vagin VV, Rozovsky YM,
Gvozdev VA: Double-stranded RNA-mediated silencing of
genomic tandem repeats and transposable elements in the
D. melanogaster germline. Curr Biol 2001, 11:1017-1027.
82. Kalmykova AI, Klenov MS, Gvozdev VA: Argonaute protein PIWI
controls mobilization of retrotransposons in the Drosophila
male germline. Nucleic Acids Res 2005, 33:2052-2059.
83. Sarot E, Payen-Groschene G, Bucheton A, Pelisson A: Evidence for
a piwi-dependent RNA silencing of the gypsy endogenous ret-
rovirus by the Drosophila melanogaster flamenco gene. Genet-
ics 2004, 166:1313-1321.
84. Vagin VV, Sigova A, Li C, Seitz H, Gvozdev V, Zamore PD: A distinct
small RNA pathway silences selfish genetic elements in the
germline. Science 2006, 313:320-4.
85. Reiss D, Josse T, Anxolabehere D, Ronsseray S: aubergine muta-
tions in Drosophila melanogaster impair P cytotype determi-
nation by telomeric P elements inserted in
heterochromatin. Mol Genet Genomics 2004, 272:336-343.
86. Aravin AA, Lagos-Quintana M, Yalcin A, Zavolan M, Marks D, Snyder
B, Gaasterland T, Meyer J, Tuschl T: The small RNA profile dur-
ing Drosophila melanogaster development. Dev Cell 2003,
5:337-350.
87. Jensen S, Gassama MP, Heidmann T: Taming of transposable ele-
ments by homology-dependent gene silencing. Nat Genet
1999, 21:209-212.
88. Jensen S, Gassama MP, Heidmann T: Cosuppression of I transpo-
son activity in Drosophila by I-containing sense and antisense
transgenes. Genetics 1999, 153:1767-1774.
89. Desset S, Conte C, Dimitri P, Calco V, Dastugue B, Vaury C: Mobi-
lization of two retroelements, ZAM and Idefix, in a novel
unstable line of Drosophila melanogaster. Mol Biol Evol 1999,
16:54-66.
90. Lakhotia SC, Jacob J: EM autoradiographic studies on polytene
nuclei of Drosophila melanogaster. II. Organization and tran-
scriptive activity of the chromocentre. Exp Cell Res 1974,
86:253-263.
91. Petrov DA, Aminetzach YT, Davis JC, Bensasson D, Hirsh AE: Size
matters: non-LTR retrotransposable elements and ectopic
recombination in Drosophila. Mol Biol Evol 2003, 20:880-892.
92. Comprehensive R Archive Network [ />93. FlyBase Gbrowser Cytolocation Tool [ />cgi-bin/gbrowse_fb/dmel]
94. Vista Genome Browser [ />gateway2?bg=dm2&selector=vista]
95. Kent WJ: BLAT - the BLAST-like alignment tool. Genome Res
2002, 12:656-664.
96. Rice P, Longden I, Bleasby A: EMBOSS: the European Molecular
Biology Open Software Suite. Trends Genet 2000, 16:276-277.
97. CPAN Graph PERL module [ />98. Mathematica 5.1 Combinatorica Package [http://docu
ments.wolfram.com/v5/Add-onsLinks/StandardPackages/DiscreteMi
torica.html]
99. Shannon P, Markiel A, Ozier O, Baliga NS, Wang JT, Ramage D, Amin
N, Schwikowski B, Ideker T: Cytoscape: a software environment
for integrated models of biomolecular interaction networks.
Genome Res 2003, 13:2498-2504.
100. Liu H, Wang J: A new way to enumerate cycles in graph. In
Advanced International Conference on Telecommunications and Interna-
tional Conference on Internet and Web Applications and Services Los
Alimitos, CA, USA (AICT/ICIW); 2006:57.