Báo cáo y học: "Classification methods for the development of genomic signatures from high-dimensional data" potx
Bạn đang xem bản rút gọn của tài liệu. Xem và tải ngay bản đầy đủ của tài liệu tại đây (223.94 KB, 7 trang )
Genome Biology 2006, 7:R121
comment reviews reports deposited research refereed research interactions information
Open Access
2006Moonet al.Volume 7, Issue 12, Article R121
Method
Classification methods for the development of genomic signatures
from high-dimensional data
Hojin Moon
*
, Hongshik Ahn
†
, Ralph L Kodell
*
, Chien-Ju Lin
*
,
Songjoon Baek
*
and James J Chen
*
Addresses:
*
Division of Biometry and Risk Assessment, National Center for Toxicological Research, FDA, NCTR Road, Jefferson, AR 72079,
USA.
†
Department of Applied Mathematics and Statistics, Stony Brook University, Stony Brook, NY 11794-3600, USA.
Correspondence: Hojin Moon. Email:
© 2006 Moon et al.; licensee BioMed Central Ltd.
This is an open access article distributed under the terms of the Creative Commons Attribution License ( which
permits unrestricted use, distribution, and reproduction in any medium, provided the original work is properly cited.
Methods for genomic signatures<p>Several classification algorithms for class prediction using high-dimensional biomedical data are presented and applied to data from leukaemia and breast cancer patients</p>
Abstract
Personalized medicine is defined by the use of genomic signatures of patients to assign effective
therapies. We present Classification by Ensembles from Random Partitions (CERP) for class
prediction and apply CERP to genomic data on leukemia patients and to genomic data with several
clinical variables on breast cancer patients. CERP performs consistently well compared to the other
classification algorithms. The predictive accuracy can be improved by adding some relevant clinical/
histopathological measurements to the genomic data.
Background
Providing guidance on specific therapies for pathologically
distinct tumor types to maximize efficacy and minimize toxic-
ity is important for cancer treatment [1,2]. For acute leuke-
mia, for instance, different subtypes show very different
responses to therapy, reflecting the fact that they are molecu-
larly distinct entities, although they have very similar mor-
phological and histopathological appearance [1]. Thus,
accurate classification of tumor samples is essential for effi-
cient cancer treatment on a target population of patients.
Microarray technology has been increasingly used in cancer
research because of its potential for classification of tissue
samples based only on gene expression data, without prior
and often subjective biological knowledge [1,3,4]. Much
research involving microarray data analysis is focused on dis-
tinguishing between different cancer types using gene expres-
sion profiles from disease samples, thereby allowing more
accurate diagnosis and effective treatment of each patient.
Gene expression data might also be used to improve disease
prognosis in order to prevent some patients from having to
undergo painful unsuccessful therapies and unnecessary tox-
icity. For example, adjuvant chemotherapy for breast cancer
after surgery could reduce the risk of distant metastases;
however, seventy to eighty percent of patients receiving this
treatment would be expected to survive metastasis-free with-
out it [5,6]. The strongest predictors for metastases, such as
lymph node status and histological grade, fail to classify accu-
rately breast tumors according to their clinical behavior [6,7].
Predicting patient response to therapy or the toxic potential
of drugs based on high-dimensional data are common goals
of biomedical studies. Classification algorithms can be used
to process high-dimensional genomic data for better prog-
nostication of disease progression and better prediction of
response to therapy to help individualize clinical assignment
of treatment. The predictive models built are required to be
Published: 20 December 2006
Genome Biology 2006, 7:R121 (doi:10.1186/gb-2006-7-12-r121)
Received: 28 July 2006
Revised: 23 October 2006
Accepted: 20 December 2006
The electronic version of this article is the complete one and can be
found online at />R121.2 Genome Biology 2006, Volume 7, Issue 12, Article R121 Moon et al. />Genome Biology 2006, 7:R121
highly accurate, since the consequence of misclassification
may result in suboptimal treatment or incorrect risk profile.
Commonly, there are numerous genomic and clinical predic-
tor variables over a relatively small number of patients for
biomedical applications, which presents challenges for most
traditional classification algorithms to avoid over-fitting the
data.
Class prediction is a supervised learning method where the
algorithm learns from a training set (known samples) and
establishes a prediction rule to classify new samples. Devel-
opment of a class prediction algorithm generally consists of
three steps: first, selection of predictors; second, fitting the
prediction model to develop the classification rule; and third,
performance assessment. The first two steps build a predic-
tion model, and the third step assesses the performance of the
model. Some classification algorithms, such as the classifica-
tion tree or stepwise logistic regression, perform the first two
steps simultaneously. Sensitivity (SN) and specificity (SP) as
well as positive predictive value (PPV) and negative predictive
value (NPV) are primary criteria used in the evaluation of the
performance of a classification algorithm. The SN is the pro-
portion of correct positive classifications out of the number of
true positives. The SP is the proportion of correct negative
classifications out of the number of true negatives. The accu-
racy is the total number of correct classifications out of the
total number of samples. The PPV is the probability that a
patient is positive given a positive prediction, while the NPV
is the probability that a patient is negative given a negative
prediction. Algorithms with high SN and high SP as well as
high PPV and high NPV, which will have high accuracy, are
obviously desirable.
Recently, a new ensemble-based classification algorithm,
Classification by Ensembles from Random Partitions (CERP)
has been developed [8]. This algorithm is designed specifi-
cally for high-dimensional data sets. Rationales behind CERP
are as follows: first, multiple classifiers can capture most
aspects of the underlying biological phenomena encoded in
the data; and second, combining results of multiple diversi-
fied models can produce a superior classifier for biomedical
decision making. In this paper, we use Classification-Tree
CERP (C-T CERP), which is an ensemble of ensembles of
optimal classification trees based on the Classification and
Regression Trees (CART) algorithm [9], constructed with
randomly partitioned mutually exclusive subsets from the
entire predictor set. The number of features in each subset is
as close to equal as possible.
The performance of CERP is compared to other well-known
classification algorithms: Random Forest (RF) [10], Boosting
[11,12], Support Vector Machine (SVM) [13], Diagonal Linear
Discriminant Analysis (DLDA) [3], Shrunken Centroids (SC)
[14], CART, Classification Rule with Unbiased Interaction
Selection and Estimation (CRUISE) [15], and Quick, Unbi-
ased and Efficient Statistical Tree (QUEST) [16]. CERP uti-
lizes a partitioning scheme to establish mutually exclusive
subsets of the predictors. On the other hand, RF takes boot-
strap samples of patients for each tree and randomly selects
predictors with replacement from the entire set of predictors
at each node. Boosting gives extra weight to previously mis-
classified samples. Like CERP, RF and Boosting are ensemble
classifiers. SVM is a kernel-based machine learning
approach. DLDA is a classification rule based on a linear dis-
criminant function. SC is based on an enhancement of the
simple nearest centroid classifier. CART, CRUISE and
QUEST are single optimal trees. Among these single-tree
algorithms, CART and QUEST yield binary trees and CRUISE
yields multiway splits.
In this study, the classification algorithms are applied to three
popular public data sets relevant to personalized medicine.
The algorithms are first used for the prediction of leukemia
subtypes, acute lymphoblastic leukemia (ALL) or acute mye-
loid leukemia (AML), based on gene-expression data [1].
They are then used on two different data sets [6,17] to predict
which breast cancer patients would benefit from adjuvant
chemotherapy based on gene-expression data. We also inves-
tigate if addition of seven more clinical/histopathological var-
iables, including age, tumor size, tumor grade, angioinvasion,
estrogen receptor status, progesterone receptor status and
lymphocytic infiltrate, to the high-dimensional genomic data
on breast cancer patients [6] enhances classification accu-
racy. The performance of the classification algorithm is
assessed by 20 replications of 10-fold cross-validation (CV).
Results
Leukemia classification
Determination of cancer type and stage is often crucial to the
assignment of appropriate treatment [1]. Because chemother-
apy regimens for patients with ALL are different from regi-
mens for patients with AML, distinguishing between
leukemia subtypes (ALL or AML) is critical for personalized
treatment. Golub et al. [1] described a generic approach to
cancer classification of the two subtypes of acute leukemia
based on gene expression monitoring by DNA microarray
technology. The data set consists of 47 patients with ALL and
25 patients with AML. The gene expression levels were meas-
ured by Affymetrix high-density oligonucleotide arrays con-
taining 6,817 human genes. Before performing
normalization, the data were preprocessed by the following
steps: thresholding, with a floor of 100 and ceiling of 16,000;
filtering, with exclusion of genes with max/min ≤5 or (max -
min) ≤500, where max and min refer to the maximum and
minimum expression levels of a particular gene across 72
mRNA samples, respectively; and base-10 logarithmic trans-
formation. The data were then summarized by 72 mRNA
samples and 3,571 genes [3].
Table 1 shows performance of classification algorithms for the
leukemia data, based on 20 repetitions of 10-fold CV. All algo-
Genome Biology 2006, Volume 7, Issue 12, Article R121 Moon et al. R121.3
comment reviews reports refereed researchdeposited research interactions information
Genome Biology 2006, 7:R121
rithms considered in this study, except single optimal trees
(CART, CRUISE and QUEST), gave less than four percent
error rate (mostly two to three misclassifications). Among
them, CERP showed the lowest error rate of 1.4% (mostly 0 or
1 misclassification). The balance between sensitivity and spe-
cificity of CERP, RF, AdaBoost, DLDA and SC algorithms was
excellent; all sensitivities and specificities were above 95%.
The PPV and NPV of CERP, RF, SVM and DLDA were all
higher than 95%. CERP performs slightly better than the
other classification algorithms used on the leukemia data set.
CERP misclassified only one out of 72 samples on the average
in the 20 replications of 10-fold CV. Among single optimal
trees, CRUISE and QUEST gave lower error rates (less than
14%) and higher PPV (>82%). The balance between SN and
SP was good among single optimal trees considered.
Breast cancer classification
The objective of two studies [6,17] was to use gene expression
data to identify patients who might benefit from adjuvant
chemotherapy according to prognostication of distant metas-
tases for breast cancer. The van 't Veer et al. data [6] contains
78 primary breast cancers (34 from patients who developed
distant metastases within 5 years (poor prognosis) and 44
from patients who continue to be disease-free (good progno-
sis) after a period of at least 5 years). These samples have been
selected from patients who were lymph node negative and
under 55 years of age at diagnosis. Out of approximately
25,000 gene expression levels, about 5,000 significantly reg-
ulated genes (at least a two-fold difference and a p value of
less than 0.01) in more than 3 tumors out of 78 were selected
[6]. In addition, seven relevant clinical/histopathological pre-
dictors were added to this gene expression data to investigate
if the addition of these variables improves the prediction
accuracy compared to genomic data only.
In the study of van de Vijver et al. [17], there was a cohort of
young women with stage I or II breast cancer who were
treated at the hospital of the Netherlands Cancer Institute.
They were younger than 53 years old, 151 of whom were
lymph-node-negative and 144 of whom were lymph-node-
positive. Among 295 patients, 180 had a poor-prognosis sig-
nature and 115 had a good-prognosis signature. From approx-
imately 25,000 human genes, we selected about 5,000 genes
according to correlation of the microarray data with the prog-
nosis profile [17]. There were no missing data.
Tables 2 and 3 show performance of classification algorithms
for the van 't Veer et al. [6] breast cancer genomic data and
genomic plus clinical/histopathological data, respectively,
based on 20 repetitions of 10-fold CV. When seven more clin-
ical variables are added to the gene expression data, the pre-
diction accuracy appears to be slightly improved compared to
accuracies from genomic data only. This is mainly due to an
improvement in sensitivity. Still, the overall accuracy is some-
what low for all the classifiers. The balance between SN and
SP is reasonably good for CERP, DLDA and SC. Sensitivities
of CERP, DLDA and SC are higher (>50%) than the rest
(<50%). The positive predictive values from CERP, RF, Ada-
Boost, DLDA and SC are higher (>55%) than the others.
Among single optimal trees, accuracies of CRUISE and
QUEST are slightly higher than CART (>55%). However, the
balance between SN and SP in these single trees is
unsatisfactory.
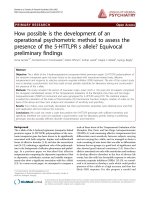
Figure 1 shows the accuracies of classification algorithms for
the van de Vijver et al. data [17] based on 20 repetitions of 10-
fold CV. The overall accuracy is improved and greater than
80% for all the classification algorithms compared to accura-
cies from the van 't Veer et al. [6] data. Among the algorithms,
the accuracies of CERP, RF and SVM are greater than 85%.
The balance between SN and SP (not shown) is slightly better
for CERP (SN 87.5%, and SP 82.5%) than RF (SN 89.1% and
SP 80.7%) and SVM (SN 89.1% and SP 78.7%). The balance
between positive and negative predictive values (not shown)
from CERP, RF and SVM are better than those from the oth-
ers (PPV and NPV >80%).
Table 1
Performance of classification algorithms for the leukemia data based on 20 repetitions of 10-fold CV
Algorithm Accuracy Sensitivity* Specificity
†
PPV
‡
NPV
§
CERP 98.6 (<.001) 96.0 (<.001) 100.0 (.000) 100.0 (.000) 97.9 (<.001)
RF 97.9 (.008) 95.0 (.022) 99.5 (.009) 99.0 (.018) 97.4 (.011)
AdaBoost 96.0 (.005) 95.6 (.012) 96.3 (.009) 93.2 (.016) 97.6 (.006)
SVM 97.2 (.012) 92.0 (.034) 100.0 (.000) 100.0 (.000) 95.9 (.017)
DLDA 97.5 (.007) 96.0 (<.001) 98.3 (.011) 96.8 (.021) 97.9 (<.001)
SC 96.0 (.004) 96.0 (<.001) 96.0 (.007) 92.7 (.011) 97.8 (<.001)
CART 81.7 (.035) 76.2 (.046) 84.6 (.053) 72.4 (.067) 87.0 (.021)
CRUISE 86.8 (.021) 79.8 (.040) 90.5 (.029) 82.0 (.044) 89.4 (.018)
QUEST 86.9 (.020) 79.4 (.042) 91.0 (.032) 82.7 (.048) 89.3 (.018)
SD is given in parentheses. *AML considered positive.
†
ALL considered negative.
‡
Positive predictive value.
§
Negative predictive value.
R121.4 Genome Biology 2006, Volume 7, Issue 12, Article R121 Moon et al. />Genome Biology 2006, 7:R121
Discussion
Recent advancements in biotechnology have accelerated
research on the development of molecular biomarkers for the
diagnosis and treatment of disease. The Food and Drug
Administration envisions clinical pharmacogenomic profiling
to identify patients most likely to benefit from particular
drugs and patients most likely to experience adverse reac-
tions. Such patient profiling will enable assignment of drug
therapies on a scientifically sound predictive basis rather than
on an empirical trial-and-error basis. The goal is to change
medical practice from a population-based approach to an
individualized approach.
We have presented statistical classification algorithms to
accurately classify patients into risk/benefit categories using
high-dimensional genomic and other data. Classification
algorithms were illustrated by three published data sets and
the new C-T CERP was compared to the best known pub-
lished classification procedures. CERP is a consistently good
algorithm and maintains a good balance between sensitivity
and specificity even when sample sizes between classes are
unbalanced.
In one application, leukemia patients were classified as hav-
ing either ALL or AML based on each individual patient's
gene-expression profile. The distinction is important because
the chemotherapies required for the two subtypes are very
different, and incorrect treatment assignment has both effi-
cacy and toxicity consequences. Classification algorithms are
essential for the realization of personalized medicine in this
application, because distinguishing ALL and AML otherwise
requires an experienced hematologist's interpretation of sev-
eral analyses performed in a highly specialized laboratory.
CERP correctly classified patients with the lowest cross-vali-
dated error rate of 1.4% (0 or 1 misclassification) compared to
the other classification procedures we considered (more than
Table 2
Performance of classification algorithms for the van 't Veer et al. breast cancer genomic data based on 20 repetitions of 10-fold CV
Algorithm Accuracy Sensitivity* Specificity
†
PPV
‡
NPV
§
CERP 62.3 (.023) 50.9 (.037) 71.1 (.026) 57.7 (.029) 65.2 (.020)
RF 62.5 (.019) 46.8 (.032) 74.7 (.032) 58.9 (.029) 64.5 (.014)
AdaBoost 58.8 (.041) 32.1 (.089) 79.4 (.069) 55.0 (.094) 60.3 (.028)
SVM 56.5 (.029) 39.6 (.053) 69.7 (.027) 50.1 (.042) 59.9 (.025)
DLDA 62.5 (.019) 52.4 (.023) 70.3 (.026) 57.8 (.026) 65.6 (.015)
SC 60.9 (.019) 50.6 (.026) 68.9 (.023) 55.7 (.024) 64.3 (.016)
CART 54.6 (.028) 17.5 (.058) 83.2 (.047) 44.6 (.084) 56.6 (.018)
CRUISE 55.1 (.048) 21.5 (.100) 81.0 (.059) 45.6 (.112) 57.3 (.034)
QUEST 56.5 (.044) 22.8 (.080) 82.6 (.077) 51.0 (.117) 58.1 (.027)
SD is given in parentheses. *Poor prognosis considered positive.
†
Good prognosis considered negative.
‡
Positive predictive value.
§
Negative
predictive value.
Table 3
Performance of classification algorithms for the van 't Veer et al. breast cancer genomic and clinical/histopathological data based on 20
trials of 10-fold CV
Algorithm Accuracy Sensitivity* Specificity
†
PPV
‡
NPV
§
CERP 63.3 (.024) 52.5 (.042) 71.6 (.027) 58.8 (.031) 66.1 (.022)
RF 63.0 (.023) 48.2 (.034) 74.4 (.034) 59.4 (.034) 65.1 (.016)
AdaBoost 61.9 (.045) 38.7 (.090) 79.8 (.065) 59.9 (.085) 62.8 (.034)
SVM 57.4 (.027) 40.3 (.044) 70.7 (.037) 51.5 (.040) 60.5 (.021)
DLDA 62.9 (.017) 52.6 (.025) 70.9 (.027) 58.4 (.023) 66.0 (.013)
SC 62.2 (.018) 53.8 (.025) 68.8 (.018) 57.1 (.022) 65.8 (.016)
CART 54.7 (.031) 21.6 (.096) 80.3 (.063) 44.3 (.103) 57.2 (.022)
CRUISE 57.5 (.047) 24.0 (.100) 83.4 (.063) 51.9 (.120) 58.8 (.032)
QUEST 56.3 (.036) 21.8 (.062) 83.1 (.071) 50.7 (.082) 57.8 (.021)
SD is given in parentheses. *Poor prognosis considered positive.
†
Good prognosis considered negative.
‡
Positive predictive value.
§
Negative
predictive value.
Genome Biology 2006, Volume 7, Issue 12, Article R121 Moon et al. R121.5
comment reviews reports refereed researchdeposited research interactions information
Genome Biology 2006, 7:R121
1 misclassification). This level of accuracy shows the real
potential for confident clinical assignment of therapies on an
individual patient basis.
In the other application, post-surgery breast cancer patients
were classified by the algorithms as having either a good or
poor prognosis, in terms of the likelihood of distant metasta-
sis within five years, based on gene-expression profiles. If this
were brought into clinical application, a patient with a confi-
dently predicted good prognosis might want to elect out of
adjuvant chemotherapy and its associated debilitating side
effects. With current rule-based decisions, almost all patients
are subjected to chemotherapy. When just a few clinical and
histopathological measures traditionally used for treatment
assignment were added to the numerous genomic predictors,
the prediction accuracy appeared to be enhanced further.
According to the theory underlying the CERP algorithm,
importantly, the more individual patient information that is
used, whatever the source or type, the greater is the likelihood
that the prediction accuracy will increase. While the van 't
Veer et al. data [6] do not contain enough information to
allow confident prognoses, the van de Vijver et al. data [17]
show improved cross-validated overall accuracy that might be
sufficiently high for clinical practice. It is worth noting that
CERP and all the other methods do not perform as well as the
method reported in the van 't Veer et al. [6] study (62.3% ver-
sus 83% accuracy). It may be that the feature selection
method used by van 't Veer et al. overfit the data and they did
have a true cross-validation test. They appear to have used
correlation with outcome for feature selection outside the
cross-validation procedure. It is anticipated that the com-
bined use of multiple biomarkers on individual patients could
improve the prediction accuracy of data like the present
genomic data to a level suitable for clinical practice.
Materials and methods
Ensemble methods to enhance prediction accuracy
Let X
i
be a random variable indicating a classification by the
i-th independent classifier, where X
i
= 1 if the classification is
correct and X
i
= 0 if not. We let p be the prediction accuracy
of each classifier. Then the X
i
are Bernoulli(p), and the
number of accurate classifications by the ensemble majority
voting method is:
which is Binomial(r, p). We let r = 2k + 1, where k is a nonneg-
ative integer. We define the prediction accuracy of the ensem-
ble by majority voting as:
A
r
= P(Y ≥ k + 1).
Then the prediction accuracy of the ensemble can be obtained
using the standard binomial probability:
It has been shown that the majority vote is guaranteed to give
a higher accuracy than an individual classifier when the indi-
vidual classifiers have an accuracy greater than 0.5 [8]. In
practice, the classifiers may be correlated to a certain degree.
When classifiers are positively correlated, they tend to pro-
duce the same prediction outcomes. Kuncheva et al. [18]
relaxed the restriction that the classifiers be independent.
When the classifiers in the ensemble are positively correlated,
we use the beta-binomial model [19-21] to obtain the predic-
Accuracy of classification algorithms for the van de Vijver et al. [17] dataFigure 1
Accuracy of classification algorithms for the van de Vijver et al. [17] data.
Table 4
Enhancement of the prediction accuracy by ensemble majority
voting*
r ρ Prediction accuracy of each base classifier
0.5 0.6 0.7 0.8 0.9
3 0 0.5 0.648 0.784 0.896 0.972
0.1 0.5 0.635 0.762 0.871 0.953
0.3 0.5 0.618 0.732 0.836 0.927
15 0 0.5 0.787 0.950 0.996 1.000
0.1 0.5 0.695 0.851 0.947 0.990
0.3 0.5 0.636 0.762 0.868 0.948
25 0 0.5 0.846 0.986 1.000 1.000
0.1 0.5 0.708 0.868 0.958 0.993
0.3 0.5 0.639 0.766 0.872 0.951
101 0 0.5 0.980 1.000 1.000 1.000
0.1 0.5 0.728 0.891 0.971 0.996
0.3 0.5 0.642 0.771 0.877 0.954
*Binomial probability used for ρ = 0, with normal approximation for r >
25; Beta-binomial probability used for ρ > 0.
YX
i
i
r
=
=
∑
1
,
A
r
i
pp
r
ik
r
iri
=
⎛
⎝
⎜
⎞
⎠
⎟
−
=+
−
∑
1
1().
R121.6 Genome Biology 2006, Volume 7, Issue 12, Article R121 Moon et al. />Genome Biology 2006, 7:R121
tion accuracy. The beta-binomial model is commonly used to
model positively correlated binary variables.
Table 4 illustrates the theoretical prediction accuracy
obtained by ensemble majority voting. The table illustrates
that independent classifiers improve the prediction accuracy
more rapidly than the correlated classifiers. For example,
when the prediction accuracy of each base classifier is 80%,
the class prediction accuracy by the majority vote in an
ensemble reaches nearly 100% with r = 25 independent clas-
sifiers. On the other hand, the accuracy of the majority vote
reaches only 87.7% with r = 101 positively correlated classifi-
ers (the correlation ρ = 0.3). These results imply that the pre-
diction accuracy of the ensemble majority vote will increase
by adding more classifiers. However, if the classifiers are
highly positively correlated, the addition will not help much
to increase the prediction accuracy. CERP uses random parti-
tioning to create mutually exclusive subsets of the features to
introduce diversity. If the number of partitions is larger, the
prediction accuracy of the individual classifier would be
lower. To compensate for this loss, new ensembles are added.
When the classifiers are negatively correlated, the prediction
accuracy improves more rapidly than with independent clas-
sifiers. Ahn et al. [8] reported a theoretical result showing
enhancement of the prediction accuracy by ensemble major-
ity voting of negatively correlated classifiers.
Figure 2 shows a schematic diagram of an ensemble of CERP.
Predictor variables in a data set are randomly subdivided into
r mutually exclusive subsets. In this study, we partitioned the
feature space such that each subspace contains approxi-
mately n/6 predictors. Predictor variables in a data set are
randomly subdivided into r mutually exclusive subsets by
shuffling the features, where r = 6m/n. For example, in the
leukemia data set, there are m = 3,571 features, n = 72 sam-
ples, and r = 6 × 3,571/72 = 297 subsets. Each subset has 72/
6 = 12 or 13 features. Using the i-th subset of predictors, a tree
is constructed under the Gini diversity index measure [9].
This tree construction process for growing a large initial tree
continues splitting the samples until either each terminal
node is pure (that is, the node cases are all in one class) or the
total number of samples in a node is ≤5. To avoid over-fitting,
the optimal trees in C-T CERP are obtained by employing the
minimal cost-complexity pruning algorithm used in CART. In
the pruning process, a nested sequence of subtrees is
obtained by progressively deleting branches. This results in a
An ensemble in CERPFigure 2
An ensemble in CERP.
Genome Biology 2006, Volume 7, Issue 12, Article R121 Moon et al. R121.7
comment reviews reports refereed researchdeposited research interactions information
Genome Biology 2006, 7:R121
decreasing sequence of subtrees in terms of tree complexity.
One of these subtrees is selected as an optimal tree if a subtree
produces a minimal internal cross-validated misclassification
error within 1-SE [9].
In C-T CERP, we employ majority voting among trees within
individual ensembles and then among ensembles. In an
ensemble, using training data, only the trees that have highest
sensitivity and specificity (>90%) are kept, which reduces
each ensemble down to a small number of tree classifiers.
When the selected trees are less than three in an ensemble,
the cut-off value is decreased by five percent increments until
at least three trees are selected. New ensembles are created by
randomly re-partitioning the feature space and similarly
reducing to a different set of classifiers. Most of the improve-
ment in adding ensembles was achieved by the first few
ensembles, and then the improvement was slowed down as
more ensembles were added [8]. In this paper, we fixed the
default number of ensembles as 15 according to our prelimi-
nary results. Final ensemble prediction is then based on the
majority vote across these ensembles. C-T CERP is imple-
mented in C. A potential user can obtain the software by
contacting the authors or by downloading from the worldwide
web site [22].
A package (RandomForest) in R is used for the RF algorithm.
The number of trees is generated using the default of ntree =
500. The number of features selected at each node in a tree is
selected using the default value of floor(m
1/2
), where m is the
total number of features. Similarly, a package (e1071) in R is
applied for the SVM, in which radial basis kernel is used as a
default. Among many boosting methods, AdaBoost [11] is
adopted using a package (boost) in R with a default option.
For DLDA, a package (sma) in R is employed with a default
option. SC is implemented with a package (pamr) in R with a
soft thresholding option as a default. For single optimal trees,
CART is implemented with a package (rpart) in R with a
default option. On the other hand, compiled binaries are
downloaded from the website [23], and implemented in R for
CRUISE and QUEST.
In many cases, the number of features (m) is much greater
than the number of patients (n). In such a case, cross-valida-
tion is used to obtain a valid measure of prediction accuracy
for genomic signature classifiers. CV utilizes resampling with-
out replacement of the entire data set to repeatedly develop
classifiers on a training set and evaluates classifiers on a sep-
arate test set, and then averages the procedure over the
resamplings.
We evaluated the prediction accuracy, the balance between
sensitivity (SN) and specificity (SP), and the balance between
positive predictive value (PPV) and negative predictive value
(NPV) of the classification algorithms considered by averag-
ing the results from 20 replications of 10-fold CV in order to
achieve a stable result. Twenty CVs should be sufficient
according to Molinaro et al. [24] who recommended ten trials
of ten-fold CV to have low MSE and bias.
Acknowledgements
Hongshik Ahn's research was partially supported by the Faculty Research
Participation Program at the NCTR administered by the Oak Ridge Insti-
tute for Science and Education through an interagency agreement between
USDOE and USFDA.
References
1. Golub TR, Slonim DK, Tamayo P, Huard C, Gaasenbeek M, Mesirov
JP, Coller H, Loh ML, Downing JR, Caligiuri MA, et al.: Molecular
classification of cancer: discovery and class prediction by
gene expression monitoring. Science 1999, 286:531-537.
2. Zhang H, Yu C-Y, Singer B, Xiong M: Recursive partitioning for
tumor classification with gene expression microarray data.
Proc Natl Acad Sci USA 2001, 98:6730-6735.
3. Dudoit S, Fridlyand J, Speed TP: Comparison of discrimination
methods for the classification of tumors using gene expres-
sion data. J Am Stat Assoc 2002, 97:77-87.
4. Alexandridis R, Lin S, Irwin M: Class discovery and classification
of tumor samples using mixture modeling of gene expres-
sion data - a unified approach. Bioinformatics 2004, 20:2545-2552.
5. Early Breast Cancer Trialists' Collaborative Group: Polychemo-
therapy for early breast cancer: an overview of the ran-
domised trials. Lancet 1998, 352:930-942.
6. van 't Veer LJ, Dai H, van de Vijver MJ, He YD, Hart AA, Mao M,
Peterse HL, van der Kooy K, Marton MJ, Witteveen AT, et al.: Gene
expression profiling predicts clinical outcome of breast
cancer. Nature 2002, 415:530-536.
7. McGuire WL: Breast cancer prognostic factors: evaluation
guidelines. J Natl Cancer Inst 1991, 83:154-155.
8. Ahn H, Moon H, Fazzari MJ, Lim N, Chen JJ, Kodell RL: Classifica-
tion by ensembles from random partitions. In Technical Report
SUNYSB-AMS-06-03, Stony Brook University, Department of
Applied Mathematics and Statistics; 2006.
9. Breiman L, Friedman JH, Olshen RA, Stone CJ: Classification and
Regression Trees California: Wadsworth; 1984.
10. Breiman L: Random forest. Mach Learn 2001, 45:5-32.
11. Freund Y, Schapire R: A decision-theoretic generalization of
online learning and an application to boosting. J Comput Syst
Sci 1997, 55:119-139.
12. Schapire R: The strength of weak learnability.
Mach Learn 1990,
5:197-227.
13. Vapnik V: The Nature of Statistical Learning Theory New York: Springer;
1995.
14. Tibshirani R, Hastie T, Narasimhan B, Chu G: Diagnosis of multiple
cancer types by shrunken centroids of gene expression. Proc
Natl Acad Sci USA 2002, 99:6567-6572.
15. Kim H, Loh W-Y: Classification trees with unbiased multiway
splits. J Am Stat Assoc 2001, 96:589-604.
16. Loh W-Y, Shih Y-S: Split selection methods for classification
trees. Stat Sinica 1997, 7:815-840.
17. van de Vijver MJ, He YD, van 't Veer LJ, Dai H, Hart AA, Voskuil DW,
Schreiber GJ, Peterse JL, Roberts C, Marton MJ, et al.: A gene-
expression signature as a predictor of survival in breast
cancer. New Engl J Med 2002, 347:1999-2009.
18. Kuncheva LI, Whitaker CJ, Shipp CA, Duin RPW: Limits on the
majority vote accuracy in classifier fusion. Pattern Anal Appl
2003, 6:22-31.
19. Williams DA: The analysis of binary responses from toxicolog-
ical experiments involving reproduction and teratogenicity.
Biometrics 1975, 31:949-952.
20. Ahn H, Chen JJ: Generation of over-dispersed and under-dis-
persed binomial variates. J Comput Graph Stat 1995, 4:55-64.
21. Ahn H, Chen JJ: Tree-structured logistic regression model for
over-dispersed binomial data with application to modeling
developmental effects. Biometrics 1997, 53:435-455.
22. CERP [ />23. QUEST [ />24. Molinaro AM, Simon R, Pfeiffer RM: Prediction error estimation:
a comparison of resampling methods. Bioinformatics 2005,
21:3301-3307.