Báo cáo y học: "ranscription Network Project, Institute for Data Analysis and Visualization, University of California, Davis" potx
Bạn đang xem bản rút gọn của tài liệu. Xem và tải ngay bản đầy đủ của tài liệu tại đây (3.32 MB, 21 trang )
Open Access
Volume
et al.
Luengo 7, Issue 12,
2006 Hendriks Article R123
Research
Addresses: *Berkeley Drosophila Transcription Network Project, Life Sciences Division, Lawrence Berkeley National Laboratory, One Cyclotron
Road, Berkeley, CA 94720, USA. †Berkeley Drosophila Transcription Network Project, Genomics Division, Lawrence Berkeley National
Laboratory, One Cyclotron Road, Berkeley, CA 94720, USA. ‡Berkeley Drosophila Transcription Network Project, Department of Electrical
Engineering and Computer Science, University of California, Berkeley, CA 94720, USA. §Berkeley Drosophila Transcription Network Project,
Institute for Data Analysis and Visualization, University of California, Davis, CA 95616, USA.
reports
Ô These authors contributed equally to this work.
Correspondence: David W Knowles. Email:
Published: 21 December 2006
Genome Biology 2006, 7:R123 (doi:10.1186/gb-2006-7-12-r123)
reviews
Cris L Luengo HendriksÔ*, Soile VE KerọnenÔ, Charless C Fowlkes,
Lisa Simirenko, Gunther H Weber§, Angela H DePace†, Clara Henriquez†,
David W Kaszuba*, Bernd Hamann§, Michael B Eisen†, Jitendra Malik‡,
Damir Sudar*, Mark D Biggin† and David W Knowles*
comment
Three-dimensional morphology and gene expression in the
Drosophila blastoderm at cellular resolution I: data acquisition
pipeline
The electronic version of this article is the complete one and can be
found online at />© 2006 Luengo Hendriks et al.; licensee BioMed Central Ltd.
This is an open access article distributed under the terms of the Creative Commons Attribution License ( which
permits unrestricted use, distribution, and reproduction in any medium, provided the original work is properly cited.
resolution of methods that provide the first quantitative three-dimensional description of gene expression and morphology with cellular
A suitein whole <it>Drosophila </it>embryos is described.
Quantitative 3D blastoderm: gene expression and morphology
Background: To model and thoroughly understand animal transcription networks, it is essential
to derive accurate spatial and temporal descriptions of developing gene expression patterns with
cellular resolution.
Genome Biology 2006, 7:R123
information
Conclusion: The application of these quantitative methods to other developmental systems will
likely reveal many other previously unknown features and provide a more rigorous understanding
of developmental regulatory networks.
interactions
Results: Here we describe a suite of methods that provide the first quantitative three-dimensional
description of gene expression and morphology at cellular resolution in whole embryos. A database
containing information derived from 1,282 embryos is released that describes the mRNA
expression of 22 genes at multiple time points in the Drosophila blastoderm. We demonstrate that
our methods are sufficiently accurate to detect previously undescribed features of morphology and
gene expression. The cellular blastoderm is shown to have an intricate morphology of nuclear
density patterns and apical/basal displacements that correlate with later well-known morphological
features. Pair rule gene expression stripes, generally considered to specify patterning only along the
anterior/posterior body axis, are shown to have complex changes in stripe location, stripe
curvature, and expression level along the dorsal/ventral axis. Pair rule genes are also found to not
always maintain the same register to each other.
refereed research
Abstract
deposited research
Received: 1 August 2006
Revised: 17 November 2006
Accepted: 21 December 2006
R123.2 Genome Biology 2006,
Volume 7, Issue 12, Article R123
Luengo Hendriks et al.
Background
Animal embryos can be thought of as dynamic three-dimensional arrays of cells expressing gene products in intricate
spatial and temporal patterns that determine cellular differentiation and morphogenesis. Although developmental biologists most commonly analyze gene expression and
morphology by visual inspection of photographic images, it
has been increasingly recognized that a rigorous understanding of developmental processes requires automated methods
that quantitatively record and analyze these phenomenally
complex spatio-temporal patterns at cellular resolution. Different imaging and image analysis methods have been used to
provide one-, two-, or three-dimensional descriptions of parts
or all of a developing animal at various levels of detail (for
example, [1-9]). Yet, none of these experiments have
described the morphology and gene expression of a complete
embryo at cellular resolution.
The Berkeley Drosophila Transcription Network Project
(BDTNP) [10] has initiated an interdisciplinary analysis of
the transcription network in the early Drosophila embryo
[11,12]. The project's goals are to develop techniques for deciphering the transcriptional regulatory information encoded
in the genome and quantitatively model how regulatory interactions within the network generate spatial and temporal patterns of gene expression. Multiple system-wide datasets are
being generated, including information on the in vivo and in
vitro DNA binding specificities of the trans-acting factors that
control the network. In this paper, we introduce a complementary dataset that describes the expression patterns of key
transcription factors and a subset of their target genes in
three dimensions for the whole embryo at cellular resolution,
together with the methods we have developed to generate and
analyze these data. By comparing the patterns of expression
of the trans-regulators to those of their presumptive targets,
we hope to provide evidence for the regulatory relationships
within the network and allow modeling of how gene expression patterns develop.
The Drosophila blastoderm was chosen as the model to study
as it is one of the best characterized animal regulatory networks [13-16]. Two and a half hours after fertilization, the
embryo is a syncytium of around 6,000 nuclei, which then
become cellularized by an enveloping membrane during
developmental stage 5 [17]. By the end of cellularization, the
basic body plan is determined and the complex cell movements of gastrulation begin. A handful of maternal gene products are spatially patterned in the unfertilized egg in broad
gradients along the dorsal/ventral (d/v) and the anterior/
posterior (a/p) axes. Zygotic transcription begins at around
two hours after fertilization, with the maternal products initiating a hierarchical cascade of transcription factors that drive
expression of increasing numbers of genes in more and more
intricate patterns. The relatively small number of primary
transcriptional regulators that initiate pattern formation
(around 40) and the morphological simplicity of the early
/>
embryo make the blastoderm a particularly tractable system
for modeling animal transcription networks, while capturing
the complexities present in all animals.
In this paper, we describe an integrated pipeline of methods
for studying gene expression in the Drosophila melanogaster
blastoderm and release our first set of spatial gene expression
patterns digitized from 1,282 embryos. We show that our
methods can detect many previously uncharacterized features of morphology and gene expression at a high level of
accuracy. An accompanying paper describes further strategies necessary to study temporal changes in gene expression
in the presence of dynamic morphology.
Results and discussion
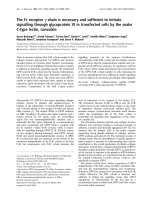
A three-dimensional analysis pipeline
To be able to analyze morphology and gene expression in
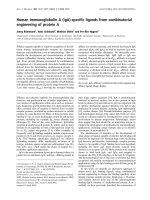
three dimensions we developed an integrated suite of methods as follows (Figure 1; see Materials and methods). First,
embryos were fixed and fluorescently stained to label the
mRNA expression patterns of two genes and nuclear DNA,
mounted on microscope slides, and visually examined to
determine their developmental age. Second, labeled and
staged embryos were imaged in whatever orientation they lay
on the microscope slide using a two photon laser-scanning
microscope to produce three-dimensional images. Third, raw
three-dimensional images were converted by image analysis
methods into text files, which we call 'PointClouds'. Each
PointCloud describes the center of mass coordinates of all
nuclei on the embryo surface and the mRNA or protein
expression levels of two genes in and around each nucleus.
These methods run unattended on large batches of images,
processing three to four images per hour, per processor.
Fourth, PointClouds were analyzed in three dimensions using
a number of automatic and semi-automatic feature extraction
methods to determine the orientation of the a/p and d/v axes,
record morphological features, measure the locations of gene
expression domains, and quantify relative levels of expression. Fifth, a BioImaging database (BID) was employed to
track and manage the raw images and PointCloud data files
and extensive metadata for each step of the pipeline. Sixth,
two visualization tools were used to validate the image analysis methods (Segmentation Volume Renderer) [18], and to
analyze the resulting PointClouds (PointCloudXplore)
[10,19].
A critical feature of our strategy is that the large 0.3 to 0.5 Gb
raw three-dimensional images for each embryo, such as that
shown in Figure 2a-c, are reduced via image analysis to 1 Mb
PointCloud files. The resulting PointClouds provide a compact representation of the image data and are readily amenable to computational analysis while maintaining the richness
of the blastoderm's morphology and gene expression patterns. Figure 2 provides a qualitative illustration of this, comparing renderings of a part of a three-dimesnional raw image
Genome Biology 2006, 7:R123
/>
Genome Biology 2006,
Volume 7, Issue 12, Article R123
Luengo Hendriks et al. R123.3
sion, protein expression patterns, mutant embryos, and other
Drosophila species will be released periodically in the future.
Staging
The challenge of generating three-dimensional
PointClouds
Imaging
Capturing information for the whole embryo in a single PointCloud file posed a number of technical challenges that had to
be overcome. We briefly discuss those that are most relevant
for understanding of our subsequent analyses. Further details
are provided in Materials and methods.
BioImaging
Database
Images
Image Analysis
Segmentation
Renderer
PointCloudXplore
Genome Biology 2006, 7:R123
information
An initial segmentation analysis was performed on the image
of the DNA stain using a watershed-based method that was
constrained using known morphological characteristics of the
embryo, such as the fact that nuclei have a polarity perpendicular to the surface of the blastoderm and form a single layer.
This strategy identified, on average, 87% of nuclei in an
embryo. Most errors occurred in a narrow strip around the
embryo where the blastoderm surface is tangential to the
microscope's optical axis (that is, on the sides of the image).
Visual inspection using our three-dimensional Segmentation
Volume Renderer [18] suggests that, outside of these regions,
where all nuclei are clearly resolved in the image (Figure 3a),
our initial segmentation masks accurately identify the locations of greater than 99% of nuclei (compare Figure 3a and
Figure 3c). However, the poorer resolution along the optical
axis (compare Figure 3a and Figure 3b) resulted in
interactions
To provide an initial dataset for analyses, we used our pipeline to generate 1,282 PointClouds, each derived from a different embryo (Tables 1 and 2). These PointCloud files and
their descriptions are publicly available from our searchable
BID [10] and cover the expression of 22 genes in embryos
from developmental stages 4d (nuclear cleavage cycle 13) and
5. A variety of pair-wise gene combinations are included, but
most PointClouds include data for either of the pair rule genes
even-skipped (eve) or fushi tarazu (ftz), which serve as reference patterns. Data for both wild-type embryos and embryos
mutant for three maternal regulators of the early network
(bicoid, gastrulation defective, and Toll) are available. We
have released more data than used in this and the accompanying paper [20] in the belief that these PointClouds will be
generally useful to many researchers and that analysis and
modeling of this network will require the combined efforts of
a broader community. Data for further genes' mRNA expres-
(Figure 2d,e) with two different PointCloudXplore views that
represent the same portion of the same embryo (Figure 2f,g).
The two mRNA gene expression patterns are well captured on
a cell by cell basis in the PointCloud.
refereed research
An extensive dataset
The resulting three-dimensional images, however, still suffered from the inherent problems of anisotropic resolution,
signal attenuation, and channel cross-talk. To overcome these
problems, automated image analysis methods were developed to unmix the fluorescence signals from different channels (Luengo et al., manuscript in preparation), correct for
signal attenuation and produce an accurate segmentation
that defines the position and extent of nuclei detected in the
image. (Segmentation is an image analysis term that means to
group together pixels that are associated with a particular
object in the image.)
deposited research
Figure 1
The BDTNP's three-dimensional gene expression analysis pipeline
The BDTNP's three-dimensional gene expression analysis pipeline. The
major steps of the pipeline are shown. Blue arrows show the path of the
major workflow as materials or data files are passed between each step.
Black arrows indicate metadata describing experimental details of each
step being captured in BID or being retrieved from BID during image
analysis, feature extraction, and visualization.
reports
Feature Extraction
reviews
PointClouds
The stage 5 D. melanogaster blastoderm is approximately
500 μm along the a/p axis and 150 μm thick at its center.
Approximately 6,000 blastoderm nuclei are closely packed
around the embryo surface while the interior is filled with
opaque yolk granules. The thickness of the embryo and the
light scatter caused by the yolk made imaging the complete
embryo difficult with standard methods. The close packing of
the nuclei required high quality images so that individual
nuclei could be resolved. Consequently, fixation, staining,
and mounting methods were optimized to maximize stain
intensity, preserve embryo morphology, and optically disrupt
the yolk granules. Embryos were imaged by laser scanning
microscopy using two-photon excitation, which provided
superior optical penetration, reduced signal attenuation and
higher resolving power along the optical axis compared to
single-photon excitation using confocal microscopy [21,22].
comment
Staining
Mounting
R123.4 Genome Biology 2006,
Volume 7, Issue 12, Article R123
Luengo Hendriks et al.
/>
(a)
(b)
(c)
(d)
(e)
(f)
(g)
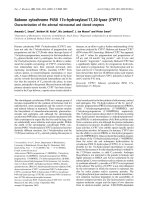
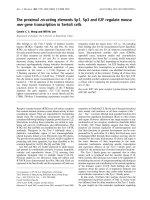
Figure 2
Comparing three-dimensional raw images to PointCloud representations
Comparing three-dimensional raw images to PointCloud representations. (a-c) Maximum projections of the three channels of a three-dimensional
embryo image; (a) the nuclear stain (white); (b) a snail mRNA stain (red); and (c) an eve mRNA stain (green). Note the small bright speckles visible in all
three channels at the same locations. These are outside the cytoplasm and are detected and removed by our image analysis algorithms. The small white
rectangles show a region of interest that is displayed in (d-g). (d,e) The raw image of the nuclear stain (d) and the mRNA stains for eve and sna (e). (f,g)
Two different renderings of the PointCloud derived from this image made using our visualization tool PointCloudXplore: (f) uses small spheres whose
volumes are proportional to the measured volumes of the corresponding nuclei; (g) uses a Voronoi tessellation of the coordinates in the PointCloud. The
arrows indicate the locations of the same three cells in each of the panels (d-g).
Genome Biology 2006, 7:R123
/>
Genome Biology 2006,
Volume 7, Issue 12, Article R123
Luengo Hendriks et al. R123.5
Table 1
Wild type
Stage cohort
Total
5:9-25%
5:26-50%
5:51-75%
5:76-100%
bcd
0
0
2
0
2
0
0
4
croc
1
2
2
3
7
4
7
26
D
0
0
1
3
0
0
0
4
Dfd
0
0
0
4
5
4
1
14
eve
22
83
89
89
116
103
82
584
fkh
0
4
6
8
7
2
6
33
ftz
22
65
72
60
42
73
58
392
gt
1
24
27
28
22
16
10
128
h
0
2
2
3
3
1
0
11
hb
9
20
18
9
8
7
14
85
hkb
0
15
11
7
14
12
3
62
kni
9
8
10
10
9
16
11
73
Kr
1
11
23
9
14
15
4
77
prd
6
17
13
9
10
10
7
72
rho
0
2
8
16
3
13
10
52
slp1
1
2
6
6
13
29
12
69
sna
11
13
4
10
6
17
21
82
tll
0
0
0
0
0
4
2
6
trn
0
4
0
0
2
3
0
9
tsh
0
0
0
3
0
1
4
8
twi
2
4
7
11
11
7
4
46
zen
3
12
5
4
8
3
4
39
Total
88
288
306
292
302
340
260
1,876
The landscape of nuclear density patterns
Having established methods to derive PointClouds from
image data, we developed a variety of strategies to measure
key aspects of morphology and gene expression in three
dimensions. Our three-dimensional feature extraction methods not only provided a new quantitative description of the
blastoderm, but also yielded a better understanding of the
accuracy of our PointCloud representations.
First, we examined the local packing density of nuclei on the
surface. Nuclei have long been treated as if they were
arranged uniformly around the surface of stage 5 embryos
[17,23,24]. Blankenship and Wieschaus [25], however, iden-
Genome Biology 2006, 7:R123
information
To estimate the location of the cytoplasm associated with
each nucleus, the nuclear segmentation masks were extended
by tessellation laterally until they touched and apically and
basally by a fixed distance determined empirically. The
nuclear segmentation and the cytoplasmic tessellation masks
were then used to record the mRNA expression levels in three
regions of each cell: the nucleus, the apical part of the cytoplasm, and the basal part of the cytoplasm. The average fluorescence intensity in one of these three sub-volumes or in the
whole cell was selected as the measure of relative gene
expression depending on where the mRNA of a particular
gene was typically localized within the cell. The recorded
mRNA expression levels and the coordinates and volumes of
the nuclei and cells were then written in table format as a
PointCloud file together with additional metadata describing
the embryo's orientation, stage, phenotype, genotype, and
staining.
interactions
segmentation errors on the sides of images where two or three
nuclei along the optical axis were grouped together. A model
based on nuclear size derived from accurate segmentation
results in the top and bottom of the image was then used to
correct the segmentation errors in these side regions. While
the accuracy of this model-based correction was difficult to
quantify from the images (compare Figure 3b and Figure 3d),
it nevertheless produced segmentation masks that more
closely approximated the number and position of nuclei on
the sides of images.
refereed research
Since each embryo was stained for two genes, the total given in each column is double the number of embryos in the release. The release contains
some additional embryos for which the staging was ambiguous.
deposited research
5:4-8%
reports
5:0-3%
reviews
4d
comment
Number of genes' mRNA expression patterns from individual PointClouds in Release 1 for the series of developmental stage cohorts
used in [20]
R123.6 Genome Biology 2006,
Volume 7, Issue 12, Article R123
Luengo Hendriks et al.
/>
Table 2
The number of mutant PointClouds for bcd12, gd7 and Tl10B in Release 1 divided into the same developmental stages as in Table 1
Gene
Stage cohort
4d
5:0-3%
5:4-8%
5:9-25%
Total
5:26-50%
5:51-75%
5:76-100%
bcd12
Mutant
1
0
2
5
10
10
11
39
WT-like
0
7
6
15
26
13
5
72
Mutant
0
3
2
2
11
8
6
32
WT-like
0
3
1
5
13
4
0
26
0
4
5
4
9
1
2
25
0
7
4
5
21
8
0
45
gd7
Tl10B
Mutant
WT-like
bcd12 and
Tl10B have
gd7 have
All embryos in
been stained for ftz and sna mRNA expression. The embryos in
been stained for ftz and either sna or zen
expression. The number of PointClouds judged to be derived from homozygous mutant females (mutant) and heterozygous wild-type-like females
(WT-like) are given. The release contains some additional embryos for which the staging was ambiguous.
tified three distinct regions along the a/p axis that had different nuclear densities. Densities were lowest in the anterior of
the embryo, higher where the cephalic furrow will later form,
and intermediate posterior of this point.
Based on this observation, we calculated local densities as the
number of nuclear centers per μm2, measured on the surface
of the embryo within the neighborhood of each nucleus. Average values from 294 embryos at late stage 5 were plotted on
two-dimensional cylindrical projections to show the densities
around the entire blastoderm surface (Figure 4). The embryos
were imaged at different, random orientations relative to the
microscope objective, each embryo being imaged in one orientation (see Materials and methods). Because the segmentation of nuclei on the tops and bottoms of the images was more
accurate, we averaged density measurements from only these
higher quality regions (Figure 4b) and, for comparison, measurements taken from only the sides of images (Figure 4c).
Since the embryos used for generating the density maps were
in many different orientations, using data only from the highest quality regions provided the most accurate assessment of
mean densities for all parts of typical embryos.
Our data are in line with the one-dimensional analysis of
Blankenship and Wieschaus, but revealed a much more complex, fine-grained pattern of densities that varied continuously around the entire blastoderm surface (Figure 4b). The
densities changed by up to two-fold, being highest dorsally
and lowest at the anterior and posterior poles, with additional
local patches of high or low density also apparent. Some features of the density patterns correlated with the expression of
transcription factors that regulate the blastoderm network
and with morphological features that form later during gastrulation. For example, the valley of lower density along the
ventral midline aligns with the borders of snail expression,
which also defines the cells that will fold inward to form the
ventral mesoderm at gastrulation (Figure 4d). The previously
noted ridge of high density that follows the most anterior
stripe of eve expression (eve stripe 1) was also visible (Figure
4d). This region will fold in to form the cephalic furrow just
after stage 5 [26]. These density patterns may, therefore,
reflect unknown or largely uncharacterized mechanisms that
drive later gastrulation movements. Alternatively, they may
be merely a non-functional early consequence of gene activities that later cause the larger movements of gastrulation.
Whether the nuclear density patterns we observe play a role
in morphogenesis or not, they will likely affect the rate at
which transcription factors are transported between neighboring nuclei. Thus, they will need to be incorporated into any
computational model of this system.
These density measurements also provided an estimate of the
accuracy of the segmentation in defining nuclei. The standard
deviations of measured density values between PointClouds
were between 9% and 18% of the mean. Because the variation
between individual PointClouds included all natural variation
between embryos and all errors and artifacts introduced at
different steps of our pipeline, the standard deviation set an
upper limit on the errors our methods introduced. The high
reproducibility between independent measurements on the
left and right halves of embryos also provided a measure of
the accuracy of our analysis (Figure 4b). Finally, to analyze
the errors in segmentation on the sides, we computed a density map with data taken from the sides of images (Figure 4c)
and compared it to the density map computed with data taken
from the tops and bottoms of images. The two maps generated were broadly similar to each other (Figure 4b), and
yielded an estimate of the bias in nuclear numbers on the
sides compared to the tops and bottoms of images. The maps
showed that nuclear numbers were overestimated by up to
11% in the ventral region, and underestimated by up to 7% in
the dorsal region when these regions were on the sides of the
image.
Genome Biology 2006, 7:R123
/>
Genome Biology 2006,
(b)
(c)
Luengo Hendriks et al. R123.7
(d)
comment
(a)
Volume 7, Issue 12, Article R123
reviews
reports
small variations demonstrates the sensitivity of our methods,
compared to previous analyses that looked by eye for such
irregularities prior to gastrulation and failed to detect them,
presumably because of their small size [23,27].
The location of pair rule gene stripes
Genome Biology 2006, 7:R123
information
In addition to morphology, our PointCloud data provided the
first opportunity to characterize spatial gene expression patterns in three dimensions. Previous analyses of gene
expression in the blastoderm have generally relied on either
visual inspection of photomicrographs or quantification of
expression stain intensities in narrow one-dimensional strips
running along either the a/p or d/v body axes (for example,
[6,28]). For our initial three-dimensional analysis, we
mapped the locations of the expression stripe borders of three
pair rule genes, eve, ftz and paired (prd), that are a key part
of the cascade that determine cell fates along the a/p axis.
First, we divided the embryo surface into 16 strips running
along the a/p axis that were evenly spaced around the embryo
circumference. For each strip, inflection points were then
interactions
While exploring the structure of our PointClouds, we discovered that, during stage 5, the PointCloud surface becomes
increasingly rough due to small apical or basal displacements
of nuclei. To quantify this, we measured the displacement of
each nucleus with respect to a smooth surface fitted through
its neighbors (Figure 5). This showed a complex morphological pattern that, like the nuclear density plots, correlated to
the expression patterns of transcriptional regulators and later
morphological features such as the ventral furrow. The most
extreme of these features was an approximate 0.5 μm apical
shift above the mean fitted surface, which is equivalent to a
single pixel distance in the imaging plane, or about a third of
a pixel in the axial direction. Our methods achieved such
accuracy because the location of a nucleus in the PointCloud
is given by its center of mass, which achieves sub-pixel accuracy. Given the small scale of these movements and the fact
that the averages were of a similar order to the standard deviation between individuals (0.7 μm), it is unclear if they have a
biological function. However, the ability to measure such
refereed research
Apical/basal nuclear displacement
deposited research
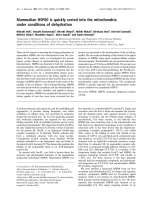
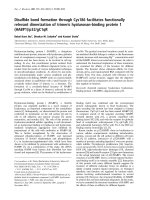
Figure 3
Comparing segmentation results on the top and the side
Comparing segmentation results on the top and the side. Using a maximum projection, we show two portions of a three-dimensional image of an embryo
fluorescently stained to label nuclei. (a) A projection along the optical axis, yielding a x-y image (the top of the embryo); (b) a projection perpendicular to
that, yielding a x-z image (the side of the embryo). The nuclei on the top of the embryo appear well separated and distinct (a). Seen from the side,
however, individual nuclei appear elongated along the z-axis due to limited axial resolution, which makes them more difficult to identify (b). The
segmentation algorithm provided an accurate segmentation of nuclei (c) on the tops of embryo images, but (d) on the sides, a model was used to fine-tune
the segmentation, resulting in a less accurate result.
R123.8 Genome Biology 2006,
Volume 7, Issue 12, Article R123
dorsal
(a)
anterior
Luengo Hendriks et al.
/>
dorsal
posterior
eve
sna
ventral
ventral
dorsal
anterior
(b)
(c)
Density from tops and bottoms
Dorsal
μm−2
0.05
Density from sides
Dorsal
Left
posterior
Left
0.045
0.04
Ventral
Ventral
0.035
Right
Right
0.03
Dorsal
0
(d)
20
40
60
80
100
Dorsal
0
20
40
60
80
100
0.025
Density from tops and bottoms
Dorsal
Left
Ventral
Right
Dorsal
0
20
40
60
a/p location (% EL)
80
100
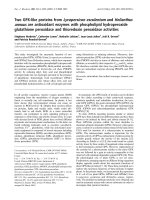
Figure 4
Stage 5 blastoderm embryos show a complex pattern of nuclear densities
Stage 5 blastoderm embryos show a complex pattern of nuclear densities. (a) A schematic representation of how information calculated on the threedimensional surface constructed from a PointCloud was projected onto a surrounding cylinder and the cylinder was then unrolled to produce a planar
map. In these cylindrical projections, anterior is to the left, posterior to the right, the dorsal midline is at the top and bottom, and the ventral midline is in
the middle. The distance along the a/p axis is given as a percent egg length (EL). (b-d) Average local nuclear density maps were computed from 294
embryos. The maps in (b,d) were computed from the 'top' and 'bottom' portions of each embryo image only, where the segmentation is most accurate.
The map (c) was computed from the 'sides' only. The two maps broadly agree, but on the sides of the embryo images the segmentation algorithm has
underestimated the number of nuclei dorsally and overestimated the number ventrally. Isodensity curves were plotted over a color map representing local
average densities from 0.025 nuclei/μm2 (dark blue) to 0.05 nuclei/μm2 (dark red) (b,c). The average expression patterns of eve (green) and snail (red) are
shown with the isodensity contour (d). The most anterior stripe of eve follows a ridge of locally high density, and the boundaries of snail expression follow
contour lines along about half the length of the embryo.
Genome Biology 2006, 7:R123
/>
Genome Biology 2006,
µm
0.2
0.1
Left
0
−0.1
Luengo Hendriks et al. R123.9
dorsal midline, across eve stripe 7, to the center of ftz stripe 6
at the ventral midline (Figure 6). For pair rule genes to be said
to only specify the a/p position, the principal body axes would
have to be redefined in such a way that they curve to follow
stripe expression. While we do not necessarily advocate such
a coordinate system, as we show later, it is at times
convenient to derive measures by following gene expression
features around the circumference of the embryo, rather than
along a straight body axes.
comment
Dorsal
Volume 7, Issue 12, Article R123
Ventral
−0.2
−0.4
Dorsal
−0.5
0
20
40
60
a/p location (% EL)
80
100
One of the strongest motivations for developing our gene
expression analysis pipeline was the desire to obtain quantitative descriptions of gene expression levels. It is well known
that the expression of transcription factors changes quantitatively from cell to cell and that this results in quantitative
responses in the rate of transcription of their targets (for
examples in the Drosophila blastoderm, see [6,36,37]). Our
methods cannot precisely capture absolute levels of gene
expression, largely due to variations in labeling efficiency
between embryos and microscope performance. At a minimum, however, we ought to capture relative levels of expression, which should be adequate for determining regulatory
relationships between transcription factors and their targets.
Genome Biology 2006, 7:R123
information
We addressed three questions to help establish how well our
methods provide a quantification of relative expression. First,
did our attenuation correction correctly overcome the problem of signal attenuation through the depth of the embryo to
provide reliable quantification in three dimensions? Second,
did our enzyme-based mRNA labeling methods give
quantitatively similar results to antibody-based labeling of
protein, which is generally viewed as giving fluorescence
interactions
The fact that a/p positions of pair rule stripes vary along the
d/v axis has long been apparent from visual inspection of low
resolution two-dimensional data (for example, [29]). The
nomenclature commonly used to describe the blastoderm
system, however, does not easily accommodate this displacement. Pair rule genes are often said to specify position only
along the a/p axis. Yet, using the traditional definition that
the d/v and a/p axes are straight and perpendicular to each
other, the relative locations of pair rule stripes clearly change
along both axes and thus have the potential to specify information along the d/v axis also. For example, a line orthogonal
to the a/p axis at 80% egg length passes from ftz stripe 7 at the
Measuring relative intensities of gene expression
stripes
refereed research
Figure 6 plots the stripe border locations in two-dimensional
orthographic projections. The data show that at approximately 57% egg-length the pair rule stripes maintained a relatively constant a/p position around the embryo
circumference as measured in each of the 16 strips. This was
not the case, however, for the stripes more anterior and posterior of this point. Between the dorsal and ventral midlines,
stripes were displaced by up to 9.3% egg length (for example,
eve stripe 7), or approximately 7 cell diameters. Furthermore,
our data show that the stripes are curved, not straight.
deposited research
used to estimate the location of stripe borders along the a/p
axis. The inflection point of a slope is defined as its steepest
point (that is, a local maximum in the derivative).
As was the case with measurements of morphology, these
stripe feature extraction measurements also provided an
indication of the accuracy of our methods. The 95% confidence limits along the a/p axis (Figure 6) are small compared
to the stripe displacements noted, indicating that the changes
observed are significant in our assays.
reports
Figure
Patterns5of nuclear displacement from the PointCloud surface
Patterns of nuclear displacement from the PointCloud surface. The
location of each nucleus with respect to a smooth PointCloud surface was
mapped and averaged over the same cohort of embryos used in Figure 3
and displayed as a cylindrical projection. The map shows that the average
apical (positive) or basal (negative) shift of nuclei forms a pattern that
appears to correlate with cell fate and the expression patterns of
blastoderm transcriptional regulators. Egg length (EL).
reviews
−0.3
Right
We also found that pair rule genes do not always maintain the
same register along the a/p axis. When eve and ftz stripes
were compared, they had largely non-overlapping complementary patterns that do maintain the same registration relative to each other, both along the a/p axis and around the
circumference of the embryo, consistent with previous
reports [30] (Figure 6a). In contrast, the registration between
eve and prd stripes changed. For example, prd stripe 1 has a
much larger overlap with eve stripe 1 than prd stripe 7 has
with eve stripe 7. In models of pair rule regulation, gene
expression patterns are typically said to maintain spatial registration (for example, [31-35]). Clearly this is not always the
case, implying that the rules that govern regulatory networks
are more subtle and complex than current models suggest.
R123.10 Genome Biology 2006,
Volume 7, Issue 12, Article R123
Luengo Hendriks et al.
/>
(a)
Dorsal
eve
ftz
Ventral
0
10
20
30
40
50
60
70
80
90
10
20
30
40
50
60
a/p location (% EL)
70
80
90
(b)
Dorsal
eve
prd
Ventral
0
Figure 6 of stripes of the pair rule genes ftz, eve and prd
Locations
Locations of stripes of the pair rule genes ftz, eve and prd. The locations of stripe borders along the a/p axis were computed at 16 locations around each
embryo; the measurements for all embryos were averaged. The results are displayed as orthographic projections in which the anterior of the embryo is to
the left and the dorsal midline to the top. Pair-wise comparisons of the expression of (a) eve and ftz and (b) eve and prd are shown. The error bars give
the 95% confidence intervals for the means. The relationship between eve and ftz stripes was constant, but prd stripes shifted their registration relative to
eve's along both the a/p and d/v axes. The data for eve expression were derived from n = 215 embryos at stage 5:50-100%, ftz from n = 155, and prd from
n = 17. Egg length (EL).
intensities proportional to expression levels? Third, was our
quantification of expression patterns sufficiently consistent
between embryos that relative expression patterns for each
gene could be determined?
The accuracy of our attenuation correction was simple to test
because the corrected gene expression levels we derived must
be independent of the orientation of the embryo when it was
imaged. Therefore, we compared expression intensities at the
same location on the same stripe for multiple embryos
imaged in different orientations. We compared the average
Genome Biology 2006, 7:R123
Genome Biology 2006,
Measured relative expression intensity
(a)
bottom
side
top
1
0.8
0.6
0.4
0.2
0
−5 −4 −3 −2 −1 0 1 2 3
a/p distance (% EL)
4
5
−5 −4 −3 −2 −1 0 1 2 3
a/p distance (% EL)
4
5
(b)
1
reports
0.8
0.6
0.4
0.2
0
refereed research
interactions
Figure 7
orientations
Expression intensity profiles taken from embryos imaged in different
Expression intensity profiles taken from embryos imaged in different
orientations. (a) The average intensity profile measured on the image
bottom (blue), side (green) or top (red) with respect to the orientation of
the embryo in the microscope. Intensities for eve stripe 1 were measured
within two strips 1/16th of the width of the embryo circumference located
on the left and right lateral midlines, after normalizing the expression
values by setting the 1st percentile of the values in the whole embryo to 0
and the 99th percentile to 1. The plot shows the average intensity along
the a/p axis for these strips. The difference in height between the three
graphs gives an indication of the orientation-specific error. The measured
intensity differs by less than 10% when the embryo surface is
perpendicular or parallel to the optical axis. (b) An indication of the
variation between individual PointClouds; the 52 profiles used to obtain
the top average profile in (a).
deposited research
Pair rule expression within stripes varies around the
d/v axis and is different for adjacent stripes
To further explore the consistency of our quantification, we
compared expression levels for each stripe for several pair
rule genes. We first measured the local maximum intensity in
different regions around the circumference of the embryo
within each stripe. In other words, expression was compared
along the stripe in the direction of the d/v axis, but not along
the straight line of the d/v axis so as to avoid the complication
Genome Biology 2006, 7:R123
information
To examine the consistency of our quantification methods
across embryos, we examined the variation in expression levels between measurements from individual PointClouds (Figure 7b). Multiple factors contributed to this variation,
including natural variation between individual embryos and a
range of inaccuracies that could have been introduced by our
pipeline, such as differences in scaling, background staining,
imaging noise, and segmentation errors. Given this, the similarity of the data was reassuring and suggested that our data
were a useful guide to relative gene expression.
Luengo Hendriks et al. R123.11
reviews
The method we used to fluorescently label mRNA expression
patterns included a signal amplification step with horseradish
peroxidase enzyme that, to our knowledge, has not been
shown to yield fluorescent product in proportion to the
amount of mRNA. In contrast, protein stains with fluorophore-conjugated antibodies are generally considered to be a
proportional measure of protein expression levels, and a
recent analysis by Thomas Gregor et al. has confirmed this
assumption (T Gregor, E Wieschaus, A McGregor, W Bialek,
and D Tank, personal communication). As an indirect test of
whether our mRNA detection method provides a linear measure of RNA concentration, we compared the relative levels of
mRNA and protein for one gene, knirps (kni). Because protein expression patterns lag mRNA expression patterns in
time, we compared expression of mRNA in early stage 5
embryos to protein expression at mid stage 5. As Figure 8
shows, the relative levels of expression of kni protein and
mRNA closely match. Thus, our mRNA detection methods
and antibody-based protein detection methods appear to be
similarly quantitative.
Volume 7, Issue 12, Article R123
comment
levels of expression at the left and right lateral midlines of a
single eve expression stripe. Expression was averaged from a
group of 52 embryos where the lateral portions of the embryo
were at the top and bottom of the embryo relative to the
microscope objective, and 31 embryos where these regions
were on the side. The average expression level was plotted
along the a/p axis, giving a profile of the rising and falling
level of expression across the width of a stripe. Figure 7a
shows that mean expression profiles for the top and bottom
groups were indistinguishable, indicating that the attenuation correction was accurate. But the side group had a peak of
expression at the center of the stripe about 10% higher, indicating a modest error in quantifying expression at the sides of
the image. We suspect that this error was caused by blurring
along the optical axis. This distributes expression fluorescence signal from one cell to its neighbors on the sides of the
image, and from one cell to the background on the top and
bottom of the image. Since this error is small and known,
more accurate estimations of expression could be achieved by
averaging data from embryos in a variety of orientations or, if
desired, by weighting against data derived from the sides of
three-dimensional images or building an explicit model to
correct for this error.
Measured relative expression intensity
/>
R123.12 Genome Biology 2006,
Relative intensity
1
Luengo Hendriks et al.
0.5
Implications for the specification of positional
information by pair rule genes and the interplay of the
a/p and d/v regulatory systems
0
1
20
40
60
80
100
80
100
kni expression, dorsal
0.5
0
0
/>
even specify the full stripe around the circumference of the
embryo; see, for example, the group of cells expressing ftz
above 75% of the maximum level.
kni expression, ventral
protein
mRNA
0
Relative intensity
Volume 7, Issue 12, Article R123
20
40
60
a/p location (% EL)
Figure
results 8
Methods for quantifying relative protein and mRNA levels give similar
Methods for quantifying relative protein and mRNA levels give similar
results. Average expression of kni mRNA at the beginning of stage 5 (7
embryos) is compared to kni protein expression at mid-stage 5 (17
embryos). The two graphs show the expression along the a/p axis (x-axis)
at the ventral (top graph) and dorsal (bottom graph) midlines. The levels
of fluorescence for mRNA labeling and protein labeling have remarkably
similar shapes. Egg length (EL).
caused by the three-dimensional shape of the stripes. As Figure 9 indicates, our methods showed clear quantitative
differences in expression both between stripes and within
individual stripes in the direction of (but not along) the d/v
axis. The fact that these differences are less than the 95% confidence limits for the mean intensity shows that our methods
are sufficiently consistent to detect these variations.
In the case of ftz, the expression profiles of stripes 1 and 2
were similar to one another; those of stripes 3 to 6 were also
similar, but the profiles of both of these groups of stripes differed from one another and from stripe 7 (compare Figure 9ac). Stripes for eve, prd and sloppy paired (slp1) also showed
different relative levels of expression, and there was no apparent relationship between equivalent stripes for each of these
genes. The magnitudes of many of these differences in expression were up to and, in some cases, greater than two-fold.
There are many precedents for changes in transcription factor
concentrations of this magnitude affecting the control of
downstream target genes, such as the effect of eve concentration on ftz [37] or the number of bcd copies on its target genes
[36,38]. Thus, it is quite possible that these changes in pair
rule expression will have a functional impact on the network.
Figure 10 provides another view of this d/v modulation,
showing that the spatial pattern proscribed by expression of
ftz above a given threshold does not specify a constant width
segment of cells. The highest levels of ftz expression do not
The principal biological function of each pair rule gene is presumed to be to specify repeated locations within the embryo,
each stripe specifying (at least to a first order approximation)
the same information. Although qualitative differences in
expression levels around the embryo circumference for
individual stripes of pair rule genes have been noted in a few
cases previously (for example, [39,40]), in general, little consideration has been given to changes in expression either
between equivalent positions on different stripes or between
different locations within stripes in the direction of the d/v
axis. The variation in stripe position and expression levels
suggests that genes whose principal function is to specify
expression along the a/p axis have the potential to also convey
some modest patterning information along the d/v axis.
Conversely, the fact that pair rule gene expression changes
quantitatively in the direction of the d/v axis also implies that,
directly or indirectly, d/v axis regulators, such as twist, snail
and dorsal, are responsible for generating these changes. As
we show in the accompanying paper [20], this is the case. The
regulatory systems controlling the two principal body axes
appear to mutually interact early during zygotic
transcription.
Conclusion
The Drosophila blastoderm embryo is one of the most
intensely studied systems in developmental biology, both in
the areas of transcriptional regulation and morphological
development. The fact that our three-dimensional methods
have quickly uncovered new features of this system suggests
there is still much to learn about many developmental processes. The detailed complexity of morphology and gene
expression revealed by these methods, much of which cannot
be readily judged by eye, suggest that quantitative threedimensional measurements and computational analyses will
be essential if we are to truly describe and understand animal
regulatory networks.
The methods we have presented here and in the accompanying paper are by no means sufficient, however. Further work
will be required to establish how well our data capture levels
of gene expression. The dataset we have released provides
information for individual embryos, each showing the expression of only a pair of genes. To examine regulatory
relationships between transcription factors and their targets,
it will be important to compare the expression of many genes
within a common framework [41,42]. To this end, we have
developed methods for aligning information from multiple
Genome Biology 2006, 7:R123
/>
(a)
Genome Biology 2006,
(d)
0.8
0.6
0.6
0.4
0.4
0.2
Relative intensity
0.8
0.2
0
(b)
Dorsal
Left
Ventral
Right
Dorsal
0
(e)
ftz stripes 3, 4, 5, 6
Relative intensity
Right
Dorsal
Left
Ventral
Right
Dorsal
Left
Ventral
Right
Dorsal
prd
0.4
0.2
Ventral
0.6
0.4
Left
0.8
0.6
Dorsal
1
0.8
Stripe 1
Stripe 2
Stripe 3
Stripe 4
Stripe 5
Stripe 6
Stripe 7
0.2
(c)
Dorsal
Left
Ventral
Right
Dorsal
0
(f)
ftz stripe 7
0.8
0.8
0.6
0.6
0.4
0.4
0.2
slp1
1
0.2
0
Dorsal
Left
Ventral
Right
Dorsal
0
Dorsal
three-dimensional analyses will likely require the efforts of a
large multidisciplinary community of researchers.
Materials and methods
Fly stocks and nucleic acid probes
Wild-type embryos were cultured in cages for many years,
starting with a nominally CantonS strain.
Genome Biology 2006, 7:R123
information
PointClouds to allow such cell-by-cell comparisons of the
expression of hundreds of genes and are using these to
explore the relationships between regulator and target gene
expression patterns (CC Fowlkes and J Malik, unpublished
data). In addition, our methods will require further development before they can be applied to the analysis of gene
expression in later stages of Drosophila development and to
other animal systems. The broader application of quantitative
interactions
Figure 9
The relative levels of pair rule stripe expression vary between and along stripes
The relative levels of pair rule stripe expression vary between and along stripes. Plotted are averaged expression intensities of gene stripes for (a-c) ftz,
(d) eve, (e) prd and (f) slp1. The various stripes of each gene show marked differences in expression profiles and each gene has a unique mode of variation
in the direction of the d/v axis. The error bars give the 95% confidence intervals for the means. The data for eve expression were derived from n = 215
embryos at stage 5:50-100%, ftz from n = 155, prd from n = 17, and slp1 from n = 23.
refereed research
1
Dorsal
deposited research
0
reports
1
Relative intensity
eve
1
reviews
1
Luengo Hendriks et al. R123.13
comment
ftz stripes 1, 2
Volume 7, Issue 12, Article R123
R123.14 Genome Biology 2006,
Volume 7, Issue 12, Article R123
Luengo Hendriks et al.
/>
Dorsal
25%
40%
50%
60%
75%
Ventral
0
10
20
30
40
50
60
a/p location (% EL)
70
80
90
Figure 10
The boundaries of relative levels of ftz expression
The boundaries of relative levels of ftz expression. Plotted are the averaged locations of various threshold levels of ftz expression derived from 155
embryos, computed and displayed similarly as in Figure 6. For example, those cells expressing ftz above 75% of the maximum level of expression are
shown in red. Note the shape of the stripes above the 50% threshold is similar to that given by the inflection points (Figure 6), but not equal. For example,
the dorsal-most point of stripe 7 is less than 50% of the maximum expression level for more than half the embryos (that is, the stripe at that point is not
shown in this graph). Egg length (EL).
Full length eve, ftz, gt, hb, kni, Kr, prd and slp1 cDNAs were
inserted in Gateway pDEST-vectors (M Stapleton, B Grondona, unpublished data). A 1.7 kb Sna cDNA fragment in
pBSK(+) was a gift from E Bier (UC Santa Cruz, CA, USA). To
create linear DNA templates, pDEST full length cDNAs were
amplified using extended vector primers such that the T3
primer sequence was 3' of the cDNA and the T7 primer lay 5'
(T7: 5'-GTA ATA CGA CTC ACT ATA GGG ACA TCA CCT CGA
ATC AAC A; T3: 5'-AAT TAA CCC TCA CTA AAG GGC GGG
CTT TGT TAG CAG C). The pBSK+ cDNA was PCR-amplified
using M13 ± primers. Antisense biotin (BIO), digoxigenin
(DIG) or dinitrophenyl (DNP)-labeled RNA probes were
prepared by in vitro transcription from PCR generated DNA
templates for each gene using T3 RNA polymerase. To
increase signal, the probes were not hydrolyzed [43].
Fluorescent triple-staining
Wild-type embryos were collected for 1 h and matured for 3 h
at 25°C, then dechorionated with 50% household bleach for 3
minutes and fixed for 20 minutes with 1:4 (v/v) solution of
10% formaldehyde (Polysciences, Warrington, PA, USA) and
heptane (Sigma, St. Louis, MO, USA). Fixed embryos were
devitellinized by shaking vigorously in 1:1 methanol/heptane,
after which they were washed three times with methanol and
once with 100% ethanol, and stored in ethanol at -20°C.
Embryos were rehydrated in phosphate buffered saline pH
7.2, 0.05% Tween20, 0.2% TritonX-100 (PBT+Tx), post-fixed
for 20 minutes in 5% formaldehyde/PBT+Tx, and, after several washes in hybridization buffer (50% formamide, 5 × SSC
pH 5.2 to 5.4, 0.2% TritonX-100, 50 μg/ml heparin) at 55 to
59°C, prehybridized for 1 to 5 h in hybridization buffer. There
was no proteinase K treatment. To improve the staining
quality, the prehybridized eggs were stored in -20°C hybridization buffer for at least 16 h.
For each in situ hybridization, 50 to 100 μl of embryos were
incubated in 300 μl of hybridization buffer with an RNA
probe for one gene labeled with DIG and an RNA probe to a
second gene labeled with either DNP or BIO. After 12 to 48 h
co-hybridization at 55 to 59°C and several high-stringency
and low stringency washes, the two probes were detected
sequentially. The DIG-labeled probe was detected using
1:500 horseradish peroxidase conjugated anti-DIG-antibody
(anti-DIG-POD; Roche, Basil, Switzerland) and either a Cy3
or coumarin-tyramide reagent (Perkin-Elmer TSA-kit,
Wellesley, MA, USA). Before the second probe was detected,
the anti-DIG-POD antibody was first removed with several 15
minute washes with 50% formamide, 5 × SSC, 0.2% TritonX100 at 55°C, followed by inactivation of the remnants with 5%
formaldehyde/PBT+Tx. Then the second probe was detected
using 1:100 anti-DNP-HRP (Perkin-Elmer) and either the
complementary coumarin or Cy3-TSA-tyramide reaction. To
allow detection of nuclei with a nucleic acid binding stain, all
RNA in the embryo was first removed by digestion with 0.18
μg/ml RNAseA in 500 μl overnight at 37°C, and then the DNA
Genome Biology 2006, 7:R123
/>
Genome Biology 2006,
Volume 7, Issue 12, Article R123
Luengo Hendriks et al. R123.15
sented in this paper, we used embryos in the range stage 5:50100% invagination, which is a time window of 10 to 15 minutes [44].
The kni protein expression was detected with guinea pig-antikni (a gift from J Reinitz, Stony Brook University, Stony
Brook, NY, USA) and Alexa488-anti-guinea pig (Molecular
Probes) in embryos hybridized against ftz DIG-mRNA that
was detected with coumarin tyramides. For these embryos
only, the nuclei were detected using mouse-anti-histoneH1
and Alexa555-anti-mouse.
Imaging
information
Genome Biology 2006, 7:R123
interactions
To locate individual nuclei, the DNA image was convolved
with a narrow Gaussian to reduce noise. Local maxima in the
resulting image, termed 'seeds' (Figure 11), were then used to
determine nuclear position. Multiple seeds were often
observed in a single nucleus along its apical-basal axis on the
sides of images, due to anisotropic resolution and nuclear
refereed research
The segmentation routines used as input the image of the
Sytox DNA stain channel, labeled 'DNA image' in Figure 11.
To restrict the analysis to the nuclei on the embryo surface, a
three-dimensional binary mask, the 'shell mask' (Figure 11),
was defined around the embryo surface by taking an adaptive
threshold of the 'DNA image' that varied on a per-slice basis
to account for signal attenuation (Figure 12). This shell mask
was used to direct spectral unmixing of the Cy3, Sytox and
Coumarin channels. It also allowed the initial attenuation
correction of the Sytox channel required for the segmentation. This was accomplished using a local contrast stretch
within the shell mask. A global threshold was then applied to
the unmixed, attenuation-corrected Sytox channel, which
was then masked by the shell image. The resulting 'DNA
mask' (Figure 11) identified the regions in the image that
belong to the blastoderm nuclei.
deposited research
Each of the imaged embryos was individually staged from a
phase contrast view and the stages were recorded into BID.
Embryos of stage 5 [17] were subdivided into cohorts based
on the degree to which membranes had invaginated during
cellularization. For example, an embryo in which the cellular
membranes had invaginated 50% of the distance across the
cortical cytoplasm would be staged as stage 5:50%. Because
the rate of cellular invagination varies along the d/v axis,
being most rapid ventrally, the percentage of membrane
invagination was visually estimated where possible at the
ventral surface of the embryo. If the embryo was lying in an
orientation where the ventral surface was not visible in crosssection, however, we estimated the degree of membrane
invagination at that side of the embryo where invagination
was most advanced. Later, the stage of these embryos was
corrected based on our observation that membrane invagination is about 70% laterally when it is at 100% ventrally, yet at
40% invagination it is approximately even all around the
embryo. The degree to which membranes had invaginated
ventrally was estimated using a linear mapping for cases
where membranes had invaginated laterally at least 50%
using the function 50 + (5/2)(v - 50) (where v is the lateral
invagination percentage). The d/v orientation of all embryos
was determined from their respective PointClouds based on
gene expression features (see below). For the analyses pre-
The position and extent of the nuclei on the surface of the
embryo were defined by a model-based three-dimensional
segmentation analysis. Here we discuss some of the main
aspects of the algorithm. All image processing and analysis
algorithms were implemented in MATLAB (The MathWorks
Inc, Natick, MA, USA) with the DIPimage toolbox [45,46].
reports
Temporal staging
Segmentation
reviews
The stained embryos were dehydrated with an ethanol-series
and mounted in xylene-based DePex (Electron Microscopy
Sciences, Hatfield, PA, USA). A #1 coverslip was placed on a
bridge formed by two #1 coverslips to prevent embryo
flattening. This mountant has the advantages of creating permanent slides that protect the fluorophore from oxygen,
which makes the samples highly resistant to photobleaching.
To estimate the refractive index of the mountant (which
determines the scaling of the z-axis), we used the assumption
that embryo morphology was independent of the orientation
of the embryo when it was imaged. A d/v cross-section of
multiple embryos was taken at 50% egg length. Within these
cross-sections, the ratio of the d/v length to the left/right
length was plotted against orientation angle (data not
shown). The refractive index was then computed so that this
ratio was independent of the orientation. The average refractive index calculated using this method was 1.62 ± 0.06.
Three-dimensional images of the whole embryos were
obtained on a Zeiss LSM 510 META/NLO laser scanning
microscope (Carl Zeiss MicroImaging, Inc., Thornwood, NY,
USA) with a plan-apochromat 20×, 0.75 numerical aperture
objective. This objective allowed imaging of entire embryos in
a single field-of-view while providing sufficient resolution
and sensitivity for the subsequent analyses. The fluorophores
were excited simultaneously by dual 750 nm photons supplied by a Chameleon laser (Coherent, Inc., Santa Clara, CA,
USA). The resulting emission spectrum was split by dichroic
mirrors and collected by three independent photomultiplier
tubes (PMTs). The signals were digitized into 12 bits and
recorded as three-channel images, each of a size up to 1,024
by 1,024 by 150 pixels, which varied depending on the embryo
size. Each pixel had a transverse dimension of 0.45 μm and an
axial dimension of approximately 1.6 μm, which varied
slightly with the refractive index of the mounting medium.
The gain and offset of the PMTs were set so that all the pixels
of interest fell within the 12 bit dynamic range.
comment
was stained overnight by incubation in 500 to 1,000 μl of a
1:5,000 dilution of Sytox Green dye (Molecular Probes,
Carlsbad, CA, USA).
R123.16 Genome Biology 2006,
Volume 7, Issue 12, Article R123
Luengo Hendriks et al.
DNA image
Shell mask
Smoothed DNA
DNA mask
Surface normals
Seeds
/>
Pruned seeds
Apical cytoplasm
Nuclei
Basal cytoplasm
Figure 11
Overview of the segmentation algorithm
Overview of the segmentation algorithm. The main steps of the algorithm are illustrated here on a small portion of a slice through the middle of an
embryo. Note that the actual images are three-dimensional and comprise a whole embryo. The DNA image is the input Sytox channel. A shell mask
defines the region that contains all the information of interest for the segmentation algorithm: the blastoderm nuclei with a small part of the cytoplasm.
The DNA mask distinguishes the nuclei from the background (cytoplasm, yolk, and so on). The seeds image contains the local maxima of the smoothed
DNA, a Gaussian filtered version of DNA image. Surface normals are computed for each seed from the shell, and used to prune the seeds. The image
nuclei is the nuclear segmentation mask, dividing the DNA mask into individual nuclei. The dotted arrow going back to the pruned seeds represents the
addition of seeds according to the results obtained in nuclei. The apical cytoplasm and basal cytoplasm mark the cytoplasmic regions for each nucleus
estimated using a tessellation.
geometry. Multiple seeds were also occasionally detected on
the bottom of the embryo, where the signal to noise ratio was
low due to signal attenuation. To eliminate multiple seeds,
the embryo 'surface normal' for each seed was computed by
applying the structure tensor [47,48] to the three-dimensional skeleton [49-51] of the shell mask(Figure 11). Neighboring seeds that lay along this normal were assumed to
belong to the same nucleus and simply removed, leaving only
a set of 'pruned seeds' (Figure 11).
Once a single seed was determined per nucleus, the pruned
seeds were grown to fill the nuclei, using a region-growing
algorithm that combined a watershed algorithm [51,52] and a
gray-weighted distance transform [51,53,54] of the DNA
image (Figure 11). The combination of these two algorithms
created nuclear boundaries that matched actual boundaries
when visible, yet divided distances between seeds equally
when boundaries where not distinguishable.
In some cases nuclei, predominantly on the sides of images,
did not posses a seed and were joined to one of its neighbors.
These regions were detected by comparing their sizes to average sizes taken from the top and bottom of the image where
segmentation was most accurate (Figure 3). The original
seeds for these regions were then replaced by an appropriate
number of seeds using a cluster analysis algorithm [55] that
placed seeds on the brightest possible locations that created
regions of similar total intensity. The region growing algorithm described above was executed again on this refined set
of seeds. Finally, regions that were still too large were just
split into an appropriate number of equal volumes without
regard for the pixel intensities. Our Segmentation Volume
Renderer [18] was used extensively during the development
of the segmentation algorithm.
Finally, the segmentation algorithm includes additional features that make it more robust to images with specific artifacts that would have otherwise resulted in failure to generate
a PointCloud. One example is the occasional presence of
impurities on the embryo surface that caused a bright artifactual fluorescence signal across all channels. These regions
were detected in the image and ignored during subsequent
analysis. A second example is the occasional presence of a
yolk nucleus proximal to the blastoderm nuclei. Such a yolk
nucleus results in a shell mask with a local basal bulge. This
condition was simply detected and removed. For full details
Genome Biology 2006, 7:R123
/>
Genome Biology 2006,
Volume 7, Issue 12, Article R123
Luengo Hendriks et al. R123.17
Cylindrical and orthographic projection of the
blastoderm
60
40
20
0
0
50
100
150
Depth (µm)
Measuring expression levels associated with each
nucleus
Nuclear packing densities were calculated as the number of
nuclei per unit surface area. The surface of the embryo was
first identified from the PointCloud using the Eigencrust
algorithm [56]. Briefly, a region was defined by sweeping a 15
μm arc on the embryo surface about each nucleus. The density was then estimated as the number of nuclei inside this
region divided by its area. Average density maps were computed by resampling the per-nucleus density estimates for a
given embryo onto a regular grid in cylindrical coordinates,
and averaging these resampled projections over the embryos
in a temporal cohort. Only the top and bottom parts of the zstacks were used for density analyses, except for method evaluation comparison in Figure 4c, where the laterals of the zstacks were used.
interactions
Computing apical/basal shift of nuclei
Apical/basal shift was measured by fitting, using least
squares, a quadratic surface to the 200 nearest neighbors of a
nucleus, and determining the distance of the nucleus to this
surface. Average shift maps were computed using resampled
cylindrical projections, in the same manner as the average
density maps. To eliminate the possibility that bleed-through
from mRNA stain channels might influence the segmentation
Genome Biology 2006, 7:R123
information
For subsequent analysis, expression values from the PointClouds were corrected for attenuation by dividing these values with the average Sytox intensity within the corresponding
nucleus. This approach assumes that the average Sytox
intensity is constant from nucleus to nucleus, and it is representative of the attenuation of the other channels.
Computing packing density of nuclei
refereed research
To capture the labeled mRNA expression levels, we first had
to estimate the cellular extent surrounding each nucleus. This
was achieved by growing the nuclear segmentation mask, in
the apical and basal directions, into the cytoplasm by tessellation. The distances grown were established by examining
cytoplasmic auto-fluorescence in several sample images. This
was then used in combination with the nuclear mask to divide
each cell into three regions: apical, nuclear and basal (Figure
11). The expression level was estimated in each of these
regions and in the whole cell by taking the average values
within them for both the Cy3 and Coumarin channels. These
expression values, together with the average value of the
Sytox channel within each nucleus, the center of mass of the
nuclei, the volumes of the various cellular regions, and the
neighborhood relationshps between cells were written to a
PointCloud file.
deposited research
on the segmentation algorithm refer to the source code, available online [10].
reports
Figure 12
Sytox attenuation with depth
Sytox attenuation with depth. Relative intensity of the Sytox stain within
each nucleus, plotted against the depth of the nucleus along the optical
axis. Sytox levels were normalized by scaling the 99th percentile of
intensity to 100.
reviews
Relative intensity
80
We use two methods to display data on the embryo surface:
the cylindrical projection and the orthographic projection.
The cylindrical projection provides an 'unrolled' view of the
full surface, which we use to display data mapped onto the
blastoderm surface. The orthographic projection shows only
half the surface, but produces less distortion and, therefore, is
useful to show the location of borders of the a/p patterning
system. The center of mass of the embryo was computed from
the three-dimensional nuclear coordinates in the PointCloud
as the mean coordinate of all points. The principal a/p axis of
the embryo was estimated as the eigenvector associated with
the smallest eigenvalue of the inertia tensor [47]. The location
of the dorsal-most point was determined manually for each
PointCloud from the ftz or eve expression pattern. The
embryo was then translated so that the center of mass was at
the origin, and rotated so that the estimated a/p axis lay on
the x-axis and the d/v axis lay on the z-axis, anterior to the left
(negative x), dorsal up (positive z). The cylindrical projection
then used the x-coordinate on the horizontal and ϕ on the vertical, where y = r sin(ϕ) and z = r cos(ϕ). This resulted in a rectangular plot with the embryo's anterior to the left, the dorsal
midline split to the top and bottom, and the ventral midline in
the middle. Orthographic projections simply used the x-coordinate on the horizontal and the z-coordinate on the vertical,
discarding y. As a further aid in managing the complexity of
this three-dimensional dataset, we developed a flexible visual
analysis tool, PointCloudXplore [19], which can be used to
interactively visualize and analyze the embryo PointClouds in
three dimensions.
comment
100
R123.18 Genome Biology 2006,
Volume 7, Issue 12, Article R123
Luengo Hendriks et al.
/>
Staining & Mounting
Embryo Preparation
GenotypePhenotype
Genotype
EmbryoPreparation
HybridizationStain
Stain
Fluor
id
number
genotypeId
phenotypeId
timeStamp
id
name
notes
speciesId
ownerId
lastEditId
submissionDate
timeStamp
id
name
collectionConditions
maturationContitions
collectionStartDate
prehybridizationStartDate
notes
prehybridizationProtocolId
fixationProtocolId
genotypeId
ownerId
lastEditId
submissionDate
timeStamp
id
orderNumber
stainId
hybridizationId
timeStamp
id
detection
probeId
fluorId
secondaryAntibodyId
ownerId
lastEditId
submissionDate
timeStamp
id
name
color
wavelength
ownerId
lastEditId
submissionDate
timeStamp
Phenotype
id
name
notes
ownerId
lastEditId
submissionDate
timeStamp
Protocol
id
type
fileName
displayFileName
HybridizationPreparation
id
preparationId
hybridizationId
timeStamp
Hybridization
id
name
quality
startDate
notes
genotypeId
hybridizationProtocolId
ownerId
lastEditId
submissionDate
timeStamp
SecondaryAntibody
Probe
id
name
source
notes
ownerId
lastEditId
submissionDate
timeStamp
id
name
type
source
preparationDate
orientation
hapten
polymerase
species
notes
protocolId
probeConstructId
moleculeId
ownerId
lastEditId
submissionDate
timeStamp
Slide
Molecule
Imaging
Stage
id
name
notes
ownerId
lastEditId
submissionDate
timeStamp
PCFailure
id
imageStackId
pcVersion
notes
ownerId
lastEditId
submissionDate
timeStamp
Embryo
id
userLocation
xCoordinate
yCoordinate
percentStage
dvRotation
notes
slideId
stageId
phenotypeId
ownerId
lastEditId
submissionDate
timeStamp
PointClouds
NCStain
id
nuclearCloudId
stainId
patternFile
ownerId
lastEditId
submissionDate
timeStamp
ImageStack
id
imageStackReference
imageFile
resolution
rotation
imagedby
imagingDate
lsmFileName
notes
flag
embryoId
ownerId
lastEditId
submissionDate
timeStamp
NuclearCloud
id
name
datafileName
densityMap
orientationMap
quality
version
notes
imageStackId
ownerId
lastEditId
submissionDate
timeStamp
id
barCode
mountingDate
notes
hybridizationId
ownerId
lastEditId
submissionDate
timeStamp
id
type
name
synonym
notes
ownerId
lastEditId
submissionDate
timeStamp
ProbeConstruct
id
type
probeId
rowId
Vector
Construct
Universal_Clone
id
name
sequence
source
notes
fileName
ownerId
lastEditId
submissionDate
timeStamp
id
name
source
sequence
description
refDate
mwFusionProtein
affinityTag
plasmidStorageLocation
notes
universalCloneId
vectorId
moleculeId
ownerId
lastEditId
submissionDate
timeStamp
ID
Name
Description
Flybase_Transcript
Primer_5
Primer_3
Insert_Source
Insert_Sequence
Complete_Sequnce
Notes
Vector_ID
Molecule_ID
User_ID
Edit_ID
Submission_Date
Time_Stamp
Figure 13
BID schema
BID schema. Each table corresponds to a step in the experimental process. The tables have been grouped into four blocks corresponding to a coarser
subdivision of the pipeline.
Genome Biology 2006, 7:R123
/>
Genome Biology 2006,
Measuring expression boundary location
A BID was built to manage and store of all the data and metadata produced by this project [10]. BID tracks the entire
experimental process from the embryo preparation (genotype, phenotype, collection conditions, maturation conditions, and so on) and hybridization (nucleic acid probes,
secondary antibodies, fluorophores, and so on, including
detailed information such as the vector DNA sequence), all
the way to the PointCloud data files (with associated metadata such as a quality score, thumbnails and links to the raw
image data). For each step in the experimental process, a corresponding table or set of tables describes the fine-grained
details of that process (Figure 13).
Sophisticated search functions and overviews of the experiments are provided to aid project management. For example,
it is possible to quickly find the slide and embryo location for
a given PointCloud, should it need to be re-imaged or restaged. This is accomplished by identifying each slide with a
unique bar code and each embryo that was imaged by its coordinates on the slide. For a full schema see Figure 13.
The raw three-dimensional images are stored in a dedicated
repository, and indexed with BID. Because of their large size
(approximately 400 Mb each), the raw images require a
different backup solution as well as a high-speed network
between the storage and the computers used for processing
them. The independent repository makes this possible.
deposited research
Acknowledgements
refereed research
This work is part of a broader collaboration by the BDTNP. We are grateful for the frequent advice, support, criticisms, and enthusiasm of its members. We thank Mark Stapleton, Brandi Grondona, and Ethan Bier for DNA
constructs, and John Reinitz for the kni antibody. Hanchuan Peng assisted
with image acquisition. This manuscript was improved by comments from
Michael Levine and several very helpful reviewers. SVE Keränen was funded
in part from by fellowships from the Academy of Finland (#75044) and
Helsinginsanomain 100-vuotissäätiö. Work conducted by the BDTNP is
funded by a grant from NIGMS and NHGRI, GM704403, at Lawrence Berkeley National Laboratory under Department of Energy contract DEAC02-05CH11231.
References
1.
2.
3.
The intensity of pair rule gene stripes was determined using
the 95th percentile of the expression level values (as a more
robust substitute for the maximum), within a region deter-
4.
Genome Biology 2006, 7:R123
information
Measuring stripe intensity
Minden JS, Agard DA, Sedat JW, Alberts BM: Direct cell lineage analysis in Drosophila melanogaster by time-lapse, three-dimensional optical microscopy of living embryos. J Cell Biol 1989, 109:505-516.
Burne RM, Bard JB, Dubreuil C, Guest E, Hill W, Kaufman M, Stark M,
Davidson D, Baldock RA: A three-dimensional model of the
mouse at embryonic day 9. Dev Biol 1999, 216:457-468.
Lieb JD, de Solórzano CO, Rodriguez EG, Jones A, Angelo M, Lockett
S, Meyer BJ: The Caenorhabditis elegans dosage compensation
machinery is recruited to X chromosome DNA attached to
an autosome. Genetics 2000, 156:1603-1621.
Kumar S, Jayaraman K, Panchanathan S, Gurunathan R, Marti-Subirana
A, Newfield SJ: BEST: A novel computational approach for
comparing gene expression patterns from early stages of
Drosophila melanogaster development.
Genetics 2002,
162:2037-2047.
interactions
For Figure 10 where the boundaries were computed using a
threshold, we thresholded the one-dimensional projections of
the 16 strips as defined above, then determined the location of
the boundary closest to the expected boundary location, as
given by the inflection points. Due to variation between individuals, some embryos did not posses all points used in this
graph. The measurements at each point were averaged for all
embryos that possessed a threshold at that point. Where more
than 50% of embryos lacked a point, that point was not
shown.
Data management and storage
reports
To compute the location of the stripe boundaries, the embryo
was first divided into 16 equal strips running along the a/p
axis. Nuclei that fell within each strip were projected onto the
a/p axis and their expression values were sampled at 400 regular intervals, using normalized convolution [58] with a
Gaussian of σ = 1 interval (this yields 16 one-dimensional
graphs). Accurate boundaries of expression stripes were then
determined by finding the center of mass of peaks in the gradient of expression along the strip. The center of mass was
used because it is more robust against noise than the expression gradient maximum, which marks the expression inflection point, a feature commonly used to mark edges.
mined by the 1/16th strip and the stripe borders as determined above.
reviews
To determine an initial estimate of the boundary location, two
algorithms were created to find the approximate location of
the pair rule and gap gene stripe boundaries from PointCloud
data. The first algorithm was fully automatic, once the
number of stripes was specified. It used a local threshold to
detect regions that contain the highest expression values. The
edges of these regions provided approximate locations for
stripe boundaries. A second semi-automatic algorithm was
developed for immature patterns (such as the early ftz pattern), and those that did not segment properly because of
imaging artifacts. In these cases, a user clicked on a nucleus
close to the stripe border of interest. The shortest geodesic
path [57] that circumnavigated the embryo through this point
was determined. This was done using a gray-weighted distance transform [51,53,54] of the gradient of the stripe
expression pattern, taken along the a/p direction, and
resulted in a path that followed the stripe edge. When this
failed, the stripe boundary was determined manually by placing eight points on each edge.
Luengo Hendriks et al. R123.19
comment
and localization of nuclei in the Sytox channel, we also examined average shift maps produced from subsets of embryos
excluding those embryos stained for particular genes (data
not shown). All of these maps showed qualitatively similar
patterns of nuclear displacement.
Volume 7, Issue 12, Article R123
R123.20 Genome Biology 2006,
5.
6.
7.
8.
9.
10.
11.
12.
13.
14.
15.
16.
17.
18.
19.
20.
21.
22.
23.
24.
25.
26.
Volume 7, Issue 12, Article R123
Luengo Hendriks et al.
Megason SG, Fraser SE: Digitizing life at the level of the cell:
high-performance laser-scanning microscopy and image
analysis for in toto imaging of development. Mechanisms Dev
2003, 120:1407-1420.
Jaeger J, Surkova S, Blagov M, Janssens H, Kosman D, Kozlov KN,
Manu , Myasnikova E, Vanario-Alonso CE, Samsonova M, et al.:
Dynamic control of positional information in the early Drosophila embryo. Nature 2004, 430:368-371.
Huisken J, Swoger J, Del Bene F, Wittbrodt J, Stelzer EH: Optical
sectioning deep inside live embryos by selective plane illumination microscopy. Science 2004, 305:1007-1009.
Carson JP, Ju T, Lu HC, Thaller C, Xu M, Pallas SL, Crair MC, Warren
J, Chiu W, Eichele G: A digital atlas to characterize the mouse
brain transcriptome. PLoS Computat Biol 2005, 1:e41.
Janssens H, Kosman D, Vanario-Alonso CE, Jaeger J, Samsonova M,
Reinitz J: A high-throughput method for quantifying gene
expressiondata from early Drosophila embryos. Dev Genes Evol
2005, 215:374-381.
Berkeley Drosophila Transcription NetworkProject [http://
bdtnp.lbl.gov/]
Knowles DW, Keränen SVE, Biggin M, Sudar S: Mapping organism
expression levels at cellular resolution in developing Drosophila. In Three-dimensional and Multidimensional Microscopy: Image
Acquisition and Processing IX Volume 4621. Edited by: Conchello JA,
Cogswell CJ, Wilson T. Bellingham: Society of Photo-Optical Instrumentation Engineers; 2002:57-64.
Berman BP, Pfeiffer BD, Laverty TR, Salzberg SL, Rubin GM, Eisen MB,
Celniker SE: Computational identification of developmental
enhancers: conservation and function of transcription factor
binding-site clusters in Drosophila melanogaster and Drosophila pseodoobscura. Genome Biol 2004, 5:R61.
Jäckle H, Hoch M, Pankratz MJ, Gerwin N, Sauer F, Brönner G: Transcriptional control by Drosophila gap genes. J Cell Sci Suppl
1992, 16():39-51.
Lawrence P: The Making of a Fly Oxford: Blackwell Scientific
Publications; 1992.
Gerhart J, Kirschner M: Cells, Embryos, and Evolution: Toward a Cellular
and Developmental Understanding of Phenotypic Variation and
Evolutionary Adaptability Malden: Blackwell Science; 1997.
Stathopoulos A, Levine M: Genomic regulatory networks and
animal development. Dev Cell 2005, 9:449-462.
Campos-Ortega JA, Hartenstein V: The Embryonic Development of
Drosophila melanogaster 2nd edition. Berlin: Springer; 1997.
Weber GH, Luengo Hendriks CL, Keränen SVE, Dillard SE, Ju DY,
Sudar D, Hamann B: Visualization for validation and
improvement of three-dimensional segmentation algorithms. In Data Visualization 2005: Proceedings of the Eurographics/
IEEE-VGTC Symposium on Visualization (August 29-September 2, Dublin,
Ireland) Edited by: Brodlie K, Duke D, Joy KI. Aire-la-Ville: Eurographics Association; 2005:93-100.
Rübel O, Weber GH, Keränen SVE, Fowlkes CC, Luengo Hendriks
CL, Simirenko L, Shah NY, Eisen MB, Biggin MD, Hagen H, et al.:
PointCloudXplore: Visual analysis of 3D gene expression
data using physical views and parallel coordinates. In Data Visualization 2006: Proceedings of the Eurographics/IEEE-VGTC Symposium
on Visualization. (4-8 September, Vienna, Austria) Edited by: Santos BC,
Ertl T, Joy KI. Aire-la-Ville: Eurographics Association; 2006:203-210.
Keränen SV, Fowlkes CC, Luengo Hendriks CL, Sudar D, Knowles
DW, Malik J, Biggin MD: 3D morphology and gene expression in
the Drosophila blastoderm at cellular resolution II: dynamics.
Genome Biol 2006, 7:R124.
Denk W, Strickler JH, Webb WW: Two-photon laser scanning
fluorescence microscopy. Science 1990, 248:73-76.
Helmchen F, Denk W: Deep tissue two-photon microscopy. Nat
Methods 2005, 2:932-940.
Callaini G: Microtubule distribution reveals superficial metameric patterns in the early Drosophila embryo. Development
1989, 107:35-41.
Oda H, Tsukita S: Real-time imaging of cell-cell adherens junctions reveals that Drosophila mesoderm invagination begins
with two phases of apical constriction of cells. J Cell Sci 2001,
114:493-501.
Blankenship JT, Wieschaus E: Two new roles for the Drosophila
AP patterning system in early morphogenesis. Development
2001, 128:5129-5138.
Vincent A, Blankenship JT, Wieschaus E: Integration of the head
and trunk segmentation systems controls cephalic furrow
formation in Drosophila. Development 1997, 124:3747-3754.
27.
28.
29.
30.
31.
32.
33.
34.
35.
36.
37.
38.
39.
40.
41.
42.
43.
44.
45.
46.
47.
48.
49.
50.
51.
52.
53.
54.
/>
Sweeton D, Parks S, Costa M, Wieschaus E: Gastrulation in Drosophila: the formation of the ventral furrow and posterior
midgut invaginations. Development 1991, 112:775-789.
Houchmandzadeh B, Wieschaus E, Leibler S: Establishment of
developmental precision and proportions in the early Drosophila embryo. Nature 2002, 415:798-802.
Carroll SB, Winslow GM, Twombly VJ, Scott MP: Genes that control dorsoventral polarity affect gene expression along the
anteroposterior axis of the Drosophila embryo. Development
1987, 99:327-332.
Frasch M, Levine M: Complementary patterns of even-skipped
and fushi tarazu expression involve their differential regulation by a common set of segmentation genes in Drosophila.
Genes Dev 1987, 1:981-995.
Akam M: The molecular basis for metameric pattern in the
Drosophila embryo. Development 1987, 101:1-22.
Klingler M, Gergen JP: Regulation of runt transcription by Drosophila segmentation genes. Mechanisms Dev 1993, 43:3-19.
Manoukian AS, Krause HM: Control of segmental asymmetry in
Drosophila embryos. Development 1993, 118:785-796.
Raj L, Vivekanand P, Das TK, Badam E, Fernandes M, Finley RL Jr,
Brent R, Appel LF, Hanes SD, Weir M: Targeted localized
degradation of Paired protein in Drosophila development.
Curr Biol 2000, 10:1265-1272.
Sánchez L, Thieffry D: Segmenting the fly embryo: a logical
analysis of the pair-rule cross-regulatory module. J Theor Biol
2003, 224:517-537.
Driever W, Nüsslein-Volhard C: The bicoid protein determines
position in the Drosophila embryo in a concentrationdependent manner. Cell 1988, 54:95-104.
Manoukian AS, Krause HM: Concentration-dependent activities
of the Even-skipped protein in Drosophila embryos. Genes Dev
1992, 6:1740-1751.
Lebrecht D, Foehr M, Smith E, Lopes FJ, Vanario-Alonso CE, Reinitz
J, Burz DS, Hanes SD: Bicoid cooperative DNA binding is critical for embryonic patterning in Drosophila. Proc Natl Acad Sci
USA 2005, 102:13176-13181.
Gutjahr T, Frei E, Noll M: Complex regulation of early paired
expression: initial activation by gap genes and pattern modulation by pair-rule genes. Development 1993, 117:609-623.
Yu Y, Pick L: Non-periodic cues generate seven ftz stripes in
the Drosophila embryo. Mechanisms Dev 1995, 50:163-175.
Myasnikova E, Samsonova A, Kozlov K, Samsonova M, Reinitz J: Registration of the expression patterns of Drosophila segmentation genes by two independent methods. Bioinformatics 2001,
17:3-12.
Kozlov K, Myasnikova E, Pisarev A, Samsonova M, Reinitz J: A
method for two-dimensional registration and construction
of thetwo-dimensional atlas of gene expression patterns in
situ. In Silico Biol 2002, 2:125-141.
Hughes SC, Krause HM: Double labeling with fluorescence in
situ hybridization in Drosophila whole-mount embryos. Biotechniques 1998, 24:530-532.
Lecuit T, Samanta R, Wieschaus E: slam encodes adevelopmental
regulator of polarized membrane growth during cleavage of
the Drosophila embryo. Dev Cell 2002, 2:425-436.
Luengo Hendriks CL, van Vliet LJ, Rieger B, van Ginkel M: DIPimage: a
Scientific Image Processing Toolbox for MATLAB Delft: Quantitative Imaging Group, Delft University of Technology.
DIPimage 1999 [ />Jähne B: Digital Image Processing 5th edition. Berlin: Springer; 2002.
van Ginkel M: Image Analysis Using Orientation Space Based on Steerable
Filters Delft, The Netherlands: Delft University of Technology; 2002.
Borgefors G, Nyström I, Sanniti di Baja G: Computing skeletons in
three dimensions. Pattern Recognition 1999, 32:1225-1236.
Jonker PP: Skeletons in n dimensions using shape primitives.
Pattern Recognition Lett 2002, 23:677-686.
Soille P: Morphological Image Analysis: Principles and Applications 2nd edition. Berlin: Springer; 2003.
Digabel H, Lantuéjoul C: Iterative algorithms. In Quantitative Analysis of Microstructures in Materials Sciences, Biology and Medicine Edited
by: Chermant JL. Stuttgart: Dr Rieder-Verlag; 1978:85-99.
Piper J, Granum E: Computing distance transformations in
convex and non-convex domains. Pattern Recognition 1987,
20:599-615.
Verbeek PW, Verwer BJH: Shading from shape, the eikonal
equation solved by grey-weighted distance transform. Pattern
Recognition Lett 1990, 11:681-690.
Genome Biology 2006, 7:R123
/>
55.
56.
58.
Duda RO, Hart PE, Stork DG: Pattern Classification 2nd edition. Hoboken: John Wiley & Sons; 2001.
Kolluri R, Shewchuk JR, O'Brien JF: Spectral surface reconstruction from noisy point clouds. In Symposium on Geometry Processing:
2004 New York: ACM Press; 2004:11-21.
Dijkstra EW: A note on two problems in connexion with
graphs. Numerische Mathematik 1959, 1:269-271.
Knutsson H, Westin CF: Normalized convolution - a technique
for filtering incomplete and uncertain data. In SCIA '93: Proceedings of the 8th Scandinavian Conference on Image Analysis. (May 2528, Tromsø, Norway) Volume 2. Edited by: Høgda KA, Braathen B, Heia
K. Oslo: Norwegian Society for Image Processing and Pattern
Recognition; 1993:997-1006.
Volume 7, Issue 12, Article R123
Luengo Hendriks et al. R123.21
comment
57.
Genome Biology 2006,
reviews
reports
deposited research
refereed research
interactions
information
Genome Biology 2006, 7:R123