Báo cáo y học: "Sequential gene profiling of basal cell carcinomas treated with imiquimod in a placebo-controlled study defines the requirements for tissue rejection" pps
Bạn đang xem bản rút gọn của tài liệu. Xem và tải ngay bản đầy đủ của tài liệu tại đây (8.41 MB, 15 trang )
Open Access
Volume
et al.
Panelli
2007 8, Issue 1, Article R8
Research
Addresses: *Immunogenetics Section, Department of Transfusion Medicine, Clinical Center National Institutes of Health, Bethesda, MD
20892, USA. †The Clinical Skin Center of Northern Virginia, Fairfax, VA 22033, USA. ‡3M Pharmaceuticals, St Paul, MN 55144-1000, USA.
§Department of Dermatology, National Naval Medical Center, Bethesda, MD 20889, USA. ¶Laboratory of Pathology, National Cancer Institute,
Bethesda, MD 20892, USA. ¥Biometric Research Branch, Division of Cancer Treatment and Diagnosis, National Cancer Institute, Bethesda,
MD 20892, USA. #Universita' degli Studi di Milano, Department of Human Morphology, via Mangiagalli, 20133 Milan, Italy.
Published: 15 January 2007
Received: 15 August 2006
Revised: 6 October 2006
Accepted: 12 January 2007
Genome Biology 2007, 8:R8 (doi:10.1186/gb-2007-8-1-r8)
reports
Correspondence: Francesco M Marincola. Email:
reviews
Monica C Panelli*, Mitchell E Stashower†, Herbert B Slade‡, Kina Smith*,
Christopher NorwoodĐ, Andrea Abatiả, Patricia Fetschả, Armando Filieả,
Shelley-Ann Walters, Calvin Astry, Eleonora Aricó*, Yingdong Zhao¥,
Silvia Selleri*#, Ena Wang* and Francesco M Marincola*
comment
Sequential gene profiling of basal cell carcinomas treated with
imiquimod in a placebo-controlled study defines the requirements
for tissue rejection
The electronic version of this article is the complete one and can be
found online at />deposited research
© 2007 Panelli et al.; licensee BioMed Central Ltd.
This is an open access article distributed under the terms of the Creative Commons Attribution License ( which
permits unrestricted use, distribution, and reproduction in any medium, provided the original work is properly cited.
involve the response of cellular
An analysis of basal cell carcinoma and adaptive immune-effector imiquimod revealed
Imiquimod activationprofiling innatesubjected to local application of mechanisms.
Abstract
Background: Imiquimod is a Toll-like receptor-7 agonist capable of inducing complete clearance of basal cell
carcinoma (BCC) and other cutaneous malignancies. We hypothesized that the characterization of the early
transcriptional events induced by imiquimod may provide insights about immunological events preceding acute
tissue and/or tumor rejection.
refereed research
Results: We report a paired analysis of adjacent punch biopsies obtained pre- and post-treatment from 36
patients with BCC subjected to local application of imiquimod (n = 22) or vehicle cream (n = 14) in a blinded,
randomized protocol. Four treatments were assessed (q12 applications for 2 or 4 days, or q24 hours for 4 or 8
days). RNA was amplified and hybridized to 17.5 K cDNA arrays. All treatment schedules similarly affected the
transcriptional profile of BCC; however, the q12 × 4 days regimen, associated with highest effectiveness, induced
the most changes, with 637 genes unequivocally stimulated by imiquimod. A minority of transcripts (98 genes)
confirmed previous reports of interferon-α involvement. The remaining 539 genes portrayed additional
immunological functions predominantly involving the activation of cellular innate and adaptive immune-effector
mechanisms. Importantly, these effector signatures recapitulate previous observations of tissue rejection in the
context of cancer immunotherapy, acute allograft rejection and autoimmunity.
interactions
Conclusion: This study, based on a powerful and reproducible model of cancer eradication by innate immune
mechanisms, provides the first insights in humans into the early transcriptional events associated with immune
rejection. This model is likely representative of constant immunological pathways through which innate and
adaptive immune responses combine to induce tissue destruction.
information
Genome Biology 2007, 8:R8
R8.2 Genome Biology 2007,
Volume 8, Issue 1, Article R8
Panelli et al.
Background
In 2004, Aldara™ (imiquimod 5% cream, 3M Pharmaceutical, St Paul, MN, USA) labeling was extended by the Food and
Drug Administration to include treatment of superficial basal
cell carcinoma (BCC) based upon randomized controlled trials demonstrating complete histological clearance in 78% to
87% of superficial BCC treated topically 5 days per week for 6
weeks [1,2]. Pilot-scale and investigator initiated trials had
shown 90% to 100% clearance with q12 hours (twice per day)
dosing [3].
Imiquimod belongs to a family of synthetic small nucleotidelike molecules with potent immuno-modulatory activity
mediated through Toll-like receptor (TLR)-7 (and 8) signaling. When applied topically, these compounds display
immune-mediated anti-tumoral activity without damaging
normal tissues [1,3-7] Imiquimod targets predominantly
TLR-7 expressing plasmacytoid dendritic cells (pDCs) with
secondary recruitment and activation of other DC and macrophage subtypes and induction of T helper1 responses within
three to five days of treatment [4]. Stimulation of pDCs
through TLR-7/myeloid differentiation response gene 88
(My-D88)/IRF-7 signaling induces expression of interferon
(IFN)-α, which appears to act upon natural killer (NK) cells
and conventional dendritic cells (DCs) to stimulate IFN-γ,
tumor necrosis factor (TNF)-α, monocyte chemoattractant
proteins (MCPs) and other cytokines [5,8,9] This immunological cascade leads within two weeks to apoptotic death of
cancer cells and their substitution by a mononuclear cell infiltrate [3-5,8]
Although imiquimod function seems particularly associated
with IFN-α-stimulated genes (ISGs) [10], it remains unclear
whether this pathway is solely responsible for all the downstream effects ultimately resulting in tumor clearance.
Indeed, a comprehensive and conclusive characterization of
the events leading to tumor rejection based on a prospectively
controlled study has never been reported. We previously
characterized ISGs in vitro [11] and in vivo (Belardelli F and
Arico' E, manuscript in preparation), compiling a road map
for the interpretation of transcriptional surveys of biological
conditions affecting the tumor microenvironment (Additional data file 1).
Here, we report a paired analysis of adjacent punch biopsies
obtained pre- and post-treatment from 36 patients with BCC
subjected to local application of imiquimod or a control
cream in a blinded, randomized protocol.
Results
A total of 65 subjects were screened, but 27 were ineligible
due to their pre-enrollment biopsy excluding BCC and 2 were
ineligible for other reasons. A total of 36 subjects were eligible
for the study and started treatment with either imiquimod (n
= 22) or vehicle cream (n = 14) (Table 1). After unblinding,
/>
treatment groups were color-coded to facilitate the discussion. Out of the subjects, 61% had nodular BCC, 17% superficial BCC, and 22% unspecified BCC. Of note is that all 4
subjects randomized to the imiquimod q12 hours × 4 days
group had nodular BCC. Post-treatment biopsies were taken
<12 hours after last dose for 17% of subjects, >36 hours after
the last dose date for another 17%, and between 18 and 30
hours after last dose for 33%. This variability was uncontrollable and due to patient compliance. The locations of the
tumors were: 41% on the face; 25% on the extremities; 22% on
the trunk; and 11% on either the neck or scalp. Furthermore,
patient (P) 23 and P28 did not complete treatment, missing
two placebo and one imiquimod dose, respectively. The
imbalance in the distribution of the elapsed time between last
treatment dose and post-treatment biopsy did not significantly affect the results except, possibly, for the q24 × 8 (pink)
cohort. Interestingly, at this early time point, already 9 of 22
imiquimod-treated BCCs were found to be clear of tumor
cells, particularly among patients treated with the most
intense schedule.
Quantitative PCR
At this early stage of treatment, no changes were observed in
TNF-α and MCP-1 expression, in contrast with others' findings at later stages [5,8,9] IFN-γ 2-ΔΔCT from baseline to end of
treatment (EOT) was significantly increased compared to
dose-matched controls at all but the earliest time point (q12 ×
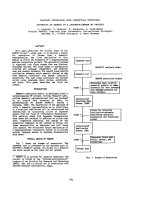
2, orange group; Figure 1a). IFN-α followed a similar pattern
but significance was observed only with the most intense regimen (q12 × 4, blue group; Figure 1b).
Identification of treatment (imiquimod)-specific genes
Unsupervised analysis applying various filtering parameters
failed to segregate samples according to treatment, suggesting that imiquimod affects an insufficient number of genes to
alter the global transcript of BCC. A paired t-test (cut-off p2
value < 0.05) was applied to identify genes differentially
expressed by identical lesions before and after treatment
within each cohort. For instance, the q12 × 4 (blue) cohort differentially expressed 1,578 genes at EOT compared to paired
pre-treatment samples. Reclustering of these genes demonstrated that most were similarly expressed by post-treatment
samples treated with placebo, reflecting changes due to vehicle alone or the tissue repair induced by the adjacent pretreatment biopsy. A node, however, contained 263 genes
exclusively upregulated in all EOT imiquimod-treated samples (Figure 1c (part b), vertical blue bar). This cohort-based
training/prediction analysis was repeated with the other
three treatment regimens, providing independently similar
results. In all cases, nodes were identified inclusive of genes
uniquely expressed in EOT imiquimod-treated samples (Figure 1c (parts a and d); Additional data file 4). The number of
imiquimod-induced genes varied among cohorts, however,
with the largest amount in the q12 × 4 (blue) cohort, in line
with the higher clinical effectiveness of this intense dosing
regimen [3]. There was extensive overlap among the genes
Genome Biology 2007, 8:R8
/>
Genome Biology 2007,
Volume 8, Issue 1, Article R8
Panelli et al. R8.3
Table 1
Composition of study cohorts
Cohort
Doses received
EOT → B× time lapse (hours)
Histology
ΔCD8
ΔCD56
Tumor at EOT
P5
Imiq q12 × 2 days
4
13
Nodular
0
-1
+
P6
Imiq q12 × 2 days
4
14
Undetermined
0
0
comment
Patient ID
+
Imiq q12 × 2 days
4
36
Undetermined
NE
NE
-
P18
Imiq q12 × 2 days
4
33
Nodular
+1
0
+
P30
Imiq q12 × 2 days
4
16
Nodular
0
0
-
P38
Imiq q12 × 2 days
4
17
Nodular
0
0
+
P231
Imiq q12 × 2 days
4
22
Undetermined
+1
0
+
P10
Vehic q12 × 2 days
4
12
Nodular
0
0
+
P23
Vehic q12 × 2 days
2
15
Nodular
+2
0
+
P26
Vehic q12 × 2 days
4
45
Nodular
0
0
reviews
P17
+
Mean ± SD = 22 ± 11.5
Imiq q12 × 4 days
8
8
Nodular
0
0
+
P21
Imiq q12 × 4 days
8
41
Nodular
0
+1
+
P22
Imiq q12 × 4 days
8
11
Nodular
+1
0
-
P40
Imiq q12 × 4 days
8
17
Nodular
+1
+1
-
Imiq q12 × 4 days
8
3
Undetermined
+3
0
-
P129
Imiq q12 × 4 days
8
19
Nodular
+1
0
+
P135
Imiq q12 × 4 days
8
21
Superficial
+1
+1
-
P41
Vehic q12 × 4 days
8
28
Nodular
+1
0
+
P134
Vehic q12 × 4 days
8
19
Nodular
+2
0
+
P8
Vehic q12 × 4 days
8
20
Nodular
0
0
+
P20
Vehic q12 × 4 days
8
16
Superficial
0
0
+
+
Mean ± SD = 18 ± 10.2
Imiq q24 × 4 days
4
26
Nodular
0
+1
P28
Imiq q24 × 4 days
3
20
Nodular
NE
NE
+
P112
Imiq q24 × 4 days
4
44
Nodular
0
0
+
P214
Imiq q24 × 4 days
4
51
Nodular
+2
+1
-
P4
Vehic q24 × 4 days
4
16
Superficial
NE
-1
-
P13
Vehic q24 × 4 days
4
30
Nodular
0
0
+
P36
Vehic q24 × 4 days
4
25
Superficial
0
0
+
+
refereed research
P11
deposited research
P42
reports
P1
Mean ± SD = 30 ± 12.8
Imiq q24 × 8 days
8
32
Undetermined
0
+1
P132
Imiq q24 × 8 days
8
159
Undetermined
0
+2
-
P24
Imiq q24 × 8 days
8
48
Superficial
+1
0
-
P3
Imiq q24 × 8 days
8
12
Undetermined
-1
0
+
P2
Vehic q24 × 8 days
8
6
Undetermined
0
-1
+
P15
Vehic q24 × 8 days
8
21
Nodular
0
0
+
NE
NE
+
0
0
interactions
P233
+
P27
Vehic q24 × 8 days
8
26
Nodular
P137
Vehic q24 × 8 days
8
11
Superficial
Punch biopsies are labeled according to patient number (P1 to P42) and timing of excision: PB0, pre-enrollment; PB1 and PB2, pre-treatment; PB3
and PB4, post-treatment. Biopsies from patients replacing drop-outs were labeled one digit to the serial number (that is, P101 to P142 or P201 to
P242. PB1 and PB3 were collected for total RNA isolation; PB2 and PB4 for IHC. Undetermined refers to a BCC histology in-between superficial and
nodular. ΔCD8 and ΔCD56 scores differences in infiltrate between EOT and pre-treatment samples (see Materials and methods). Tumor at EOT:
identifiable (+) or not identifiable (-) tumor cells in the hematoxylin eosin stained EOT biopsy. Imiq, imiquimod; NE, not evaluated; Vehic, vehicle.
Genome Biology 2007, 8:R8
information
Mean ± SD = 39 ± 50.3
R8.4 Genome Biology 2007,
Volume 8, Issue 1, Article R8
Panelli et al.
identified by the various comparisons (Figure 1c (part e)); 41
(63%) of 65, 40 (71%) of 56 and 16 (70%) of 23 genes differentially expressed in the orange, green and pink groups,
respectively, were included among those identified as differentially expressed in the blue group. Reclustering of experimental samples based on imiquimod-specific signatures from
each cohort suggested their independent predictive value in
sorting imiquimod-treated BCC from pre-treatment and control samples as exemplified by the blue cohort signature,
which clumped together not only the samples from the blue
group, which served as a basis to select the genes used for
clustering, but also 9 of the other 15 imiquimod-treated samples compared with only 3 of 14 vehicle-treated samples
(Fisher p2 value = 0.04). Four of the five samples that did not
cluster together with the blue group samples belonged to the
orange group (Figure 1d).
Thus, different dosing schedules differed quantitatively but
not qualitatively, with the same genes being induced among
them. The striking difference in number of genes induced
between the q12 × 2 (orange) and the q12 × 4 (blue) cohorts
strongly emphasizes the importance of the number of doses;
however, the q24 × 8 (pink) group, which received the same
number of imiquimod applications as the blue group in twice
the amount of time, displayed similar but dampened
transcriptional changes, emphasizing the importance of
administration to sustain the pro-inflammatory stimulus
associated with the higher efficacy of the q12 schedule.
This analysis supports the specificity of our findings but also
simultaneously emphasized the need to discriminate imiquimod-specific effects from those due to vehicle cream application and/or tissue repair induced by the adjacent pretreatment biopsy. Because q12 dose scheduling had been
observed previously to produce the highest rates of clearance
[3], we adopted this cohort as the basis for further analysis.
This selection offered the additional advantage of allowing
/>
the largest number of temporally matched placebo-treated
samples (q12 × 4 and q24 × 4 cohorts). At EOT, 1,578 genes
were significantly altered in expression in the q12 × 4 (blue)
cohort compared to pre-treatment (paired t-test cut-off p
value < 0.05; Figure 2a). To eliminate placebo and/or surgical
bias, an unpaired t-test (cutoff p value < 0.05) was applied to
this gene pool, identifying transcripts differentially expressed
between imiquimod-treated EOT samples and vehicle creamtreated samples. This analysis left 637 genes unequivocally
modulated by imiquimod (Figure 2b,c; Additional data file 3).
A global test was applied to this gene set to test the likelihood
of getting this proportion of significant genes by chance (at
the 0.05 level) if there were no real differences between the
two classes. Such likelihood was negligible, with a permutation p value of 0.001. The false discovery rates (FDRs) of the
differentially expressed genes are less than 11.9%. To estimate
the specificity/accuracy of the 637 'imiquimod-induced'
genes, we considered as a training set the samples utilized for
their identification (q12 × 4 days treatment group and the q12
× 4 and q24 × 4 days vehicle groups; Figure 2b). The trained
predictors were then used to segregate post-imiquimod treatment samples from pre-treatment or vehicle treated samples
belonging to the other groups. This analysis was performed
using the Support Vector Machines (a supervised learning
algorithm that classifies data by finding optimal fit between
different statistical classes); this analysis yielded a sensitivity
of 60%, specificity of 92% and an overall accuracy of 82.4%.
Thus, the set of 637 genes identified by this study represent a
highly specific functional signature of imiquimod-induced
changes during the early stages of therapy in lesions whose
transcriptional profiles were sufficiently activated. The relatively low sensitivity of the gene set as predictors most likely
reflects the exclusion of lesions in the earliest cohort (orange
group) that were not exposed sufficiently to imiquimod.
Of the 637 genes, 65 were also significantly altered in expres-
expressed(see following page)the and IFN-α in EOT compared to pre-treatment samples in all cohorts; hierarchical clustering based on genes differentially
Figure 1 at EOT genes IFN-γ blue group
imiquimod-inducedcompared to pre-treatment samples in each treatment cohort and dendrogram showing the degree of relatedness of samples based on
Differential expression of in
Differential expression of IFN-γ and IFN-α in EOT compared to pre-treatment samples in all cohorts; hierarchical clustering based on genes differentially
expressed at EOT compared to pre-treatment samples in each treatment cohort and dendrogram showing the degree of relatedness of samples based on
imiquimod-induced genes in the blue group. The 2-ΔΔCT describes (a) IFN-γ and (b) IFN-α gene expression fold change at EOT relative to baseline after
normalization according to the endogenous reference cyclophilin G. CT equals the mean cycle times of duplicate wells and ΔΔCT = (CT, Target-CT,
cyclophilin) EOT - (CT, Target-CT, cyclophilin) baseline. The fold-change data were transformed using logarithm10. The box and whisker style box plot
gives the median and interquartile range (box), 1.5 of the inter-quartile range (whiskers), points outside the whiskers (square symbols) and the mean (cross
symbol). Statistics: p values refer to 2-sample t-tests between treatment and control groups. (c) Based on a paired t-test cut-off p2 value < 0.05, 1,311
genes were differentially expressed between the pre-treatment and EOT samples in the q12 × 2 (orange) cohort. Reclustering of these genes identified a
node of 65 genes uniquely upregulated in the imiquimod-treated EOT samples (part i). Similar analyses were performed for the other imiquimod-treated
cohorts; 1,578 genes were differentially expressed in the q12 × 4 (blue) cohort, including an imiquimod-specific node of 263 genes (part ii and the vertical
blue bar in adjacent complete data set); 650 genes were differentially expressed in the q24 × 4 (green) cohort, including an imiquimod-specific node of 58
genes (part iii); and 495 genes were differentially expressed in the q24 × 8 (pink) cohort, including an imiquimod-specific node of 23 genes (part iv). A Venn
diagram displays the extent of overlap among genes differentially expressed in the three most informative orange, blue and green groups (part v). (d)
Reclustering of all BCC samples based on the imiquimod-specific 263-gene signature identified in the q12 × 4 (blue) cohort. Straight lines identify
imiquimod-treated EOT samples color coded according to treatment regimen; dashed lines identify vehicle cream-treated EOT samples and unlabeled are
the all pre-treatment samples. A diagram illustrating the strategy used to prepare Figure 1c,d is available as Additional data file 4.
Genome Biology 2007, 8:R8
/>
IFN-γ
Volume 8, Issue 1, Article R8
(b)
Panelli et al. R8.5
IFN-α
reviews
Log10 2 -ΔΔCT (post-pre)
comment
(a)
Genome Biology 2007,
Imiquimod
Vehicle
Before treatment
(Px-PB1)
q12,2D
q12,4D
ii
iii
q24,8D
iv
23 genes
65 genes
263
56 genes
200
23
65
18
1
v
refereed research
23
deposited research
i
After treatment
(Px-PB3)
q24,4D
reports
(c)
22
15
56
263 genes
interactions
(d)
information
Figure 1 (see legend on previous page)
Genome Biology 2007, 8:R8
R8.6 Genome Biology 2007,
Volume 8, Issue 1, Article R8
Panelli et al.
sion in the q12 × 2 (orange) cohort; we refer, therefore, to
these as 'primary' responders to imiquimod and to the rest as
'secondary'. Finally, the 637 genes were matched to our database of IFN-α-related signatures consisting of 426 genes
identified using the same cDNA platform and reference system in monocytes stimulated with various IFN-α subtypes in
vitro [11] and/or induced in vivo by systemic IFN-α2b therapy. Only 98 (22 included among the primary) genes matched
the database and were considered bona fide ISGs. The
primary ISGs included STAT-1, MX1, MX2 and IFITM1. By
four days, secondary ISGs had broadened to STAT2, IRF-2
and IRF7, JAK-2 and JAK-3 and N-myc interactor (NMI).
Moreover, CXCL10/IP-10 was significantly upregulated;
CXCL10 is a monocyte and T lymphocyte chemoattractant
interacting with the chemokine receptor CD183 (CXCR3) and
T-cell CD26. The remaining 539 genes were induced through
IFN-α-independent pathways, suggesting that only a small
proportion of the effector activity of imiquimod is mediated
by IFN-α.
Primary non-IFN-α-stimulated genes
By the second day of q12 imiquimod treatment, 65 primary
non-ISGs were identified, echoing predominantly innate
immune effector functions (Figure 3a). CXCR3, a ligand for
IP-10 and monokine induced by IFN-γ (MIG/CXCL9) was the
earliest upregulated cytokine receptor, suggesting its early
involvement in the crosstalk leading to migration and activation of monocytes and lymphocytes. Also induced by IFN-γ
were several HLA class I and class II transcripts, including
HLA-B and HLA-DRβ1. Transcripts critical for the activation
of innate immune effector cells, such as NK cells and mononuclear phagocytes, were highly expressed; for example,
TYROBP, a killer-cell immunoglobulin-like receptor family
member and cytochrome β-245, a component of phagocytes'
lytic function. Activation of macrophages was also strongly
supported by the upregulation of CD68, and the modulation
of complement component 1 qα (C1QA) and MY-D88 [12].
The induction of CD37 represented an early sign of the transition from an innate to an adaptive immune response as
CD37 regulates T cell proliferation through TCR signaling
[13]. Finally, Caspase 10 upregulation suggests an early initiation of apoptotic mechanisms.
Secondary non-IFN-α-stimulated genes
/>
matory process is amplified by the induction of cytokines,
their receptors and genes related to their interactions, such as
dual specificity phosphatase 5 (DUSP-5) and the gene encoding the anti-apoptotic BCL2. The induction of pro-inflammatory molecules was strongly reminiscent of the broad
transcriptional changes induced by the in vitro stimulation of
peripheral blood mononuclear cells (PBMCs) by interleukin
(IL)-2 [14]. In particular, the upregulation of cytokines and
corresponding receptors within the common γ chain receptor
family (particularly IL-15 and the IL-15 receptor α-chain, the
IL-2/IL-15 receptor β-chain and the common γ chain itself;
Figure 3b) suggest early activation within the tumor microenvironment of CD8 T and NK cells [15,16]. This notion is also
supported by the modulation of downstream transcription
factors of IL-2/IL-15 receptor triggering, such as Jak kinases,
STAT-1, STAT-3 and STAT-5, and the upregulation of T cell
receptor subunits, cytotoxic granules and NK-activation
receptors (Figure 3b). The increased expression of the chemokine (C-C motif) receptor 7 (CCR-7) also supports a potent
activation of pro-inflammatory signals; CCR7 is expressed by
activated B and T lymphocytes and NK cells and controls their
migration to inflamed tissues [17]. MIG is a chemoattractant
for CXCR3-bearing immune cells that may contribute,
together with IP-10, to the intensification of the acute inflammatory process. Monocyte inflammatory protein (MIP)-1α
(CCL3), MIP-1β (CCL4) and MCP-3 (CCL7) were also induced
at this point. Among them, MCP-3 has been shown to augment monocyte anti-tumor activity while CCL3/MIP-1α and
MIP-1β represent potent pro-inflammatory factors with
chemotactic properties for neutrophils and DC and NK cells.
Interestingly, CD64 and the low-affinity IgG Fc receptor II-B
(FCGR2B), which were also upregulated among the secondary non-ISGs (Figure 3c), have been shown to stimulate MIP1α and MIP-1β release [18].
Cytotoxic T and NK cell signatures
The most striking effects of imiquimod were on cytotoxic
mechanisms, with the induction of NK cell gene-5 (NKG-5),
NK cell protein-4 (NK4)/IL-32 granzyme-B, -A and -K, perforin and lymphotoxin-β receptor [19,20]. (Figure 3b,c).
Moreover, the concomitant transcription of several caspases
indicate active cytotoxicity [20] combined with granulemediated apoptosis suggested by the upregulation of proteoglycan 1 secretory granule (PRG1) [21].
The vast majority of transcriptional effects were observed
four days after q12 treatment (Figure 3b), when the inflam-
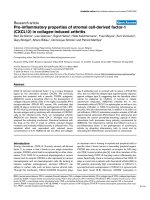
Figure 2 (see following page)
Identification of treatment (imiquimod)-specific transcripts in the most intensive schedule (q12 × 4 (q12,4d), blue cohort)
Identification of treatment (imiquimod)-specific transcripts in the most intensive schedule (q12 × 4 (q12,4d), blue cohort). (a) A pairwise t-test (p value <
0.05) was applied to identify genes differentially expressed between pre-treatment and EOT biopsies from the same BCC belonging to the q12 × 4 (blue)
cohort. The 1,578 genes identified were then tested for treatment specificity by identifying those differentially expressed between the blue group treated
with imiquimod (TX) compared with temporally matched, vehicle control-treated EOT biopsies (combined blue and green groups (b) The remaining 637
treatment-specific genes were classified based on their significant expression also in the earlier q12 × 2 (orange) group as primary (65 genes) while the
other ones were considered secondary. Finally, the same genes were also compared to a database of IFN-α-associated transcripts as described in the
Materials and methods. In the same panel the 637 genes are shown in a supervised-sample hierarchical clustering of the genes. (c) Legend of samples,
dashed and solid bars identify vehicle control or imiquimod-treated samples, respectively.
Genome Biology 2007, 8:R8
/>
Genome Biology 2007,
Volume 8, Issue 1, Article R8
ttest p-value < 0.05
17k genes DATASET
PRE
POST TX
n=7
comment
(a)
Panelli et al. R8.7
n=7
1578 genes
1578 genes q12,4D DATASET
POST vehicle
637 genes
n=7
n=7
reviews
POST TX
ttest p-value < 0.05
(b)
reports
637 genes
deposited research
572 genes
refereed research
65 genes
(c)
interactions
Post-treatment (EOT)
Pre-treatment
information
Figure 2 (see legend on previous page)
Genome Biology 2007, 8:R8
R8.8 Genome Biology 2007,
Volume 8, Issue 1, Article R8
Panelli et al.
Several T cell receptor signaling and amplification-associated
genes were also upregulated, including those encoding TCRα, -β and -γ chains, ζ-chain (ZAP70), CD3Z, T cell immuneregulator 1 and related co-receptor CD5 [22,23]. Moreover,
CD2/LFA-2 mediates T and NK cell activation through interactions with CD59, which is also upregulated at this time
point [24,25]. Similarly, the overexpression of CD69 marks
the activation of T and NK cells and it has been correlated by
Posselt et al. [26] with acute renal allograft rejection.
Several transcripts suggest a primary involvement of NK cells
in the process, such as the NKG2 family of genes, which
encode receptors that are expressed on most NK cells [27]:
killer cell lectin-like receptor subfamily C, member 2
(KLRC2/NKG2C), member 3 (KLRC3/NKG2E), and member
4 (KLRC4/NKG2F). Moreover, all NK receptor adapter proteins containing an immune-receptor tyrosine based activation motif (ITAM) were found to be upregulated (FCERIg),
CD3z and TYROBP/DAP12. The upregulation of KLRC2/
NKG2C, TYROBP/DAP12 and FCER1G suggests the
occurrence of NK and T cell activation, which would lead to
release of pre-made cytotoxic granules and secretion of
cytokines [27]. Another NK cell-related gene is that encoding
Cathepsin w, a cysteine proteinase associated with the membrane and the endoplasmic reticulum of NK and T cells and
regulation of their cytolytic activities [28]. Finally, the minor
histocompatibility antigen HA-1 may be one of the immunodominant stimulators of graft-versus-host and graft-versusmalignancy effects through increasing cytotoxic mechanisms
[29].
Markers of immune infiltrates
Transcriptional analysis portrayed a predominant enhancement of immune infiltrates associated with T and NK cells.
Because 9 of 22 imiquimod-treated BCCs were cleared of
tumor cells at EOT it was impossible to further analyze
whether the identified changes were occurring in specific histological areas as sharply defined in pre-treatment lesions. In
such cases, changes in immune infiltrates were calculated
comparing EOT results with pre-treatment peri-tumoral
infiltrates. With all four imiquimod treatment groups pooled
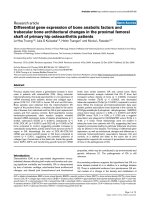
together, significant increases were noted in CD56 (NK cells),
CD4 and CD8 T cells, with CD56 (NK cells) showing significant difference relative to the pooled vehicle group (Table 2,
Figure 4). Moreover, BCL-2 expression was selectively
enhanced in immune but not cancer cells. Importantly,
enhancement of CD8 expression was strongly dependent
upon treatment schedule, with 5 of 7 subjects treated in the
/>
q12 × 4 (blue) cohort experiencing increases in the number of
CD8 T cells (p value < 0.05). Other markers did not reach statistical significance, including those associated with cytotoxic
activity, such as granzymes and perforin, suggesting that the
differences identified at the transcript level may precede
changes detectable as protein expression, as we recently
observed studying transcript to protein relationships in IL-2stimulated PBMCs [14]. These data confirm the transcriptional observation that imiquimod primarily induces
recruitment and activation of T and NK cells within the BCC
microenvironment.
Discussion
This is the first prospectively controlled study conducted to
identify the early biological events associated with the eradication of BCC through an immune-mediated mechanism. By
protocol design, tumor regression did not represent an endpoint and tumors were removed at the end of the study. Thus,
the association between the molecular/genetic findings and
tumor clearance is presumptive, based on the historical 80%
to 90% clearance rates recognized by the Food and Drug
Administration for the release of imiquimod for clinical use
[2]. However, it is interesting to note that 9 of 22 (41%) imiquimod-treated BCCs were devoid of cancer cells by EOT (2 to
8 days from beginning of treatment) while only 1 of 14 (7%)
control-treated BCCs had no identifiable tumor cells (Fisher
test p value = 0.05), suggesting that artifacts due to vehicle
administration or surgical trauma were not responsible for
the early tumor clearance.
As indicated by qPCR, IFN-γ transcription was more prevalent than IFN-α transcription. This is in line with the evidence
of predominant NK, CD8 and CD4 T cell activity in this study.
Sullivan et al. [30] had indeed previously observed similar
cellular infiltrates (particularly CD4 and CD56 expressing
cells) in a smaller, open-label, matched controlled, non-randomized study in which six patients with BCC treated with imiquimod at daily intervals for a total of ten administrations
were compared with six patients receiving comparable vehicle cream treatment. The predominance of IFN-γ transcription suggests that pDCs trigger other immune functions
through the production of IFN-α, which in turn activates resident T and NK cells, selective producers of IFN-γ [31]. We
hypothesize that these secondary immune effector mechanisms induce destruction of target cells, providing antigen to
professional antigen presenting cells for priming of naive Tcells in draining lymph nodes [31,32]. Indeed, several of the
Figure 3 (see following page)
Visual display of selected treatment (imiquimod)-specific transcripts (complete database available on line)
Visual display of selected treatment (imiquimod)-specific transcripts (complete database available on line). (a) Display of selected primary treatmentspecific genes identified as per Figure 2. (b) Secondary treatment-specific genes related to effector functions with primary focus on cytokines, cytokine
receptors and lytic enzymes. (c) Secondary treatment-specific genes representative of cell surface markers, receptors and associated molecules. In red are
genes whose expression was found to be associated with acute renal allograft rejection [37]. Treatment cohorts are described by the bars on top of each
cluster.
Genome Biology 2007, 8:R8
/>
Genome Biology 2007,
Volume 8, Issue 1, Article R8
Panelli et al. R8.9
comment
(a)
- CD37
-------------- CD68
- CXCR3
reviews
-------------- HLA-DRb1
- TYROBP
-------------- HLA-DM a
- C1QA
- Caspase 10
- HLA-B
-------------- MYD88
(b)
reports
----------------------- STAT-1
- CXCL10/IP-10
------------------------ Interferon-stimulated factor 3
- CXCL9/Mig
- CXCL7/MCP-3
Caspase 8
----------------------------Caspase 1
- Granzyme A
- Caspase 5
- IL-6
deposited research
----------------------- Allograft inflammatory factor 1
- IL-15
- Natural killer-cell transcript 4/IL-32
- CCR7
- IL-2/IL-4/IL-7/IL-9/IL-15 Rg
- PRG-1
Granzyme K
- Natural killer cell gene -5
--------------------------------------------- Perforin
CCL4/MIP-1b
- IL-2/IL-15 Rb
- IL15 Ra
------------------------ Lymphotoxin receptor precursor
- Granzyme B
(c)
---------------------- Macrophage stimulating 1
- CD64
-------------------------- HLA-G
--------------------------------------------- CD2
----------------- KLRC3
- CD59
refereed research
- JAK-2
- CD68
- CD4
------------------------- TNF receptor
- CD8
------------------------------------------- CD5
-------------------------- CD62L
- T-cell receptor
- CD3 Zeta
interactions
- ZAP 70
- T cell immune-regulator 1
- insulin-like growth factor 1 receptor
- Minor histocompatibility antigen HA-1
- Cathepsin W
- CD69
information
Figure 3 (see legend on previous page)
Genome Biology 2007, 8:R8
R8.10 Genome Biology 2007,
(a)
Volume 8, Issue 1, Article R8
Panelli et al.
/>
C D56
Tumor
EOT
Pre-treatment
H& E
Peri-tumoral
P40
Peri-tumoral
No tumor cells
ΔCD56=+1
(b)
CD8
H& E
Peri-tumoral
CD8
P8
Peri-tumoral
EOT
Pre-treatment
Tumor
C D5 6
ΔCD8=+1
ΔCD56= 0
Tumor
ΔCD8 = 0
Figure 4 for CD56 and CD8 in BCC from (a) P40 (imiquimod treated) and (b) P8 (vehicle-control)
IHC staining
IHC staining for CD56 and CD8 in BCC from (a) P40 (imiquimod treated) and (b) P8 (vehicle-control). Lesions were graded blindly by two pathologists
(AA and AF) and graded before and at EOT for peri-tumoral and intra-tumoral immune cells infiltrate. Cancer cells were evaluated separately for each
marker. When BCC was absent at EOT as in P40 the immune infiltrate was compared to the peri-tumoral pre-treatment infiltrate. NE, not evaluable
because no tumor cells were left at EOT.
transcripts associated with imiquimod treatment show activation of T and NK cells and induction of IFN-γ stimulated
genes (Figure 3). The cytotoxic T and NK cell signatures identified here (granzymes, perforin and other NK cell-related
genes) have recently been described in a mouse model of IFNα and IFN-γ-producing killer DCs (IKDCs) [33], which simultaneously display cytotoxic and pro-inflammatory functions.
Thus, IKDCs could summarize in a cellular unit our findings
of ISG activation combined with broader cytotoxic and proinflammatory properties. At present, IKDCs have not been
characterized in humans, nor it is known whether they
express TLR-7; future studies should address their role as
putative mediators of immune rejection.
Imiquimod treatment stands as a unique opportunity to study
the mechanisms of immune-mediated rejection directly in
human tissues. This TLR-7 agonist links multiple immune
pathways. Of these, IFN-α plays a consistent but not exclusive
role. Previous transcriptional surveys have provided a broad
view of the biological processes associated with immunemediated tissue destruction, identifying convergent
characteristics. Neoplastic inflammation approaches the
unresolving process of chronic hepatitis C virus (HCV) infection where the presence of antigen-specific immune
responses do not lead to clearance of the pathogen in the
majority of cases [34,35]. Both diseases are characterized by
the expression of ISGs that do not seem sufficient to clear the
pathogenic procress. Similar signatures can be identified in
Genome Biology 2007, 8:R8
/>
Genome Biology 2007,
Volume 8, Issue 1, Article R8
Panelli et al. R8.11
Table 2
Scoring of immune infiltrate by immuno histochemistry
Within group p value
-3
-2
-1
0
1
2
3
Imiquimod
0
0
1
12
6
1
0
0.03
Vehicle
0
0
2
11
0
0
0
0.17
Imiquimod
0
0
1
10
7
1
1
0.01
Vehicle
0
0
0
9
1
2
0
0.22
Imiquimod
0
0
1
12
7
0
0
0.03
Vehicle
0
0
2
5
4
1
0
0.22
Imiquimod
0
0
1
11
6
2
0
0.02
Vehicle
0
0
2
9
1
1
0
comment
Δ Score post - pre-treatment
Pooled treatment groups
0.72
CD56
CD8
reviews
CD4
BCL-2
Genome Biology 2007, 8:R8
information
Dermatologists have long used imiquimod to treat BCC
[4,45,46] Imiquimod mimics the action of single-stranded
viral RNA [31], activating a pro-inflammatory cascade as a
chemical prototype of the danger model of immune activation
[47]. Meanwhile, tumor immunologists have struggled to
interactions
Among the genes mutually reported by the previous three
studies, NK4/IL-32 was recently recognized as a central
mediator of Crohn's disease [42] and associated with liver
damage during HCV infection [36]. NK4/IL-32 is a potent
inducer of pro-inflammatory cytokines and it is selectively
expressed by immune cells stimulated with IFN-γ IL-2 or the
combination of IL-12 and IL-18 [14,39]. Indeed, we found
NK4/IL-32, together with other genes associated with cytotoxic function, to be constitutively expressed by NK cells but
only by activated CD8+ T cells [43]. Moreover, we recently
observed NK4/IL-32 to be preferentially expressed in
metastatic melanoma compared with other less immune
responsive cancers [44]. It is possible that NK4/IL-32 may
play a central role during imiquimod treatment by amplifying
inflammatory stimuli through the induction of a cytokine cascade. Thus, this novel cytokine emerges as a central player in
immune rejection or autoimmunity.
refereed research
Sarwal M et al. [37] reported strikingly similar results evaluating the transcriptional behavior of renal cell allograft during acute rejection, basing the analysis on a similar array
platform and utilizing the same RNA amplification method
[41] (Figure 3, transcripts labeled in red). In spite of these
similarities, they also reported a B cell signature characterized by enhanced expression of CD20 and several immunoglobulins that we did not identify in our study. This
discrepancy could be explained by a specific role that B cell-
mediated immunity may play in the context of allo-recognition. In the case of BCC, the strong pro-inflammatory stimulus induced by imiquimod through TRL-7 signaling might
bypass the requirement for an endogenous, tissue specific
insult responsible for the secondary triggering of the cellular
immune effector mechanisms identified by both studies. The
signatures identified by both studies also match the anecdotal
identification of the same genes in a melanoma metastasis
that underwent regression following systemic IL-2 therapy
[38].
deposited research
liver biopsies from patients with chronic HCV infection [36]
and in chronic allograft rejection controlled with standard
immune suppression [37]. ISGs are also consistently
expressed in melanoma metastases following the systemic
administration of IL-2 independent of clinical outcome [38].
Thus, it appears that ISGs are part of immunological processes associated with chronic inflammation insufficient to
clear its cause. On the contrary, several non-ISGs identified
by this study delineate potent inflammatory (CCL7/MCP-3,
CCL4/MIP-β, and so on) and cytotoxic (granzymes, perforin,
NKG-5, and so on) functions rarely observed in chronically
inflamed tissues but described in the acute inflammation
associated with destruction of a tumor [38] or allograft [37],
liver damage in HCV-induced cirrhosis [36] or gut dysfunction during flares of Crohn's disease [39]. This study corroborates the impression that immune-mediated tissue
destruction comprises at least two components: a baseline
cluster of ISGs that may be necessary but insufficient to
induce tissue rejection and a less common activation of broad
cytotoxic and other potent pro-inflammatory innate immune
effector functions that are more tightly associated with rejection. Our findings are supported by the recent description of
clearance of established cancers by the adoptive transfer of
innate immune effector cells in the powerful model of spontaneous regression/complete resistance mice [40].
reports
P values associated with the paired t-test for within group shifts relative to baseline. Δ Score refers to differences in infiltrate between EOT and pretreatment samples using the scoring scale described in Materials and methods (IHC section).
R8.12 Genome Biology 2007,
Volume 8, Issue 1, Article R8
Panelli et al.
explain the paradoxical co-existence of tumor antigen-specific T cells induced by vaccination with growing tumor tissues. Indirect evidence suggests that vaccine-induced T cells
reach the tumor site [48] and recognize tumor cells producing
IFN- γ However, this is not sufficient for tumor rejection
since other effector mechanisms are not simultaneously activated [49] because cancers do not provide the danger signal
necessary for full implementation of the immune responses
[50]. Thus, immunization successfully affects the afferent
loop of the immune response by eliciting TA-specific T cells
but cannot affect T cell activation at the receiving end [51,52].
The cancer specificity of TLR agonists consists of the preferential attraction of TLR-7 expressing pDCs to chronically
inflamed tissues and their enhanced recruitment [53]. Similar conclusions were recently reached by Torres et al. [54],
who followed the biological events induced by imiquimod
when administered to patients with actinic keratosis. Thus,
TLR agonists exemplify how the gap between the induction of
TA-specific T cells by immunization and their activation at
the receiving end could be closed. It is thus conceivable that
preparations of TLR agonists suitable for systemic administration may be used in the future as single agent therapy for
other tumor types (trials are currently ongoing in Europe for
melanoma) or as adjuvants to enhance the effectiveness of
active-specific immunization approaches [55-57].
/>
The trial was conducted at the National Naval Medical Center
(Bethesda, MD, USA) in compliance with the Code of Federal
Regulations and the guidelines for Good Clinical Practice.
Imiquimod (5%, 12.5 mg) or vehicle cream were supplied in
single-use 250 mg sachets. Following biopsy confirmation
and time for healing, subjects applied a sufficient quantity of
cream to cover the entire BCC and an area approximately 2
cm around. Each dose was left on the skin for eight hours. For
the study, 48 subjects were supposed to be randomized in a
2:1 ratio to either imiquimod or vehicle within each of 4 dosing regimens (q12 hours for 2 or 4 days or q24 hours for 4 or
8 days). Subjects were randomized at the time of screening
when the pre-enrollment biopsy was taken. Once eligibility
was determined based on the biopsy result, the investigator
contacted the subject, who either started treatment on a date
instructed by the investigator or returned the study drug.
Replacement subjects were identified for all subjects with a
biopsy result negative for BCC or who discontinued prior to
EOT procedures. BCCs were to be a least 7 mm diameter and
were to be located on the scalp, face, trunk or proximal
extremities. Punch biopsies (PB; 2 mm diameter) were
obtained pre-enrollment to verify the diagnosis of BCC, pretreatment (PB1 and PB2) and at EOT (PB3 and PB4), approximately 24 hours after the last dose taken. PB1 and PB3 were
transferred immediately at the bedside into cryovials with 2
μl Rnalater (Ambion, Austin, TX, USA), frozen in liquid nitrogen and stored at -80°C for total RNA isolation. PB2 and PB4
were placed in a cryomold, filled with OCT compound (Tissue-Tek, Elkhart, IN, USA), frozen in liquid nitrogen and
stored at -80°C for immunohistochemistry (IHC).
Conclusion
This study stands as a proof of principle that, when tissues are
easily accessible, mechanistic observation about the effects of
a treatment can be easily performed in humans by combining
minimally invasive techniques (fine needle aspirates, through
cut or punch biopsies) with high-fidelity mRNA amplification; such approaches are fundamental to refresh scientific
hypotheses through direct human observation. Second, it
provides insights into the early events leading to tumor
rejection in a most powerful human model. Finally, it suggests that immune-mediated tumor rejection is only one
aspect of tissue-specific destruction, which follows a constant
immunological pathway shared by other anti-cancer immunotherapies, acute allograft rejection, autoimmune disease
and tissue damage during chronic pathogen infections.
Materials and methods
Detailed methods are available as Additional data file 2.
Study design and patient information
This double-blind, placebo-controlled, randomized, parallel
group clinical trial sponsored by 3M Pharmaceuticals and
registered before patient enrollment (3M/NNMC study
#1454-IMIQ) was designed to evaluate the early transcriptional events induced by topical imiquimod administration.
RNA isolation and amplification and cDNA arrays
Total RNA was isolated with RNeasy minikits (Qiagen, Germantown, MD, USA) and amplified into anti-sense RNA as
previously described [41,58,59] with the following modifications to minimize RNA degradation by abundant skin
RNAases. Samples were homogenized in disposable tissue
grinders (Fisher Scientific, Lafayette, CO, USA). Proteins
potentially interfering with RNA isolation were removed by
incubating the homogenate in 590 μl distilled water and 10 μl
PROTEINASE K solution (Qiagen) at 55°C for 10 minutes
then centrifuged at ambient temperature for 3 minutes.
Supernatants were combined with 0.5 volumes of ethanol
(96% to 100%) into a Rnase-Dnase free tube and RNA was
isolated through a RNeasy mini column. First strand cDNA
synthesis was accomplished in 1 μl SUPERase•In (Ambion)
and ThermoScript RT (Gibco BRL, Gaithersburg, MD, USA)
in 2 μg bovine serum albumin. RNA quality was verified by
Agilent technologies (Palo Alto, CA, USA). Anti-sense RNA
was used for probe preparation or quantitative real-time PCR
(qPCR). For microarray analysis, test samples were labeled
with Cy5-dUTP (Amersham, Piscataway, NJ, USA) and cohybridized with reference pooled normal donor PBMCs
labeled with Cy3-dUTP to custom made 7 K-cDNA microarrays [60]. Arrays were scanned on a GenePix 4000 (Axon
Instruments, Union City, CA, USA) and analyzed using Clus-
Genome Biology 2007, 8:R8
/>
Genome Biology 2007,
Quantitative PCR
Additional data files
The following additional data are available with the online
version of this paper. Additional data file 1 provides a list of
genes previously shown to be associated with the stimulation
of various cell types with IFN-α. Additional data file 2 is an
extended version of the Materials and methods, providing full
disclosure of the methodology used. Additional data file 3
provides a complete list of the 637 genes specifically induced
by imiquimod treatment based on the statistical approach
presented in the text. Additional data file 4 is a diagram
illustrating the mining strategy that was implemented for the
preparation of Figure 1c,d.
Figure 1c,d.
The mining previously IFN-α.
treatment data
Complete basedthe 637 IFN-α
closure1c,dfor types the was specifically induced the stimulation
Extended cell methodology used
Click here list fileon 4 genes to be associated the by in the text
of various version of3 statistical and methods, providing full of
List of genesstrategy2thatMaterials approach presentedimiquimod
Additionalthe of file 1theshownimplemented forwith preparation disof
with used.
text.
References
1.
3.
4.
6.
8.
9.
10.
11.
13.
14.
Statistics
15.
16.
17.
Genome Biology 2007, 8:R8
information
Significance testing was based on paired or 2-sample twotailed Student t-test as appropriate. P values < 0.05 were considered statistically significant. No adjustment was made for
multiple comparisons. Fisher exact test was used to test the
level of significance comparing the frequency of events
between treatment groups. All analyses related to class comparison and class prediction was done using the BRB-Array
Tools [69] developed by Simon [70]. Microarray raw data
were curated according to GEO (series # GSE5121) [71].
interactions
12.
refereed research
After confirming the presence of epidermis, dermis and
tumor using hematoxylin and eosin, IHC was performed by
staining 7 mm consecutive acetone-fixed sections for the
expression of CD4, CD8, CD56, CD95, FasL, granzyme A and
B, perforin, BCL-2, TRAIL, caspase 3 and PARP. Secondary
staining consisted of biotinylated goat-anti-mouse IgG followed by avidin-biotin-peroxidase. A semi-quantitative estimation was conducted to separate histological entities as:
tumor cells; intra-tumoral immune infiltrate; and peritumoral immune infiltrate. Scoring was assigned independently by two blinded pathologists (AA and AF) as: 0 (none), 1+
(few), 2+ (moderate), 3+ (numerous). Data are presented as
shift in scores at EOT compared to baseline.
deposited research
5.
Schulze HJ, Cribier B, Requena L, Reifenberger J, Ferrandiz C, Garcia
Diez A, Tebbs V, McRae S: Imiquimod 5% cream for the treatment of superficial basal cell carcinoma: results from a randomized vehicle-controlled phase III study in Europe. Br J
Dermatol 2005, 152:939-947.
National Cancer Institute: Drug Information Summaries
[ />Stockfleth E, Trefzer U, Garcia-Bartels C, Wegner T, Schmook T,
Sterry W: The use of Toll-like receptor-7 agonist in the treatment of basal cell carcinoma: an overview. Br J Dermatol 2003,
149(Suppl 66):53-56.
Urosevic M, Maier T, Benninghoff B, Slade H, Burg G, Dummer R:
Mechanisms unerlying imiquimod-induced regression of
basal cell carcinoma in vivo. Arch Dermatol 2003, 139:1325-1332.
Stanley MA: Imiquimod and the imidazoquinolones: mechanism of action and therapeutic potential. Clin Exp Dermatol
2002, 27:571-577.
Naylor MF, Crowson N, Kuwahara R, Teague K, Garcia C, Mackinnis
C, Haque R, Odom C, Jankey C, Cornelison RL: Treatment of lentigo maligna with topical imiquimod. Br J Dermatol 2003,
149(Suppl 66):66-70.
Ray CM, Kluk M, Grin CM, Grant-Kels JM: Successful treatment
of malignant melanoma in situ with topical 5% imiquimod
cream. Int J Dermatol 2005, 44:428-434.
Hurwitz DJ, Pincus L, Kupper TS: Imiquimod: a topically applied
link between innate and acquired immunity. Arch Dermatol
2003, 139:1347-1350.
Majewski S, Marczak M, Mlynarczyk B, Benninghoff B, Jablonska S:
Imiquimod is a strong inhibitor of tumor cell-induced
angiogenesis. Int J Dermatol 2005, 44:14-19.
KEGG PATHWAY Database [ />pathway.html]
Stroncek DF, Basil C, Nagorsen D, Deola S, Arico E, Smith K, Wang
E, Marincola FM, Panelli MC: Delayed polarization of mononuclear phagocyte transcriptional program by type I interferon
isoforms. J Transl Med 2005, 3:24.
KEGG: Toll-like Receptor Signaling Pathways
[http://
www.genome.jp/dbget-bin/www_bget?path:hsa04620]
van Spriel AB, Puls KL, Sofi M, Pouniotis D, Hochrein H, Orinska Z,
Knobeloch KP, Plebanski M, Wright MD: A regulatory role for
CD37 in T cell proliferation. J Immunol 2004, 172:2953-2961.
Jin P, Wang E, Provenzano M, Deola S, Selleri S, Voiculescu S, Stroncek DF, Panelli MC, Marincola FM: Molecular signatures induced
by interleukin-2 on peripheral blood mononuclear cells and
T cell subsets. J Transl Med 2006, 4:26.
Schluns KS, Stoklasek T, Lefrancois L: The roles of interleukin-15
receptor alpha: trans-presentation, receptor component, or
both? Int J Biochem Cell Biol 2005, 37:1567-1571.
Zambricki E, Shigeoka A, Kishimoto H, Sprent J, Burakoff S, Carpenter C, Milford E, McKay D: Signaling T-cell survival and death by
IL-2 and IL-15. Am J Transplant 2005, 5:2623-2631.
Sanchez-Sanchez N, Riol-Blanco L, de la Rosa G, Puig-Kroger A, Garcia-Bordas J, Martin D, Longo N, Cuadrado A, Cabanas C, Corbi AL,
et al.: Chemokine receptor CCR7 induces intracellular signaling that inhibits apoptosis of mature dendritic cells. Blood
2004, 104:619-625.
reports
2.
7.
Immunohistochemistry
reviews
QPCR was applied to detect the expression of IFN-α, IFN-γ,
TNF-α and MCP-1 using an ABI Prism 7900 HT (Applied Biosystems, Foster City, CA, USA). Primers and probes were custom-designed to span exon-intron junctions and generate
<150 base-pair amplicons (Biosource, Camarillo, CA, USA).
Taqman probes were labeled at the 5' and 3' ends with the
reporter FAM (6-carboxyfluorescein; emission λmax = 518
nm) and the quencher TAMRA (6-carboxytetramethylrhodamine; emission λmax = 582 nm), respectively. Standard
curves were based on amplicons generated from human leukocyte antigen (HLA)-A*0201 expressing lymphocytes stimulated with IL-2 (300 IU/ml) and Flu M1:58-66 peptide; copy
numbers were estimated with Oligo Calculator [67]. Linear
regression R2-values pertinent to all standard curves were ≥
0.98. QPCR reactions were conducted in a 20 μl volume,
including 1 μl cDNA, 1× Taqman Master MIX (Applied Biosystems), 2 μl of 20 μM primer and 1 μl of 12.5 μM probe.
Thermal cycler parameters included 2 minutes at 50°C, 10
minutes at 95°C and 40 cycles involving denaturation at 95°C
for 15 s, annealing-extension at 60°C for 1 minute. The 2-ΔΔCT
method was utilized to compute fold change in gene expression at EOT relative to baseline after normalization according
to cyclophilin G expression [68].
Panelli et al. R8.13
comment
ter and Tree View software [61]. Gene ratios are presented
according to the central method for display [62]. Gene annotations were mined using web-based tools such as DAVID
[63], GeneCards [64], COPE [65] and Bioinformatic Harvester [66].
Volume 8, Issue 1, Article R8
R8.14 Genome Biology 2007,
18.
19.
20.
21.
22.
23.
24.
25.
26.
27.
28.
29.
30.
31.
32.
33.
34.
35.
36.
37.
38.
39.
Volume 8, Issue 1, Article R8
Panelli et al.
Fernandez N, Renedo M, Garcia-Rodriguez C, Sanchez Crespo M:
Activation of monocytic cells through Fc gamma receptors
induces the expression of macrophage-inflammatory protein (MIP)-1 alpha, MIP-1 beta, and RANTES. J Immunol 2002,
169:3321-3328.
Bade B, Boettcher HE, Lohrmann J, Hink-Schauer C, Bratke K, Jenne
DE, Virchow JC Jr, Luttmann W: Differential expression of the
granzymes A, K and M and perforin in human peripheral
blood lymphocytes. Int Immunol 2005, 17:1419-1428.
Adrain C, Murphy BM, Martin SJ: Molecular ordering of the caspase activation cascade initiated by the cytotoxic T lymphocyte/natural killer (CTL/NK) protease granzyme B. J Biol
Chem 2005, 280:4663-4673.
Veugelers K, Motyka B, Frantz C, Shostak I, Sawchuk T, Bleackley RC:
The granzyme B-serglycin complex from cytotoxic granules
requires dynamin for endocytosis. Blood 2004, 103:3845-3853.
Brossard C, Semichon M, Trautmann A, Bismuth G: CD5 inhibits
signaling at the immunological synapse without impairing its
formation. J Immunol 2003, 170:4623-4629.
Choudhuri K, Kearney A, Bakker TR, van der Merwe PA: Immunology: how do T cells recognize antigen? Curr Biol 2005,
15:R382-R385.
Hahn WC, Menu E, Bothwell AL, Sims PJ, Bierer BE: Overlapping
but nonidentical binding sites on CD2 for CD58 and a second
ligand CD59. Science 1992, 256:1805-1807.
Badour K, Zhang J, Siminovitch KA: The Wiskott-Aldrich syndrome protein: forging the link between actin and cell
activation. Immunol Rev 2003, 192:98-112.
Posselt AM, Vincenti F, Bedolli M, Lantz M, Roberts JP, Hirose R:
CD69 expression on peripheral CD8 T cells correlates with
acute rejection in renal transplant recipients. Transplantation
2003, 76:190-195.
Lanier LL: NK cell recognition. Annu Rev Immunol 2005,
23:225-274.
Wex T, Buhling F, Wex H, Gunther D, Malfertheiner P, Weber E,
Bromme D: Human cathepsin W, a cysteine protease predominantly expressed in NK cells, is mainly localized in the
endoplasmic reticulum. J Immunol 2001, 167:2172-2178.
Fujii N, Hiraki A, Ikeda K, Ohmura Y, Nozaki I, Shinagawa K, Ishimaru
F, Kiura K, Shimizu N, Tanimoto M, Harada M: Expression of minor
histocompatibility antigen, HA-1, in solid tumor cells. Transplantation 2002, 73:1137-1141.
Sullivan TP, Dearaujo T, Vincek V, Berman B: Evaluation of superficial basal cell carcinomas after treatment with imiquimod
5% cream or vehicle for apoptosis and lymphocyte
phenotyping. Dermatol Surg 2003, 29:1181-1186.
Iwasaki A, Medzhitov R: Toll-like receptor control of the adaptive immune responses. Nat Immunol 2004, 5:987-995.
Hemmi H, Kaisho T, Takeuchi O, Sato S, Sanjo H, Hoshino K, Horiuchi T, Tomizawa H, Takeda K, Akira S: Small anti-viral compounds activate immune cells via the TLR7 MyD88dependent signaling pathway. Nat Immunol 2002, 3:196-200.
Chan CW, Crafton E, Fan HN, Flook J, Yoshimura K, Skarica M,
Brockstedt D, Dubensky TW, Stins MF, Lanier LL, et al.: Interferonproducing killer dendritic cells provide a link between innate
and adaptive immunity. Nat Med 2006, 12:207-213.
Marincola FM, Wang E, Herlyn M, Seliger B, Ferrone S: Tumors as
elusive targets of T cell-directed immunotherapy. Trends
Immunol 2003, 24:335-342.
Bowen DG, Walker CM: Adaptive immune responses in acute
and chronic hepatitis C virus infection.
Nature 2005,
436:946-952.
Smith MW, Yue ZN, Korth MJ, Do HA, Boix L, Fausto N, Bruix J, Carithers RL Jr, Katze MG: Hepatitis C virus and liver disease: global transcriptional profiling and identification of potential
markers. Hepatology 2003, 38:1458-1467.
Sarwal M, Chua MS, Kambham N, Hsieh SC, Satterwhite T, Masek M,
Slavatierra O Jr: Molecular heterogeneity in acute renal allograft rejection identified by DNA microarray profiling. N Engl
J Med 2003, 349:125-138.
Panelli MC, Wang E, Phan G, Puhlman M, Miller L, Ohnmacht GA,
Klein H, Marincola FM: Genetic profiling of peripheral mononuclear cells and melanoma metastases in response to systemic interleukin-2 administration.
Genome Biol 2002,
3:RESEARCH0035.
Kim SH, Han SY, Azam T, Yoon DY, Dinarello CA: Interleukin-32:
a cytokine and inducer of TNFalpha.
Immunity 2005,
22:131-142.
/>
40.
41.
42.
43.
44.
45.
46.
47.
48.
49.
50.
51.
52.
53.
54.
55.
56.
57.
58.
59.
60.
61.
62.
Hicks AM, Riedlinger G, Willingham MC, Alexander-Miller MA, von
Kap-Herr C, Pettenati MJ, Sanders AM, Weir HM, Du W, Kim J, et al.:
Transferable anticancer innate immunity in spontaneous
regression/complete resistance mice. Proc Natl Acad Sci USA
2006, 103:7753-7758.
Wang E, Miller LD, Ohnmacht GA, Liu ET, Marincola FM: High fidelity mRNA amplification for gene profiling. Nat Biotechnol 2000,
18:457-459.
Netea MG, Azam T, Ferwerda G, Girardin SE, Walsh M, Park JS,
Abraham E, Kim JM, Yoon DY, Dinarello CA, Kim SH: IL-32 synergizes with nucleotide oligomerization domain (NOD) 1 and
NOD2 ligands for IL-1beta and IL-6 production through a
caspase 1-dependent mechanism. Proc Natl Acad Sci USA 2005,
102:16309-16314.
Monsurro V, Wang E, Yamano Y, Migueles SA, Panelli MC, Smith K,
Nagorsen D, Connors M, Jacobson S, Marincola FM: Quiescent
phenotype of tumor-specific CD8+ T cells following
immunization. Blood 2004, 104:1970-1978.
Wang E, Panelli MC, Zavaglia K, Mandruzzato S, Hu N, Taylor PR,
Seliger B, Zanovello P, Freedman RS, Marincola FM: Melanomarestricted genes. J Transl Med 2004, 2:34.
Richwald GA: Imiquimod. Drugs Today (Barc) 1999, 35:497-511.
Dahl MV: Imiquimod: a cytokine inducer. J Am Acad Dermatol
2002, 47:S205-S208.
Matzinger P: Introduction to the series. Danger model of
immunity. Scand J Immunol 2001, 54:2-3.
Panelli MC, Riker A, Kammula U, Wang E, Lee KH, Rosenberg SA,
Marincola FM: Expansion of tumor-T cell pairs from fine needle aspirates of melanoma metastases. J Immunol 2000,
164:495-504.
Kammula US, Marincola FM, Rosenberg SA: Real-time quantitative polymerase chain reaction assessment of immune reactivity in melanoma patients after tumor peptide vaccination.
J Natl Cancer Inst 2000, 92:1336-1344.
Fuchs EJ, Matzinger P: Is cancer dangerous to the immune
system? Semin Immunol 1996, 8:271-280.
Monsurro V, Wang E, Panelli MC, Nagorsen D, Jin P, Katia Z, Smith
K, Ngalame Y, Even J, Marincola FM: Active-specific immunization against melanoma: is the problem at the receiving end?
Sem Cancer Biol 2003, 13:473-480.
Marincola FM: A balanced review of the status of T cell-based
therapy against cancer. J Transl Med 2005, 3:16.
Urosevic M, Dummer R, Conrad C, Beyeler M, Laine E, Burg G, Giliet
M: Disease-independent skin recruitment and activation of
plasmacytoid predendritic cells following imiquimod
treatment. J Natl Cancer Inst 2005, 97:1143-1153.
Torres A, Storey L, Anders M, Miller RL, Bulbulian BJ, Jin J, Raghavan
S, Lee J, Slade HB, Birmachu W: Immune-mediated changes in
actinic Keratosis following topical treatment with Imiquimod 5% cream. J Transl Med 2007 in press.
Rechtsteiner G, Warger T, Osterloh P, Schild H, Radsak MP: Cutting
edge: priming of CTL by transcutaneous peptide immunization with imiquimod. J Immunol 2005, 174:2476-2480.
Wenzel J, Uerlich M, Haller O, Bieber T, Tueting T: Enhanced type
I interferon signaling and recruitment of chemokine receptor CXCR3-expressing lymphocytes into the skin following
treatment with the TLR7-agonist imiquimod. J Cutan Pathol
2005, 32:257-262.
Craft N, Bruhn KW, Nguyen BD, Prins R, Lin JW, Liau LM, Miller JF:
The TLR7 agonist imiquimod enhances the anti-melanoma
effects of a recombinant Listeria monocytogenes vaccine. J
Immunol 2005, 175:1983-1990.
Wang E, Marincola FM: Amplification of small quantities of
mRNA for transcript analysis. In DNA arrays: A Molecular Cloning
Manual Edited by: Bowtell D, Sambrook J. Cold Springs Harbor, NY:
Cold Spring Harbor Laboratory Press; 2002:204-213.
Wang E: RNA amplification for successful gene profiling
analysis. J Transl Med 2005, 3:28.
National Cancer Institute, Center for Cancer Research:
mAdb GAL Files (Hs-CCDTM17 5 k-1px gal)
[http://nci
array.nci.nih.gov/gal_files/gal_custom_current.shtml]
Eisen MB, Spellman PT, Brown PO, Botstein D: Cluster analysis
and display of genome-wide expression patterns. Proc Natl
Acad Sci USA 1998, 95:14863-14868.
Ross DT, Scherf U, Eisen MB, Perou CM, Rees CA, Spellman PT, Iyer
V, Jeffrey SS, van de Rijn M, Waltham M, et al.: Systematic variation
in gene expression patterns in human cancer cell lines.
Nature Genetics 2000, 24:227-235.
Genome Biology 2007, 8:R8
/>
63.
66.
67.
68.
69.
71.
Panelli et al. R8.15
reviews
70.
DAVID Bioinformatics Resource 2006
[http://
david.abcc.ncifcrf.gov/]
GeneCards Database [ />COPE: Cytokines and Cells Online Pathfinder Encyclopedia
[]
Bioinformatic Harvester Database [ />harvester/P599/P59901.htm]
Biomedical Research Support Facilities, University of
Pittsburgh [ />Livak KJ, Schmittgen TD: Analysis of relative gene expression
data using real-time quantitative PCR and the 2(-Delta Delta
C(T)) Method. Methods 2001, 25:402-408.
National Cancer Institute, Biometric Research Branch: BRB
Array Tools [ />Simon R, Lam A, LI MC, Ngan M, Menenzes S, Zhao Y: Analysis of
gene expression data using BRB-Array Tools.
Cancer
Informatics 2007 in press.
NCBI: Gene Expression Omnibus (GEO)
[http://
www.ncbi.nlm.nih.gov/geo/]
Volume 8, Issue 1, Article R8
comment
64.
65.
Genome Biology 2007,
reports
deposited research
refereed research
interactions
information
Genome Biology 2007, 8:R8