Báo cáo y học: "Analysis of proteomic profiles and functional properties of human peripheral blood myeloid dendritic cells, monocyte-derived dendritic cells and the dendritic cell-like KG-1 cells reveals distinct characteristic" doc
Bạn đang xem bản rút gọn của tài liệu. Xem và tải ngay bản đầy đủ của tài liệu tại đây (625.19 KB, 13 trang )
Genome Biology 2007, 8:R30
comment reviews reports deposited research refereed research interactions information
Open Access
2007Horlocket al.Volume 8, Issue 3, Article R30
Research
Analysis of proteomic profiles and functional properties of human
peripheral blood myeloid dendritic cells, monocyte-derived
dendritic cells and the dendritic cell-like KG-1 cells reveals distinct
characteristics
Claire Horlock
*
, Farouk Shakib
*
, Jafar Mahdavi
*
, Nick S Jones
†
,
Herb F Sewell
*
and Amir M Ghaemmaghami
*
Addresses:
*
Institute of Infection, Immunity and Inflammation, School of Molecular Medical Sciences, The University of Nottingham,
Nottingham NG7 2UH, UK.
†
Division of Otorhinolaryngology, School of Medical and Surgical Sciences, The University of Nottingham,
Nottingham NG7 2UH, UK.
Correspondence: Amir M Ghaemmaghami. Email:
© 2007 Horlock et al.; licensee BioMed Central Ltd.
This is an open access article distributed under the terms of the Creative Commons Attribution License ( which
permits unrestricted use, distribution, and reproduction in any medium, provided the original work is properly cited.
Proteomics profiles human dendritic cells<p>Important proteomic and functional differences between peripheral blood myeloid dendritic cells, monocyte-derived dendritic cells (moDC) and KG-1 cells have been identified.</p>
Abstract
Background: Dendritic cells (DCs) are specialized antigen presenting cells that play a pivotal role
in bridging innate and adaptive immune responses. Given the scarcity of peripheral blood myeloid
dendritic cells (mDCs) investigators have used different model systems for studying DC biology.
Monocyte-derived dendritic cells (moDCs) and KG-1 cells are routinely used as mDC models, but
a thorough comparison of these cells has not yet been carried out, particularly in relation to their
proteomes. We therefore sought to run a comparative study of the proteomes and functional
properties of these cells.
Results: Despite general similarities between mDCs and the model systems, moDCs and KG-1
cells, our findings identified some significant differences in the proteomes of these cells, and the
findings were confirmed by ELISA detection of a selection of proteins. This was particularly
noticeable with proteins involved in cell growth and maintenance (for example, fibrinogen γ chain
(FGG) and ubiquinol cytochrome c) and cell-cell interaction and integrity (for example, fascin and
actin). We then examined the surface phenotype, cytokine profile, endocytic and T-cell-activation
ability of these cells in support of the proteomic data, and obtained confirmatory evidence for
differences in the maturation status and functional attributes between mDCs and the two DC
models.
Conclusion: We have identified important proteomic and functional differences between mDCs
and two DC model systems. These differences could have major functional implications,
particularly in relation to DC-T cell interactions, the so-called immunological synapse, and,
therefore, need to be considered when interpreting data obtained from model DC systems.
Published: 1 March 2007
Genome Biology 2007, 8:R30 (doi:10.1186/gb-2007-8-3-r30)
Received: 2 August 2006
Revised: 1 December 2006
Accepted: 1 March 2007
The electronic version of this article is the complete one and can be
found online at />R30.2 Genome Biology 2007, Volume 8, Issue 3, Article R30 Horlock et al. />Genome Biology 2007, 8:R30
Background
Dendritic cells (DCs) are highly specialized antigen present-
ing cells that originate from bone marrow progenitor cells.
They represent a major cellular component of the innate
immune system and their interaction with cells of the adap-
tive immune system (for example, T cells) is critical for initi-
ating immune responses and maintaining tolerance [1]. DCs
exist in two stages of maturation. Immature cells are found
throughout the body where they act as sentinels, continuously
taking up antigen and undergoing activation [2]. Activation
leads to the secretion of pro-inflammatory cytokines, result-
ing in up-regulation of co-stimulatory molecules and migra-
tion to the lymph nodes. During their maturation, DCs lose
their antigen-capturing capacity and become mature
immuno-stimulatory cells that have the ability to activate
naïve T cells.
There are two main DC types in human peripheral blood,
known as myeloid DCs (mDCs) and plasmacytoid DCs
(pDCs). mDCs are the major subset, representing around
80% of blood DCs [3]. For ex vivo studies, mDCs can be iso-
lated from peripheral blood using immunomagnetic cell sep-
aration [3]. However, the main obstacle here is that DCs
represent only around 1% to 3% of peripheral blood mononu-
clear cells (PBMCs). This has, therefore, prompted research-
ers to use other model systems for studying mDC biology. For
instance, DCs can be generated in vitro from peripheral blood
monocytes by culturing them for six days in the presence of
interleukin (IL)-4 and granulocyte-macrophage colony stim-
ulating factor (GM-CSF). Under such culture conditions, cells
acquire an immature DC morphology and express DC differ-
entiation antigens [4]. These monocyte-derived DCs
(moDCs) are routinely used as an mDC model in DC research.
Several human monocytic cell lines are also available, includ-
ing U937, THP-1, MUTZ-3, HL-60, KG1 and MM6, and some
of these have been shown to be able to differentiate into DC-
like cells [5-9]. KG1 cells, which acquire a DC-like phenotype
after stimulation with phorbol 12-myristate 13-acetate (PMA)
and ionomycin [6], are probably the most widely used in DC
research. PMA- and ionomycin-stimulated KG1 cells show
typical DC morphology and become adherent with long neur-
ite processes. They also show up-regulation of major histo-
compatibility (MHC) class I and II molecules, co-stimulatory
molecules and DC-specific markers [6]. Furthermore, they
are able to stimulate allogeneic T cell proliferation at levels
similar to PBMC-derived DCs [6]. It has also been shown that
KG1 cells are able to cross-present exogenous antigen to
CD8+ T cells and display similar regulation of MHC class II
trafficking to DCs [8]. Therefore, KG1 cells are considered to
be a good model system to study human DC biology.
Despite the extensive use of both moDC and KG1 cells as mDC
models, their similarity to peripheral blood DCs is yet to be
properly defined. This study aims to assess the suitability of
both moDC and KG1 cells as model cells for peripheral blood
DCs by comparing their proteomes in relation to their surface
phenotypes, cytokine profiles and T cell activation ability.
Results and discussion
DCs are sentinels of the immune system and play a pivotal
role in bridging innate immunity with the adaptive immune
response. Given the scarcity of peripheral blood DCs and the
ethical and technical difficulties involved in obtaining tissue-
derived DCs from human sources, investigators have resorted
to using different model systems for studying DC biology.
Although moDC and KG-1 cells are routinely used as mDC
models [8,10,11], a thorough comparison of these cells has not
yet been carried out. A number of phenotypic and functional
comparisons have previously been made between mDCs and
moDCs [12] and moDCs and KG-1 cells [13], but no studies
have compared the proteomes of all three cell types. In this
study we compare the proteomes of mDCs, moDCs and KG-1
cells, and then attempt to relate this to the functional proper-
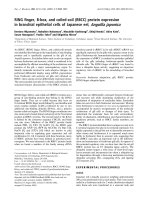
ties of these cells. Figure 1 shows the workflow and the way in
which each cell population was generated or separated.
Dendritic cell proteomes
Proteomic data are scarce in relation to DC biology, and
where available they only focus on moDCs [14-16]. Others
have focused on gene expression, as well as obtaining some
proteomic data, in monocytes and moDCs [17-19]. The
present study compared the whole cell proteome of immature
mDCs, moDCs and KG-1 cells. Clearly, a major challenge in
proteomic studies of DCs is obtaining enough protein for per-
forming two-dimensional electrophoresis. This limitation
was partly overcome by using a large volume of blood
(approximately 120 ml) for cell separation. We also pooled
whole cell lysates of DCs from seven individuals to obtain suf-
ficient quantities of protein and to eliminate inter-individual
variations. We found that peripheral blood mDCs have six-
and five-fold lower protein content per cell than moDCs and
KG-1 cells, respectively (data not shown). Unfortunately, the
low numbers of mDCs in peripheral blood (approximately 1%
of PBMCs), together with their lower protein content, meant
that, despite pooling samples, we were able to run only dupli-
cate gels for mDCs.
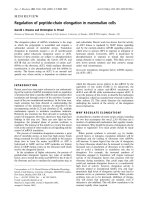
Figures 2 and 3 show three representative two-dimensional
gel images of the different cell types. Gel images were ana-
lyzed using PDQuest software and all images were normalized
before any comparisons between gels were made. The total
number of spots in the gels were 661, 619, and 770 for mDCs,
moDCs and KG-1 cells, respectively. To analyze the compara-
bility of gels, the densities of spots matched in all three gels
were plotted and a correlation coefficient value was calcu-
lated. The proteome of mDCs showed different levels of simi-
larity compared with those of moDCs and KG-1 cells
(correlation coefficient 0.68 and 0.62, respectively) (Figure
4). Duplicate gels of mDCs were reproducible (correlation
coefficient >0.90), as were triplicate gels of moDC and KG-1
Genome Biology 2007, Volume 8, Issue 3, Article R30 Horlock et al. R30.3
comment reviews reports refereed researchdeposited research interactions information
Genome Biology 2007, 8:R30
cells. Figure 5 shows an overlay of Gaussian images of mDCs,
moDCs and KG-1 cells.
Thirty-five spots were up-regulated more than four-fold in
mDCs compared with the DC models, and fifty were down-
regulated by the same amount (Table 1). A number of differ-
entially expressed proteins, which appeared to be more than
two-fold different in intensity (either up- or down-regulated)
in the DC models compared to mDCs, were excised from the
gels and subjected to trypsin digestion and MALDI-TOF
(matrix-assisted laser desorption/ionisation-time of flight)
mass spectrometric analysis; Table 2 shows the correspond-
ing protein data. The factor of difference was calculated by
dividing the intensity of the protein spot in mDCs by that of
the corresponding spot in moDCs or KG-1 cells. Eighteen
spots were successfully identified using MALDI-TOF mass
spectrometry. These proteins are known to be involved in a
wide spectrum of biological processes, including functions
related to cell integrity and metabolism (Table 2).
The majority of the proteins that showed higher levels of
expression in mDCs are known to be involved in cell growth
and maintenance, including FGG, ubiquinol cytochrome c
reductase, glutathione S transferase, nuclease isoform sm3
and annexin A1. Some of these differentially expressed pro-
teins also appear to be involved in DC maturation. Pereira et
al. [15] have shown higher expression of FGG in the proteome
of immature moDCs compared to mature moDCs. Further-
more, fascin and actin, which showed substantially lower
expression (8- and 16-fold, respectively) in mDCs compared
with both DC models, are known to play important roles in
maintaining cell structure and in the formation of immuno-
logical synapses between DCs and T cells [20-22]. Al-Alwan et
al. [21] have previously shown that increased fascin expres-
sion correlates with DC maturation state, and recent work
supports this, suggesting that fascin is a mature DC marker
[23]. This, together with our data on FGG expression, sug-
gests that, at least in their resting state, mDCs have a less
mature phenotype compared to moDCs and KG-1 cells.
Cell culture work-flowFigure 1
Cell culture work-flow. Overview of the methods used for isolation/generation of mDCs, moDCs and DC-like KG-1 cells.
Peripheral blood
PBMCs
CD19 –v
e c
ells
CD19 depletionCD19+ve cells =
waste
CD1c selection
CD1c+ve mDC
(
immature
)
CD
1c-v
e cells
CD
14+ ce
ll
s
mo
CD14 selec
t
ion
moDC
(
immature
)
6 days culture
w
ith GM-
C
SF +
IL-4
Mature DC
(
mDC
,
moDC
,
KG-1
)
Immature DC
(
mDC
,
moDC
,
KG-1
)
Stimulate with PMA +
ionomycin for 24hrs
DC-like KG-1 cells
(
immature
)
KG-1 cells
CD14-ve
cells
=
waste
Stimulate with
LPS for 24hrs
R30.4 Genome Biology 2007, Volume 8, Issue 3, Article R30 Horlock et al. />Genome Biology 2007, 8:R30
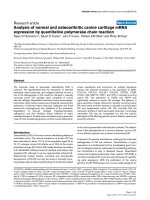
Dendritic cell lysate ELISA
To confirm the proteomics data, we used a capture ELISA to
assess the relative expression of five proteins that had an
induction factor greater than two, namely actin related pro-
tein 2/3 complex 2 (ARPC2), phosphoglucomutase 1 (PGM1),
fascin, FGG and carbonic anhydrase 2 (CAH2) (Table 2). The
pattern obtained was in general agreement with the pro-
teomes obtained for each of the three cell types. Thus, as
expected, ARPC2, PGM1, fascin and CAH2 were found to be
lower in mDCs compared to the two models, whereas FGG
was higher (Figure 6).
Cell surface marker expression
We compared the three cell types by studying their surface
phenotypes. Immature cells were cultured in the presence of
lipopolysaccharide (LPS) for 24 h to produce a mature cell
type. The cell markers used for characterization were CD11c,
CD40, CD62L, CD80, CD83, CD86, CD206, CD209, HLA DR
and Toll-like receptor (TLR)-4, which have all been reported
to be found on dendritic cells [4,24].
As with our proteomic data, cell surface marker expression
suggested that immature mDCs expressed lower levels of the
usual DC maturation markers compared with both moDCs
and KG-1 cells. The mDC models, moDcs and KG-1 cells,
expressed significantly higher levels of CD11c, CD40, CD80,
CD83 and CD209 than mDCs (Figure 7). However, mDCs
showed significant up-regulation of the classic DC maturation
markers CD40, CD80, CD83 and CD86 after 24 h stimulation
with LPS; levels of these markers were more than ten-fold
higher in mature compared to immature cells. The mDC mod-
els also showed up-regulation of these markers, but to a lesser
extent (more than three-fold). The expression of cell surface
markers on mature KG-1 cells was lower than on both mDCs
and moDCs, with CD11c, CD40, CD80 and CD86 being
expressed at significantly (p < 0.05) lower levels than on
mDCs (Figure 7).
Myeloid DCs showed a more mature phenotype after stimula-
tion with LPS (as shown by higher expression of CD40, CD80,
CD83 and CD86) compared with moDCs and KG-1 cells.
Interestingly, the mannose receptor (CD206), which has
important functions in endocytosis, antigen recognition and
Figure 2
(a) mDC (661 spots)
kDa
250
01
(b) moDC (619 spots)
kDa
250
10
(c) KG-1 (770 spots)
kDa
250
pH 5 8
10
Two-dimensional electrophoresis gelsFigure 2
Two-dimensional electrophoresis gels. Three representative two-
dimensional gel images of (a) mDCs, (b) moDCs and (c) KG1 cells.
Whole cell lysate protein (30 μg) was applied to immobilized pH gradient
strips (pH 5-8), subjected to isoelectric focusing and separated on 10% to
20% polyacrylamide gel before silver staining. Images were analyzed using
PDQuest and normalized by total quantity in valid spots. Highlighted spots
were excised and protein identifications attempted using MALDI-TOF
mass spectrometry. Boxed areas are shown in detail in Figure 3. Further
gel information and protein identifications are shown in Table 2. The
experiment was repeated three times (two times in the case of mDCs)
with similar results.
Genome Biology 2007, Volume 8, Issue 3, Article R30 Horlock et al. R30.5
comment reviews reports refereed researchdeposited research interactions information
Genome Biology 2007, 8:R30
binding and MHC class II presentation [25-27], was only
detectable on moDCs and was down-regulated by 4-fold after
stimulation with LPS for 24 h; only negligible levels were
found on mDCs and KG-1 cells. This would, therefore, suggest
that in in vitro assays, moDCs could bind and internalize cer-
tain antigens, particularly glycoproteins, more efficiently.
These findings are in keeping with those of Hajas et al. [13]
showing that moDCs express much higher levels of CD206
than KG-1 cells and they could internalize antigens relatively
more efficiently. The expression of DC-SIGN (DC-specific
intercellular adhesion molecule-3-grabbing non-integrin or
CD209) was low on all three cell types, but significantly
higher on immature moDCs and KG-1 cells compared with
mDCs.
Our finding of negligible levels of TLR4 on all three cell types
is somewhat different from those of others [28,29] who found
no expression of TLR4 on mDCs, but did show expression on
moDCs. However, there are studies showing TLR4 expression
by both mDCs and moDCs, but not on pDCs [30]. This dis-
crepancy in data could have been caused by the use of differ-
ent monoclonal antibodies and experimental conditions.
Cytokine expression profile
Peripheral blood mDCs were found to express significantly
higher levels of key inflammatory (IL-1β, IL-6 and IL-8) and
regulatory (IL-10) cytokines, compared to moDCs and KG-1
cells. Levels of IL-1β, IL-6, IL-8 and IL-10 were dose depend-
ent, and following 24 h culture with either 50 or 100 pg/ml
LPS were significantly higher in mDCs than in moDC and KG-
1 cells (Figure 8). The IL-6, IL-10 and IL-12 data are at vari-
ance with a previous study [12], but this may be due to the use
of different stimuli (for example, intact Escherichia coli
rather than LPS), culture conditions and cytokine detection
method by the authors. This pattern of cytokine production
clearly makes mature mDCs more efficient in the cross-talk
with T cells [31,32] and other cells of the innate immune sys-
tem (for example, natural killer cells), as well as in exerting
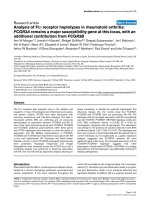
Detailed view of two-dimensional gelsFigure 3
Detailed view of two-dimensional gels. Detailed areas of the mDCs, moDCs and KG-1 gels. The areas correspond to boxed areas in Figure 2.
mDC moDC KG-1
mDC moDC KG-1
mDC moDC KG-1
mDC moDC KG-1
R30.6 Genome Biology 2007, Volume 8, Issue 3, Article R30 Horlock et al. />Genome Biology 2007, 8:R30
inflammatory and/or regulatory effects mediated through
cytokine production. This again is in line with our proteomic
data suggesting that mDCs have a less mature phenotype, at
least in their resting state, compared to the two DC models,
moDCs and KG-1 cells [33].
Functional analysis
Having demonstrated that unstimulated moDCs have a more
mature phenotype than freshly isolated mDCs, as shown by
proteomics (for example, lower FGG and higher fascin) and
surface marker expression (higher CD83), we then proceeded
to assess the endocytic and T cell stimulatory abilities of the
DCs using dextran uptake and autologous mixed leukocyte
reaction, respectively. moDCs were found to be better in
endocytosis (Figure 9) and T cell activation (Figure 10) com-
pared to mDCs, and this is in keeping with their more
advanced maturation status. Others have shown [12] that,
upon stimulation, both mDCs and moDCs are equally effi-
cient in autologous T cell activation, which is in agreement
with our finding that mDCs acquire a fully mature phenotype
after LPS stimulation (Figure 7).
Conclusion
Despite the general similarities between mDCs and the two
DC model systems, moDCs and KG-1 cells, our findings iden-
tified important differences between the proteomes of these
cells, and the findings were confirmed by ELISA detection of
a selection of proteins. These differences were particularly
noticeable with proteins involved in cell growth and
maintenance, as well as those involved in cell-cell interaction,
cell integrity and maturation. The scarcity of peripheral DCs
meant that we were not able to focus on less abundant pro-
teins in the current study, which could identify differentially
expressed proteins involved in other cell functions. The func-
tional relevance of differentially expressed proteins was con-
firmed by analysis of surface marker expression, cytokine
profile, endocytic and T cell activation abilities of the cells,
again suggesting differences in the maturation status between
mDCs and the DC models. These observations have impor-
tant functional implications, particularly in relation to DC-T
cell interactions, the so-called immunological synapse, and,
therefore, need to be considered when interpreting data
obtained from model DC systems. This study clearly shows
the value of the proteomic approach as a tool for studying the
biology of immune cells.
Materials and methods
Cell cultures and stimulation
Heparinized whole blood from healthy volunteers (obtained
with prior consent and Ethical Committee approval) was used
for separation of PBMCs on a Histopaque density gradient
(HISTOPAQUE-1077, Sigma, Poole, UK). CD1c
+
peripheral
DCs were isolated using the CD1c dendritic cell isolation kit
from Miltenyi Biotech (Bisley, UK). Briefly, this involved
depleting PBMCs of CD19
+
B cells followed by positive selec-
tion of CD1c
+
cells. CD14
+
monocytes were isolated by positive
selection from the CD1c
-
cell fraction, and immature
CD1a
+
CD83
-
moDCs were generated as previously described
[24]. Briefly, this involved culturing CD14
+
monocytes in the
presence of IL-4 (250 IU/ml; R&D systems, Oxford, UK) and
GM-CSF (50 ng/ml; R&D systems) for six days. Cells were
cultured at 1 × 10
6
/ml in RPMI 1640 medium (Sigma) supple-
mented with 2 mM L-glutamine, 100 U/ml penicillin, 100 U/
ml streptomycin (Gibco Life Technologies, Paisley, UK) and
10% (v/v) fetal calf serum (FCS; Harlan Sera-Lab,
Comparison of matched spots in all three cell typesFigure 4
Comparison of matched spots in all three cell types. A comparison of
mDCs with (a) moDCs and (b) KG-1 cells is shown by plotting the
quantity of each spot in one gel (x axis) with the quantity of each spot in
the second gel (y axis). The regression line generated from the plot is
shown in green, and spots that fall between the red and blue lines are
within two-fold higher or lower in either of the gels. A correlation
coefficient was obtained from the regression line.
(a)
Regression line
moDC (i) or KG1 (ii)
mDC
Spots falling outside the red
and blue lines are greater than
four-fold different between the
two gels
(b)
Genome Biology 2007, Volume 8, Issue 3, Article R30 Horlock et al. R30.7
comment reviews reports refereed researchdeposited research interactions information
Genome Biology 2007, 8:R30
Loughborough, UK) at 37°C in 5% CO
2
. On day 3, cultured
cells were fed with fresh medium containing relevant
cytokines.
The human monocytic cell line KG1 was purchased from
ECACC (Salisbury, UK). Cells were maintained at 0.35 × 10
6
/
ml in Iscoves modified Dulbecco's medium (Sigma) supple-
mented with 2 mM L-glutamine, 100 U/ml penicillin, 100 U/
ml streptomycin (Gibco Life Technologies) and 10% (v/v)
FCS (Harlan Sera-Lab) at 37°C in 5% CO
2
. Cells were stimu-
lated with 10 ng/ml PMA and 100 ng/ml ionomycin (both
from Sigma) for 24 h, as described previously [6].
Immature peripheral mDCs, immature moDCs and DC-like
KG1 cells were cultured in 48-well culture plates at 0.25 × 10
6
cells/ml. Four conditions were set up in parallel, stimulating
cells with 0, 10, 50 or 100 pg/ml LPS (Sigma). After 24 h, 250
μl of supernatant was collected and frozen at -80°C, and cells
were harvested for cell surface marker staining.
Proteomics
Two-dimensional electrophoresis
Immature DC like KG1 cells, moDCs and mDCs were har-
vested and resuspended in lysis buffer containing 7 M urea
(Fisher Scientific, Loughborough, UK), 2 M thiourea (Sigma),
4% 3- [(3-Cholamidopropyl)dimethylammonio]-1-pro-
panesulfonate (CHAPS) (Fisher Scientific), 50 mM dithioth-
reitol (DTT; Fisher Scientific), 5 mM TBP (Bio-Rad, Hercules,
USA), 0.5% carrier ampholytes (Invitrogen, Paisley, UK), 1×
protease inhibitor (Amersham, Little Chalfont, UK), 150 U/
ml benzonase (Novagen, Merck biosciences, Nottingham,
UK) and a trace of bromophenol blue (Sigma). Samples were
frozen at -80°C until processing. Cell lysates from seven indi-
viduals were combined and a protein concentration assay (2D
Quant Kit, Amersham) was carried out. Samples of 30 μg
Overlaid gel imagesFigure 5
Overlaid gel images. Gaussian images of mDCs were overlaid with those of either (a) moDCs or (b) KG-1 cells. This reveals differences in the proteomes,
with some unique spots.
(a) (b)
Table 1
Summary of gel spot data
Cell type Total spots Matched spots No. of spots >4-fold higher in mDCs No. of spots <4-fold lower in mDCs
mDC 661 661 NA NA
moDC 619 550 35 50
KG-1 770 562 60 114
NA, not applicable.
R30.8 Genome Biology 2007, Volume 8, Issue 3, Article R30 Horlock et al. />Genome Biology 2007, 8:R30
were made up to 320 μl with lysis buffer, vortexed for 5 min-
utes at room temperature and centrifuged at 14,000 rpm for
30 minutes.
Immobilised pH gradient (IPG) strips (Bio-Rad) were pas-
sively rehydrated by the protein samples at 20°C for approxi-
mately 17 h. A low voltage run at 50 V was then performed for
6 h. Isoelectric focusing was run with the following condi-
tions: rapid ramping 250 V for 15 minutes, 10,000 V for 3 h
followed by total 60,000 V/h and a subsequent 500 V hold.
IPG strips were equilibrated for 30 minutes in equilibration
buffer, containing 6 M urea, 2% SDS, 0.05 M Tris and 20%
glycerol (Fisher Scientific) for 15 minutes with 2% DTT and 15
minutes with 2.5% iodoacetamide (Bio-Rad). The second
dimension separation was carried out on precast vertical 10%
to 20% SDS-polyacrylamide gels (BioRad). Gels were typi-
cally run at 20 mA per gel for 18 h. Gels were stained using the
Dodeca Silver Stain Kit (Bio-Rad).
Gel imaging and analysis
Gels were scanned on a GS-800 calibrated imaging densitom-
eter (Bio-Rad). Gel images were analyzed using PDQuest gel
analysis software version 7.1 (Bio-Rad). Spots were
automatically detected, and then visually checked for unde-
tected or incorrectly detected spots. All images were normal-
ized according to total quantity in valid spots in each gel
before any comparisons were made.
Mass spectrometry
In gel digestion
Gel pieces were excised and placed in a 96-well plate, then
loaded onto a MassPrep robotic liquid handling system
(Waters Corporation, Elstree, UK). This was used to destain
gel pieces, reduce and alkylate cysteine residues using DTT
and iodoacetamide, carry out an in-gel tryptic digest and
extract the resulting peptide mixture into a 96-well PCR plate.
The extracted peptide mixture was manually desalted using
C18 loaded zip-tips (Millipore, Watford, UK). We routinely
spotted 2 μl onto sample wells of a stainless steel MALDI tar-
get plate previously spotted with 1 μl matrix solution, com-
prising 1 mg/ml α-cyano-4-hydroxycinnaminic acid (Sigma)
in 50% acetonitrile, 50% ethanol and an internal standard,
adeno corticotophic hormone (Sigma), at a final concentra-
tion of approximately 100 fmol/μl in 0.1% formic acid (Romil,
Table 2
Identifications of differentially expressed spots in mDCs, moDCs and KG-1 cells using MALDI-TOF mass spectrometry
Spot no. Protein identification Accession no.
(Swiss-Prot)
Induction factor*
(mDC/moDC)
Induction factor*
(mDC/KG-1)
Theoretical
pI/Mr
Sequence
coverage (%)
MASCOT
score
Biological
process
†
1 Fibrinogen γ chain P02679 8.60 3.28 5.37/51,511.66 17 91 1,8,12,13
2 Ubiquinol-cytochrome-c-reductase
complex core protein 1
P31930 24.41 21.01 5.94/52,618.79 13 58 1,2
3 - - 8.05 -2.27 -
4 - - Not in mo 21.06 -
5 Glutathione S-transferase P P09211 2.49 1.42 5.44/23,224.64 40 102 1, 2, 9
6 L-lactate dehydrogenase B chain P07195 1.70 -1.28 5.72/36,507.30 33 175 2
7- - Not in m Not in m -
8 - - -4.06 9.51 -
9 Pyridoxal kinase O00764 Not in m Not in m 5.75/35,102.30 22 96 2
10 Nuclease isoform Sm3 P13717 1.54 2.01 6.95/28,944.65 56 191 1, 2
11 Annexin A1 P04083 1.43 2.26 6.64/38,583.05 59 202 1, 4, 5, 7, 9
12 Fructose-1,6-bisphosphatase P09467 -14.34 2.62 6.54/36,818.12 48 205 1, 2
13 Fascin Q16658 -8.78 -7.87 6.81/54,398.81 23 133 4,5,6
14 Phosphoglycerate mutase I P18669 -1.37 -2.21 6.75/28,672.74 47 143 1, 2
15 Triosephosphate isomerase P60174 1.02 -1.14 6.51/26,538.30 56 209 2
16 Actin related protein 2/3 complex
subunit
O15144 -16.74 -20.03 6.84/34,333.02 19 91 4,5,6, 9
17 Carbonic anhydrase II P00918 -15.63 -10.99 6.86/29,114.86 29 88 1, 2
18 Phosphoglucomutase I Q16106 -33.05 -2.51 5.33/11,328.66 28 40 2
19 Cystatin B P04080 -30.68 -2.13 6.96/11,139.59 34 61 1, 2, 9
20 - - -7.27 -3.69 -
21 - - -3.03 -22.70 -
22 Chain A, crystal structure of human Dj-1 Q99497 1.85 -2.02 6.33/19,891.05 36 89 1, 7
23 Proteasome beta 2 subunit Q9BWZ9 -1.07 -5.82 6.52/22,840.06 26 77 1,2,9
24 dUTP pyrophosphatase isoform 2 P33316 Not in m or mo Not in m or mo 9.65/26,706.39 35 93 1,2, 9
MASCOT scores >64 were taken to be significant (p < 0.05). *Induction factor corresponds to the factor of difference between spot volume in
mDCs compared with the respective mDC model.
†
Biological process: 1, cell growth/maintenance; 2, metabolism; 3, cell communication; 4,
morphogenesis; 5, response to external stimulus; 6, cell motility; 7, response to stress; 8, circulation; 9, regulation of cellular processes; 10, cell
differentiation; 11, death; 12, cell death; 13, coagulation; 14, homeostasis.
Genome Biology 2007, Volume 8, Issue 3, Article R30 Horlock et al. R30.9
comment reviews reports refereed researchdeposited research interactions information
Genome Biology 2007, 8:R30
Cambridge, UK). Samples were left to air dry and the plate
placed in the MALDI mass spectrometer.
MALDI-TOF mass spectrometry analysis
Samples were analyzed using a MALDI TOF mass spectrom-
eter (Waters Corporation) operating at a resolution of greater
than 10,000 full width at half maximum in reflectron mode.
Spectra were acquired at 5 Hz using a nitrogen laser (337 nm
wavelength). Typically, ten data collection events were com-
bined to generate each spectrum. Data acquisition was
achieved by randomly sampling from the target well.
Mass spectrometry data analysis
Peak lists were entered into MASCOT PMF [34] and Expasy
[35] database search engines. Search parameters included a
peptide mass accuracy tolerance of 0.2 Da and allowed for
modifications such as alkylation of cysteine during the tryptic
digest procedure and the possible formation of methionine
sulfoxide.
ELISA
Immature mDCs, moDCs and KG1 cells were generated as
described earlier. Cells were harvested and washed three
times in 1 ml of 0.05% PBS/Tween blocking buffer (300 g for
5 minutes). Cell pellets were resuspended in 500 μl carbonate
buffer (pH 8.6, 7.6 mM Na
2
CO
3
, 142 mM NaHCO
3
) and soni-
cated for 5 minutes. The sonicated cells were labeled by
incubation with 20 μg digoxigenin (Roche, Basel, Switzer-
land) for 1 h at room temperature. The remaining free digox-
iginin was neutralized with 150 mM Tris followed by dialysis
against PBS (pH 7.2) overnight. The protein concentration for
each cell type was measured at 280 nm using a Nanodrop
(Agilent Technologies, Berkshire, UK). In the ELISA, anti-
PGM1 (Abnova, Taipei, Taiwan), anti-fascin (Santa Cruz Bio-
technologies, Santa Cruz, CA, USA), anti-CAH2 (Abnova),
anti-FGG (Abnova) and anti-APRC2 (Abnova) antibodies (10
μl/ml) were diluted in carbonate buffer and plated onto a
Nunc Immobilizer™ Amino 96-well plate n amino-reactive
96-well (Nunc, Roskilde, Denmark). Plates were incubated
for 2 h at room temperature with shaking at 200 rpm. Liquid
was removed from the plates and the plates were washed
three times with PBS/Tween. The plate was incubated with
100 μl of each cell suspension (10 μg/ml total protein) for 2 h
at room temperature. The plate was then washed 3 times with
PBS/Tween and incubated with peroxidase-conjugated poly-
clonal anti-dioxigenin Fab fragment (Roche) at 1:5,000 in 1%
BSA in PBS/Tween at 100 μl per well. Plates were incubated
at room temperature for 1 h and washed 3 times as above.
ABTS
®
Peroxidase Substrate (100 μl at 5 mg/ml) (Roche) was
added to each well and 30 minutes later the absorbance was
measured at 405 nm.
Phenotype and cytokine expression
Cell surface marker expression
The phenotypes of mDCs, moDCs and KG1 cells were ana-
lyzed using a selection of monoclonal antibodies. Mouse
antibodies to human CD11c PE (clone BU15), CD40 PE (clone
MAB89), CD62L FITC (clone DREG56), CD80 FITC (clone
MAB104), CD83 PC5 (clone HB15a), CD86 PE (clone
HA5.2B7), CD206 PE (clone 3.29B1.10) and HLA DR PC5
(clone IMMU-357) were purchased from Coulter Immu-
notech (Luton, UK). Mouse anti-human CD209 PE (clone
DCN46) was purchased from Becton Dickinson (Oxford, UK).
Mouse anti-human TLR4 PE (clone HTA125) was purchased
from Serotec (Oxford, UK).
Cells were stained following 0 h and 24 h culture. Cells were
washed twice in PBS (Gibco, Invitrogen), supplemented with
2% FCS, incubated with antibody for 20 minutes at 4°C,
washed twice and fixed in 0.5% formaldehyde. Samples were
ELISA detection of cell lysate proteinsFigure 6
ELISA detection of cell lysate proteins. Differentially expressed digoxigenin-labeled proteins of mDCs, moDCs and KG-1 cell lysates were captured by
specific antibody coated plates and detected with a polyclonal anti-dioxigenin Fab fragment. Data are representative of two experiments.
0
0.1
0.2
0.3
0.4
0.5
0.6
0.7
0.8
ARPC2 PGM1 Fascin FGG AHP
OD 405 nm
mDC
moDC
KG1
R30.10 Genome Biology 2007, Volume 8, Issue 3, Article R30 Horlock et al. />Genome Biology 2007, 8:R30
analyzed on an EPICS Altra flow cytometer (Beckman Coul-
ter, Luton, UK) within six days of staining. Data were
analyzed using WinMDI version 2.8. [36]. Isotype-matched
irrelevant antibodies were used to verify the staining
specificity.
Cytokine expression
Culture supernatants from 4 independent experiments were
collected after 24 h stimulation with 0, 10, 50 or 100 pg/ml
LPS. Supernatants for each condition were pooled and a
cytokine bead array (CBA; Inflammation kit, Becton Dickin-
son) was performed in triplicate.
Endocytosis assay
For the analysis of the endocytic activity of the three cell
types, 1 × 10
5
cells were incubated with FITC-dextran (40,000
MW; Sigma) for 1 h at 37°C. As a control, 1 × 10
5
cells were
cooled to 4°C prior to incubation with dextran at 4°C for 1 h.
Cells were washed three times and immediately analyzed on a
FACS EPICS Altra cytometer.
Phenotypic comparison of cellsFigure 7
Phenotypic comparison of cells. The expression of cell surface markers on (a) immature and (b) mature mDCs, moDCs and KG1 cells. Immature cells
were freshly isolated mDCs, moDCs, on day 6 of culture, and KG-1 cells stimulated with PMA and ionomycin for 24 h. Cells were matured in the
presence of LPS (100 pg/ml) for 24 h. Shown are the mean fluorescence intensities of four individual experiments. Background levels of staining were
determined using isotype controls. A Student t-test was carried out to determine the significance of the data (*p < 0.05).
(a) Immature (0 h)
0
100
200
300
400
500
600
700
800
900
C
D
1
1
c
C
D
4
0
C
D
6
2
L
C
D
8
0
C
D
8
3
C
D
8
6
C
D
2
0
6
C
D
2
0
9
HL
A
D
R
TL
R
4
mDC
moDC
KG-1
*
**
*
*
*
**
(b) Mature (24 h + 100pg LPS)
0
100
200
300
400
500
600
700
800
900
C
D1
1
c
C
D
4
0
C
D
6
2L
C
D8
0
C
D
8
3
C
D
8
6
C
D
2
0
6
C
D
2
0
9
H
L
A D
R
T
L
R
4
mDC
moDC
KG-1
**
*
*
*
MFI MFI
Genome Biology 2007, Volume 8, Issue 3, Article R30 Horlock et al. R30.11
comment reviews reports refereed researchdeposited research interactions information
Genome Biology 2007, 8:R30
T cell activation assay
Human PBMCs were obtained as described above. Un-
touched T cells were then purified by negative selection (Pan
T cell isolation kit, Miltenyi Biotech) to a purity of >95%. Cells
were resuspended in RPMI 1640 medium (Sigma)
supplemented with 2 mM L-glutamine, 100 U/ml penicillin,
100 U/ml streptomycin (Gibco Life Technologies) and 10%
(v/v) FCS (Harlan Sera-Lab). Autologous T cells (1 × 10
5
)
were cultured in the absence (medium alone) or presence of 1
× 10
4
irradiated (3,000 rad
137
Cs) immature mDCs and
moDCs in 96-well U-bottomed microplates (Nunc) in 200 μl
of medium per well. Cells were cultured for 72 h followed by
an 18 h pulse with 1 μCi (0.037 MBq) of [
3
H]thymidine
(Amersham Life Science, Buckingham, UK). Cells were trans-
ferred to a Unifilter-96 plate GF/C using a cell harvester and
[
3
H]thymidine incorporation was measured in scintillation
fluid (Microscint O) using a sinctillation counter (Canberra
Packard Limited, Pangbourne, UK). All determinations were
carried out in quadruplicate.
Cytokine expression profiles of cellsFigure 8
Cytokine expression profiles of cells. Cytokine production by mDCs and the DC models in response to LPS. Cytokine concentrations were measured by
CBA and analyzed using the cytometric CBA analysis software; with further analysis in Excel. Data shown are the means of triplicate experiments. A
Student t-test was carried out to determine the significance of the data (*p < 0.05, **p < 0.01).
IL-1
β
0
20
40
60
80
0 10 50 100
LPS pg/m l
pg/ml
mDC
moDC
KG-1
IL-6
0
200
400
600
800
01050100
LPS pg/m l
pg/ml
mDC
moDC
KG-1
IL-8
0
1000
2000
3000
4000
5000
01050100
LPS pg/m l
pg/ml
mDC
moDC
KG-1
IL-10
0
10
20
30
40
50
0 10 50 100
LPS pg/m l
pg/ml
mDC
moDC
KG-1
IL-12
0
5
10
15
0 10 50 100
LPS pg/m l
pg/ml
mDC
moDC
KG-1
TNF-
α
0
5
10
15
20
0 10 50 100
LPS pg/m l
pg/ml
mDC
moDC
KG-1
** **
**
*
**
** **
**
*
***
R30.12 Genome Biology 2007, Volume 8, Issue 3, Article R30 Horlock et al. />Genome Biology 2007, 8:R30
Flow cytometric analysis
Cell surface marker expression was analyzed using WinMDI
version 2.8 [36] and 7,000 live cells were gated for each anal-
ysis. The cytokine bead array data were analyzed using the BD
CBA software (Becton Dickinson).
Statistical analysis
The paired Student t-test was used to compare surface
marker expression and cytokine expression between mDCs,
moDCs and KG-1 cells. Data with p values of less than 0.05 or
0.01 were taken to be significant.
Acknowledgements
The authors would like to thank John Keyte, Kevin Bailey and Matt Carlile
(School of Biomedical Sciences, University of Nottingham) for their techni-
cal assistance with regard to mass spectrometry. This work was supported
by the BRC (Nottingham University) and in part by the Nasal Research
Fund (Nottingham; Grant Z50712).
References
1. Steinman RM, Hawiger D, Nussenzweig MC: Tolerogenic
dendritic cells. Annu Rev Immunol 2003, 21:685-711.
2. Boonstra A, Asselin-Paturel C, Gilliet M, Crain C, Trinchieri G, Liu YJ,
O'Garra A: Flexibility of mouse classical and plasmacytoid-
derived dendritic cells in directing T helper type 1 and 2 cell
development: dependency on antigen dose and differential
toll-like receptor ligation. J Exp Med 2003, 197:101-109.
3. Dzionek A, Fuchs A, Schmidt P, Cremer S, Zysk M, Miltenyi S, Buck
DW, Schmitz J: BDCA-2, BDCA-3, and BDCA-4: three mark-
ers for distinct subsets of dendritic cells in human peripheral
blood. J Immunol 2000, 165:6037-6046.
4. Sallusto F, Lanzavecchia A: Efficient presentation of soluble anti-
gen by cultured human dendritic cells is maintained by gran-
ulocyte/macrophage colony-stimulating factor plus
interleukin 4 and downregulated by tumour necrosis factor
alpha. J Exp Med 1994, 179:1109-1118.
5. Masterson AJ, Sombroek CC, De Gruijl TD, Graus YM, van der Vliet
HJ, Lougheed SM, van den Eertwegh AJ, Pinedo HM, Scheper RJ:
MUTZ-3, a human cell line model for the cytokine-induced
differentiation of dendritic cells from CD34+ precursors.
Blood 2002, 100:701-703.
6. St Louis DC, Woodcock JB, Franzoso G, Blair PJ, Carlson LM, Murillo
M, Wells MR, Williams AJ, Smoot DS, Kaushal S, et al.: Evidence for
distinct intracellular signalling pathways in CD34+ progeni-
tor to dendritic cell differentiation from a human cell line
model. J Immunol 1999, 162:3237-3248.
7. Musso T, Calosso L, Zucca M, Millesimo M, Ravarino D, Giovarelli M,
Malavasi F, Ponzi AN, Paus R, Bulfone-Paus S: Human monocytes
constitutively express membrane-bound, biologically active,
and interferon-gamma-upregulated interleukin-15. Blood
1999, 93:3531-3539.
8. Ackerman AL, Cresswell P: Regulation of MHC class I transport
in human dendritic cells and the dendritic-like cell line KG-1.
J Immunol 2003, 170:4178-4188.
9. Reischl IG, Dubois GR, Peiritsch S, Brown KS, Wheat L, Woiset-
schlager M, Mudde GC: Regulation of Fc epsilonRI expression
on human monocytic cells by ligand and IL-4. Clin Exp Allergy
2000, 30:1033-1040.
10. Cejas PJ, Carlson LM, Kolonias D, Zhang J, Lindner I, Billadeau DD,
Boise LH, Lee KP: Regulation of RelB expression during the ini-
tiation of dendritic cell differentiation. Mol Cell Biol 2005,
25:7900-7916.
11. Rivino L, Messi M, Jarrossay D, Lanzavecchia A, Sallusto F, Geginat J:
Chemokine receptor expression identifies Pre-T helper (Th)
1, Pre-Th2, and nonpolarized cells among human CD4+ cen-
tral memory T cells. J Exp Med 2004, 200:725-735.
12. Jefford M, Schnurr M, Toy T, Masterman KA, Shin A, Beecroft T, Tai
TY, Shortman K, Shackleton M, Davis ID, et al.: Functional compar-
ison of DCs generated in vivo with Flt3 ligand or in vitro from
blood monocytes: differential regulation of function by spe-
cific classes of physiologic stimuli. Blood 2003, 102:1753-1763.
13. Hajas G, Zsiros E, Laszlo T, Hajdu P, Somodi S, Rethbi B, Gogolak P,
Ludanyi K, Panyi G, Rajnavolgyi E: New phenotypic, functional
and electrophysiological characteristics of KG-1 cells. Immu-
nol Lett 2004, 92:97-106.
14. Watarai H, Hinohara A, Nagafune J, Nakayama T, Taniguchi M,
Yamaguchi Y: Plasma membrane-focused proteomics:
dramatic changes in surface expression during the matura-
tion of human dendritic cells. Proteomics 2005, 5:4001-4011.
15. Pereira SR, Faça VM, Gomes GG, Chammas R, Fontes AM, Covas DT,
Greene LJ: Changes in the proteomic profile during differenti-
ation and maturation of human monocyte-derived dendritic
cells stimulated with granulocyte macrophage colony stimu-
lating factor/interleukin-4 and lipopolysaccharide. Proteomics
2005, 5:1186-1198.
16. Rivollier A, Perrin-Cocon L, Luche S, Diemer H, Strub JM, Hanau D,
Van Dorsselaer A, Lotteau V, Rabourdin-Combe C, Rabilloud T,
Analysis of endocytic activity using a FITC-dextran uptake assayFigure 9
Analysis of endocytic activity using a FITC-dextran uptake assay. Freshly
isolated mDCs, moDCs and KG-1 cells were pulsed with dextran for 1 h
at 37°C and the uptake was measured by flow cytometry. Data represent
average values of three experiments for each cell type.
T cell activation assayFigure 10
T cell activation assay. Autologous T cells were cultured in the presence of
mDCs, moDCs or KG-1 cells in a 1:10 DC:T cell ratio for 3 days, followed
by an 18 h pulse with [
3
H]thymidine. Thymidine incorporation was
measured in a scintillation counter. Data represent the average of
quadruplicate experiments.
0
10
20
30
40
50
60
70
80
90
mDC moDC KG1
Percentage dextran uptake
p < 0.04
p < 0.001
0
100
200
300
400
500
600
mDC moDC T cells
CPM (x 10
2
)
Genome Biology 2007, Volume 8, Issue 3, Article R30 Horlock et al. R30.13
comment reviews reports refereed researchdeposited research interactions information
Genome Biology 2007, 8:R30
Servet-Delprat C: High expression of antioxidant proteins in
dendritic cells: possible implications in atherosclerosis. Mol
Cell Proteomics 2006, 5:726-736.
17. Le Naour F, Hohenkirk L, Grolleau A, Misek DE, Lescure P, Geiger
JD, Hanash S, Beretta L: Profiling changes in gene expression
during differentiation and maturation of monocyte-derived
dendritic cells using both oligonucleotide microarrays and
proteomics. J Biol Chem 2001, 276:17920-17931.
18. Hashimoto S, Suzuki T, Nagai S, Yamashita T, Toyoda N, Matsushima
K: Identification of genes specifically expressed in human
activated and mature dendritic cells through serial analysis
of gene expression. Blood 2000, 96:2206-2214.
19. Granucci F, Vizzardelli C, Pavelka N, Virzi E, Rescigno M, Ricciardi-
Castagnoli P: Transcriptional reprogramming of dendritic
cells by differentiation stimuli. Eur J Immunol 2001,
31:2539-2546.
20. Al-Alwan MM, Rowden G, Lee T, West KA: The dendritic cell
cytoskeleton is critical for the formation of the immunolog-
ical synapse. J Immunol 2001, 166:1452-1456.
21. Al-Alwan MM, Rowden G, Lee T, West KA: Fascin is involved in
the antigen presentaion activity of mature dendritic cells. J
Immunol 2001, 166:338-345.
22. Al-Alwan MM, Liwski RS, Haeryfar SM, Baldridge WH, Hoskin DW,
Rowden G, West KA: Cutting edge: dendritic cell actin
cytoskeletal polarization during immunological synapse for-
mation is highly antigen-dependent. J Immunol 2003,
171:4479-4483.
23. Slukvin II, Vodyanik MA, Thomson JA, Gumenyuk ME, Choi KD:
Directed differentiation of human embryonic stem cells into
functional dendritic cells through the myeloid pathway. J
Immunol 2006, 176:2924-2932.
24. Ghaemmaghami AM, Gough L, Sewell HF, Shakib F: The proteolytic
activity of the major house dust mite allergen Der p 1 condi-
tions dendritic cells to produce less interleukin-12: Th2 bias
determined at the dendritic cell level.
Clin Exp Allergy 2002,
32:1468-1475.
25. Boskovic J, Arnold JN, Stilton R, Gordon S, Sim RB, Rivera-Calzada A,
Wienke D, Isacke CM, Martinez-Pomares L, Llorca O: Structural
model for the mannose receptor family uncovered by
electron microscopy of Endo180 and the mannose receptor.
J Biol Chem 2006, 281:8780-8787.
26. Taylor PR, Gordon S, Martinez-Pomares L: The mannose recep-
tor: linking homeostasis and immunity through sugar
recognition. Trends Immunol 2005, 26:104-110.
27. Taylor PR, Martinez-Pomares L, Stacey M, Lin HH, Brown GD, Gor-
don S: Macrophage receptors and immune recognition. Annu
Rev Immunol 2005, 23:901-944.
28. Duez C, Gosset P, Tonnel AB: Dendritic cells and toll-like recep-
tors in allergy and asthma. Eur J Dermatol 2006, 16:12-16.
29. Kokkinopoulos I, Jordan WJ, Ritter MA: Toll-like receptor mRNA
expression patterns in human dendritic cells and monocytes.
Mol Immunol 2005, 42:957-968.
30. Seya T, Funami K, Taniguchi M, Matsumoto M: Antibodies against
human toll-like receptors (TLRs): TLR distribution and local-
ization in human dendritic cells. J Endotoxin Res 2005,
11:369-374.
31. Banchereau J, Steinman RM: Dendritic cells and the control of
immunity. Nature 1998, 392:245-252.
32. Banchereau J, Briere F, Caux C, Davoust J, Lebecque S, Liu YJ, Pulen-
dran B, Palucka K: Immunobiology of dendritic cells. Annu Rev
Immunol 2000, 18:767-811.
33. Kalinski P, Schuitemaker JH, Hilkens CM, Wierenga EA, Kapsenberg
ML: Final maturation of dendritic cells is associated with
impaired responsiveness to IFN-gamma and to bacterial IL-
12 inducers: decreased ability of mature dendritic cells to
produce IL-12 during the interaction with Th cells. J Immunol
1999, 162:3231-3236.
34. The MASCOT PMF Database [ />search_form_select.html]
35. The ExPASy Proteomics Database [ />tools/aldente/]
36. The WinMDI software Version 2.8 [ />ware.html]