gray hat hacking the ethical hackers handbook phần 7 pptx
Bạn đang xem bản rút gọn của tài liệu. Xem và tải ngay bản đầy đủ của tài liệu tại đây (13.53 MB, 57 trang )
.text:0804874B mov eax, [ebp+arg_0]
.text:0804874E push dword ptr [eax]
.text:08048750 call sub_8057850
.text:08048755 add esp, 10h
yields the following improved disassembly in which we are far less likely to waste time
analyzing any of the three functions that are called.
.text:0804872C push ebp
.text:0804872D mov ebp, esp
.text:0804872F sub esp, 18h
.text:08048732 call ___sys_getuid
.text:08048737 mov [ebp+var_4], eax
.text:0804873A call ___sys_getgid
.text:0804873F mov [ebp+var_8], eax
.text:08048742 sub esp, 8
.text:08048745 mov eax, [ebp+arg_0]
.text:08048748 push dword ptr [eax+0Ch]
.text:0804874B mov eax, [ebp+arg_0]
.text:0804874E push dword ptr [eax]
.text:08048750 call _initgroups
.text:08048755 add esp, 10h
We have not covered how to identify exactly which static library files to use when gen-
erating your IDA sig files. It is safe to assume that statically linked C programs are linked
against the static C library. To generate accurate signatures, it is important to track down
a version of the library that closely matches the one with which the binary was linked.
Here, some file and strings analysis can assist in narrowing the field of operating systems
that the binary may have been compiled on. The file utility can distinguish among vari-
ous platforms such as Linux, FreeBSD, or OS X, and the strings utility can be used to
search for version strings that may point to the compiler or libc version that was used.
Armed with that information, you can attempt to locate the appropriate libraries from a
matching system. If the binary was linked with more than one static library, additional
strings analysis may be required to identify each additional library. Useful things to
look for in strings output include copyright notices, version strings, usage instructions,
or other unique messages that could be thrown into a search engine in an attempt to
identify each additional library. By identifying as many libraries as possible and apply
-
ing their signatures, you greatly reduce the amount of code that you need to spend time
analyzing and get to focus more attention on application-specific code.
Data Structure Analysis
One consequence of compilation being a lossy operation is that we lose access to data
declarations and structure definitions, which makes it far more difficult to understand
the memory layout in disassembled code. As mentioned in Chapter 12, IDA provides
the capability to define the layout of data structures and then to apply those structure
definitions to regions of memory. Once a structure template has been applied to a
region of memory, IDA can utilize structure field names in place of integer offsets within
the disassembly, making the disassembly far more readable. There are two important
steps in determining the layout of data structures in compiled code. The first step is to
Gray Hat Hacking: The Ethical Hacker’s Handbook
318
Chapter 13: Advanced Static Analysis with IDA Pro
319
PART IV
determine the size of the data structure. The second step is to determine how the struc
-
ture is subdivided into fields and what type is associated with each field. The program in
Listing 13-6 and its corresponding compiled version in Listing 13-7 will be used to illus
-
trate several points about disassembling structures.
Listing 13-6
1: #include <stdlib.h>
2: #include <math.h>
3: #include <string.h>
4: typedef struct GrayHat_t {
5: char buf[80];
6: int val;
7: double squareRoot;
8: } GrayHat;
9: int main(int argc, char **argv) {
10: GrayHat gh;
11: if (argc == 4) {
12: GrayHat *g = (GrayHat*)malloc(sizeof(GrayHat));
13: strncpy(g->buf, argv[1], 80);
14: g->val = atoi(argv[2]);
15: g->squareRoot = sqrt(atof(argv[3]));
16: strncpy(gh.buf, argv[0], 80);
17: gh.val = 0xdeadbeef;
18: }
19: return 0;
20: }
Listing 13-7
1: ; int __cdecl main(int argc,const char **argv,const char *envp)
2: _main proc near
3: var_70 = qword ptr -112
4: dest = byte ptr -96
5: var_10 = dword ptr -16
6: argc = dword ptr 8
7: argv = dword ptr 12
8: envp = dword ptr 16
9: push ebp
10: mov ebp, esp
11: add esp, 0FFFFFFA0h
12: push ebx
13: push esi
14: mov ebx, [ebp+argv]
15: cmp [ebp+argc], 4 ; argc != 4
16: jnz short loc_4011B6
17: push 96 ; struct size
18: call _malloc
19: pop ecx
20: mov esi, eax ; esi points to struct
21: push 80 ; maxlen
22: push dword ptr [ebx+4] ; argv[1]
23: push esi ; start of struct
24: call _strncpy
25: add esp, 0Ch
26: push dword ptr [ebx+8] ; argv[2]
27: call _atol
28: pop ecx
29: mov [esi+80], eax ; 80 bytes into struct
30: push dword ptr [ebx+12] ; argv[3]
31: call _atof
32: pop ecx
33: add esp, 0FFFFFFF8h
34: fstp [esp+70h+var_70]
35: call _sqrt
36: add esp, 8
37: fstp qword ptr [esi+88] ; 88 bytes into struct
38: push 80 ; maxlen
39: push dword ptr [ebx] ; argv[0]
40: lea eax, [ebp-96]
41: push eax ; dest
42: call _strncpy
43: add esp, 0Ch
44: mov [ebp-16], 0DEADBEEFh
45: loc_4011B6:
46: xor eax, eax
47: pop esi
48: pop ebx
49: mov esp, ebp
50: pop ebp
51: retn
52: _main endp
There are two methods for determining the size of a structure. The first and easiest method
is to find locations at which a structure is dynamically allocated using malloc or new.
Lines 17 and 18 in Listing 13-7 show a call to malloc 96 bytes of memory. Malloced
blocks of memory generally represent either structures or arrays. In this case, we learn that
this program manipulates a structure whose size is 96 bytes. The resulting pointer is trans-
ferred into the esi register and used to access the fields in the structure for the remainder of
the function. References to this structure take place at lines 23, 29, and 37.
The second method of determining the size of a structure is to observe the offsets
used in every reference to the structure and to compute the maximum size required to
house the data that is referenced. In this case, line 23 references the 80 bytes at the begin
-
ning of the structure (based on the maxlen argument pushed at line 21), line 29 refer
-
ences 4 bytes (the size of eax) starting at offset 80 into the structure ([esi + 80]), and line
37 references 8 bytes (a quad word/qword) starting at offset 88 ([esi + 88]) into the
structure. Based on these references, we can deduce that the structure is 88 (the maxi
-
mum offset we observe) plus 8 (the size of data accessed at that offset), or 96 bytes long.
Thus we have derived the size of the structure by two different methods. The second
method is useful in cases where we can’t directly observe the allocation of the structure,
perhaps because it takes place within library code.
To understand the layout of the bytes within a structure, we must determine the types
of data that are used at each observable offset within the structure. In our example, the
access at line 23 uses the beginning of the structure as the destination of a string copy
Gray Hat Hacking: The Ethical Hacker’s Handbook
320
operation, limited in size to 80 bytes. We can conclude therefore that the first 80 bytes of
the structure are an array of characters. At line 29, the 4 bytes at offset 80 in the structure
are assigned the result of the function atol, which converts an ascii string to a long value.
Here we can conclude that the second field in the structure is a 4-byte long. Finally, at
line 37, the 8 bytes at offset 88 into the structure are assigned the result of the function
atof, which converts an ascii string to a floating-point double value. You may have
noticed that the bytes at offsets 84–87 of the structure appear to be unused. There are
two possible explanations for this. The first is that there is a structure field between the
long and the double that is simply not referenced by the function. The second possibil
-
ity is that the compiler has inserted some padding bytes to achieve some desired field
alignment. Based on the actual definition of the structure in Listing 13-6, we conclude
that padding is the culprit in this particular case. If we wanted to see meaningful field
names associated with each structure access, we could define a structure in the IDA struc-
ture window as described in Chapter 12. IDA offers an alternative method for defining
structures that you may find far easier to use than its structure editing facilities. IDA can
parse C header files via the File | Load File menu option. If you have access to the source
code or prefer to create a C-style struct definition using a text editor, IDA will parse the
header file and automatically create structures for each struct definition that it encoun-
ters in the header file. The only restriction you must be aware of is that IDA only recog-
nizes standard C data types. For any nonstandard types, uint32_t, for example, the
header file must contain an appropriate typedef, or you must edit the header file to con-
vert all nonstandard types to standard types.
Access to stack or globally allocated structures looks quite different than access to
dynamically allocated structures. Listing 13-6 shows that main contains a local, stack allo-
cated structure declared at line 10. Lines 16 and 17 of main reference fields in this local
structure. These correspond to lines 40 and 44 in the assembly Listing 13-7. While we can
see that line 44 references memory that is 80 bytes ([ebp-96+80] == [ebp-16]) after the
reference at line 40, we don’t get a sense that the two references belong to the same struc
-
ture. This is because the compiler can compute the address of each field (as an absolute
address in a global variable, or a relative address within a stack frame) at compile time,
whereas access to fields in dynamically allocated structures must always be computed at
runtime because the base address of the structure is not known at compile time.
Using IDA Structures to View Program Headers
In addition to enabling you to declare your own data structures, IDA contains a large
number of common data structure templates for various build environments, including
standard C library structures and Windows API structures. An interesting example use of
these predefined structures is to use them to examine the program file headers which, by
default, are not loaded into the analysis database. To examine file headers, you must per
-
form a manual load when initially opening a file for analysis. Manual loads are selected
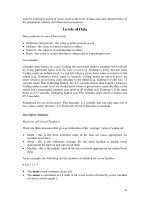
via a checkbox on the initial load dialog box as shown in Figure 13-3.
Manual loading forces IDA to ask you whether you wish to load each section of the
binary into IDA’s database. One of the sections that IDA will ask about is the header sec
-
tion, which will allow you to see all the fields of the program headers including structures
Chapter 13: Advanced Static Analysis with IDA Pro
321
PART IV
such as the MSDOS and NT file headers. Another section that gets loaded only when a
manual load is performed is the resource section that is used on the Windows platform to
store dialog box and menu templates, string tables, icons, and the file properties. You can
view the fields of the MSDOS header by scrolling to the beginning of a manually loaded
Windows PE file and placing the cursor on the first address in the database, which should
contain the ‘M’ value of the MSDOS ‘MZ’ signature. No layout information will be dis
-
played until you add the IMAGE_DOS_HEADER to your structures window. This is
accomplished by switching to the Structures tab, pressing
INSERT, entering IMAGE_DOS_
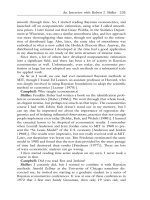
HEADER as the Structure Name, and clicking OK as shown in Figure 13-4.
This will pull IDA’s definition of the IMAGE_DOS_HEADER from its type library into
your local structures window and make it available to you. Finally, you need to return to the
disassembly window, position the cursor on the first byte of the DOS header, and use the
ALT-Q hotkey sequence to apply the IMAGE_DOS_HEADER template. The structure may
initially appear in its collapsed form, but you can view all of the struct fields by expanding
the struct with the numeric keypad
+ key. This results in the display shown next:
HEADER:00400000 __ImageBase dw 5A4Dh ; e_magic
HEADER:00400000 dw 50h ; e_cblp
HEADER:00400000 dw 2 ; e_cp
HEADER:00400000 dw 0 ; e_crlc
HEADER:00400000 dw 4 ; e_cparhdr
HEADER:00400000 dw 0Fh ; e_minalloc
Gray Hat Hacking: The Ethical Hacker’s Handbook
322
Figure 13-3 Forcing a manual load with IDA
Chapter 13: Advanced Static Analysis with IDA Pro
323
PART IV
HEADER:00400000 dw 0FFFFh ; e_maxalloc
HEADER:00400000 dw 0 ; e_ss
HEADER:00400000 dw 0B8h ; e_sp
HEADER:00400000 dw 0 ; e_csum
HEADER:00400000 dw 0 ; e_ip
HEADER:00400000 dw 0 ; e_cs
HEADER:00400000 dw 40h ; e_lfarlc
HEADER:00400000 dw 1Ah ; e_ovno
HEADER:00400000 dw 4 dup(0) ; e_res
HEADER:00400000 dw 0 ; e_oemid
HEADER:00400000 dw 0 ; e_oeminfo
HEADER:00400000 dw 0Ah dup(0) ; e_res2
HEADER:00400000 dd 200h ; e_lfanew
A little research on the contents of the DOS header will tell you that the e_lfanew field
holds the offset to the PE header struct. In this case, we can go to address 00400000 +
200h (00400200) and expect to find the PE header. The PE header fields can be viewed
by repeating the process just described and using IMAGE_NT_HEADERS as the structure
you wish to select and apply.
Quirks of Compiled C++ Code
C++ is a somewhat more complex language than C, offering member functions and
polymorphism, among other things. These two features require implementation details
that make compiled C++ code look rather different than compiled C code when they are
used. First, all nonstatic member functions require a this pointer; and second, polymor
-
phism is implemented through the use of vtables.
NOTE In C++ a this pointer is available in all nonstatic member functions.
This points to the object for which the member function was called and
allows a single function to operate on many different objects merely by
providing different values for this each time the function is called.
Figure 13-4 Importing the IMAGE_DOS_HEADER structure
Gray Hat Hacking: The Ethical Hacker’s Handbook
324
The means by which this pointers are passed to member functions vary from compiler
to compiler. Microsoft compilers take the address of the calling object and place it in the
ecx register prior to calling a member function. Microsoft refers to this calling conven
-
tion as a this call. Other compilers, such as Borland and g++, push the address of the call
-
ing object as the first (leftmost) parameter to the member function, effectively making
this an implicit first parameter for all nonstatic member functions. C++ programs com
-
piled with Microsoft compilers are very recognizable as a result of their use of this call.
Listing 13-8 shows a simple example.
Listing 13-8
demo proc near
this = dword ptr -4
val = dword ptr 8
push ebp
mov ebp, esp
push ecx
mov [ebp+this], ecx ; save this into a local variable
mov eax, [ebp+this]
mov ecx, [ebp+val]
mov [eax], ecx
mov edx, [ebp+this]
mov eax, [edx]
mov esp, ebp
pop ebp
retn 4
demo endp
; int __cdecl main(int argc,const char **argv,const char *envp)
_main proc near
x = dword ptr -8
e = byte ptr -4
argc = dword ptr 8
argv = dword ptr 0Ch
envp = dword ptr 10h
push ebp
mov ebp, esp
sub esp, 8
push 3
lea ecx, [ebp+e] ; address of e loaded into ecx
call demo ; demo must be a member function
mov [ebp+x], eax
mov esp, ebp
pop ebp
retn
_main endp
Because Borland and g++ pass this as a regular stack parameter, their code tends to look
more like traditional compiled C code and does not immediately stand out as compiled
C++.
C++ Vtables
Virtual tables (vtables) are the mechanism underlying virtual functions and polymor
-
phism in C++. For each class that contains virtual member functions, the C++ compiler
generates a table of pointers called a vtable. A vtable contains an entry for each virtual
function in a class, and the compiler fills each entry with a pointer to the virtual func
-
tion’s implementation. Subclasses that override any virtual functions each receive their
own vtable. The compiler copies the superclass’s vtable, replacing the pointers of any
functions that have been overridden with pointers to their corresponding subclass
implementations. The following is an example of superclass and subclass vtables:
SuperVtable dd offset func1 ; DATA XREF: Super::Super(void)
dd offset func2
dd offset func3
dd offset func4
dd offset func5
dd offset func6
SubVtable dd offset func1 ; DATA XREF: Sub::Sub(void)
dd offset func2
dd offset sub_4010A8
dd offset sub_4010C4
dd offset func5
dd offset func6
As can be seen, the subclass overrides func3 and func4, but inherits the remaining vir-
tual functions from its superclass. The following features of vtables make them stand
out in disassembly listings:
• Vtables are usually found in the read-only data section of a binary.
• Vtables are referenced directly only from object constructors and destructors.
• By examining similarities among vtables, it is possible to understand
inheritance relationships among classes in a C++ program.
• When a class contains virtual functions, all instances of that class will contain a
pointer to the vtable as the first field within the object. This pointer is
initialized in the class constructor.
•
Calling a virtual function is a three-step process. First, the vtable pointer must be
read from the object. Second, the appropriate virtual function pointer must be read
from the vtable. Finally, the virtual function can be called via the retrieved pointer.
Reference
FLIRT Reference www.datarescue.com/idabase/flirt.htm
Extending IDA
Although IDA Pro is an extremely powerful disassembler on its own, it is rarely possible
for a piece of software to meet every need of its users. To provide as much flexibility as
possible to its users, IDA was designed with extensibility in mind. These features include
Chapter 13: Advanced Static Analysis with IDA Pro
325
PART IV
a custom scripting language for automating simple tasks, and a plug-in architecture that
allows for more complex, compiled extensions.
Scripting with IDC
IDA’s scripting language is named IDC. IDC is a very C-like language that is interpreted
rather than compiled. Like many scripting languages, IDC is dynamically typed, and can
be run in something close to an interactive mode, or as complete stand-alone scripts
contained in .idc files. IDA does provide some documentation on IDC in the form of
help files that describe the basic syntax of the language and the built-in API functions
available to the IDC programmer. Like other IDA documentation, that available for IDC
follows a rather minimalist approach consisting primarily of comments from various
IDC header files. Learning the IDC API generally requires browsing the IDC documenta
-
tion until you discover a function that looks like it might do what you want, then play
-
ing around with that function until you understand how it works. The following points
offer a quick rundown of the IDC language:
• IDC understands C++ style single- or multiline comments.
• No explicit data types are in IDC.
• No global variables are allowed in IDC script files.
• If you require variables in your IDC scripts, they must be declared as the first
lines of your script or the first lines within any function.
• Variable declarations are introduced using the auto keyword:
auto addr, j, k, val;
auto min_ea, max_ea;
• Function declarations are introduced with the static keyword. Functions have no
explicit return type. Function argument declarations do not require the auto
keyword. If you want to return a value from a function, simply return it.
Different control paths can return different data types:
static demoIdcFunc(val, addr) {
if (addr > 0x4000000) {
return addr + val; // return an int
}
else {
return "Bad addr"; //return a string
}
}
•
IDC offers most C control structures, including if, while, for, and do. The break
and continue statements are available within loops. There is no switch statement.
As with C, all statements must terminate with a semicolon. C-style bracing with
{ and } is used.
•
Most C-style operators are available in IDC. Operators that are not available
include += and all other operators of the form <op>=.
Gray Hat Hacking: The Ethical Hacker’s Handbook
326
Chapter 13: Advanced Static Analysis with IDA Pro
327
PART IV
•
There is no array syntax available in IDC. Sparse arrays are implemented as
named objects via the CreateArray, DeleteArray, SetArrayLong, SetArrayString,
GetArrayElement, and GetArrayId functions.
•
Strings are a native data type in IDC. String concatenation is performed using
the + operator, while string comparison is performed using the == operator.
There is no character data type; instead use strings of length one.
•
IDC understands the #define and #include directives. All IDC scripts executed
from files must have the directive #include <idc.idc>. Interactive scripts need not
include this file.
•
IDC script files must contain a main function as follows:
static main() {
//idc statements
}
Executing IDC Scripts
There are two ways to execute an IDC script, both accessible via IDA’s File menu. The first
method is to execute a stand-alone script using the File | IDC File menu option. This will
bring up a file open dialog box to select the desired script to run. A stand-alone script has
the following basic structure:
#include <idc.idc> //Mandatory include for standalone scripts
/*
* Other idc files may be #include'd if you have split your code
* across several files.
*
* Standalone scripts can have no global variables, but can have
* any number of functions.
*
* A standalone script must have a main function
*/
static main() {
//statements for main, beginning with any variable declarations
}
The second method for executing IDC commands is to enter just the commands you wish
to execute in a dialog box provided by IDA via the File | IDC Command menu item. In this
case, you must not enter any function declarations or #include directives. IDA wraps the
statements that you enter in a main function and executes them, so only statements that
are legal within the body of a function are allowed here. Figure 13-5 shows an example of
the Hello World program implemented using the File | IDC Command.
IDC Script Examples
While there are many IDC functions available that provide access to your IDA databases, a
few functions are relatively essential to know. These provide minimal access to read and
write values in the database, output simple messages, and control the cursor location within
the disassembly view. Byte(addr), Word(addr), and Dword(addr) read 1, 2, and 4 bytes
respectively from the indicated address. PatchByte(addr, val), PatchWord(addr, val), and
Gray Hat Hacking: The Ethical Hacker’s Handbook
328
PatchDword(addr, val) patch 1, 2, and 4 bytes respectively at the indicated address. Note
that the use of the PatchXXX functions changes only the IDA database; they have no effect
whatsoever on the original program binary. Message(format, …) is similar to the C printf
command, taking a format string and a variable number of arguments, and printing the
result to the IDA message window. If you want a carriage return, you must include it in your
format string. Message provides the only debugging capability that IDC possesses, as no
IDC debugger is available. Additional user interface functions are available that interact with
a user through various dialog boxes. AskFile, AskYN, and AskStr, can be used to display a
file selection dialog box, a simple yes/no dialog box, and a simple one-line text input dialog
box, respectively. Finally, ScreenEA() reads the address of the current cursor line, while
Jump(addr) moves the cursor (and the display) to make addr the current address in the dis-
assembly view.
Scripts can prove useful in a wide variety of situations. Halvar’s BugScam vulnerabil-
ity scanner is implemented as a set of IDC scripts. One situation in which scripts come in
very handy is for decoding data or code within a binary that may have been obfuscated
in some way. Scripts are useful in this case to mimic the behavior of the program in order
to avoid the need to run the program. Such scripts can be used to modify the database in
much the same way that the program would modify itself if it were actually running. The
following script demonstrates the implementation of a decoding loop using IDC to
modify a database:
//x86 decoding loop | //IDC Decoding loop
mov ecx, 377 | auto i, addr, val;
mov esi, 8049D2Eh | addr = 0x08049D2E;
mov edi, esi | for (i = 0; i < 377; i++) {
loc_8049D01: | val = Byte(addr);
lodsb | val = val ^ 0x4B;
xor al, 4Bh | PatchByte(addr, val);
stosb | addr++;
loop loc_8049D01 | }
Figure 13-5 IDC command execution
Chapter 13: Advanced Static Analysis with IDA Pro
329
PART IV
IDA Pro Plug-In Modules and the IDA SDK
IDC is not suitable for all situations. IDC lacks the ability to define complex data struc
-
tures, perform efficient dynamic memory allocation, access native programming APIs
such as those in the C standard library or Windows API, and does not provide access into
the lowest levels of IDA databases. Additionally, in cases where speed is required, IDC
may not be the most suitable choice. For these situations, IDA provides an SDK (Soft
-
ware Development Kit) that publishes the C++ interface specifications for the native
IDA API. The IDA SDK enables the creation of compiled C++ plug-ins as extensions to
IDA Pro. The SDK is included with recent IDA distributions or is available as a separate
download from the DataRescue website. A new SDK is released with each new version of
IDA, and it is imperative that you use a compatible SDK when creating plug-ins for your
version of IDA. Compiled plug-ins are generally compatible only with the version of the
IDA that corresponds to the SDK with which the plug-in was built. This can lead to prob
-
lems when plug-in authors fail to provide new plug-in binaries for each new release of
IDA. As with other IDA documentation the SDK documentation is rather sparse. API
documentation is limited to the supplied SDK header files, while documentation for
compiling and installing plug-ins is limited to a few readme files. A great guide for learn-
ing to write plug-ins was published in 2005 by Steve Micallef, and covers build environ-
ment configuration as well as many useful API functions. His plug-in writing tutorial is a
must read for anyone who wants to learn the nuts and bolts of IDA plug-ins.
Basic Plug-In Concept
First, the plug-in API is published as a set of C++ header (.hpp) files in the SDK’s include
directory. The contents of these files are the ultimate authority on what is or is not avail-
able to you in the IDA SDK. There are two essential files that each plug-in must include:
<ida.hpp> and <loader.hpp>. Ida.hpp defines the idainfo struct and the global idainfo
variable inf. The inf variable is populated with information about the current database,
such as processor type, program entry point, minimum and maximum virtual address
values, and much more. Plug-ins that are specific to a particular processor or file format
can examine the contents of the inf variable to learn whether they are compatible with
the currently loaded file. Loader.hpp defines the plugin_t structure and contains the
appropriate declaration to export a specific instance of a programmer-defined plugin_t.
This is the single most important structure for plug-in authors, as it is mandatory to
declare a single global plugin_t variable named PLUGIN. When a plug-in is loaded into
IDA, IDA examines the exported PLUGIN variable to locate several function pointers
that IDA uses to initialize, execute, and terminate each plug-in. The plug-in structure is
defined as follows:
class plugin_t {
public:
int version; // Set this to IDP_INTERFACE_VERSION
int flags; // plugin attributes often set to 0
// refer to loader.hpp for more info
int (idaapi* init)(void); // plugin initialization function, called once for
// each database that is loaded. Return value
// indicates how Ida should treat the plugin
Gray Hat Hacking: The Ethical Hacker’s Handbook
330
void (idaapi* term)(void); // plugin termination function. called when a
// plugin is unloaded. Can be used for plugin
// cleanup or set to NULL if no cleanup required.
void (idaapi* run)(int arg); // plugin execution function. This is the function
// that is called when a user activates the plugin
// using the Edit menu or assigned plugin hotkey
char *comment; // Long description of the plugin. Not terribly
// important.
char *help; // Multiline help about the plugin
char *wanted_name; // The name that will appear on the
// Edit/Plugins submenu
char *wanted_hotkey; // The hotkey sequence to activate the plugin
// "Alt-" or "Shift-F9" for example
};
An absolutely minimal plug-in that does nothing other than print a message to IDA’s
message window appears next.
NOTE Wanted_hotkey is just that, the hot key you want to use. IDA makes no
guarantee that your wanted_hotkey will be available, as more than one plug-in
may request the same hotkey sequence. In such cases, the first plug-in that IDA
loads will be granted its wanted_hotkey, while subsequent plug-ins that request
the same hotkey will only be able to be activated by using the Edit | Plugins menu.
#include <ida.hpp>
#include <loader.hpp>
#include <kernwin.hpp>
int idaapi my_init(void) { //idaapi marks this as stdcall
//Keep this plugin regardless of processor type
return PLUGIN_KEEP; //refer to loader.hpp for valid return values
}
void idaapi my_run(int arg) { //idaapi marks this as stdcall
//This is where we should do something interesting
static int count = 0;
//The msg function is equivalent to IDC's Message
msg("Plugin activated %d time(s)\n", ++count);
}
char comment[] = "This is a simple plugin. It doesn't do much.";
char help[] =
"A simple plugin\n\n"
"That demonstrates the basics of setting up a plugin.\n\n"
"It doesn't do a thing other than print a message.\n";
char name[] = "GrayHat plugin";
char hotkey[] = "Alt-1";
plugin_t PLUGIN = {
IDP_INTERFACE_VERSION, 0, my_init, NULL, my_run,
comment, help, name, hotkey
};
The IDA SDK includes source code, along with make files and Visual Studio workspace
files for several sample plug-ins. The biggest hurdle faced by prospective plug-in authors
Chapter 13: Advanced Static Analysis with IDA Pro
331
PART IV
is learning the IDA API. The plug-in API is far more complex than the API presented for
IDC scripting. Unfortunately, plug-in API function names do not match IDC API func
-
tion names; though generally if a function exists in IDC, you will be able to find a simi
-
lar function in the plug-in API. Reading the plug-in writer’s guide along with the SDK-
supplied headers and the source code to existing plug-ins is really the only way to learn
how to write plug-ins.
Building IDA Plug-Ins
Plug-ins are essentially shared libraries. On the Windows platform, this equates to a
DLL. When building a plug-in, you must configure your build environment to build a
DLL and link to the required IDA libraries. The process is covered in detail in the plug-in
writer’s guide and many examples exist to assist you. The following is a summary of con
-
figuration settings that you must make:
1. Specify build options to build a shared library.
2. Set plug-in and architecture-specific defines __IDP__, and __NT__ or __LINUX__.
3. Add the appropriate SDK library directory to your library path. The SDK contains
a number of libXXX directories for use with various build environments.
4. Add the SDK include directory to your include directory path.
5. Link with the appropriate ida library (ida.lib, ida.a, or pro.a).
6. Make sure your plug-in is built with an appropriate extension (.plw for
Windows, .plx for Linux).
Once you have successfully built your plug-in, installation is simply a matter of copy-
ing the compiled plug-in to IDA’s plug-in directory. This is the directory within your IDA
program installation, not within your SDK installation. Any open databases must be
closed and reopened in order for IDA to scan for and load your plug-in. Each time a
database is opened in IDA, every plug-in in the plugins directory is loaded and its init
function executed. Only plug-ins whose init functions return PLUGIN_OK or PLUGIN_
KEEP (refer to loader.hpp) will be kept by IDA. Plug-ins that return PLUGIN_SKIP will
not be made available for current database.
The IDAPython Plug-In
The IDAPython plug-in by Gergely Erdelyi is an excellent example of extending the
power of IDA via a plug-in. The purpose of IDAPython is to make scripting both easier
and more powerful at the same time. The plug-in consists of two major components: an
IDA plug-in written in C++ that embeds a Python interpreter into the current IDA pro
-
cess, and a set of Python APIs that provides all of the scripting capability of IDC. By mak
-
ing all of the features of Python available to a script developer, IDAPython provides both
an easier path to IDA scripting, because users can leverage their knowledge of Python
Gray Hat Hacking: The Ethical Hacker’s Handbook
332
rather than learning a new language—IDC, and a much more powerful scripting inter
-
face, because all of the features of Python including data structures and APIs become
available to the script author. A similar plug-in named IDARub was created by Spoonm
to bring Ruby scripting to IDA as well.
The x86emu Plug-In
The x86emu plug-in by Chris Eagle addresses a different type of problem for the IDA
user, that of analyzing obfuscated code. All too often, malware samples, among other
things, employ some form of obfuscation technique to make disassembly analysis more
difficult. The majority of obfuscation techniques employ some form of self-modifying
code that renders static disassembly listings all but useless other than to analyze the de-
obfuscation algorithms. Unfortunately, the de-obfuscation algorithms seldom contain
the malicious behavior of the code being analyzed, and as a result, the analyst is unable
to make much progress until the code can be de-obfuscated and disassembled yet again.
Traditionally, this has required running the code under the control of a debugger until
the de-obfuscation has been completed, then capturing a memory dump of the process,
and finally, disassembling the captured memory dump. Unfortunately, many obfusca-
tion techniques have been developed that attempt to thwart the use of debuggers and
virtual machine environments. The x86emu plug-in embeds an x86 emulator within
IDA and offers users the opportunity to step through disassembled code as if it were
loaded into memory and running. The emulator treats the IDA database as its virtual
memory and provides an emulation stack, heap, and register set. If the code being emu-
lated is self-modifying, then the emulator reflects the modifications in the loaded data-
base. In this way emulation becomes the tool to both de-obfuscate the code and to
update the IDA database to reflect all self-modifications without ever running the mali-
cious code in question. X86emu will be discussed further in Chapter 21.
IDA Pro Loaders and Processor Modules
The IDA SDK can be used to create two additional types of extensions for use with IDA.
IDA processor modules are used to provide disassembly capability for new or unsup
-
ported processor families; while IDA loader modules are used to provide support for new
or unsupported file formats. Loaders may make use of existing processor modules, or may
require the creation of entirely new processor modules if the CPU type was previously
unsupported. An excellent example of a loader module is one designed to parse ROM
images from gaming systems. Several example loaders are supplied with the SDK in the ldr
subdirectory, while several example processor modules are supplied in the module subdi
-
rectory. Loaders and processor modules tend to be required far less frequently than plug-
in modules, and as a result, far less documentation and far fewer examples exist to assist in
their creation. At their heart, both have architectures similar to plug-ins.
Chapter 13: Advanced Static Analysis with IDA Pro
333
PART IV
Loader modules require the declaration of a global loader_t (from loader.hpp) vari
-
able named LDSC. This structure must be set up with pointers to two functions, one to
determine the acceptability of a file for a particular loader, and the other to perform the
actual loading of the file into the IDA database. IDA’s interaction with loaders is as
follows:
1. When a user chooses a file to open, IDA invokes the accept_file function for
every loader in the IDA loaders subdirectory. The job of the accept_file function
is to read enough of the input file to determine if the file conforms to the
format recognized by the loader. If the accept_file function returns a nonzero
value, then the name of the loader will be displayed for the user to choose
from. Figure 13-3 shows an example in which the user is being offered the
choice of three different ways to load the program. In this case, two different
loaders (pe.ldw and dos.ldw) have claimed to recognize the file format while
IDA always offers the option to load a file as a raw binary file.
2. If the user elects to utilize a given loader, the loader’s load_file function is called
to load the file content into the database. The job of the loader can be as complex
as parsing files, creating program segments within IDA, and populating those
segments with the correct content from the file, or it can be as simple as passing
off all of that work to an appropriate processor module.
Loaders are built in much the same manner as plug-ins, the primary difference being the
file extension, which is .ldw for Windows loaders, and .llx for Linux loaders. Install com-
piled loaders into the loaders subdirectory of your IDA distribution.
IDA processor modules are perhaps the most complicated modules to build. Proces-
sor modules require the declaration of a global processor_t (defined in idp.hpp) struc-
ture named LPH. This structure must be initialized to point to a number of arrays and
functions that will be used to generate the disassembly listing. Required arrays define
the mapping of opcode names to opcode values, the names of all registers, and a variety
of other administrative data. Required functions include an instruction analyzer whose
job is simply to determine the length of each instruction and to split the instruction’s
bytes into opcode and operand fields. This function is typically named ana and gener
-
ates no output. An emulation function typically named emu is responsible for tracking
the flow of the code and adding additional target instructions to the disassembly queue.
Output of disassembly lines is handled by the out and out_op functions, which are
responsible for generating disassembly lines for display in the IDA disassembly window.
There are a number of ways to generate disassembly lines via the IDA API, and the best
way to learn them is by reviewing the sample processor modules supplied with the IDA
SDK. The API provides a number of buffer manipulation primitives to build disassem
-
bly lines a piece at a time. Output generation is performed by writing disassembly line
parts into a buffer then, once the entire line has been assembled, writing the line to the
IDA display. Buffer operations should always begin by initializing your output buffer
using the init_output_buffer function. IDA offers a number of OutXXX and out_xxx
functions that send output to the buffer specified in init_output_buffer. Once a line has
been constructed, the output buffer should be finalized with a call to term_output_
buffer before sending the line to the IDA display using the printf_line function.
The majority of available output functions are define in the SDK header file ua.hpp.
Finally, one word concerning building processor modules: while the basic build process
is similar to that used for plug-ins and loaders, processor modules require an additional
post-processing step. The SDK provides a tool named mkidp, which is used to insert a
description string into the compiled processor binary. For Windows modules, mkidp
expects to insert this string in the space between the MSDOS header and the PE header.
Some compilers, such as g++, in the author’s experience do not leave enough space
between the two headers for this operation to be performed successfully. The IDA SDK
does provide a custom DOS header stub named simply stub designed as a replacement
for the default MSDOS header. Getting g++ to use this stub is not an easy task. It is rec-
ommended that Visual Studio tools be used to build processor modules for use on Win
-
dows. By default, Visual Studio leaves enough space between the MSDOS and PE
headers for mkidp to run successfully. Compiled processor modules should be installed
to the IDA procs subdirectory.
References
Open RCE Forums www.openrce.org
Data Rescue IDA Customer Forums www.datarescue.com/cgi-bin/ultimatebb.cgi
IDA Plugin Writing Tutorial www.binarypool.com/idapluginwriting/
IDAPython plug-in />IDARub plug-in www.metasploit.com/users/spoonm/idarub/
x86emu plug-in />Gray Hat Hacking: The Ethical Hacker’s Handbook
334
CHAPTER
14
Advanced Reverse
Engineering
In this chapter, you will learn about the tools and techniques used for runtime detec-
tion of potentially exploitable conditions in software.
• Why should we try to break software?
• Review of the software development process
• Tools for instrumenting software
• Debuggers
• Code coverage tools
• Profiling tools
• Data flow analysis tools
• Memory monitoring tools
• What is “fuzzing”?
• Basic fuzzing tools and techniques
• A simple URL fuzzer
• Fuzzing unknown protocols
• SPIKE
• SPIKE Proxy
• Sharefuzz
In the previous chapter we took a look at the basics of reverse engineering source code
and binary files. Conducting reverse engineering with full access to the way in which an
application works (regardless of whether this is a source view or binary view) is called
white box testing. In this chapter, we take a look at alternative methodologies, often
termed black box and gray box testing; both require running the application that we are
analyzing. In black box testing, you know no details of the inner workings of the appli-
cation, while gray box testing combines white box and black box techniques in which
you might run the application under control of a debugger, for example. The intent of
these methodologies is to observe how the application responds to various input stim-
uli. The remainder of this chapter discusses how to go about generating interesting input
values and how to analyze the behaviors that those inputs elicit from the programs you
are testing.
335
Why Try to Break Software?
In the computer security world, debate always rages as to the usefulness of vulnerability
research and discovery. Other chapters in this book discuss some of the ethical issues
involved, but in this chapter we will attempt to stick to practical reasons. Consider the
following facts:
•
There is no regulatory agency for software reliability.
•
Virtually no software is guaranteed to be free from defects.
•
Most end-user license agreements (EULAs) require the user of a piece of
software to hold the author of the software free from blame for any damage
caused by the software.
Given these circumstances, who is to blame when a computer system is broken into
because of a newly discovered vulnerability in an application or the operating system
that happens to be running on that computer? Arguments are made either way, blaming
the vendor for creating the vulnerable software in the first place, or blaming the user for
failing to quickly patch or otherwise mitigate the problem. The fact is, given the current
state of the art in intrusion detection, users can only defend against known threats. This
leaves the passive user completely at the mercy of the vendor and ethical security
researchers to discover vulnerabilities and report them in order for vendors to develop
patches for those vulnerabilities before those same vulnerabilities are discovered and
exploited in a malicious fashion. The most aggressive sysadmin whose systems always
have the latest patches applied will always be at the mercy of those that possess zero-day
exploits. Vendors can’t develop patches for problems that they are unaware of or refuse
to acknowledge (which defines the nature of a zero-day exploit).
If you believe that vendors will discover every problem in their software before others
do, and you believe that those vendors will release patches for those problems in an
expeditious manner, then this chapter is probably not for you. This chapter (and others
in this book) is for those people who want to take at least some measure of control in
ensuring that their software is as secure as possible.
The Software Development Process
We will avoid any in-depth discussion of how software is developed, and instead
encourage you to seek out a textbook on software engineering practices. In many cases,
software is developed by some orderly, perhaps iterative, progression through the fol
-
lowing activities:
•
Requirements analysis What the software needs to do
•
Design Planning out the pieces of the program and considering how they will
interact
•
Implementation Expressing the design in software source code
Gray Hat Hacking: The Ethical Hacker’s Handbook
336
PART IV
•
Testing Ensuring that the implementation meets the requirements
•
Operation and support Deployment of the software to end-users and
support of the product in end-user hands
Problems generally creep into the software during any of the first three phases. These
problems may or may not be caught in the testing phase. Unfortunately, those problems
that are not caught in testing are destined to manifest themselves after the software is
already in operation. Many developers want to see their code operational as soon as pos
-
sible and put off doing proper error checking until after the fact. While they usually
intend to return and implement proper error checks once they can get some piece of
code working properly, all too often they forget to return and fill in the missing error
checks. The typical end-user has influence over the software only in its operational
phase. A security conscious end-user should always assume that there are problems that
have avoided detection all the way through the testing phase. Without access to source
code and without resorting to reverse engineering program binaries, end-users are left
with little choice but to develop interesting test cases and to determine whether pro-
grams are capable of securely handling these test cases. A tremendous number of soft-
ware bugs are found simply because a user provided unexpected input to a program.
One method of testing software involves exposing the software to large numbers of
unusual input cases. This process is often termed stress testing when performed by the
software developer. When performed by a vulnerability researcher, it is usually called
fuzzing. The difference in the two is that the software developer has a far better idea of
how he expects the software to respond than the vulnerability researcher, who is often
hoping to simply record something anomalous.
Fuzzing is one of the main techniques used in black/gray box testing. To fuzz effec-
tively, two types of tools are required, instrumentation tools and fuzzing tools. Instru-
mentation tools are used to pinpoint problem areas in programs either at runtime or
during post-crash analysis. Fuzzing tools are used to automatically generate large num-
bers of interesting input cases and feed them to programs. If an input case can be found
that causes a program to crash, you make use of one or more instrumentation tools to
attempt to isolate the problem and determine whether it is exploitable.
Instrumentation Tools
Thorough testing of software is a difficult proposition at best. The challenge to the tester
is to ensure that all code paths behave predictably under all input cases. To do this, test
cases must be developed that force the program to execute all possible instructions
within the program. Assuming the program contains error handling code, these tests
must include exceptional cases that cause execution to pass to each error handler. Fail
-
ure to perform any error checking at all, and failure to test every code path, are just two
of the problems that attackers may take advantage of. Murphy’s Law assures us that it
will be the one section of code that was untested that will be the one that is exploitable.
Chapter 14: Advanced Reverse Engineering
337
Without proper instrumentation it will be difficult to impossible to determine why a
program has failed. When source code is available, it may be possible to insert “debug
-
ging” statements to paint a picture of what is happening within a program at any given
moment. In such a case, the program itself is being instrumented and you can turn on as
much or as little detail as you choose. When all that is available is a compiled binary, it is
not possible to insert instrumentation into the program itself. Instead, you must make
use of tools that hook into the binary in various ways in your attempt to learn as much as
possible about how the binary behaves. In searching for potential vulnerabilities, it
would be ideal to use tools that are capable of reporting anomalous events, because the
last thing you want to do is sort through mounds of data indicating that a program is
running normally. We will cover several types of software testing tools and discuss their
applicability to vulnerability discovery. The following classes of tools will be reviewed:
•
Debuggers
•
Code coverage analysis tools
• Profiling tools
• Flow analysis tools
• Memory use monitoring tools
Debuggers
Debuggers provide fine-grain control over an executing program and can require a fair
amount of operator interaction. During the software development process, they are
most often used for isolating specific problems rather than large scale automated test-
ing. When you use a debugger for vulnerability discovery, however, you take advantage
of the debugger’s ability to both signal the occurrence of an exception, and provide a
precise snapshot of a program’s state at the moment it crashes. During black box testing
it is useful to launch programs under the control of a debugger prior to any fault injec-
tion attempts. If a black box input can be generated to trigger a program exception,
detailed analysis of the CPU registers and memory contents captured by the debugger
makes it possible to understand what avenues of exploitation might be available as a
result of a crash.
The use of debuggers needs to be well thought out. Threaded programs and programs
that fork can be difficult for debuggers to follow.
NOTE A fork operation creates a second copy, including all state, variable, and
open file information, of a process. Following the fork, two identical processes
exist distinguishable only by their process IDs. The forking process is termed
the parent and the newly forked process is termed the child. The parent and
child processes continue execution independently of each other.
Following a fork operation, a decision must be made to follow and debug the child
process, or to stick with and continue debugging the parent process. Obviously, if you
Gray Hat Hacking: The Ethical Hacker’s Handbook
338
choose the wrong process, you may completely fail to observe an exploitable opportu
-
nity in the opposing process. For processes that are known to fork, it is occasionally an
option to launch the process in nonforking mode. This option should be considered if
black box testing is to be performed on such an application. When forking cannot be
prevented, a thorough understanding of the capabilities of your debugger is a must. For
some operating system/debugger combinations it is not possible for the debugger to fol
-
low a child process after a fork operation. If it is the child process you are interested in
testing, some way of attaching to the child after the fork has occurred is required.
NOTE The act of attaching a debugger to a process refers to using a
debugger to latch onto a process that is already running. This is different from
the common operation of launching a process under debugger control. When
a debugger attaches to a process, the process is paused and will not resume
execution until a user instructs the debugger to do so.
When using a GUI-based debugger, attaching to a process is usually accomplished via
a menu option (such as File | Attach) that presents a list of currently executing processes.
Console-based debuggers, on the other hand, usually offer an attach command that
requires a process ID obtained from a process listing command such as ps.
In the case of network servers, it is common to fork immediately after accepting a new
client connection in order to allow a child process to handle the new connection while
the parent continues to accept additional connection requests. By delaying any data
transmission to the newly forked child, you can take the time to learn the process ID of
the new child and attach to it with a debugger. Once you have attached to the child, you
can allow the client to continue its normal operation (usually fault injection in this
case), and the debugger will catch any problems that occur in the child process rather
than the parent. The GNU debugger, gdb, has an option named follow-fork-mode
designed for just this situation. Under gdb, follow-fork-mode can be set to parent,
child, or ask, such that gdb will stay with the parent, follow the child, or ask the user
what to do when a fork occurs.
NOTE gdb’s follow-fork-mode is not available on all architectures.
Another useful feature available in some debuggers is the ability to analyze a core
dump file. A core dump is simply a snapshot of a process’s state, including memory con
-
tents and CPU register values, at the time an exception occurs in a process. Core dumps
are generated by some operating systems when a process terminates as a result of an
unhandled exception such as an invalid memory reference. Core dumps are particularly
useful when attaching to a process is difficult to accomplish. If the process can be made
to crash, you can examine the core dump file and obtain all of the same information you
would have gotten had you been attached to the process with a debugger at the moment
PART IV
Chapter 14: Advanced Reverse Engineering
339
it crashed. Core dumps may be limited in size on some systems (they can take up quite a
bit of space), and may not appear at all if the size limit is set to zero. Commands to
enable the generation of core files vary from system to system. On a Linux system using
the bash shell, the command to enable core dumps looks like this:
# ulimit –c unlimited
The last consideration for debuggers is that of kernel versus user space debugging.
When performing black box testing of user space applications, which includes most net
-
work server software, user space debuggers usually provide adequate monitoring capa
-
bilities. OllyDbg, written by Oleh Yuschuk, and WinDbg (available from Microsoft) are
two user space debuggers for the Microsoft Windows family of operating systems. gdb is
the principle user space debugger for Unix/Linux operating systems.
To monitor kernel level software such as device drivers, kernel level debuggers are
required. Unfortunately, in the Linux world at least, kernel level debugging tools are not ter
-
ribly sophisticated at the moment. On the Windows side, Microsoft’s WinDbg has become
the kernel debugger of choice following the demise of Compuware’s SoftIce product.
Code Coverage Tools
Code coverage tools give developers an idea of what portions of their programs are actu-
ally getting executed. Such tools are excellent aids for test case development. Given
results that show what sections of code have and have not been executed, additional test
cases can be designed to cause execution to reach larger and larger percentages of the
program. Unfortunately, coverage tools are generally more useful to the software devel-
oper than to the vulnerability researcher. They can point out the fact that you have or
have not reached a particular section of code, but indicate nothing about the correctness
of that code. Further complicating matters, commercial coverage tools often integrate
into the compilation phase of program development. This is obviously a problem if you
are conducting black box analysis of a binary program, as you will not be in possession
of the original source code.
There are two principal cases in which code coverage tools can assist in exploit develop
-
ment. One case arises when a researcher has located a vulnerability by some other means
and wishes to understand exactly how that vulnerability can be triggered by understand
-
ing how data flows through the program. The second case is in conjunction with fuzzing
tools to understand what percentage of an application has been reached via generated
fuzzing inputs. In the second case, the fuzzing process can be tuned to attempt to reach
code that is not getting executed initially. Here the code coverage tool becomes an essen
-
tial feedback tool used to evaluate the effectiveness of the fuzzing effort.
Pedram Amini’s Process Stalker is a powerful, freely available code coverage tool
designed to perform in the black box testing environment. Process Stalker consists of two
principal components and some post-processing utilities. The heart of Process Stalker is
its tracing module, which requires a list of breakpoints and the name or process ID of a
Gray Hat Hacking: The Ethical Hacker’s Handbook
340
PART IV
process to stalk as input. Breakpoint lists are currently generated using an IDA Pro plug-in
module that extracts the block structure of the program from an IDA disassembly and
generates a list of addresses that represent the first instruction in each basic block within
the program. At the same time, the plug-in generates GML (Graph Modeling Language)
files to represent each function in the target program. These graph files form the basis of
Process Stalker’s visualization capabilities when they are combined with runtime infor
-
mation gathered by the tracer. As an aside, these graph files can be used with third-party
graphing tools such as GDE Community Edition from www.oreas.com to provide an alter
-
native to IDA’s built-in graphing capabilities. The tracer is then used to attach to or launch
the desired process, and it sets breakpoints according to the breakpoint list. Once break
-
points have been set, the tracer allows the target program to continue execution and the
tracer makes note of all breakpoints that are hit. The tracer can optionally clear each
breakpoint when the breakpoint is hit for the first time in order to realize a tremendous
speedup. Recall that the goal of code coverage is to determine whether all branches have
been reached, not necessarily to count the number of times they have been reached. To
count the number of times an instruction has been executed, breakpoints must remain in
place for the lifetime of the program. Setting breakpoints on every instruction in a pro-
gram would be very costly from a performance perspective. To reduce the amount of over-
head required, Process Stalker, like BinDiff, leverages the concept of a basic block of code.
When setting breakpoints, it is sufficient to set a breakpoint only on the first instruction of
each basic block, since a fundamental property of basic blocks is that once the first
instruction in a block is hit, all remaining instructions in the block are guaranteed to be
executed in order. As the target program runs under the tracer’s control, the tracer logs
each breakpoint that is hit and immediately resumes execution of the target program. A
simple example of determining the process ID of a Windows process and running a trace
on it is shown in the following:
# tasklist /FI "IMAGENAME eq calc.exe"
Image Name PID Session Name Session# Mem Usage
========================= ====== ================ ======== ============
calc.exe 1844 Console 0 2,704 K
# ./process_stalker -a 1844 -b calc.exe.bpl -r 0 one-time no-regs
For brevity, the console output of process_stalker is omitted. The example shows how a
process ID might be obtained, using the Windows tasklist command, and then passed
to the process_stalker command to initiate a trace. The process_stalker command
expects to be told the name of a breakpoint list, calc.exe.bpl in this case, which was pre
-
viously generated using the IDA plug-in component of Process Stalker. Once a trace is
complete, the post-processing utilities (a set of Python scripts) are used to process and
merge the trace results to yield graphs annotated with the gathered trace data.
Profiling Tools
Profiling tools are used to develop statistics about how much time a program spends in
various sections of code. This might include information on how frequently a particular
Chapter 14: Advanced Reverse Engineering
341
Gray Hat Hacking: The Ethical Hacker’s Handbook
342
function is called, and how much execution time is spent in various functions or loops.
Developers utilize this information in an attempt to improve the performance of their
programs. The basic idea is that performance can be visibly improved by making the
most commonly used portions of code very fast. Like coverage tools, profiling tools may
not be of tremendous use in locating vulnerabilities in software. Exploit developers care
little whether a particular program is fast or slow; they care simply whether the program
can be exploited.
Flow Analysis Tools
Flow analysis tools assist in understanding the flow of control or data within a program.
Flow analysis tools can be run against source code or binary code, and often generate
various types of graphs to assist in visualizing how the portions of a program interact.
IDA Pro offers control flow visualization through its graphing capabilities. The graphs
that IDA generates are depictions of all of the cross-referencing information that IDA
develops as it analyzes a binary. Figure 14-1 shows a function call tree generated by IDA
for a very simple program using IDA’s Xrefs From (cross-references from) menu option.
In this case we see all of the functions referenced from a function named sub_804882F,
and the graph answers the question “Where do we go from here?” To generate such a dis-
play, IDA performs a recursive descent through all functions called by sub_804882F.
Graphs such as that in Figure 14-1 generally terminate at library or system calls for
which IDA has no additional information.
Another useful graph that IDA can generate comes from the Xrefs To option. Cross-ref-
erences to a function lead us to the points at which a function is called and answers the
question “How did we get here?” Figure 14-2 is an example of the cross-references to the
function send in a simple program. The display reveals the most likely points of origin for
data that will be passed into the send function (should that function ever get called).
Graphs such as that in Figure 14-2 often ascend all the way up to the entry point of a
program.
Figure 14-1
Function call tree
for function sub_
804882F