Báo cáo sinh học: "Reaction norms of size characters in relation to growth temperature in Drosophila melanogaster: an isofemale lines analysis" ppsx
Bạn đang xem bản rút gọn của tài liệu. Xem và tải ngay bản đầy đủ của tài liệu tại đây (1.01 MB, 23 trang )
Original
article
Reaction
norms
of
size
characters
in
relation
to
growth
temperature
in
Drosophila
melanogaster:
an
isofemale
lines
analysis
JR
David
B
Moreteau
JP
Gauthier
G
Pétavy
1
A
Stockel
2
AG
Imasheva
3
1
CNRS,
Laboratoire
de
Biologie
et
Génétique
Évolutives,
91198
Gif sur-Yvette
Cede!;
2
INRA,
Station
de
Zoologie
Agricole,
33140
Pont-de-la-Maye,
!’a7ice;
3
Vavilov
Institute
of
General
Genetics,
3
Gubkin
Street,
117809
Moscow,
Russia
(Received
7
June
1993 ;
accepted
21
December
1993)
Summary -
Ten
isofemale
lines
of
Drosophila
melanogaster,
recently
collected
in
a
French
vineyard,
were
submitted
to
7
different
developmental
temperatures,
from
12
to
31°C,
encompassing
the
whole
physiological
range
of
the
species.
For each
line
and
temperature,
10
flies
of
each
sex
were
collected
randomly
and
2
size-related
traits
were
measured:
wing
and
thorax
length.
Both
traits
exhibited
similar
response
curves:
a
maximum
size
at
a
low
temperature
and
a
decrease
on
both
sides.
ANOVA
showed
significant
variations
between
lines
and
also
significant
line-temperature
interactions,
demonstrating
different
norms
of
reaction
among
the
various
lines.
The
shapes
of
the
curves
were
further
analysed
by
considering
slope
variations,
ie
by
calculating
empirical
derivative
curves.
The
most
interesting
observation
is
that the
temperature
of
maximum
size
(TMS)
is
not
the
same
for
the
wing
(average
15.73 !
0.29°C)
and
the
thorax
(average
19.57 !
0.47°C).
Genetic
differences
seem
to
exist
between
lines,
and
TMS
for
both
traits
are
correlated.
Sexual
dimorphism
was
analysed
by
considering
the
female/male
ratio
for
wing
and
thorax.
Both
traits
provided
the
same
information:
sexual
dimorphism
increased,
from
1.10
to
1.16,
with
increasing
temperature,
and
significant
differences
were
found
between
lines.
Finally
the
wing/thorax
ratio
appeared
as
an
original
and
most
interesting
trait.
This
ratio,
which
is
less
variable
than
wing
or
thorax,
exhibited
a
monotonously
decreasing
sigmoid
shape,
from
2.80
to
2.40,
with
increasing
temperature.
It
is
suggested
that
this
ratio,
which
may
be
related
to
flight
capacity
at
various
temperatures,
could
be
the
direct
target
of
natural
selection.
reaction
norm
/
wing
length
/
thorax
length
/
developmental
temperature
/
sex
dimorphism
/
wing/thorax
ratio
/
flight
capacity
Résumé -
Normes
de
réaction
de
caractères
de
taille
chez
Drosophila
melanogaster
en
fonction
de
la
température
de
développement :
une
analyse
de
lignées
isofemelles.
Dix
lignées
isofemelles
de
Drosophila
melanogaster,
récemment
récoltées
dans
un
vignoble
français
du
sud-ouest
de
la
France,
ont
été
soumises
à
7
températures
différentes
(de
12
à
!1°C)
compatibles
avec
le
développement
de
l’espèce.
Pour
chaque
Lignée
et
chaque
température,
10
mouches
de
chaque
sexe
ont
été
choisies
au
hasard.
Sur
chaque
individu,
2
caractères
relatifs
à
la
taille
ont
été
mesurés :
la
longueur
de
l’aile
et
la
longueur
du
thorax.
Les
courbes
de
réponse
des
2
caractères
ont
la
même
forme
et
mettent
en
évidence
une
taille
maximum
en
dessous
de
20°C
et
une
décroissance
de
part
et
d’autre
de
ce
maximum.
Des
variations
significatives
entre
les
lignées
de
même
que
des
interactions
significatives
lignée-température
sont
mises
en
évidence
par
ANOVA,
ce
qui
montre
que
les
normes
de
réaction
des
différentes
lignées
ont
des
formes
différentes.
L’analyse
de
la
forme
des
courbes
a
été
réalisée
en
considérant
les
variations
des
pentes
pour
chaque
intervalle
de
température,
c’est-à-dire
en
calculant
empiriquement
une
dérivée.
L’observation
la plus
remarquable
concerne
la
température
pour
laquelle
la
taille
est
maximale:
15, 73 ±
0, 29°C
pour
l’aile
et
19, 57
f
0, 47°C
pour
le
thorax.
Des
différences
génétiques
entre
les
lignées
sont
mises
en
évidence
pour
cette
température
de
taille
maximum,
et
les
valeurs
obtenues
pour
les
2
caractères
sont
corrélées.
Le
rapport
femelle-mâle
pour
l’aile
ou
le
thorax
permet
d’étudier
le
dimorphisme
sexuel.
Le
rapport
augmente
de
1,10
à
1,16
quand
la
température
passe
de
12
à
31°
C.
Il
existe
aussi
des
différences
significatives
entre
les
Lignées.
Il
est
montré
que
le
rapport
aile-thorax
est
un
critère
original
et
d’un
grand
intérêt.
Ce
rapport
est
relativement
moins
variable
que
l’aile
ou
le
thorax.
Il
décroît
selon
une
sigmoïde
à
mesure
que
la
température
augmente
et
varie
de
2,80
à
2,40.
Vraisemblablement
en
relation
avec
la
capacité
de
vol
en
fonction
de
la
température,
le
rapport
aile-thorax
pourrait
être
la
cible
directe
de
la
sélection
naturelle.
normes
de
réaction
/
longueur
de
l’aile
et
du
thorax
/
température
de
développe-
ment
/
dimorphisme
sexuel / rapport
aile-thorax
/
capacité
de
vol
INTRODUCTION
For
ectothermic
organisms,
like
Drosophila,
temperature
is
the
most
important
abiotic
factor
for
explaining
the
geographic
distribution
and
abundance
of
species
(David
et
al,
1983;
Parsons,
1983;
Hoffmann
and
Parsons,
1991).
Among
more
than
20
species
that
now
exhibit
a
cosmopolitan
status,
only
2
(D
melanogaster
and
D
simulans)
were
able
to
adapt
to
different
climates
and
proliferate
both
in
temperate
and
tropical
regions
(David
and
Tsacas,
1981).
Various
species,
including
D
subobscura,
D
robusta,
D
melanogaster
and
D
simulans
(see
David
et
al,
1983;
Capy
et
al,
1993),
exhibit
genetic
latitudinal
clines
for
their
size,
and
flies
are
larger
at
higher
latitudes.
Also
laboratory
experiments
made
on
D
pseudoobscura
(Anderson,
1966),
D
willistoni
(Powell,
1974)
and
more
recently
on
D
melanogaster
(Cavicchi
et
al,
1985)
have
described
a
genetically
determined
increase
in
size
by
keeping
populations
at
a
low
temperature
for
many
generations,
and
an
opposite
effect
with
high
temperatures.
From
these
convergent
observations,
little
doubt
remains
that
a
colder
environment
favors
a
larger
size,
and
vice
versa,
although
we
do
not
have
up
to
now
a
plausible
interpretation
for
this
interaction.
The
problem
becomes
still
more
complicated
if
we
consider that
size
also
exhibits
a
broad
phenotypic
plasticity
which,
in
natural
populations,
is
expressed
by
a
high
value
of
the
standard
deviation
or
the
coefficient
of
variation
of
size
characters
(Atkinson,
1979;
David
et
al,
1980;
Coyne
and
Beecham,
1987).
Two
kinds
of
environmental
factors
control
adult
size
during
development:
larval
nutrition
and
temperature.
Among
individuals
collected
at
the
same
time,
size
differences
are
mainly
due
to
nutritional
effects,
although
some
temperature
variations
may
also
occur.
Thermal
effects,
on
the
other
hand,
are
more
important
when
different
seasons
are
compared
(Atkinson,
1979).
Natural
size
variations
may
be
heritable
(Coyne
and
Beecham,
1987).
On
the
other
hand,
a
positive
correlation
seems
to
exist
between
size
and
fitness
in
wild
living
males
(Partridge
et
al,
1987)
or
females
(Boul6treau,
1978).
How
a
natural
population
keeps
a
stable
size
presumably
implies
trade-offs
between
fitness
traits,
but
the
precise
mechanisms
remain
unknown.
From
an
ecophysiological
point
of
view,
the
response
curves
of
size
characters
(weight,
lengths
of
various
body
parts)
are
broadly
known
(see
David
et
al,
1983)
and,
when
plotted
against
temperature
on
the X
axis,
exhibit
the
shape
of
an
inverted
U.
Many
points
however
remain
insufficiently
analysed
and
deserve
further
study.
First,
is
there
a
genetic
variability
not
for
size
itself,
but
for
the
shape
of
the
curve,
ie
for
what
is
now
called
the
norm
of
reaction?
Second,
are
there
different
norms
between
various
morphological
traits
which
are
all
related
to
size?
Third,
how
can
we
interpret
the
norms
of
reaction
in
an
evolutionary
perspective ?
More
precisely,
which
traits
are
specifically
related
to
natural
selection
and
adaptation,
and
which
can
be
considered
as
contingent,
ie
related
to
internal
genetic
constraints ?
In
the
present
paper,
variations
of
2
size
characters
(wing
and
thorax)
have
been
considered
in
relation
to
growth
temperature.
Genetic
variations
of
the
norms
of
reaction
were
analysed
by
comparing
10
isofemale
lines.
The
norms
of
reactions
of
wing
and
thorax,
although
similar,
are
not
identical,
and
especially
the
temperatures
of
maximum
size
are
different.
Moreover,
these
parameters
exhibit
genetic
variations
which
are
correlated
for
wing
and
thorax.
The
adaptive
significance
of
the
shape
of
the
response
curves
is
not
obvious,
although
the
wing/thorax
ratio
could
be
more
interesting
in
this
respect.
The
norm
of
reaction
of
this
trait
is
more
simple
since
we
found
a
regularly
decreasing
curve
with
increasing
temperature.
We
suggest
that
this
ratio,
or
some
other
related
parameter,
could
be
the
immediate
target
of
natural
selection,
in
relation
to
the
flight
capacity
at
different
temperatures.
MATERIALS
AND
METHODS
Flies
from
a
wild
living
vineyard
population
were
collected
with
banana
traps
in
the
Grande
Ferrade
estate,
in
Pont-de-la-Maye,
near
Bordeaux.
About
20
females
were
isolated
in
culture
vials
(cornmeal
medium
with
live
yeast)
and
produced
a
first
laboratory
generation,
Gl,
grown
at
25°C.
Ten
lines
were
then
randomly
chosen
to
produce
the
experimental
flies.
For
this,
10
females
and
10
males
from
each
G1
1
line
were
used
as
parents.
They
oviposited
at
20°C
on
a
killed
yeast,
high
nutrient
medium
(David
and
Clavel,
1965)
for
about
half
a
day.
Vials
with
eggs
were
then
transferred
at
1
of
the
7
experimental
constant
temperatures,
ie
12, 14,
17,
21, 25,
28
and
31°C.
With
this
procedure
larval
density
was
not
strictly
controlled,
and
the
number
of
adults
emerging
from
a
vial
generally
ranged
between
100
and
200.
This
is
a
fairly
high
density.
On
the
other
hand,
the
use
of
a
very
rich
medium
for
the
development
prevented
significant
crowding
effects
which
often
result
in
a
decrease
in
fly
size.
For
each
temperature
and
line,
we
used
only
a
single
culture
vial.
A
long
experience
with
the
technique
has
shown
that
variations
due
to
vial
differences
(ie
common
environment
effects)
are
negligible.
On
the
other
hand,
the
occurrence
of
such
effects
would
increase
the
error
variation
and
make
genetic
differences
(eg,
between
lines)
more
difficult
to
demonstrate.
From
each
line
at
each
temperature,
10
females
and
10
males
were
randomly
chosen
and
studied.
On
each
fly
2
traits
were
measured
with
an
ocular
micrometer
in
a
binocular
microscope:
wing
length
with
a
25
x
magnification
and
thorax
length
with
a
50
x
magnification.
In
the
Results
section
lengths
are
expressed
in
hundreths
of
mm,
ie
micrometer
units
were
multiplied
by
2
for
the
thorax
and
by
4
for
the
wing.
Thorax
length
was
measured
on
a
left
side
view,
from
the
anterior
margin
at
the
neck
level
to
the
tip
of
the
scutellum.
For
wing
length
a
difficulty
exists
in
defining
the
anterior
basis of
the
wing.
We
used
the
middle
part
of
the
thoracic
coast,
in
front
of
the
tegula,
since
we
found
it
easier
to
identify
this
point
with
accuracy
on
a
lateral
view.
For
the
posterior
part
we
used
the
tip
of
the
wing
at
the
end
of
the
third
longitudinal
vein.
Statistical
analyses,
and
especially
analysis
of
variance
(ANOVA),
were
done
with
SAS
(SAS
Institute
Inc,
1985).
Temperature,
lines
and
sex
were
considered
as
fixed
effects.
RESULTS
We
will
first
consider
wing
and
thorax
length,
and
in
a
second
section,
the
wing/thorax
ratio,
which
appeared
to
be
an
original
and
interesting
trait.
The
illustrations
deal
either
with
lengths
or
with
the
ratio.
In
the
tables,
however,
we
often
include
simultaneous
analyses
concerning
wing,
thorax
and
ratio,
in
order
to
save
space.
Data
included
in
the
tables
but
concerning
the
ratio
is
discussed
in
the
second
section.
Wing
and
thorax
length
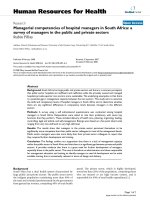
Average
response
curves
The
average
response
curves
are
shown
in
figure
1.
Female
and
male
curves
are
separated,
showing
the
well-known
fact
that
males
are
smaller
than
females.
The
norms
of
reaction
of
the
2
traits
have
quite
similar
shapes,
confirming
previous
results
(David
et
al,
1983).
A
maximum
size
is
observed
at
a
fairly
low
temperature,
around
15°C
for
the
wing
and
19°C
for
the
thorax.
A
significant
decrease
is
observed
on
both
sides
of
this
maximum,
ie
higher
or
lower
temperatures.
Sources
of
variation
The
data
shown
in
figure
1
were
submitted
to
ANOVA,
in
order
to
identify
the
significant
sources
of
variation,
and
the
results
are
given
in
table
I.
The
main
variations
are
due
to
sex
and
temperature.
A
highly
significant
line effect
due
to
genetic
differences
is
also
observed.
All
the
double
interactions
are
highly
significant,
while
the
triple
interaction
is
not.
The
line
x
temperature
interaction
means
that
the
norms
of
reaction
of
the
various
lines
are
not
parallel
and
exhibit
different
shapes.
The
sex
x
line
interaction
means
that
there
is
some
sexual
dimorphism
in
the
norms
of
reaction.
Within-line
variability
This
variability
deserves
further
attention.
We
may
ask
2
related
questions:
does
variability
change
with
temperature,
and
are
some
lines
more
variable
than
others?
In
this
analysis,
we
have
considered
2
parameters,
the
standard
deviation
and
the
CV
(coefficient
of
variation),
and
the
results
are
shown
in
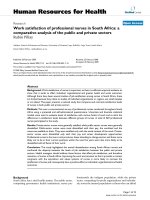
figure
2.
Standard
deviations
are
much
higher
for
the
wing
than
for
the
thorax.
For
the
wing,
a
decrease
in
the
standard
deviation
is
observed
with
increasing
temperature,
as
well
as
a
lower
value
in
males.
Some
of
these
differences
may
be
due
to
the
fact
that
the
wing
is
about
2.5
times
longer
than
the
thorax,
and
that
males
are
smaller
than
females.
To
avoid
this
scaling
effect,
we
used
a
relative
measurement,
the
CV.
Of
course,
each
CV
was
calculated
on
a
group
of
10
flies
(same
line
and
temperature)
so
that
the
total
number
of
observations
is
140
for
1400
individuals.
As
seen
in
figure
2,
the
relative
variability
is
about
the
same
for
males
and
females,
is
also
similar
for
both
traits.
These
data
were
submited
to
ANOVA
(table
II)
and
the
conclusion
was
significant
effects
for
temperature
in
both
traits,
while
line
differences
(p
=
0.011)
and
sex
(p
=
0.016)
were
significant
only
for
the
thorax.
None
of
the
interactions
were
significant.
Concerning
the
temperature
effect
(see
figure
11
below)
we
note
a
relative
stability
of
the
CV
at
intermediate
temperatures
and
an
increase
at
extreme
temperatures,
especially
at
12
and
31°C.
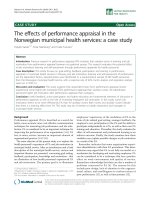
Between-line
variability
and
intraclass
correlations
Variation
between
lines
is
illustrated
in
figure
3.
The
significant
line
x
temperature
interaction
is
visualized
on
the
graph
by
the
intercrosses
of
the
lines.
For
each
temperature,
the
between-line
variance
was
calculated,
and
also
the
coefficient
of
intraclass
correlation
which
estimates
an
’isofemale
line
heritability’
(Hoffmann
and
Parsons,
1988).
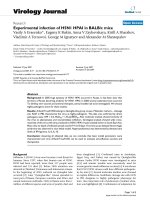
Results
are
shown
graphically
in
figure
4
and
analysed
with
ANOVA
in
table
III.
For
wing
length,
no
effects
are
significant,
and
the
mean
values
are
0.58 !
0.03
and
0.51 ih
0.03
for
females
and
males,
respectively.
The
picture
is
different
for
the
thorax:
males have
significantly
lower
values
than
females
(0.30 !
0.04
against
0.37
t
0.04)
and
variations
occur
according
to
temperature
(see
figure
4).
More
precisely,
intraclass
correlation
is
higher
at
high
temperatures
(25-31°C)
than
at
low
temperatures
(12-21°C).
A
last
conclusion
is
that
the
overall
genetic
variability
is
much
less
for
the
thorax
than
for
the
wing.
correlation
and
sex
dimorphism
Previous
analyses
have
already
evidenced
numerous
sex
differences
and
sex
inter-
actions
with
other
factors.
In
this
section
we
consider
correlations
between
sexes
at
the
same
temperature,
and
also
the
female/male
ratio.
Male-female
correlations
can
only
be
analysed
by
considering
the
mean
values
of
each
line.
The
results
are
shown
in
table
IV.
The
average
correlation
is
higher
for
the
wing
(0.91)
than
for
the
thorax
(0.76).
This
is
significant
if
we
consider
the
average
difference
over
temperatures
(d
=
0.144 t
0.054,
t =
2.66,
n
=
7).
Sexual
differences,
for
each
line
and
each
temperature,
were
examined
by
calculating
the
female/male
ratio.
Results
of
ANOVA
are
given
in
table
V.
For
both
traits,
temperature
and
line
effects
are
significant.
Heritable
variations
occurred
between
lines.
The
temperature
effects
are
shown
in
figure
5.
Both
traits
show
the
same
pattern:
the
female/male
ratio
decreases
regularly
from
high
temperatures
(1.16)
to
low
temperatures
(1.10).
The
2
sexes
are
more
similar
when
grown
at
low
temperature.
Finally,
the
relationship
between
the
sexual
dimorphism
of
wing
and
thorax
was
investigated
by
calculating
the
correlation
at
each
temperature.
The
mean
value
for
the
7
temperatures
(r
=
0.67 !
0.07)
is
clearly
positive
and
significant:
sexual
dimorphism
is
higher
in
some
lines
than
in
others.
Shape
of
the
norms
of
reaction:
variation
of
the
slope
and
derivative
curves
For
each
isofemale
line,
the
size
variation
for
a
given
temperature
interval
allows
the
calculation
of
a
slope
(ie
size
variation
for
one
degree
change)
if
we
accept
a
linear
intrapolation.
When
this
operation
is
repeated
over
successive
temperature
intervals,
we
get
an
empirical
derivative
of
the
norm
of
reaction.
Examples
of
such
curves
are
given,
for
females
only,
in
figure
6.
For
both
traits,
the
slope
is
monotonously
decreasing
from
positive
to
negative
values.
The
point
where
the
curve
crosses
the
zero
line
indicates
the
temperature
of
maximum
size
(TMS).
As
seen
in
figure
6,
some
variations
exist
for
the
same
trait
between
lines,
but
there
is
no
overlap
for
wing
and
thorax,
as
the
ranges
are
14.5-17°C
and
18-21°C,
respectively.
Statistical
analyses
are
presented
in
table
VI.
Significant
effects
are
due
to
temperature
and
sex,
but
not
to
lines.
On
the
other
hand,
a
significant
line
x
temperature
interaction
is
observed,
which
means
that
the
derivative
curves
of
the
various
lines
have
different
shapes.
Figure
6
shows
that
variation
in
slope
is
much
greater
for
wing
than
thorax
(notice
that
the
ordinate
scales
are
not
the
same
on
the
2
graphs).
However,
as
with
the
standard
deviation,
this
may
be
due
to
a
scaling
effect
related
to
the
greater
length
of
the
wing.
For
a
better
comparison
of
the
2
traits,
the
standardized
derivatives
(slope-to-mean
ratio)
were
calculated
and
the
average
curves
are
shown
in
figure
7.
With
this
transformation
the
relative
variabilities
of
the
2
traits
are
comparable,
and
the
main
difference
seems
to
be
a
translation
of
the
thorax
curves
to
the
right,
ie
toward
higher
temperatures.
A
difference
also exists
between
sexes,
the
female
curves
are
also
to
the
right
of
the
male
curves.
Temperature
of
maximum
size
(TMS)
As
indicated
in
figure
6,
the
temperature
at
which
the
derivative
is
zero
corresponds
to
the
maximum
size
of
the
trait.
For
each
line,
the
TMS
was
calculated
by
assuming
a
linear
variation
of
the
derivative
between
the
lowest
temperature
and
the
17-21°C
interval
for
the
wing,
the
21-25°C
interval
for
the
thorax.
More
precisely,
if
we
consider
the
average
curves
of
figure
7,
3
points
were
used
to
calculate
the
TMS
of
the
wing
and
4
points
for
the
thorax.
Variations
of
the
TMS
are
shown
in
figure
8,
and
mean
values
are
given
in
table
VII.
ANOVA,
applied
to
these
data,
demonstrated
significant
effects
of
traits,
sex
and
lines.
The
left-hand
graph
of
figure
8
illustrates
the
large
difference
between
the
2
traits,
with
no
overlap
between
the
distributions.
Moreover,
the
positive
correlation
between
sexes
of
the
same
line
suggests
a
genetic
basis.
A
better characterization
of
each
line
is
obtained
by
averaging
the
TMS
of
both
sexes,
as
done
in
figure
8
(right-hand
graph).
A
clear
correlation
is
observed
between
thorax
and
wing
TMS:
some
lines
exhibit
a
maximum
size
at
a
low
temperature
(around
14°C
for
the
wing
and 17°C
for
thorax);
others
a
maximum
size
at
higher
temperatures
(17°C
for
the
wing
and
21°C
for
the
thorax).
Covariation
of
wing
and
thorax;
the
wing/thorax
ratio
In
the
previous
section,
the
relationship
between
wing
and
thorax
variability
was
already
considered
in
some
cases,
for
example,
for
sexual
dimorphism
and
TMS.
In
this
section,
we
extend
this
investigation
by
considering
the
wing/thorax
correlation
and
the
wing/thorax
ratio.
The
wing/thorax
correlation
The
wing/thorax
correlation
may
be
investigated
at
the
individual
level
(the
10
flies
measured
in
each
line
and
each
temperature)
or
the
line
level
(the
10
lines
at
each
temperature).
The
coefficients
of
correlation
are
given
in
table
VIII
and
their
values
are
quite
stable
over
temperature.
At
the
individual,
within-line
level,
the
values
do
not
vary
significantly
according
to
temperature:
the
average
phenotypic
correlations
are
0.71
for
the
females
and
0.76
for
males.
In
an
extensive
study,
Scheiner
et
al
(1991)
found
values
at
19
and
25°C
somehow
higher
(average
0.82).
Genetic
correlations
found
by
Scheiner
et
al
(1991)
were
a
little
lower
(0.73
for
females)
in
close
agreement
with
the
between-line
correlations
we
found
in
the
present
study
(table VIII).
The
wing/thorax
ratio:
mean
values
During
the
development
of
our
investigations,
it
turned
out
that
the
covariation
of
the
wing
and
thorax
could
be
investigated
in
an
interesting
way:
by
calculating
the
wing/thorax
ratio.
This
trait,
as
well
as
the
length,
varies
according
to
sex,
temperature
and
lines
(see
table
I)
and
moreover
all
interactions
are
significant.
Variations
are
shown
graphically
either
at
the
line
level,
or
by
considering
the
average
values
of
each
sex
(fig 9).
The
ratio
exhibits
a
monotonic
decrease
from
low
temperatures
(about
2.8)
to
high
temperatures
(about
2.4).
Interestingly,
male
and
female
values
are
very
close,
although
statistically
different.
The
wing/thorax
ratio:
slopes
and
derivative
curves
For
each
line
and
temperature
interval
the
slope
was
calculated.
As
an
example,
the
female
values
are
shown
for
the
10
lines
in
figure
10.
Large
variations
exist
between
lines.
With
one
exception,
all
values
are
negative,
indicating
that
the
ratio
decreases
with
increasing
temperature.
In
spite
of
the
broad
dispersal
it
is
possible
to
conclude
that
the
slope
varies
according
to
temperature
(ANOVA,
table
VI).
This
is
also
illustrated
by
considering
the
confidence
intervals
of
the
mean
values
in
figure
10.
For
example,
the
average
slope
between
17
and
21°C
(—0.03)
is
much
less
than
between
28
and
31°C
(-0.01).
Such
variations
of
the
derivatives
demonstrate
that
the
decrease
of
the
wing/thorax
ratio,
illustrated
in
figure
9,
is
not
a
linear
function
of
temperature,
but
a
decreasing
sigmoid.
Within-line
variability
of
the
wing/thorax
ratio
As
for
the
lengths,
the
variability
of
the
ratio
was
investigated
by
considering
a
relative
measurement,
the
coefficient
of
variation.
Results
of
ANOVA
(table
II)
demonstrated
very
significant
effects
of
temperature
and
lines
but
no
difference
between
sexes.
Interestingly,
genetic
differences
between
lines
are
much
more
pronounced
for
the
ratio
than
for
the
traits
themselves.
The
temperature
effect
is
illustrated
in
figure
11,
and
compared
to
the
CV
of
wing
and
thorax.
The
overall
shapes
are
similar
and
correspond
to
U-shaped
curves.
Variability
is
minimum
at
intermediate
temperatures
and
increases
toward
extreme,
cold
or
hot,
temperatures.
Moreover
the
ratio
is
much
less
variable
than
the
length.
Between
17
and
25°C
it
averages
about
1.2%,
while
it
is
around
1.8%
for
the
wing
or
thorax
length.
Such
a
reduction
of
the
relative
variability
of
the
ratio
is
a
consequence
of
the
positive
correlation
existing
between
wing
and
thorax
(table
VII).
Between-line
variability:
intraclass
correlation
The
values
of
the
coefficients
of
intraclass
correlation
for
the
wing/thorax
ratio
are
given
in
table
IX.
Thera
are
no
significant
variations
between
sexes
or
temperatures.
The
overall
mean,
calculated
on
14
observations,
is
0.52 !
0.02.
The
isofemale
line
heritability
of
the
ratio
is
high,
comparable
to
that
of
the
wing
and
superior
to
that
of
the
thorax.
DISCUSSION
As
pointed
out
in
the
Introduction,
numerous
observations
and
arguments
suggest
that
size
variations
are
strongly
related
to
fitness
and
that
size
is
a
regular
target
of
natural
selection.
On
the
other
hand,
the
overall
size
is
a
difficult
entity
to
define
since
measurements
deal
only
with
size-related
traits.
Wing
and
thorax
length
and
adult
weight
are
the
most
generally
used
traits
(Capy
et
al,
1993)
but
other
dimensions
have
also
been
considered
in
the
literature,
such
as
head
width
or
the
lengths
of
various
parts
of
the
legs.
As
far
as
we
know
(David
et
al,
1983),
all
these
traits
exhibit
similar
convex
response
curves
to
growth
temperature,
with
a
maximum
below
20°C
and
a
decline
on
both
sides.
A
maximum
size
is
often
referred
to
as
an
’optimum’
(Gabriel
and
Lynch,
1992)
but
this
must
be
considered
cautiously
(see
David
et
al,
1983).
In
the
present
work,
we
demonstrated
that
temperatures
of
maximum
length
for
wing
and
thorax
are
clearly
separated,
thus
making
the
argument
of
an
optimum
size
still
more
difficult.
In
the
Drosophila
literature,
many
papers
have
dealt
with
the
genetic
architec-
ture
and
heritability
of
wing
or
thorax
length
(reviewed
in
Roff
and
Mousseau,
1987).
The
isofemale
line
technique
also
provides
an
opportunity
to
estimate
the
intrapopulation
variability
with
the
coefficient
of
intraclass
correlation
(Hoffmann
and
Parsons,
1988).
We
have
found
that
this
’isofemale
line
heritability’
is
higher
for
wing
than
thorax,
thus
confirming
extensive
data
on
numerous
geographic
pop-
ulations
(Capy
et
al,
1994).
More
interesting
is
the
fact
that,
for
the
thorax
only,
this
heritability
seems
to
vary
according
to
the
environment,
being
higher
at
high
temperatures.
As
pointed
out
several
times
(De
Jong,
1990;
Falconer,
1990;
Scheiner
and
Lyman,
1989,
1991;
Scheiner,
1993),
phenotypic
plasticity
may
be
considered
as
a
specific
trait,
independent
of
the
mean.
Most
empirical
and
theoretical
analyses
have
considered
only
linear
variations
evaluated
by
considering
2
environments.
For
example,
Scheiner
and
Lyman
(1989,
1991)
studied
thorax
length
at
19
and
25°C
and
found
that
the
heritability
of
plasticity
was
much
less
than
that
of
thorax
length.
In
a
recent
paper,
Gavrilets
and
Scheiner
(1993)
have
suggested
a
model
for
investigating
nonlinear
norms,
and
indicated
the
need
for
empirical,
extensive
data.
Wing
and
thorax
changes
are
obviously
nonlinear
when
studied
over
a
broad
range
of
temperatures.
Such
was
also
the
case
for
pigmentation
(David
et
al,
1989).
Presumably,
most
morphometrical
traits
exhibit
nonlinear
norms,
thus
complicating
mathematical
analyses
and
theoretical
interpretations.
In
the
present
work,
we
analysed
the
shapes
of
the
response
curves
by
calculating
empirical
derivatives,
as
has
been
done
previously
for
pigmentation
(David
et
al,
1989).
This
technique
is
most
convenient
for
comparing
different
traits.
In
this
study,
it
enabled
a
precise
calculation,
for
each
trait,
of
the
TMS.
The
facts
that
for
each
trait,
the
male
and
female
TMS
are
correlated
and
also
that,
among
lines,
the
thorax
and
wing
TMS
are
also
correlated,
are
strong
arguments
for
assuming
a
genetic
basis
to
these
variations.
Some
lines
have
a
maximum
size
at
lower
temperature,
others
at
higher
temperature:
TMS
itself
is
a
trait
which
could
be
selected
with
the
isofemale
line
technique
as
already
used
by
Scheiner
and
Lyman
(1991).
In
Drosophila,
as
in
most
insect
species,
females
are
known
to
be
bigger
than
males,
although
their
development
is
faster
(David
et
al,
1983).
We
estimated
the
sexual
dimorphism
by
calculating,
for
each
trait,
the
female/male
ratio.
Our
data,
based
on
the
mean
values
of
isofemale
lines,
led
to
several
interesting
conclusions.
First,
wing
and
thorax
lengths
provide
about
the
same
information
on
dimorphism.
Second,
sexual
dimorphism
increases
with
growth
temperature,
from
a
low
1.10
at
12°C
to
a
high
1.16
at
28-31°C.
Third,
genetic
variations
exist
between
lines
so
that
sexual
dimorphism
could
also
be
selected.
Another
ratio,
which
turned
out
to
be
very
interesting,
is
the
wing/thorax
ratio,
calculated
either
at
the
individual
or
line
levels.
The
significance
of
this
ratio
for
biometrical
studies
was
already
pointed
out
in
recent
papers
on
D
buzzatii
(Robertson,
1987;
Thomas,
1993).
Since,
at
the
individual
level,
wing
and
thorax
are
correlated
(r
is
about
0.70),
the
ratio
is
less
variable
than
the
traits
themselves.
Comparing
the
variability
of
various
traits
having
different
means
needs
a
relative
measurement,
ie
the
coefficient
of
variation
(CV).
Relative
variabilities
of
wing
and
thorax
are
low
and
similar
with
an
average
value
of
1.8%
at
medium
temperatures.
An
increase
which
is
found
at
extreme
(low
or
high)
temperatures
may
be
considered
as
an
increase
of
the
developmental
noise
under
stressful
conditions.
Indeed,
a
low
relative
variability
may
be
considered
as
an
indication
of
a
physiological
optimum
(see
David
et
al,
1983,
for
discussion).
A
long-standing
argument
is
that
fitness-
related
traits
should
exhibit
a
low
variability
due
to
genetic
homeostasis
(Lerner,
1954)
and
developmental
canalization
(Waddington,
1957).
The
fact
that
the
ratio
is
still
less
variable
(1.2%)
than
the
traits
themselves
is
mathematically
due
to
the
significant
correlation
existing
between
the
2
traits.
On
the
other
hand,
the
occurrence
and
persistence
of
this
correlation
in
laboratory
grown
flies
may
be
interpreted
as
a
consequence
of
an
internal
constraint.
This
constraint
could
itself
be
an
indication
of
a
relationship
between
fitness
and
the
wing/thorax
ratio.
Another
argument
is
the
overall
shape
of
the
reaction
norm,
ie
a
decreasing
sigmoid
curve.
In
this
respect,
there
is
a
clear
analogy
with
the
abdominal
pigmentation
of
the
last
3
segments
(David
et.
al,
1989)
for
which
an
adaptive
significance,
related
to
the
thermal
budget,
is
likely.
For
the
wing/thorax
ratio,
a
possible
direct
adaptive
significance,
related
to
the
flight
capacity,
may
be
proposed
(P6tavy
et
al,
1992).
For
a
given
fly,
the
wing
beat
frequency
increases
with
increasing
ambient
temperature
(Reed
et
al,
1942)
presumably
due
to
a
better
muscle
efficiency.
On
the
other
hand,
a
higher
beating frequency
should
allow
an
increase
of
the
wing
loading,
ie
the
weight
per
surface
unit
of
the
wing.
In
preliminary
experiments,
we
measured
the
wing
loading
of
males
grown
at
3
temperatures,
ie
12,
21
and
30°C:
average
wing
loadings
were
0.24,
0.29
and
0.32
mg/mm
2,
respectively.
Wing
beat
frequencies
were
also
measured,
for
these
3
categories
of
males,
at
21°C,
and
a
significant
increase
from
195
to
247 Hz
was
observed
with
growth
temperature,
parallel
to
the
morphological
increase
of
the
wing
loading.
Further
more
extensive
studies
are
on
the
way.
These
preliminary
data
suggest
that
the
morphological
variations
related
to
growth
temperature
are
an
adaptation
to
flying
in
a
cold
environment,
with
a
lesser
muscular
efficiency
and
thus
a
decreased
wing
loading.
We
also
found
that
the
wing/thorax
ratio
is
strongly
correlated
to
wing
loading.
Interestingly,
a
similar
decrease
of
the
ratio
with
growth
temperature
has
also
been
described
in
D
buzzatii
(Thomas,
1993).
This
could
be
a
general
feature
in
Drosophila.
A
last
problem,
which
has
been
discussed
several
times,
is
the
relationship
be-
tween
plasticity
and
natural
selection
(David
et
al,
1983;
Schlichting,
1986;
Sultan,
1987;
De
Jong,
1989;
Gabriel
and
Lynch,
1992;
Gavrilets
and
Scheiner,
1993).
Under
the
adaptive
hypothesis,
we
should
make
2
predictions.
First,
phenotypic
plasticity
itself
could
be
selected
for
in
populations
and
species
living
in
a
variable
environment,
for
example,
Drosophila
populations
in
temperate
countries
which
ex-
perience
big
and
predictable
seasonal
thermal
variations.
On
the
other
hand,
for
populations
living
in
the
thermal
stability
of
tropical
countries,
plasticity
should
be
a
contingent
property
without
a
direct
relationship
to
fitness.
A
second
prediction
is
that,
if
the
change
in
the
mean
phenotype
is
adaptive
(eg,
smaller
flies
in
a
warm
environment)
we
should
find
a
genetic
modification
when
the
environment
is
stable
for
many
generations.
We
already
know
that
prolonged
culture
at
a
higher
tem-
perature
resulted
in
a
decrease
in
size
(Cavicchi
et
al,
1985)
and
also
that
tropical
populations
of
D
melanogaster
have
a
smaller
size
(David
and
Capy,
1988).
We
now
argue
that
the
wing/thorax
ratio
(or
some
related
measurement)
could
be
the
direct
target
of
natural
selection.
If
such
is
the
case,
a
lower
ratio
should
be found
in
tropical
populations.
ACNOWLEDGMENTS
We
thank
S
Scheiner
and
L
Zhivotovsky
for
helpful
comments
on
the
manuscript.
This
work
benefited
from
a
grant
from
the
Minist6re
de
I’Environnement
(EGPN)
to
JR
David.
REFERENCES
Anderson
WW
(1966)
Genetic
divergence
in
M
Vetukiv’s
experimental
populations
of
Drosophila
P
seudoobscura.
3.
Divergence
in
body
size.
Genet
Res
7,
255-266
Atkinson
WD
(1979)
A
field
investigation
of
larval
competition
in
domestic
Drosophila.
J
Anim
Ecol
48,
91-102
Boul6treau
J
(1978)
Ovarian
activity
and
reproductive
potential
in
a
natural
population
of
Drosophila
melanogaster.
Oecologia
(Berl)
35,
319-342
Capy
P,
Pla
E,
David
JR
(1993)
Phenotypic
and
geographic
variability
of morpho-
metrical
traits
in
natural
populations
of
Drosophila
melanogaster
and
D
simulans.
I.
Geographic
variations.
Genet
Sel
Evol
25,
517-536
-
Capy
P,
Pla
E,
David
JR
(1994)
Phenotypic
and
genetic
variability
of
morphome-
trical
traits
in
natural
populations
of
Drosophila
melanogaster
and
D
sim!Lans.
II.
Within-population
variability
Genet
Sel
Evol 26,
15-28
Cavicchi
SD,
Guerra
G,
Giorgi
G,
Pezzoli
C
(1985)
Temperature-related
divergence
in
experimental
populations
of
Drosophila
melanogaster.
I.
Genetic
and
develop-
mental
basis
of
wing
size
and
shape
variation.
Genetics
109,
665-689
Coyne
JA,
Beecham
E
(1987)
Heritability
of
two
morphological
characters
within
and
among
natural
populations
of
Drosophila
melanogaster.
Genetics
117,
727-737
David
JR,
Capy
P
(1988)
Genetic
variation
of
Drosophila
melanogaster
natural
populations.
Trends
Genet
4,
106-111
David
JR,
Clavel
MF
(1965)
Interaction
entre
le
genotype
et
le
milieu
d’61evage.
Consequences
sur
les
caract6ristiques
du
d6veloppement
de
la
drosophile.
Bull
Biol
Fr
Belg
99,
369-378
David
JR,
Tsacas
L
(1981)
Cosmopolitan,
subcosmopolitan
and
widespread
species:
different
strategies
within
the
drosophilid
family.
C R
Soc
Biogeog
57,
11-26
David
JR,
Cohet
Y,
Fouillet
P,
Arens
MF
(1980)
Phenotypic
variability
of
wild
collected
Drosophila:
an
approach
toward
understanding
selective
pressures
in
natural
populations.
Egypt
J
Genet
Cytol 9,
51-66
David
JR,
Allemand
R,
Van
Herrewege
J,
Cohet
Y
(1983)
Ecophysiology:
abiotic
factors.
In:
The
Genetics
and
Biology
of
Drosophila
(M
Ashburner,
HL
Carson,
JN
Thompson,
eds)
Acad
Press,
London,
vol
3d,
105-170
David
JR,
Capy
P,
Gauthier
JP
(1989)
Abdominal
pigmentation
and
growth
temperature
in
Drosophila
melanogaster.
similarities
and
differences
in
the
norms
of
reaction
of
successive
segments.
J
Evol
Biol
3,
429-445
De
Jong
G
(1989)
Phenotypically
plastic
characters
in
isolated
populations.
In:
Evolutionary
Biology
of
Transient
Unstable
Populations
(A
Fondevila,
ed)
Springer,
Berlin,
3-18
De
Jong
G
(1990)
Quantitative
genetics
of
reaction
norms.
J
Evol
Biol 3,
447-468
Falconer
DS
(1990)
Selection
in
different
environments:
effects
on
environmental
sensitivity
(reaction
norm)
and
on
mean
performance.
Genet
Res
56,
57-70
Gabriel
W,
Lynch
M
(1992)
The
selective
advantage
of
reaction
norms
for
environ-
mental
tolerance.
J
Evol
Biol
5,
41-59
Gavrilets
S,
Scheiner
SM
(1993)
The
genetics
of phenotypic
plasticity.
VI.
Theoret-
ical
predictions
for
directional
selection.
J
Evol
Biol
6,
49-68
Hoffmann
AA,
Parsons
PA
(1988)
The
analysis
of
quantitative
variation
in
natural
populations
with
isofemale
strains.
Genet
Sel
Evol
20,
87-98
Hoffmann
AA,
Parsons
PA
(1991)
Evolutionary
Genetics
and
Environmental
Stress.
Oxford
Univ
Press,
Oxford
Lerner
IM
(1954)
Genetic Homeostasis.
Olivier,
Boyd,
Edinburgh
Parsons
PA
(1983)
The
Evolutionary
Biology
of
Colonizing
Species.
Cambridge
Univ
Press,
Cambridge
Partridge
L,
Hoffmann
A,
Jones
JS
(1987)
Male
size
and
mating
success
in
Drosophila
melanogaster
and
D
pseudoobscura
under
field
conditions.
Anim
Behav
35,
468-476
P6tavy
G,
Gauthier
JP,
David
JR
(1992)
Plasticite
ph6notypique
et
normes
de
reaction
de
la
taille
de
Drosophila
melanogaster.
influence
de
la
temperature
de
développement.
Bull
Soc
Ecophysiol 17,
107-113
Powell
JR
(1974)
Temperature-related
genetic
divergence
in
Drosophila
size.
J
Hered
65,
257-258
Reed
SC,
Williams
CM,
Chadwick
LE
(1942)
Frequency
of
wing-beat
as
a
character
for
separating
species,
races
and
geographic
varieties
of
Drosophila.
Genetics
27,
349-361
Robertson
FW
(1987)
Variation
of
body
size
within
and
between
wild
populations
of
Drosophila
buzzatii.
Genetica
72,
111-125
Roff
DA,
Mousseau
TA
(1987)
Quantitative
genetics
and
fitness:
lessons
from
Drosophila.
Heredity
58,
103-108
SAS
Institute
Inc
(1985)
SAS
User’s
Guide:
Statistics,
Version
5
ed,
SAS
Institute
Inc,
Cary,
NC
Scheiner
SM
(1993)
Genetics
and
evolution
of phenotypic
plasticity.
Annu
Rev
Ecol
Syst
24,
35-68
Scheiner
SM,
Lyman
RF
(1989)
The
genetics
of phenotypic
plasticity.
I.
Heritability.
J
Evol
Biol 2,
95-107
Scheiner
SM,
Lyman
RF
(1991)
The
genetics
of
phenotypic
plasticity.
II.
Response
to
selection.
J
Evol
Biol
4,
23-50
Scheiner
SM,
Caplan
RL,
Lyman
RF
(1991)
The
genetics
of
phenotypic
plasticity.
III.
Genetic
correlations
and
fluctuating
asymmetries.
J
Evol
Biol
4,
51-68
Schlichting
CD
(1986)
The
evolution
of
phenotypic
plasticity
in
plants.
Annu
Rev
Ecol
Syst
17,
667-693
Sultan
SE
(1987)
Evolutionary
implications
of phenotypic
plasticity
in
plants.
Evol
Biol
21,
127-178
Thomas
RH
(1993)
Ecology
of
body
size
in
Drosophila
buzzatii:
untangling
the
effects
of
temperature
and
nutrition.
Ecol
Entomol
18,
84-90
Waddington
CH
(1957)
The
Strategy
of the
Genes.
Allen,
Unwin,
London