Báo cáo sinh học: "Evolutionary systematic of three species of troglobitic beetles: electrophoretic and morphological evidence B 1 Laboratoire" docx
Bạn đang xem bản rút gọn của tài liệu. Xem và tải ngay bản đầy đủ của tài liệu tại đây (774.62 KB, 15 trang )
Original
article
Evolutionary
systematic
of
three
species
of
troglobitic
beetles:
electrophoretic
and
morphological
evidence
B
Crouau-Roy
1 Laboratoire
souterrain
du
CNRS,
Moulas,
09200
Sa$nt-Girons,
France
(Received
29
September
1988;
accepted
17
January
1990)
Summary -
Genic
and
morphological
variations
were
compared
for
3
allopatric
and
endemic
troglobitic
beetles
of
the
genus
Speonomus,
by
use
of
an
allozyme
data
set
(18
putative
loci)
and
1
based
on
morphometric
characters
(16
morphological
variables).
Allozymic
and
morphometric
relationships
were
also
compared
with
some
aspects
of
the
mating
behaviour,
and
considered
in
relation
to
the
ecology
and
biogeography
of
these
species.
The
extent
of
agreement
between
the
assessments
of
evolutionary
divergence
at
the
genic
and
morphological
levels
is
discussed.
Enzyme
analysis
revealed
pronounced
differences
in
degree
of
genetic
differentiation
between
the
3
species:
S
colluvii
is
the
most
divergent
species
with
large
genetic
distances
(D !
1).
Morphometric
differentiation
between
the
3
species,
assessed
on
16
characters,
is
important
between
the
3
species,
principally
between
S
xophosinus
and
the
2
others.
The
level
of
congruence
is
strongly
data
-
set
dependent
and
these
results
reveal
independent
trends
for
the
2
sets
of
characters.
While
S
xophosinus
has
diverged
little
from
S
hydrophilus
on
the
molecular
level,
the
morphometric
differentiation
between
them
is
high.
This
pattern
may
result
from
different
sensitivities
of
each
character
set
to
different
components
of
the
environment.
troglobitic
beetle
/
systematic
/
electrophoretic
and
morphometric
variations
Rksumé -
Systématique
évolutive
de
trois
espèces
de
Coléoptères
troglobies:
analyses
électrophorétiques
et
morphologiques.
Nous
avons
comparé
les
variations
génétiques
et
morphologiques
de
trois
espèces
de
Coléoptères
troglobies
allopatriques
et
endémiques
du
genre
Speonomus
sur
la
base
des
données
allozymiques
(18
locus)
et
des
caractères
morphométriques
(i6
variables).
Les
distances
basées
sur
les
données
génétiques
et
les
divergences
morphologiques
et
biométriques
sont
également
comparées
à
certains
aspects
du
comportement
lors
de
l’accouplement
et
discutées
en
fonction
du
contexte
écologique
et
des
caractéristiques
biogéogmphiques
de
ces
espèces.
L’analyse
des
locus,
correspondant
à
13
protéines
enzymatiques,
met
en
évidence
des
différenciations
importantes
entre
ces
espèces:
S
colluvii
est
l’espèce
la
plus
divergente
avec
une
distance
génétique
voisine
de
1.
L’étude
morphométrique
estimée
sur
16
caractères
sépare
les
populations
des
trois
espèces
selon
la
largeur
du
pronotum
et
la
longueur
des
élytres
(S
zophosinus
les
plus
petits,
S
hydrophilus
les
plus
grands),
la
largeur
des
articles
antennaires
et
la
forme
du 8’
article
antennaire.
Il
n’y
a
pas
concordance
entre
les
données
moléculaires
(gènes
structuraux)
et
morphométriques:
S
zophosinus
sur
le
plan
moléculaire
a
peu
divergé
de
S
hydrophilus
*
Present
address:
Centre
de
Recherches
sur
le
Polymorphisme
Gdndtique,
des
Populations
Hu-
maines
(CRPG) -
CNRS,
CHU
Purpan,
Avenue
de
Grande-Bretagne,
31300
Toulouse,
France
alors
que
la
différenciation
morphométr%que
est
importante
entre
ces
espèces.
L’action
différentielle
des
pressions
de
sélection
aux
différents
niveaux,
protéique
et
morphologique,
peut
rendre
compte
de
ces
d%scordances.
coléoptère
troglobie
/
systématique
/
variations
électrophorétiques
et
morphométri-
ques
INTRODUCTION
Closely
related
species
provide
opportunities
to
study
how
the
evolutionary
process
operates
in
natural
populations.
Nevertheless,
it
is
often
difficult
to
assign
taxo-
nomic
ranks
or
to reconstruct
phylogenetic
relationships.
A
high
degree
of
indepen-
dence
is
often
observed
between
molecular
and
morphological
evolution
(Gorman
and
Kim,
1976;
Sene
and
Carson,
1977;
Schnell
et
al,
1978;
Turner
et
al,
1979;
Lessios,
1981;
Berlocher
and
Bush,
1982;
Allegrucci
et
al,
1987);
this
may
be
due
to
varying
selection
pressures
on
different
traits
(Turner
et
al,
1979)
or
merely
re-
lated
to
the
number
of
loci
segregating
for
the
different
characters
(Lewontin,
1984).
Electrophoretic
separation
of
enzymes
has
become
a
powerful
tool
for
investigating
systematic
and
evolutionary
problems
(Avise,
1974).
Morphological
studies
alone
are
usually
inadequate
to
determine
evolutionary
relationships
in
closely
related
species.
Integrative
studies
utilizing
allozyme
variability
and
data
from
behavioural
breeding
systems
in
addition
to
morphometric
variability
are
most
powerful
in
such
complex
groups;
then
we
can
estimate
the
importance
of
gene
flow,
genetic
drift
and
selection
in
shaping
population
structures.
The
3
species
of Bathysciinae
(Coleoptera)
of
this
study
belong
to
a
monophyletic
group
of
the
genus
Speonomus
which
contains
many
cave-dwelling
species
from
the
more
primitive
to
the
more
specialized
(Jeannel,
1924).
Studies
on
these
species
have
been
the
subject
of
repeated
analyses
by
various
approaches,
including
the
study
of
morphology
(Jeannel,
1924;
Juberthie
et
al,
1980a;
Juberthie
et
al,
1981;
Delay
et
al,
1983),
karyology
(Durand
and
Juberthie-Jupeau,
1980)
and
allozymic
variation
(Crouau-Roy,
1989a,
b).
The
relationship
of
these
beetles
to
one
another
and
to
other
species
groups
of
Speonomus
has
not
been
adequately
resolved.
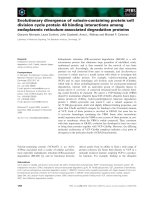
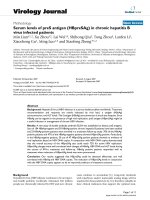
The
3
allopatric
species
S
hydrophidus,
S
zophosinus
and
S
codduvii,
narrowly
endemic
to
central
Pyrenees
(fig
1),
have
undergone
some
ecological
divergence
and
present
a
high
degree
of
specialization
to
underground
life
( eg
life
cycle
of
1
larval
stage
with
suppression
of
larval
feeding,
Deleurance-Glagon,
1963).
These
blind
and
wingless
troglobitic
species
occur
in
caves
and
deep
soil
(Juberthie
et
al,
1980a,
b)
in
the
massif
Arize
(S
hydrophidus
at
about
430 -
1440
m),
in
the
valleys
of
Salat
and
Arac
rivers
(S
zophosinus
at
about
480 -
620
m)
and
on
the
north
face
of
the
massif
des
Trois
Seigneurs
(S
colduvii
at
about
700
m -
1350
m)
at
the
foothill
of
the
French
central
Pyrenees.
The
southern
extent
of
the
massif
Arize
(between
the
area
of
S
hydrophilus
and S
xophosinus)
is
composed
of
colmated
metamorphic
rocks
which
seem
to
be
geological
barriers
to
underground
colonization
by
cave
fauna.
Their
distribution
strongly
suggests
that
speciation
occurred
after
gene
flow
was
interrupted
by
physical
barriers:
there
were
probably
geomorphological
and
pedological
barriers
after
climatic
shifts
during
the
ice
ages
and
interglacials
of
the
quaternary.
The
phylogeny
of
these
3
closely
related
troglobitic
(ie,
obligate
cave
dwelling)
beetles
was
investigated
using
isozyme
electrophoresis
and
biometric
analysis.
Patterns
of
allozyme
and
biometric
variation
were
compared
with
some
aspects
of
the
mating
behaviour
and
aspects
of
the
ecology
of
these
organisms
to
address
the
question
of
intrageneric
relationships
of
species
within
this
group
of
beetles.
The
present
study
provides
answers
to
the
following
questions:
1)
how
much
genetic
variation
is
contained
in
these
populations?
2)
how
is
the
genetic
variation
partitioned
within
and
among
the
isolated
populations?
3)
what
phylogenetic
relationships
can
be
deduced
from
the
isozyme
data
and
how
congruent
are
they
with
biometrical
based
relationships
at
the
species
level?
4)
how
do
the
different
approaches
contribute
to
our
knowledge
of
evolution
in
this
group?
MATERIALS
AND
METHODS
Twenty-three
populations
of
S
hydrophilvs,
6
of
S
zophosanus
and
5
of
S
colluvii
were
studied
for
electrophoretic,
morphometric
and
behavioural
studies.
Electrophoretic
analyses
Electrophoresis
was
performed
in
slabs
of
12%
hydrolized
starch
for
the
following
en-
zymes:
esterases
(Est-1,
Est-6,
EC
3.1.1.2),
alkaline
phosphatase
(Aph,
EC
3.1.3.1),
leucine
aminopeptidase
(Lap-1,
EC
3.4.11.1),
malic
enzyme
(Me,
EC
1.1.1.40)
hex-
okinases
(Hk-1,
Hk-3, Hk-4,
EC
2.7.1.1)
phosphohexose
isomerase
(Phi-1,
Phi-2,
EC
5.3.1.9)
and
a
glycero-phosphate
dehydrogenase
(a-Gpdh,
EC
1.1.1.8);
in
slabs
of
acrylamide
for
fumarase
(Fum,
EC
4.2.1.12),
hydroxybutyrate
dehydrogenase
(Hbdh-1,
Hbdh-2,
EC
1.1.1.30),
acid
phosphatase
(Pac-1,
EC
3.1.3.2)
malate
de-
hydrogenase
(Mdh,
EC
1.1.1.37),
and
lactate
dehydrogenase
(Ldh,
EC
1.1.1.28),
aldehyde
oxidase
(Ao,
EC
1.2.3.1).
Additional
loci
that
could
not
be
scored
un-
equivocally
were
deleted
from
further
analysis.
Loci
and
alleles
were
numbered,
respectively,
in
order
of
decreasing
anodal
migration.
Electrophoresis
buffers
and
stains
are
described
in
Crouau-Roy
(1986).
Individuals
from
different
species
were
run
together
on
the
same
gel
to
determine
whether
corresponding
electromorphs
had
similar
mobilities.
Allozyme
frequencies
for
each
sample
were
derived
from
the
electrophoretic
results.
These
data
were
employed
to
compute
genetic
distance
estimates
(Nei,
1972,
1978)
which
were
used
for
a
phenetic
averaging
(UPGMA;
Sneath
and
Sokal,
1973).
The
apportionment
of
genetic
diversity
was
determined
using
genetic
diversity
analysis
(Wright,
1965;
Nei,
1977, 1986).
Total
gene
diversity
(H
T
=
1 - E
xi:
weighted
average
allele
frequencies
over
all
populations)
is
sub-
divided
into
gene
diversity
within
populations
(H
s:
weighted
average
over
all
pop-
ulations
of
the
values
1- E xi
for
each
population)
and
gene
diversity
among
pop-
ulations.
Differentiation
among
populations
is
calculated
as
F
ST
=
HT
-
HS
)/H
T.
Morphometric
analysis
Sample
sizes
for
all
morphological
analyses
were
30
adults
per
population.
For
S
hydro
P
hidus
only
18
populations
out
of
the
23
were
examined.
The
following
16
morphological
variables
were
measured
from
each
specimen:
length
(L)
and
width
(W)
of
7
antennal
segments
(5th,
6th,
7th,
8th,
9th,
10th
and
length
only
of
the
llth),
length
of
the
tibia
of
the
3rd
pair
of
legs
(LT),
length
of
the
elytra
(LE)
and
width
of
the
pronotum
(WP).
Measurements
were
recorded
in
micrometres.
Because
of
statistically
significant
correlations
between
values
for
the
sexes,
the
measurements
were
only
made
in
males.
Euclidean
distances
were
calculated
on
the
basis
of
the
16
morphometric
variables;
a
dendrogram
was
drawn
up
using
these
distances,
according
to
the
UPGMA
method
of
cluster
analysis
(Sneath
and
Sokal,
1973).
Data
were
also
analyzed
using
a
principal
components
analysis
(PCA)
on
the
standardized
variables.
RESULTS
Electrophoretic
differentiation
Genetic
structure
of
populations
at
enzyme
loci
The
allele
frequencies
for
each
putative
locus
(18
loci)
are
given
in
table
I.
Each
locus
containing
more
than
1
variant
was
considered
polymorphic.
Fourteen
of
these
were
polymorphic
(Est-6,
Lap-1,
Phi-1,
Phi-2,
Pac-1,
Hk-3, Hk-4,
Hbdh-1,
Me,
Mdh,
a-Gpdh,
Ldh-2,
Fum,
Ao)
and
the
remaining
4
were
monomorphic
with
the
same
electromorph
fixed
in
all
populations
of
the
3
species
(Hbdh-3,
Aph,
Hk-1).
Six
loci
(Mdh,
Hbdh-1,
Fum,
Ao,
Ldh-2
and
Phi-2)
are
diagnostic
for
at
least
1
species,
and
2
additional
loci
(Est-6,
Pac-1)
are
diagnostic
with
a
1%
probability
of
error.
Estimates
of
the
proportion
of
polymorphic
loci
per
population
(P)
and
the
average
frequency
of
heterozygous
loci
per
individual
(H)
indicate
some
differences
in
genetic
variability
between
the
3
species. Speonomus
colluvii
displays
the
highest
overall
percentage
of
polymorphic
loci
(41.2%).
For
the
other
2,
percent
polymorphic
loci
are
23.0%
in
S
hydrophalus
and
25.5%
in
S
zophosinus.
Expected
average
heterozygosities,
-H
e:c
p)
are
listed
in
table
II.
Genotypic
frequencies
are
compared
to
expected
Hardy-Weinberg
proportions
by x
2
or
G-test
(Sokal
and
Rohlf,
1969);
x2
or
G
values
show
significant
differences
between
observed
genotypic
frequencies
and
those
expected
under
Hardy-Weinberg
equilibrium.
The
genotypic
fixation
index
(Wright,
1965),
which
measures
the
relative
difference
between
expected
(He!P)
and
observed
(H
ob9
)
heterozygosity,
shows
a
significant
deficiency
of
heterozygotes
(FIS
>
0)
(table
II)
(Crouau-Roy,
1988).
Genetic
differentiation
between
populations
The
genetic
differentiation
within
the
Speonomus
species
complex
was
determined
using
genetic
diversity
analysis
(F-statistics:
Wright,
1965;
Nei,
1977,
1986)
and
a x
2
contingency
analysis
of
heterogeneity
(Workman
and
Niswander,
1970).
Nire
loci
are
variable
in
some
or
all
populations
of
each
species
(table
II).
Significant
heterogeneity
in
gene
frequencies
X2
was
observed
among
S
hydrophilus
populations
at
all
variable
loci.
Significant
heterogeneity
in
allele
frequencies
was
observed
among
populations
of
S
zophosinus
(only
at
the
Est-6
locus).
For
S
colluvis,
2
variable
loci
(Lap-1
and
Hk-4)
show
significant
heterogeneity.
There
is
significant
genetic
variation
between
populations
in
the
complex
of
3
species
(table
III).
Genetic
diversity
for
5
loci
is
due
totally
to
the
between-species
component
(FST
)
=
1;
populations
fixed
for
different
alleles:
Hbdh-1,
Fum,
Ao,
LDh-2
and
Phi-2).
For
3
additional
loci
(Mdh,
Pc-1,
Me)
almost
all
the
diversity
is
due
to
between-species
variation
rather
than
within-species
variation
(FST
=
0.978,
0.979
and
0.902,
respectively).
The
mean
of
0.790
(for
polymorphic
loci
only)
for
differentiation
among
species
indicates
that
a
large
portion
of
the
genetic
variability
in
Speonomus
is
not
present
among
the
individuals
of
a
single
species.
Extensive
isozyme
divergence
between
species
is
further
indicated
by
their
low
Nei
genetic
identity
values.
Nei’s
standard
genetic
distances
corrected
for
sample
size
between
the
popula-
tions
of
each
species
are
listed
in
table
IV.
Variances
of
Nei’s
distances
(Nei
and
Roychoudhury,
1974)
were
all
on
the
order
of
1.7%
-
2.5%
of
the
distance
values.
Beetles
from
the
3
species
are
well
differentiated:
coefficients
of
genetic
distance
range
between
1.021
and
0.400.
The
genetic
differentiation
observed
between
the
species
S
hydrophilus
and
S
zophosinus
is
significant
(D
=
0.431)
compared
to
that
observed
within
each
of
them
(intraspecific
values
of
Nei’s
index:
0.036
and
0.050
respectively). S
zophosinus
differed
completely
from
S
hydrophilus
at
5
isozyme
loci
(Mdh,
Ao,
Ldh-2,
Phi-2,
Est-6)
and
differed
substantially
at
2
others
(Phi-1,
pac-1).
The
distribution
of
the
loci
with
respect
to
genetic
identity
exhibits
the
U-shaped
pattern
characteristic
of
comparisons
between
good
species.
Of
18
loci,
most
are
either
identical
in
their
allelic
composition
(55%)
or
completely
different
(32%
of
its
loci
are
diagnostic
for
the
other).
For
S
colluvii,
the
genetic
differentiation
from
the
other
2
species
is
greater
and
affects
an
important
part
of
the
genome
(50%
of
its
loci
are
diagnostic:
Ao,
Fum,
Pac-1,
Me,
Mdh,
Hbdh-1,
Ldh-2,
a-Gpdh,
Phi-2).
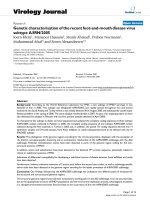
The
genetic
distances
between
pairs
of
populations
are
summarized
in
figure
2
in
the
form
of
a
dendrogram
by
using
the
UPGMA
clustering
method:
this
analysis
of
the
data
indicates
the
pattern
of
phenetic
clustering
of
the
species
into
3
major
groups.
Morphometric
differentiation
The
average
values
for
the
16
morphological
characters
are
given
in
table
V
and
relationships
between
populations
of
the
3
species
have
been
tested
by
a
Student
test.
The S
hydro
P
hilus
and
S
zo
P
hosinus
populations
display
significant
differences
for
all
measured
morphological
characters;
between
S
hydrophilus
and
S
colluvii,
4
comparisons
are
significant
(L8,
L7,
L6,
L5)
and
only
2
are
significant
(Lll,
W9)
between
S
zo
P
hossnus
and
S
colluvii.
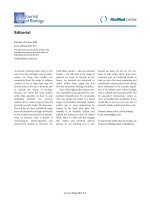
In
particular,
the
shape
of
the
8th
antenna!
segment
(L8
and
W8)
differentiates
the
3
species
from
each
other
(fig
3).
Table
IV
reports,
with
Nei’s
distances,
matrices
of
intra -
and
interspecific
Eu-
clidean
distances
on
morphometric
measurements.
These
data
indicate
that
vari-
ations
in
morphology
are
more
important
between
species
than
they
are
within
each
species.
Figure
2
compares
the
results
of
the
clustering
based
on
allozyme
(A,
Nei’s
distances)
and
morphometric
data
(B,
Euclidean
distances).
On
the
2
bases,
populations
are
clustered
into
3
groups
corresponding
to
the
3
species
except
for
1
population
of
S
hydrophilus
which
clusters
with
the
group
of
S
col-
luvii
populations.
Nevertheless,
the
morphometric
differences
between
the
3
al-
lopatric
species
of
Speonomus
are
discordant
with
the
pattern
displayed
by
elec-
trophoretic
dissimilarities.
While
on
the
molecular
level,
S
zophosircus
has
diverged
less
from
S
hydrophilus
than
has
S
colluvii,
the
morphological
distance
between
these
2
species
is
greater
(Euclidean
distance:
263.09
f
5.68).
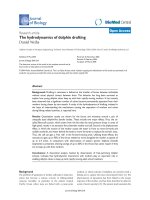
The
marked
dissimilarity
of
S
zophosarcus
is
distinctly
illustrated
in
a
plot
of
the
3
species
(conspecific
pop-
ulations
pooled)
on
the
1st
2
axes
generated
by
the
principal
components’
analysis
(fig
4).
The
raw
data,
and
the
principal-component
scores,
are
dominated
by
size:
the
1st
principal
component,
explaining
82%
of
the
variance,
is
associated
with
gen-
eral
size,
with
near-equal
contributions
from
each
character.
The
3
species
differ
according
to
the
general
size
of
the
individuals
(S
zophosinus
individuals
are
the
smallest
and S
hydrophilus
individuals
the
largest)
and
also
according
to
the
width
of
the
8
and
10
antennal
segments
(explained
by
the
2nd
principal
component).
DISCUSSION
In
systematic
studies,
the
choice of
parameters
may
substantially
influence
the
patterns
observed.
Since
selection
intensity
is
difficult
to
assess,
consideration
of
more
than
a
single
class
of
traits
can
allow
a
more
reasonable
evaluation of
the
accuracy
of
systematic
schemes.
Several
investigations
have
demonstrated
that
speciation
can
occur
with
little
or
no
divergence
at
structural
gene
loci
coding
for
allozymes:
classes
of
genes
other
than
those
studied
by
electrophoresis
(eg
regulatory
genes)
might
be
involved
in
this
process
to
a
greater
extent
Ayala,
1975;
Wilson,
1976;
Nevo,
1978).
These
species
of
Speonomus,
show
high
degrees
of
genetic
divergence;
this
genetic
differentiation
does
not
correspond
to
the
differences
in
allele
frequencies
at
the
polymorphic
loci
but
to
the
fixation
of
specific
alleles.
The
greater
part
of
the
isozyme
loci
examined
contain
a
large
portion
of
their
genetic
diversity
among
species
rather
than
within
species
(table
III)
despite
the
high
level
of
within -
population
variation
in
some
local
populations
of
the
3
species
(table
IV).
Electrophoresis
usually
underestimates
the
amount
of
variability
in
a
species
or
population.
Nevertheless,
electromorphs
can
provide
valuable
taxonomic
information
and
we
found
32
and
50%
of
the
loci
studied
to
be
diagnostic
for
any
of
the
3
sibling
species
of
Speonomus.
Moreover,
an
obvious
disparity
in
size
and
behaviour
during
mating
between
the
3
species
is
visible.
Ethological
criteria
have
a
great
importance
in
speciation
events.
These
Speonomus
show
within
a
single
species
a
very
low
experimental
frequency
of
matings
(Crouau-Roy,
1986)
in
contrast
to
the
2
larval
stages
of
S
delarouzei
(Juberthie-Jupeau
and
Cazals,
1984).
Thus,
the
occurrence
of
reproductive
isolation
between
the
3
species
cannot
be
shown.
Nevertheless,
during
mating,
constant
and
sometimes
important
differences
appear
between
the
species;
they
concern
the
length
of
mating,
the
different
phases
of
the
mating
and
the
amplitude
and
frequency
of
abdominal
movements
of
males
during
mating
(Crouau-Roy,
1986).
These
different
types
of
mating
behaviour
may
enable
one
to
discriminate
the
3
species.
The
consistent
differences
in
electrophoretic
differentiation,
morphometric
and
behavioural
differences,
in
conjunction
with
biogeographical
distributions
and
eco-
logical
separation,
offer
convincing
evidence
of
the
separate
species
status
of
S
hydrophilvs,
S
zophosinus
and
S
colluvai.
The
results
of
this
study
applied
to
the
taxonomic
question
are
in
complete
agreement
with
the
previously
determined
specific
status
of these
beetles
based
on
male
genitalia
(Jeannel,
1924),
and
on
other
morphological
characters
(Juberthie
et
al,
1980a,
1981;
Delay
et
al,
1983).
What
is
the
congruence
between
biochemical
and
morphological
data?
There
is
no
congruence
between
the
2
sets
of
characters
at
the
species
level.
Relative
degrees
of
molecular
divergence
between
the
3
species
do
not
concur
with
degrees
of
morphological
differentiation
between
the
same
species.
The
highest
genetic
identity
values
are
found
among
the
species
S
hydrophalus
and
S
zophosinus.
This
is
in
contrast to
morphological
and
biometrical
analysis
in
which
these
2
species
exhibit
the
greatest
difference
(table
IV;
figs
2
and
3).
S
colluvii
and
S
hydrophilus,
morphologically
more
similar,
show
greater
biochemical
separation
(fig
2).
What
factors
would
account
for
the
observed
discrepancy
in
degrees
of
differentiation?
The
genetic
differences
between
these
species,
at
structural
genes
measured
by
electrophoresis
of
the
gene
products,
are
the
results
of
mutations
accumulated
since
the
time
of
divergence.
This
does
not
imply
that
they
are
critical
in
evolutionary
terms.
Electrophoresis
can
measure
reduced
gene
flow
or
absence
of
gene
flow,
but
cannot
say
anything
about
changes
at
the
regulatory
level,
which
may
be
very
important
in
some
speciation
events
(Wilson
et
al,
1974).
Application
of
electrophoretic
methods
to
taxonomic
studies
requires
caution
in
interpretation
of
experimental
data.
It
is
not
easy
to
assign
limits
to
the
electrophoretic
variability
disclosed
experimentally
in
relation
to
biological
criteria
used
in
differentiation
between
species.
The
processes
of
evolution
of
different
aspects,
represented
by
different
data
sets
(molecular,
morphological,
morphometrical
and
behavioural),
may
have
been
substantially
uncoupled
and
proceeded
independently
or
at
different
rates.
For
example,
S
colluvii
appears
to
have
evolved
biochemically
much
more
than
it
has
changed
morphotypically,
in
particular
from
S
hydrophilvs.
The
incongruence
between
extent
of
divergence
in
the
2
sets
of
characters
could
be
the
result
of
different
sensitivities
of
each
to
different
components
of
the
environment.
The
3
species
studied
here
differ
in
their
genetic
structure
(Crouau-Roy,
1989a,
b)
and
in
their
ecological
characteristics
(Juberthie
et
al 1981;
Crouau-Roy,
1986).
The
external
morphometrical
characteristics
of
Speonomus,
traditionally
used
in
systematic
studies,
could
be
under
extensive
selective
pressures
imposed
by
the
local
environment.
Without
heritability
data,
1
suggestion
is
that
the
morphological
variation
has
been
more
immediately
shaped
by
ecological
differences
between
the
species.
Further,
an
unknown
proportion
of
the
variation
exhibited
by
many
of these
traits
could
be
environmental
rather
than
genetic
in
origin.
The
morphometrical
data
may
reflect
historical
processes
but
are
much
more
under
the
influence
of
differential
selective
pressures
(micro -
and
macro-environmental
influences)
than
the
biochemical
data.
ACKNOWLEDGMENTS
I
would
particularly
like
to
thank
TC
Kane
for
helpful
discussions
and
his
valuable
criticism
of
the
manuscript.
I
am
grateful
to
D
D’Hulst
for
the
computer
program
of
the
genetic
analysis,
to
C
Juberthie
and
B
Delay
for
valuable
discussions
and
assistance
in
the
field
collecting,
to
C
Ferre
for
technical
assistance
and
to
F
Boineau
for
typing
the
manuscript.
REFERENCES
Allegrucci
G,
Cesaroni
D,
Sbordoni
V
(1987)
Adaptation
and
speciation
of
Dolichopoda
cave
crickets:
geographic
variation
of
morphometric
indices
and
allozyme
frequencies.
Biol
J
Linn
Soc
31,
151-160
Avise
JC
(1974)
Systematic
value
of electrophoretic
data.
Syst
Zool 23,
465-481
Ayala
FJ
(1975)
Genetic
differentiation
during
the
speciation
process.
In:
Evolu-
tionary
Biology
(Dobzhansky
T,
Hecht
M,
Steere
W,
eds)
Plenum
Press
8,
1-78
Berlocher
SH,
Bush
GL
(1982)
An
electrophoretic
analysis
of
Rhagoletis
(Diptera
Tephritidae)
phylogeny.
Syst
Zool 31,
136-155
Crouau-Roy
B
(1986)
Structure
génétique
des
populations
et
des
espèces
chez des
Coléoptères
troglobies
(Speono9nus).
Contribution
à
1’etude
des
mécanismes
de
la
spéciation.
Th6se
d’Etat -
Montpellier
II,
1-300
Crouau-Roy
B
(1988)
Genetic
structure
of
cave-dwelling
beetles
populations:
sig-
nificant
deficiencies
of
heterozygotes.
Heredity
60,
321-327
Crouau-Roy
B
(1989a)
Genetic
population
structure
in
a
troglobitic
beetle
(Spe-
onomus
zophosinus).
Genetica
78,
13-20
Crouau-Roy
B
(1989b)
Population
studies
on an
endemic
troglobitic
beetle:
geo-
graphical
patterns
of
genetic
variation,
gene
flow
and
genetic
structure
compared
with
morphometric
data.
Genetics
121,
571-582
Delay
B,
Juberthie
C,
Ruffat
G
(1983)
Description
de
Speonomus
colluvii
du
milieu
souterrain
superficiel
des
Pyrenees
ariégeoises.
Mém
Biospeol
X,
249-256
Deleurance-Glacon
S
(1963)
Recherches
sur
les
Coléoptères
troglobies
de
la
sous-
famille
des
Bathysciinae.
Ann
Sci
Nat
Zool
5,
1-172
Durand
JL,
Juberthie-Jupeau
L
(1980)
Etude
cytogénétique
de
deux
espèces
de
Speonomus
(Coléoptères,
Bathysciinae).
Mem
Biospéol7,
267-271
Gorman
GC,
Kim
YJ
(1976)
Anolis
lizards
of
the
Eastern
Caribbean:
a
case
study
in
evolution.
II.
Genetic
relationships
and
genetic
variability
of
the
bimaculatus
group.
Syst
Zool 25,
62-77
Healy
MJ
(1972)
Drawing
a
probability
ellipse.
J Roy
Stat
Soc
series
C 21,
202-204
Jeannel
R
(1924)
Monographie
des
Bathysciinae.
Biospeologica.
L Arch
Zool
Exp
G6n
63,
1-436
Juberthie
C,
Delay
B,
Ruffat
G
(1980a)
Variations
biométriques
entre
diff
6
rentes
populations
de
Speonomus
hydrophilus
en
relation
avec
leur
situation
geographi-
que.
Mem
Biosp6ol
VII,
353-364
Juberthie
C,
Delay
B,
Bouillon
M
(1980b)
Sur
1’existence
d’un
milieu
souterrain
superficiel
en zone
non
calcaire.
CR
Acad
Sci
290,
49-52
Juberthie
C,
Delay
B,
Durand
J,
Juberthie-Jupeau
L,
Bouillon
M,
Ruffat
G
(1981)
Etude
écologique,
biométrique,
morphologique
et
biologique
de
Speono-
mus
zophosinus.
M6m
Biosp6ol
VIII,
83-102
Juberthie-Jupeau
L,
Cazals
M
(1984)
Modalites
de
I’accouplement
dans
diff6rentes
populations
du
complexe
Speonomus
delarouzeei.
Col6optbres
Bathysciinae
souter-
rains.
Mem
Biosp6ol
XI,
165-172
Lessios
HA
(1981)
Divergence
in
allopatry
molecular
and
morphological
differenti-
ation
between
sea
Urchins
separated
by
the
Isthmus
of
Panama.
Evolution
35,
618-634
Lewontin
RC
(1984)
Detecting
population
differences
in
quantitative
characters
as
opposed
to
gene
frequencies,
Am
Nat
123,
115-124
Nei
M
(1972)
Genetic
distance
between
populations.
Am
Nat
106, 283-292
Nei
M
(1977)
Statistics
and
analysis
of
gene
diversity
in
subdivided
populations.
Ann
Hum
Genet
(Lond)
41,
225-233
Nei
M
(1978)
Estimation
of
average
heterozygosity
and
genetic
distance
from
a
small
number
of
individuals.
Genetics
89,
583-590
Nei
M
(1986)
Definition
and
estimation
of
fixation
indices.
Evolution
40,
643-647
Nei
M,
Roychoudhury
AK
(1974)
Sampling
variances
of
heterozygosity
and
genetic
distance.
Genetics
76,
379-390
Nevo
E
(1978)
Genetic
variation
in
natural
populations.
Pattern
and
theory.
Theor
Pop
Biol 13,
121-177
Schnell
GD,
Kennedy
NL,
Best
TL
(1978)
Interspecific
morphological
variation
in
Kangaroo
rats
(DBpodomys).
Degrees
of
concordance
with
genic
variation.
Syst
Zool 27,
34-48
Sene
FM,
Carson
HL
(1977)
Genetic
variation
in
Hawaiian
Drosophila IV,
Allozymic
similarity
between
D
silvestris
and
D
heteroneura
from
islands
of
Hawaii.
Genetics
86, 187-198
Sneath
PHA,
Sokal
RR
(1973)
Numerical
Taxonomy.
WH
Freeman
and
Co,
San
Francisco
Sokal
RR,
Rohlf
R
(1969)
Biometry:
the
principles
and
practice
of
statistics
in
Biological
research.
WH
Freeman
and
Co,
San
Francisco
Turner
JRG,
Johnson
MS,
Eanes
WF
(1979)
Contrasted
modes
of
evolution
in
the
same
genome:
allozymes
and
adaptive
change
in
Heliconius.
Proc
Natl
Acad
Sci
USA
76,
1924-1928
Wilson
AC
(1976)
Gene
regulation
in
evolution,
In:
Molecular
Evolution
(Ayala
FJ,
ed)
Sinauer,
Sunderland,
Mass,
225-234
Wilson
AC,
Maxson
LR,
Sarich
VM
(1974)
Two
types
of
molecular
evolution.
Evidence
from
studies
of
interspecific
hybridization.
Proc
Natl
Acad
Sci
USA
71,
2843-2847
Workman
PL,
Niswander
JD
(1970)
Population
studies
on
south-western
Indian
Tribes.
II.
Local
genetic
differentiation
in
the
Papago.
Am
J
Hum
Genet
22,
24-29
Wright
S
(1965)
The
interpretation
of
population
structure
by
F
statistics
with
special
regard
to
systems
of
mating.
Evolution
19,
395-420