Báo cáo sinh học: "Selection response of growth rate in rabbits for meat production" pptx
Bạn đang xem bản rút gọn của tài liệu. Xem và tải ngay bản đầy đủ của tài liệu tại đây (604.14 KB, 11 trang )
Original
article
Selection
response
of
growth
rate
in
rabbits
for
meat
production
J
Estany
J
Camacho
M
Baselga
A
Blasco
Universidad
Polit6enica
de
halencia,
Departamercto
de
Ciencia
Animal
l!6020
Valencia,
Spain
(Received
9
August
1991;
accepted
21
September
1992)
Summary -
Genetic
and
environmental
trends
in
2
lines
of
rabbit
(B
and
R)
selected
on
individual
weight
gain
(WG)
from
weaning
(4
wk)
to
slaughter
(11
wk)
were
estimated
using
mixed
model
methodology.
Line
B
was
derived
from
the
California
breed
and
line
R
was
a
synthetic
of
stock
of
different
origin.
The
data
were
collected
from
a
single
herd
and
comprised
7 718
individuals
in
line
B and
9 391
in
line
R,
the
lines
having
12
and
9
generations
of
selection
respectively.
Realized
responses
in
the
2
lines
were
2.7%
and
2.2%
of
the
initial
mean
per
year
respectively
and
showed
that
selection
on
WG
was
effective
but
was
less
than
expected.
Selection
on
slaughter
weight
(SW)
and
effects
of
selection
on
other
economic
traits
are
discussed.
It
is
concluded
that
selection
on
either
WG
or
SW
is
a
simple
method
for
improving
growth
rate
in
rabbit
sire
line
stocks.
selection
/
growth
rate
/
rabbit
/
mixed
model
Résumé -
Réponse
à
la
sélection
pour
la
croissance
chez
le
lapin
de
chair.
On
a
estimé
les
tendances
génétiques
et
environnementales
dans
2 lignées
de
lapin
(B
et
R),
sélectionnées
sur
le
gain
de
poids
(WG)
entre
le
sevrage
(28
jours)
et
l’abattage
(77
j),
en
utilisant
la
méthodologie
du
modèle
mixte.
La
lignée
B
est
issue
de
la
race
californienne;
la
lignée
R
est
une
souche
synthétique.
Les
données,
recueillies
dans
un
seul
élevage,
incluaient
7718
individus
de
la
lignée
B
et
9391
de
la
lignée
R,
représentant
respectivement
12
et
9
générations
de
sélection.
Les
réponses
à
la
sélection
dans
les
2
lignées,
respectivement
2,7%
et
2,2%
de
la
moyenne
par
an,
montrent
que
la
sélection
a
été
efficace,
mais
avec
des
réponses
inférieures
aux
valeurs
espérées.
La
sélection
sur
le
poids
d’abattage
(SW)
et
les
effets
de
la
sélection
sur
d’autres
caractères
économiques
sont
discutés.
On
conclut
que
la
sélection
sur
WG,
ou
sur
SW,
est
une
méthode
simple
pour
améliorer
la
vitesse
de
croissance
des
souches
paternelles
de
lapin.
sélection
/
vitesse
de
croissance
/
lapin
/
modèle
mixte
*
Permanent
address:
UPC-IRTA,
Area
de
Producci6n
Animal,
25006
Lleida,
Spain
**
Permanent
address:
Universidad
Nacional,
Escuela
Ciencias
Agrarias,
Heredia
3000,
Costa
Rica
***
Correspondence
and
reprints
INTRODUCTION
Most
breeding
schemes
concerning
rabbits
for
meat
production
involve
a
specialized
sire
line
selected
exclusively
on
growth
rate
and
1
or
2
dam
lines
in
which
litter
size
is
the
major
trait
in
the
selection
objective
(Rouvier,
1981;
Baselga
and
Blasco,
1989).
Selection
for
litter
size
has
been
discussed
by
Matheron
and
Rouvier
(1977)
who
proposed
use
of
a
family
index
to
increase
the
rate
of
response.
More
recently,
Estany
et
al
(1988a)
assessed
the
advantages
of
introducing
mixed model
methodology
(Henderson,
1973)
in
the
selection
of
dam
lines.
However,
not
much
attention
has
been
paid
to
improving
the
efficiency
of
selection
in
sire
or
dual
purpose
lines.
Although
it
has
been
suggested
that
the
heritability
of
growth
rate
is
high
enough
to
make
phenotypic
selection
efficient,
little
theoretical
and
experimental
evidence
has
been
presented.
Three
selection
experiments
based
on
the
individual
performance
of
average
daily
growth
between
28
and
77
d
or
live
weight
at
112 d have
been
carried
out
(Rochambeau,
1988).
Observed
responses
to
selection
were
lower
than
expected.
The
main
aim
of
this
paper
was
to
evaluate
the
genetic
trends
achieved
in
2
strains
of
rabbits
selected
on
growth
rate
for
9
and
12
generations
respectively.
MATERIALS
AND
METHODS
Rabbit
stocks
and
selection
Two
closed
lines
of
rabbits
(in
this
paper
referred
to
as
line
B
and
line
R)
were
used
in
the
experiment.
Founder
animals
in
line
B
were
chosen
randomly
from
a
base
population
of
California
rabbits
(49
females
and
14
males).
Line
R
was
a
synthetic
line
created
after
2
generations
of
crossing
from
a
pool
of
animals
of
3
commercial
sire
lines
(71
females,
14
males).
Animals
were
reproduced
within
a
nested
mating
structure,
avoiding
matings
of
animals
with
common
grandparents.
Generations
were
discrete.
Although
animals
from
2
different
generations
were
not
mated
they
could
be
contemporary,
because
the
last
litters
of
one
generation
were
produced
at
the
same
time
as
the
first
litters
of
the
next
generation.
The
experiment
was
designed
to
have
20
males
and
80
females
per
generation.
Selection
for
growth
rate
started
in
1980
for
line
B
and
in
1984
for line
R.
Young
animals
were
selected
according
to
individual
weight
gain
(WG)
from
weaning
(4
wk
old)
to
slaughter
(11
wk
old),
referred
to
a
seasonal
mean
and
corrected
by
a
moving
average
computed
every
2
wk. Males
were
selected
within
their
sire
families
in
order
to
reduce
inbreeding.
Individuals
were
identified
and
weighed
at
weaning
(WW)
and
slaughter
(SW).
Selection
started
when
most
of
the
does
had
1
litter
weaned.
Selection
continued
for
2
months,
so
most
of
the
replacement
came
from
the
first
litters.
Selection
operated
on
an
average
of
240
candidates
of
each
sex
per
generation.
At
the
end
of
the
test,
selected
animals
were
culled
for
health
problems
inde-
pendently
of
performance.
Selected
bucks
and
does
were
first
mated
at !
20
wk
of
age,
while
later
matings
were
made
weekly
10
d
after
parturition.
Females
fail-
ing
to
conceive
after
3
services
were
culled.
Also,
does
could
be
culled
at
weaning
for
health
problems.
Mating
of
close
relatives
was
avoided;
the
maximum
relation-
ship
of
mates
allowed
was
0.125.
Moreover,
to
minimize
the
rate
of
inbreeding,
no
more
than
2
male
progeny
were
selected
from
the
same
sire.
The
total
number
of
generations,
sires,
dams
and
individuals
per
line
is
summarized
in
table
I.
All
animals
were
housed
on
a
single
farm
and
reared
in
the
same
environment.
Young
rabbits
remained
in
the
dam’s
cage
until
weaning.
Cross-fostering
was
not
practised.
Later,
rabbits
were
placed
in
growing
cages
of
8
individuals
and
fed
ad
libitum
with
a
standard
granulated
feed.
Temperature
inside
the
fattening
units
could
range
from
5-34°C.
Statistical
methods
The
following
animal
model
was
used
to
estimate
environmental
and
genetic
effects
for
each
trait
analyzed
(WG, WW
and
SW)
in
each
line
(B
and
R):
where
m
=
overall
mean ; s
i
=
the
fixed
effect
of
the
ith
year-season
at
birth
(each
season
consisted
of
13
wk); l
j
=
the
fixed
effect
of
the
jth
litter
size
class
born
alive
(litter
size
was
coded
in
the
following
manner:
line
B, j
=
1:
1—
3
newborn
rabbits,
j
=
2 -
11:
4 -
13,
and j
=
12:
14
or
more.
Line R, j
=
1:
1 -
3, j
=
2 -
12:
4 -
14,
and j
=
13:
15
or
more);
ak
=
the
random
additive
genetic
effect
of
the
kth
animal;
p,
=
the
random
maternal
effect
of
the
lth
doe
on
all
its
progeny
(excluding
dam
additive
effect);
ei!!!
=
the
random
error.
No
sex
effect
was
included
as
there
is
no
sexual
dimorphism
at
this
age
(G6mez
and
Blasco,
1992).
All
pedigrees
were
known
so
a
complete
relationship
matrix
was
incorporated
to
account
for
the
covariances
between
animal
effects.
Residual
and
maternal
effects
were
assumed
uncorrelated
with
each
other
and
with
animal
effects.
In
order
to
reduce
computational
requirements,
the
model
was
fitted
using
an
equivalent
re-
duced
animal
model
(Quaas
and
Pollak,
1980)
and
a
single-trait
pseudoexpectation
approach
to
estimate
variance
components
(Schaeffer,
1986).
This
is
an
iterative
procedure
based
on
quadratic
forms
similar
to
those
used
in
the
Residual
Maxi-
mum
Likelihood
(REML)
procedure
(Patterson
and
Thompson,
1971).
It
gives
and
approximate
REML
solution,
but
it
is
less
demanding
in
computing
time
(REML
is
very
demanding
because
it
requires
inverting
a
large
matrix,
whereas
the
pseu-
doexpectation
approach
does
not
require
any
matrix
inversion).
However
it
is
not
totally
free
of
selection
bias
as
the
REML
solutions
are.
It
seems
to
underestimate
the
parameters,
although
the
bias
is
not
large
(Ouweltjes
et
al,
1988).
As
we
did
not
have
facilities
to
maintain
control
lines,
the
averages
of
the
individual
genetic
predictors
in
each
generation
were
used
to
estimate
genetic
trends
(Sorensen
and
Kennedy,
1984).
The
standard
errors
(SE)
of
the
trends
were
calculated
without
taking
genetic
drift
into
account.
Cummulative
genetic
responses
were
expressed
as
contrasts
between
base
and
final
generations,
and
genetic
drift
was
considered
when
calculating
their
standard
errors
(Sorensen
and
Kennedy,
1983).
Environmen-
tal
changes
were
estimated
by
using
the
estimable
functions
of
year-season
effects.
Realized
phenotypic
selection
differentials
per
generation
were
obtained
after
correcting
the
data
for
the
fixed
effects
included
in
the
model
described
above
and
weighting
for
the
number
of
progeny
each
individual
contributed
to
the
next
generation
(Falconer,
1989).
Selection
intensity
was
estimated
by
dividing
the
selection
differentials
by
the
standard
deviation
(SD)
of
adjusted
phenotypic
values.
Inbreeding
coefficients
were
computed
for
all
animals
using
the
algorithm
described
by
Tier
(1990).
Estimated
responses
were
compared
with
those
predicted
by
applying
the
algorithm
of
Wray
and
Thompson
(1990)
to
the
obtained
selection
intensities
and
inbreeding
coefficients.
This
algorithm
takes
into
account
the
reduction
in
genetic
variance
caused
by
gametic
disequilibrium
and
inbreeding.
RESULTS
Overall
means
and
standard
deviations
Components
of
variance,
estimated
by
the
pseudoexpectation
method,
are
shown
in
table
II
expressed
as
a
proportion
of
phenotypic
variances.
These
are
the
estimates
of
the
base
population
before
selection.
SEs
were
not
computed
due
to
the
high
requirements
in
computing
cost.
The
overall
means
and
standard
deviations
of
traits
after
fitting
random
effects
in
the
2
lines
are
presented
in
table
III.
The
means
refer
to
the
base
generation
genetic
level
and
therefore
they
can
be
considered
as
the
means
at
the
beginning
of
the
experiment.
Line
R
was
heavier
at
weaning
than
line
B
but
its
weight
gain
was
less.
These
differences
were
somewhat
more
favourable
to
line
B
when
only
seasons
in
common
were
taken
into
account.
Phenotypic
variances
were
also
slightly
higher
in
line
B.
Coefficients
of
variation
ranged
from
12.4-18.7%,
the
highest
being
for
T!I% W
in
line
B.
Environmental
influences
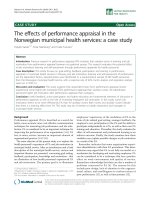
Figure
1
shows
the
effect
of
year-season
on
WG.
The
corresponding
figures
for
WW
and
SW
were
very
similar
to
figure
1.
Environmental
changes
were
dramatically
influenced
by
the
cyclical
pattern
of
seasonal
effects
within
years.
The
amplitude
of
the
cycles
could
be
as
high
as
one
phenotypic
SD,
as
is
the
case
of
SW
in line
R,
and
ranged
from !
0.7
to
0.9
SD
for
WG.
As
expected,
maximum
values
correspond
to
winter
and
minimum
values
to
summer.
Differences
between
2
successive
seasons
could
add
up
to
0.7
phenotypic
SD
for
WG.
Long-term
environmental
trends
showed
a
significant
increase
in
all
cases.
However,
they
were
not
monotonic
and
can
be
explained
by
a
large
husbandry
improvement
during
1984.
At
the
end
of
that
year
the
feed
was
improved
and
its
quality
remained
similar
for
the
last
4
yr
of
the
experiment.
The
trend
of
year-season
effects
on
time
were
nearly
parallel
in
the
2
lines
so
there
was
no
interaction
between
line
and
year-season.
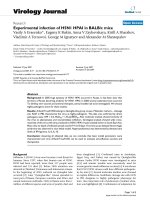
Figure
2
shows
the
effect
of
litter
size
class
on
WW
and
WG.
Linear
regression
of
litter
size
effect
on
litter
size
was
significant
(p
<
0.05)
in
line
B and
R
for
WW
(-34.0 t
2.8
and
-30.0 t
2.7)
and
for
SW
(-41.5 t
3.3
and
-37.4 t
4.4)
but
was
not
significant
for
GVG.
Linear
regression
fitted
well,
the
coefficient
of
determination
being
0.85
or
higher.
Litter
size
effects
were
more
important
than
year-season
effects
only
for
TV1iV.
SDs
of
year-season
effects
were
3.8
and
6.3-fold
those
corresponding
to
litter
size
class
effects
for
WG
in
lines
R and
B
respectively.
Genetic
trends
Estimated
genetic
trends
in
each
line
are
presented
in
table
IV.
Genetic
trend
was
estimated
as
a
linear
regression
of
the
average
estimated
breeding
value
on
generation
number.
Cumulative
estimated
genetic
responses
are
relative
to
the
base
level
for
foundation
individuals
of
zero.
As
a
univariate
model
has
been
applied
for
each
trait,
correlated
responses
could
be
biased
(Johansson
and
Sorensen,
1990).
However,
since
correlations
of
vVG
with
WW
and
SW
are
close
to
zero
and
unity
respectively
(Camacho,
1989),
the
bias
should
be
small.
Direct
responses
for
YVG
were
significant
and
positive
in
both
lines.
Line
B
showed
a
higher
rate
of
improvement
per
generation
(2.0%
of
the
base
population
mean
in
line
B and
1.6%
in
line
R)
and
on
a
year
basis
(2.7% vs
2.2%).
Total
genetic
progress
was
22.2%
and
13.2%
of
the
initial
means
in
line
B and
R
respectively.
Genetic
improvement
in
WG
was
mostly
associated
with
a
correlated
gain
in
SW.
Genetic
change
in
WW
was
not
statistically
significant.
Selection
differentials
for
individual
selection,
selection
intensities
and
mean
inbreeding
coefficients
for
each
sex
and
generation
are
shown
in
table
V.
Selection
was
1.5-2-fold
more
intensive
in
males
than
in
females.
Rates
of
inbreeding
per
generation
were
1.27%
in
line
B and
0.81%
in
line
R
and
are
comparable
to
those
predicted
from
theory
(Wray
and
Thompson,
1990),
and
close
to
the
predicted
rate
without
selection
(0.78%).
Responses
based
on
realized
selection
intensities
and
inbreeding
coefficients
were
also
calculated
(table
V).
Responses
are
predicted
with
a
methodology
which
into
account
the
reduction
of
the
variance
due
to
genetic
disequilibrium
and
inbreeding
(Wray
and
Thompson,
1990).
Cumulative
responses
estimated
by
mixed
model
methodology
(table
IV)
are
found
to
be
5.9%
(line
B)
and
14.3%
(line
R)
lower
than
those
predicted
in
table
V.
DISCUSSION
AND
CONCLUSIONS
The
use
of
mixed
model
methodology
to
measure
genetic
change
without
a
control
line
has
been
criticized
by
Thompson
(1986). He
showed
that
the
realized
her-
itability
estimates
are
highly
dependent
on
the
a
priori
parameters
used
in
the
estimation.
When
a
control
line
is
not
available,
Smith
(1988)
suggests
estimating
the
a
priori
parameters
iteratively
by
REML.
Then,
when
the
relationship
matrix
is
complete
and
the
animal
model
is
used,
the
trend
in
estimated
breeding
value
may
give
a
reasonable
approximation
to
the
genetic
response
for
traits
of
moderate
to
high
heritability.
This
has
been
checked
by
Mrode
et
al
(1989a,
b)
in
beef
cattle
experiment
with
a
control
line.
Genetic
responses
achieved
in
both
rabbit
selection
lines
showed
that
individual
selection
on
weight gain
from
weaning
to
slaughter
age
was
effective.
However,
as
in
other
rabbit
selection
experiments
reported
(Mgheni
and
Christensen,
1985;
Rochambeau
et
al,
1989),
responses
were
lower
than
the
expected
according
to
the
experimental
design.
While
expected
responses
per
generation
range
from
3-4%
of
the
mean,
realized
responses
were
only =
1-2%
of
the
mean
per
generation.
To
explain
the
disagreement
between
expected
and
realized
responses
most
authors
implicate
low
selection
intensities
and
maternal
effects.
Realized
selection
intensities
per
generation
ranged
from
0.570-1.085
(table
V),
averaging
0.765
for
line
B and
0.805
for
line
R.
These
values
were
56.3%
(line
B)
and
59.2%
(line
R)
lower
than
that
planned
(1.360)
for
a
population
of
80
does
and
20
bucks,
each
doe
having
6
offspring
and
selecting
one
buck
per
sire.
Similar
results
were
obtained
by
Rochambeau
et
al
(1989)
and
are
indicative
of
the
difficulties
in
achieving
high
selection
intensity
in
practice.
Results
obtained
in
this
experiment
and
those
outlined
by
Rochambeau
et
al
(1989)
showed
that
selection
differentials
were
only !
60%
of
those
planned.
Health
problems
and
some
particulars
in
the
management
of
discrete
generations
are
seen
as
major
causes
of
failure
to
achieve
the
expected
differentials.
Since
some
diseases
occurring
in
intensive
rabbit
units
are
difficult
to
control,
mortality
and
culling
rates
of
selected
animals
are
important
in
comparison
with
other
species.
Thus,
in
some
generations
post-weaning
mortality
was
as
high
as
30%
and
culling
rates
can
reach
similar
values
(Torres
et
al,
1987).
As
pointed
out
by
Baselga
et
al
(1988),
there
is
some
scope
to
improve
genetic
resistance
to
respiratory
diseases
by
culling
affected
animals.
Because
the
generations
were
discrete,
selection
was
not .
continuous
over
time.
Selection
did
not
start
until
the
number
of
individuals
in
the
parental
generation
was
close
to
the
given
number
(480),
so
replacement
animals
could
only
be
selected
from
among
animals
born
later.
All
these
factors
tended
to
decrease
theoretical
selection
differentials
and
therefore
selection
opportunities.
A
more
efficient
alternative
to
individual
selection
is
the
use
of
the
BLUP
method
(Wray,
1989;
Wray
and
Thompson,
1990),
because
it
permits
a
better
seasonal
and
litter
size
class
effect
adjustment
and
an
optimal
use
of
family
records.
Especially
when
generations
overlap
and
sequential
culling
is
practised,
BLUP
produces
substantially
higher
rates
of
genetic
progress
than
individual
selection
(Belonsky
and
Kennedy,
1988).
Though
litter
size
class
effects
can
be
neglected
when
selection
is
on
WG,
season
effects
should
always
be
considered.
Recording
could
be
reduced
if
selection
was
made
on
SW
instead
of
WG.
The
genetic
correlation
between
the
traits
has
been
estimated
to
be
near
unity
(Camacho,
1989)
and
there
is
also
evidence
that
the
genetic
response
in
WG
is
associated
with
correlated
response
in
SW
(Estany
et
al,
1988b;
Camacho,
1989;
Rochambeau
et
al 1989).
If
that
is
the
case,
cross-fostering
to
equalize
litter
size
would
be
worthwhile
to
reduce
any
maternal
effect
on
SW.
Otherwise,
litter
size
must
be
taken
into
account
in
genetic
evaluation
models.
The
use
of
an
index
for
improvement
of
SW
using
weights
at
earlier
ages
has
been
suggested
(Khalil
et
al,
1986).
However,
if
genetic
parameters
estimated
in
lines
B and
R
for
WW
and
SW
are
used
it
seems
not
to
be
worthwhile,
as
rates
of
response
are
expected
to
be
improved
by
only m
1%
of
the
rate.
In
an
economic
context
growth
rate
must
be
considered
in
relation
to
other
economic
traits
included
in
the
breeding
goal
and,
in
particular,
to
feed
efficiency,
body
composition
and
litter
size.
Unfortunately,
estimates
of
the
genetic
effects
of
selection
for
growth
rate
on
these
traits
are
scarce
and
not
very
precise.
Nonetheless,
results
reviewed
by
Rochambeau
(1988)
suggest
that
growth
rate
is
generally
well
correlated
genetically
to
them,
in
accordance
with
some
results
obtained
in
the
present
lines
(Camacho,
1989;
Blasco
et
al,
1990).
Some
attention,
however,
is
required
with
regard
to
culling
rates
and
failure
to
rear
a
litter
observed
in
lines
selected
for
growth
rate
(Torres
et
al,
1987;
Rochambeau
et
al,
1989).
Further
research
is
needed
to
study
the
effects
of
selection
for
growth
rate.
However,
it
appears
to
be
a
good
and
simple
criterion
for
improving
rabbit
sire
line
breeding
stocks
for
a
range
of
production
systems.
ACKNOWLEDGMENTS
We
are
grateful
to
the
staff
of
the
farm
and
to
J
Sauquillo
for his
help
and
care
of
the
animals.
This
work
was
supported
by
the
Spanish
Ministerio
de
Educaci6n
y
Ciencia
(CICYT).
REFERENCES
Baselga
M,
Blasco
A
(1989)
Mejora
Genetica
del
Conejo
de
Producei6n
de
Carne.
Ed
Mundi
Prensa,
Madrid
Baselga
M,
Deltoro
J,
Camacho
J,
Blasco
A
(1988)
Genetic
analysis
of
lung
injury
in
four
strains
of
meat
rabbits.
In:
4th
World
Rabbit
Sci
Assoc
Congr.
Budapest,
11-14
October
1988,
vol
2,
120-128
Belonsky
GM,
Kennedy
BW
(1988)
Selection
on
individual
phenotypic
and
Best
Linear
Unbiased
Predictor
of
breeding
values
in
a
closed
swine
herd.
J
Anim
Sci
66,
1124-1131
Blasco
A,
Gou
P,
Santacreu
MA
(1990)
The
effect
of
selection
on
changes
in
body
composition
of
two
lines
of
rabbit.
In:
4th
World
Congr
Genet
Ap
PI
Livest
Prod.
Edinburgh,
23-27
July
1990,
vol
16,
362-365
Camacho
J
(1989)
Estimaci6n
de
correlationes
gen6ticas
entre
caracteres
reproduc-
tivos
y
de
crecimiento
en
conejos.
Doctoral
Thesis,
Polytech
Univ,
Valencia,
Spain
Estany
J,
Baselga
M,
Blasco
A,
Camacho
J
(1988a)
Comparison
between
BLUP
and
index
for
selection
on
litter
size.
In:
4th
World
Rabbit
Sci
Assoc
Congr.
Budapest,
11-14
October
1988,
vol
2,
69-72
Estany
J,
Baselga
M,
Blasco
A,
Camacho
J
(1988b)
Estimation
of
genetic
trend
on
rabbit
growth
rate
by
mixed
model
methodology.
In:
4th
World
Rabbit
Sci
Assoc
Congr.
Budapest,
11-14
October
1988,
vol
2,
104-113
Falconer
DS
(1989)
Introduction
to
Quantitative
Genetics.
Longman,
London,
3rd
edn
Gomez
E,
Blasco
A
(1992)
Growth
curves
of
lines
selected
on
growth
rate
or
litter
size.
Proc
Vth
Congr
World
Rabbit
Sci
Assoc.
Oregon,
July
25-30,
1992
(in
press)
Henderson
CR
(1973)
Sire
evaluation
and
genetic
trends.
In:
Anim
Breeding
Genet
Sy!n,,v
ASAS-ASDA
(in
honor
of
JL
Lush)
Champaign,
10-41
Johansson
K,
Sorensen
DA
(1990)
Estimation
of
direct
and
correlated
response
to
selection
by
single
trait
and
multiple
trait
animal
models.
In:
4th
World
Congr
Genet
A,vPI
Livest
Prod.
Edinburgh,
23-27
July
1990,
vol
13,
285-288
Khalil
MH,
Owen
JB,
Af
ifi
EA
(1986)
A
review
of
phenotypic
and
genetic
pa-
rameters
associated
with
meat
production
traits
in
rabbits.
Anim
Breed
Abstr
54,
725-749
Matheron
G,
Rouvier
R
(1977)
Optimisation
du
progres
g6n6tique
sur
la
prolificit6
chez
le
lapin.
Ann
Genet
Sel
Anim
9,
393-405
Mgheni
M,
Christensen
K
(1985)
Selection
experiment
on
growth
and
litter
size
in
rabbits.
II.
Two-way
selection
response
for
body
weight
at
112
days.
Acta
Agric
Scand
35,
278-286
Mrode
RA,
Smith
C,
Thompson
R
(199a)
Selection
for
rate
and
efficiency
of
lean
gain
in
Hereford
cattle.
I.
Selection
pressure
applied
and
direct
responses.
Anim
Prod
51,
23-24
Mrode
RA,
Smith
C,
Thompson
R
(1990b)
Selection
for
rate
and
efficiency
of lean
gain
in
Hereford
cattle.
11.
Evaluation
of
correlated
responses. Anim
Prod
51, 35-46
Ouweltjes
W,
Schaeffer
LR,
Kennedy
BW
(1988)
Sensitivity
of
methods
of
variance
component
estimation
to
culling
type
selection
J.
Dairy
Sci
71,
773-779
Patterson
HD,
Thompson
R
(1971)
Recovery
of
interblock
information
when
block
sizes
are
unequal.
Biometrika
58,
545
Quaas
RL,
Pollak
EJ
(1980)
Mixed
model
methodology
for
farm
and
ranch
beef
cattle
testing
programmes.
J
Anim
Sci
51,
1277-1287
Rochambeau
H
de
(1988)
Genetics
of
the
rabbit
for
wool
and
meat
production
(1984-1987).
In:
l,th
World
Rabbit
Sci
Assoc
Congr.
Budapest,
11-14
October
1988,
vol
2,
1-68
Rochambeau
H
de,
Fuente
LF
de
la,
Rouvier
R,
Ouhayoun
J
(1989)
Selection
sur
la
vitesse
de
croissance
post-sevrage
chez
le
lapin.
Genet
Sel
Evol
21,
527-546
Rouvier
R
(1981)
L’am6lioration
g6n6tique
du
lapin
en
France.
Bull
Tech
Inf 358,
239-258
Smith
C
(1988)
Checking
rates
of
genetic
responses
with
new
reproductive
tech-
niques.
3rd
World
Congr
Sheep
Beef
Cattle
Breeding
1,
159-171
Schaeffer
LR
(1986)
Pseudoexpectation
approach
to
variance
component
estima-
tion.
J
Dairy
Sci
69,
2884-2889
Sorensen
D,
Kennedy
B
(1983)
The
use
of
the
relationship
matrix
to
account
for
genetic
drift
variance
in
the
analysis
of
genetic
experiments.
Theor
Awpd
Genet
66,
217-220
Sorensen
DA,
Kennedy
BW
(1984)
Estimation
of
response
to
selection
using
least
squares
and
mixed
model
equations.
J
Anim
Sci
58,
1097-1106
Thompson
R
(1986)
Estimation
of
realized
heritability
in
a
selected
population
using
mixed model
methods.
Genet
Sel
Evod 18,
475-484
Tier
B
(1990)
Computing
inbreeding
coefficients
quickly.
Genet
Sel
Evod 22,
419-430
Torres
C,
Garces
M,
Fabado
F,
Pla
M
(1987)
Productividad
de
conejas
en
funci6n
del
n6mero
de
partos.
In:
12th
Sy!np
Asoc
Espanola
Cunicul.
251-263
Wray
NR
(1989)
Consequences
of
selection
in
finite
populations
with
particular
reference
to
closed
nucleus
herds
of
pigs.
PhD
Thesis
Univ
Edinburgh,
UK
Wray
NR,
Thompson
R
(1990)
Advances
in
Selection
Theory.
In:
4th
World
Congr
Genet
Appl
Livest
Prod.
Edinburgh,
23-27
July
1990,
vol
13,
167-176