Báo cáo y học: "Developmental stage related patterns of codon usage and genomic GC content: searching for evolutionary fingerprints with models of stem cell differentiation" potx
Bạn đang xem bản rút gọn của tài liệu. Xem và tải ngay bản đầy đủ của tài liệu tại đây (427.36 KB, 16 trang )
Genome Biology 2007, 8:R35
comment reviews reports deposited research refereed research interactions information
Open Access
2007Renet al.Volume 8, Issue 3, Article R35
Research
Developmental stage related patterns of codon usage and genomic
GC content: searching for evolutionary fingerprints with models of
stem cell differentiation
Lichen Ren
*
, Ge Gao
†
, Dongxin Zhao
‡
, Mingxiao Ding
‡
, Jingchu Luo
†
and
Hongkui Deng
‡
Addresses:
*
College of Life Sciences, Shanghai Jiao Tong University, Shanghai, 200240, PR China.
†
Center for Bioinformatics, College of Life
Sciences, National Laboratory of Protein Engineering and Plant Genetics Engineering, Peking University, Beijing, 100871, PR China.
‡
Department of Cell Biology and Genetics, College of Life Sciences, Peking University, Beijing, 100871, PR China.
Correspondence: Hongkui Deng. Email:
© 2007 Ren et al.; licensee BioMed Central Ltd.
This is an open access article distributed under the terms of the Creative Commons Attribution License ( which
permits unrestricted use, distribution, and reproduction in any medium, provided the original work is properly cited.
Developmental patterns of codon usage and genomic GC content<p>Developmental-stage-related patterns of gene expression correlate with codon usage and genomic GC content in stem cell hierar-chies.</p>
Abstract
Background: The usage of synonymous codons shows considerable variation among mammalian
genes. How and why this usage is non-random are fundamental biological questions and remain
controversial. It is also important to explore whether mammalian genes that are selectively
expressed at different developmental stages bear different molecular features.
Results: In two models of mouse stem cell differentiation, we established correlations between
codon usage and the patterns of gene expression. We found that the optimal codons exhibited
variation (AT- or GC-ending codons) in different cell types within the developmental hierarchy.
We also found that genes that were enriched (developmental-pivotal genes) or specifically
expressed (developmental-specific genes) at different developmental stages had different patterns
of codon usage and local genomic GC (GCg) content. Moreover, at the same developmental stage,
developmental-specific genes generally used more GC-ending codons and had higher GCg content
compared with developmental-pivotal genes. Further analyses suggest that the model of
translational selection might be consistent with the developmental stage-related patterns of codon
usage, especially for the AT-ending optimal codons. In addition, our data show that after human-
mouse divergence, the influence of selective constraints is still detectable.
Conclusion: Our findings suggest that developmental stage-related patterns of gene expression
are correlated with codon usage (GC3) and GCg content in stem cell hierarchies. Moreover, this
paper provides evidence for the influence of natural selection at synonymous sites in the mouse
genome and novel clues for linking the molecular features of genes to their patterns of expression
during mammalian ontogenesis.
Published: 12 March 2007
Genome Biology 2007, 8:R35 (doi:10.1186/gb-2007-8-3-r35)
Received: 12 September 2006
Revised: 8 January 2007
Accepted: 12 March 2007
The electronic version of this article is the complete one and can be
found online at />R35.2 Genome Biology 2007, Volume 8, Issue 3, Article R35 Ren et al. />Genome Biology 2007, 8:R35
Background
Synonymous codons, which encode the same amino acid, are
not used randomly. Such codon usage biases are explained as
the balance between mutational drift and natural selection
[1]. In unicellular organisms [2-6] and invertebrate metazo-
ans [7-11], the levels of gene expression can be used to inter-
pret their codon biases. Specifically, highly expressed genes,
compared with weakly expressed ones, selectively use 'opti-
mal codons' that correspond to abundant tRNAs so as to
improve their translational efficiency [11-15].
Nevertheless, in vertebrates, whose genes display more dra-
matic codon usage biases than those of simple organisms
[14], the correlations between codon usage and patterns of
gene expression (that is, the levels and breadth of gene
expression) remain a subject of controversy [11,16]. In a
number of rodent and human tissues, recent studies have
indicated positive correlations between levels of gene expres-
sion, as estimated by SAGE and/or microarray analysis, and
GC3 [16-19]. However, these results are in contradiction with
observations made by analyzing expressed sequence tags
(ESTs) [11,16]. Among extremely highly expressed genes, the
H3 histone gene family is biased to use GC-ending codons
[20]. However, there is no difference in codon usage between
ribosomal protein genes, which are also expressed at very
high levels, and other genes [14]. As to correlations between
breadth of gene expression and codon usage, some studies
suggest that housekeeping genes, with a wider breadth of
expression, are biased to use GC-ending codons [18,21-24]
(also see the debate between [25] and [16]); however, other
papers have described different observations [11,26-29].
Although codon usage has been found to exhibit variations in
human genes specifically expressed in six tissues [30], the
effect is very weak [31] and cannot be generalized to interpret
the global variation (the preference of AT-ending or GC-end-
ing codons) of synonymous codons in the thousands of mam-
malian genes.
Moreover, in vertebrates, the reasons why there are correla-
tions between codon usage and patterns of gene expression
remain to be elucidated. By using multivariance analyses
(MVA), highly expressed genes have been observed to have
excessive usage of T-ending codons in Xenopus [32] and the
Cyprinidae family [33]. However, both natural selection and
'transcriptional associated mutation bias' (TAMB) [34-36]
would account for these observations. In the tissues with no
evidence of TAMB, a set of GC-ending codons favored in
highly expressed genes has been suggested to be optimal
codons [19]. Moreover, GC-ending codons are more abun-
dant in highly expressed genes [18] and constitutively spliced
exons [37]. However, if GC-ending codons are optimal due to
selective advantages, it is difficult to see why the synonymous
substitution rate (Ks) would be increased with GC-ending
codon usage [38-41] or why the Ks of alternatively spliced
exons would be lower than that of constitutively spliced exons
[42]. It has been reported that highly expressed genes have
higher recombination rates [43-45]. Moreover, according to
the model of biased gene conversion (BGC), recombination
rates are positively correlated with GC3 [46-51], indicating
that both natural selection and BGC may be responsible for
the correlations between the levels of gene expression and
GC3. The variations of synonymous codon usage among tis-
sue-specific genes have been suggested to be the consequence
of translational selection [30]; a recent study, however, has
indicated that these observations were due to regional varia-
tions of substitutional patterns rather than translational
selection [31]. Taken together, further research is obviously
still needed to explore the mechanisms of vertebrate codon
usage bias.
In this paper, to investigate the regularity and mechanisms of
mammalian codon usage, we have taken developmental
stage-related patterns of gene expression into account in
models of stem cell differentiation (Figure 1 and Table 1).
Stem cells, progenitor cells and their derivates, defined by
their distinct differentiation potential (Figure 1a), play critical
roles in the early stages of metazoan ontogenesis and thus
provide ideal models of the mammalian developmental hier-
archy. Moreover, developmental processes are believed to be
of critical importance to the investigation of evolutionary
mechanisms [52], even at the genomic level [53]. In the cur-
rent study, therefore, we have investigated the correlations
between developmental stage-related patterns of gene
expression and codon usage in developmental hierarchies of
stem cell differentiation. Specifically, we have taken advan-
tage of two independent models of stem cell differentiation
[54,55] to identify developmental stage-related patterns of
gene expression, as well as the correlations between these
patterns of gene expression and codon usage.
To define the developmental stage-related patterns of gene
expression in models of stem cell differentiation, we have
introduced two parameters. First, the 'level of gene expres-
sion' has been defined as the intensity of gene transcription in
a particular cell type. Second, the 'fold change of gene expres-
sion' has been defined as the ratio of the expression levels of
the same gene in two cell types of two neighboring stages in
the developmental hierarchy (Figure 1b). We have further
defined one of these two cell types, in the upper developmen-
tal hierarchy, as the earlier cell type, and the other, in the
lower developmental hierarchy, as the later cell type. These
two cell types together constitute a 'differentiation pair'.
Thus, the 'fold change of gene expression' is a descriptive
index of the levels of gene enrichment in a given differentia-
tion pair.
In the present work, we investigate the correlations between
developmental stage-related patterns of gene expression
(that is, the 'levels of gene expression' in each cell type in the
models of stem cell differentiation and the 'fold changes of
gene expression' in each differentiation pair) and the molecu-
lar features (GC3 and genomic GC (GCg) content) of these
Genome Biology 2007, Volume 8, Issue 3, Article R35 Ren et al. R35.3
comment reviews reports refereed researchdeposited research interactions information
Genome Biology 2007, 8:R35
genes. We also explore possible mechanisms for these devel-
opmental stage-related patterns of codon usage. This study
reveals that developmental stage-related patterns of gene
expression are correlated with GC3 and GCg in models of
stem cell differentiation. Moreover, these analyses suggest
that the model of translational selection, rather than other
known hypotheses that have been put forward, might be the
most likely to account for the developmental stage-related
patterns of codon usage, especially for the negative correla-
tions between the levels of gene expression and GC3.
Results
'Levels of gene expression' are correlated with GC3
and GCg: variation of optimal codons within
developmental hierarchies
First, we focused on the correlations between the levels of
gene expression and GC3. We found significant negative cor-
relations between the levels of gene expression and GC3 in
eight cell types (P < 0.005; Table 2). In these datasets, we
observed that only in the lateral ventricles of the brain (LVB),
which contain predominantly mature neural cells, were the
levels of gene expression significantly positively correlated
with GC3 (P < 0.005; Table 2). We next investigated the var-
iation of codon usage between 'highly expressed genes' and
'mid to lowly expressed genes', which were divided by quan-
tiles of 0.67 (Q
0.67
) of the levels of gene expression in each cell
type. We observed that in the eight cell types in which the lev-
els of gene expression were negatively correlated with GC3,
the highly expressed genes used significantly more AT-ending
codons compared with the mid to lowly expressed genes (P <
0.01; Table 2). In addition, in LVB, highly expressed genes
used more GC-ending codons than mid to lowly expressed
genes (P < 0.05; Table 2). The 'optimal codons' are defined
here as the codons that were preferentially present in highly
expressed genes. Our observations, therefore, show that the
optimal codons vary within the developmental hierarchies.
In accordance with the variation in GC3, we found that GCg
was also significantly different between highly expressed
genes and mid to lowly expressed genes in each of the nine
cell types (P < 0.05), where the levels of gene expression were
significantly correlated (positively in LVB or negatively in the
eight cell types) with GC3 (P < 0.005; Table 2). Consistent
with earlier studies (for example, [14,40]), we observed that
GC3 and GCg were closely correlated in our dataset (Spear-
man rank correlation coefficient (Rs) = 0.665, N = 11,066; P
< 10
-6
). We thus suggest that the variation of GCg between the
highly expressed and mid to lowly expressed genes might well
be a consequence of this correlation.
'Fold changes of gene expression' are correlated with
GC3 and GCg: genes specifically expressed in different
developmental stages bear different molecular
features
First, we established correlations between the fold changes of
gene expression and GC3 in 12 differentiation pairs for which
there was experimental evidence of the differentiation proc-
esses (Figure 1b; also see Discussion). We found that in 10 of
the 12 differentiation pairs, the fold changes of gene
expression were significantly correlated with GC3 (P < 0.005;
Table 3). Strikingly, in differentiation pairs of neural stem
cells (NSCs)/LVB and embryonic stem cells (ESCs)/hemat-
opoietic stem cells (HSCs), up to 14.3% (Rs = 0.378) and
11.4% (Rs = 0.338) variation of GC3 could be explained by the
Table 1
Descriptions and definitions of each cell type in the models of stem cell differentiation
Abbreviation Model Descriptions Definitions
ESC A Pluripotent stem cell C57Bl/6 cell line
NSC A Adult neural stem cell *Neurosphere
LVB A Adult mature neural cell Lateral ventricles of the brain
HSC A Long-term hematopoietic stem cell
†
Lin
-
c-Kit
+
Sca-1
+
CD34
-
Hoe
low
BM A Non-hematopoietic stem cell Bone marrow main population
ESC B Pluripotent stem cell CCE cell line
FNSC B Fetal neural stem cell *
†
Hoe
low
from neurosphere
FLHSC B Fetal liver hematopoietic stem cell
†
Lin
-
AA4.1
+
c-Kit
+
Sca-1
+
FLLCP B Fetal liver hematopoietic progenitor cell
†
Lin
-
AA4.1
+
c-Kit
+
Sca-1
-
FLMBC B Fetal liver mature blood cell
†
Lin
+
LTHSC B Long-term hematopoietic stem cell
†
Lin
-
c-Kit
+
Sca-1
+
Rho
low
STHSC B Short-term hematopoietic stem cell
†
Lin
-
c-Kit
+
Sca-1
+
Rho
high
LCP B Hematopoietic progenitor cell
†
Lin
-
c-Kit
+
Sca-1
-
MBC B Mature blood cell
†
Lin
+
CD45 B Contain long-term hematopoietic stem cells
†
CD45
+
c-Kit
+
Sca-1
+
Stem cells and progenitor cells are defined in terms of their surface markers (
†
by FACS sorting) and/or growth characters (*by selective culture).
ESCs in both models A and B were functionally tested. For detailed descriptions and related references, see [54,55].
R35.4 Genome Biology 2007, Volume 8, Issue 3, Article R35 Ren et al. />Genome Biology 2007, 8:R35
respective fold changes of gene expression in these differenti-
ation pairs.
We next investigated the variation of GC3 and GCg between
genes enriched in two cell types of each differentiation pair.
When genes are expressed in both cell types of a given differ-
entiation pair, the 'fold change of gene expression' is a meas-
urement of the level of gene enrichment in this differentiation
pair. Thus, if the fold change of a certain gene expression is
higher than 2 or less than 0.5, this gene is defined as a devel-
opmental-pivotal gene in this paper. Our results show that, in
nine differentiation pairs, GC3 between the developmental-
pivotal genes enriched at the earlier and later developmental
stages differed significantly (P < 0.05; Table 3). Moreover, we
also found GCg between these two groups of genes to be sig-
nificantly different in seven differentiation pairs (P < 0.05),
especially in ESC/NSC, NSC/LVB, ESC/HSC, and ESC/fetal
neural stem cells (FNSCs) (P < 0.001; Table 3).
It should be noted that some genes, which were only
expressed in either the earlier or later developmental stages,
cannot be described in terms of 'fold change of gene expres-
sion'. We have defined these genes as developmental-specific
genes. We found that both GC3 and GCg were different
between developmental-specific genes in seven differentia-
tion pairs (P < 0.05; Table 3). In addition, at the same devel-
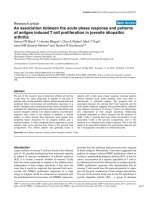
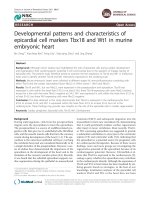
Cell types of different developmental stages in two models of stem cell differentiationFigure 1
Cell types of different developmental stages in two models of stem cell differentiation. (a) Cell types of earlier developmental stages can differentiate into
cell types of later developmental stages. The arrowheads indicate the direction of differentiation. Pluripotent stem cells (PSCs) occupy the earliest
developmental stage, as they can give rise to all cell types of the three germ layers. PSCs can generate less potent 'multipotent stem cells' (MSCs), which
are capable of generating all the cell lineages in specific tissues. MSCs can, in turn, give rise to lineage-committed progenitors (LCPs), which directly
produce mature cells in the later developmental stage. (b) Two models of stem cell differentiation in our research. The cell type colors correspond to the
developmental stages shown in (a). The arrows indicate the direction of differentiation within differentiation pairs made up of two neighboring stages in the
developmental hierarchy. Model A [54] contains pluripotent embryonic stem cells (ESCs), MSCs in adult hematopoietic (hematopoietic stem cells (HSCs))
and neural (neural stem cells (NSCs)) tissues, as well as the main cell populations in bone marrow (BM) and the cells in lateral ventricles of the brain (LVB),
which mainly contain mature cells in adult hematopoietic and neural tissues, respectively. Model B [55] contains ESCs and three types of MSCs that reside
in fetal neural (fetal neural stem cell (FNSCs)), fetal liver hematopoietic (fetal liver hematopoietic stem cells (FLHSCs)) and adult hematopoietic (long-term
functional hematopoietic stem cells (LTHSCs)) tissues. Model B also includes the key intermediate developmental stages of the hematopoietic hierarchy. In
adult bone marrow, short-term functional HSCs (STHSC) and bone marrow LCPs are intermediate developmental stages in the course from LTHSCs to
mature blood cells (MBCs). Fetal liver LCPs (FLLCPs) comprise an intermediate developmental stage between FLHSCs and FLMBCs. (For a detailed
description of each cell type and experimental evidence of these differentiation processes, see Table 1 and Discussion).
Differentiation
Developmental stages
Latter
Pluripotent stem cells
Multipotent stem cells
Lineage committed
progenitors
Mature Cells
Model_B
Model_A
ESC
NSC
LVB
HSC
BM
ESC
FNSC
FLHSC
FLLCP
FLMBC
LTHSC
STHSC
LCP
MBC
Fetal tissue
Adult tissue
Earlier
(a)
(b)
Genome Biology 2007, Volume 8, Issue 3, Article R35 Ren et al. R35.5
comment reviews reports refereed researchdeposited research interactions information
Genome Biology 2007, 8:R35
opmental stage, most groups of developmental-specific genes
generally use more GC-ending codons and are located in
genomic domains with higher GC content compared with
developmental-pivotal genes (Table 3; Additional data file 1).
Possible mechanisms of developmental stage-related
codon usage: testing the hypotheses of BGC, TAMB
and natural selection
We then attempted to investigate the mechanisms resulting
in the patterns of developmental stage-related codon usage
observed. In mammals, BGC, mutational bias, and natural
selection have been suggested to account for the biased usage
of synonymous codons [11,40].
The BGC model suggests a positive correlation between GC
content (including GC3) and recombination rates [46-50].
We observed that GC3 was positively correlated with recom-
bination rates in our datasets (Rs = 0.14, N = 10383, P < 10
-
6
). In this paper, we established the correlations between GC3
and the patterns of gene expression. Therefore, to determine
if the developmental stage-related patterns of codon usage
are byproducts of the BGC effect, we further studied the cor-
relations between the patterns of gene expression and recom-
bination rates. No significant correlations between
recombination rates and the levels of gene expression were
observed (Rs range from -0.033 to 0.020, P > 0.10; Addi-
tional data file 2). The only exception was in fetal liver mature
Table 2
The levels of gene expression are correlated with GC3 and GCg
Cell (model) Rs*EXPGC3
†
GCg
†
Ka
#
Ks
#
Ka/Ks
#
Ks_noDS
#
ESC (A) -0.166
‡
H0.537
‡
0.442
‡
0.042
‡
0.542
‡
0.069
‡
0.558
‡
M_L 0.580 0.452 0.057 0.573 0.090 0.604
NSC (A) -0.098
‡
H0.551
‡
0.446
‡
0.039
‡
0.537
‡
0.067
‡
0.555
‡
M_L 0.581 0.453 0.054 0.572 0.089 0.604
HSC (A) 0.010 (0.65) H 0.579 (0.26) 0.456 (0.20) 0.052
§
0.558 (0.10) 0.084
§
0.581
¶
M_L 0.582 0.455 0.057 0.572 0.090 0.602
LVB (A) 0.056
§
H0.583
¶
0.455
§
0.042
‡
0.541
‡
0.070
‡
0.568
‡
M_L 0.575 0.451 0.054 0.570 0.088 0.601
BM (A) 0.036 (0.09) H 0.578 (0.38) 0.456
¶
0.054
‡
0.564 (0.19) 0.087
‡
0.577
§
M_L 0.577 0.453 0.057 0.572 0.093 0.605
ESC (B) -0.112
‡
H0.550
‡
0.447
‡
0.042
‡
0.555
¶
0.069
‡
0.573
‡
M_L 0.583 0.453 0.061 0.568 0.098 0.604
FNSC (B) 0.014 (0.45) H 0.573 (0.31) 0.452 (0.27) 0.040
‡
0.546
§
0.066
‡
0.565
‡
M_L 0.574 0.451 0.056 0.568 0.091 0.601
FLHSC (B) -0.108
‡
H0.551
‡
0.447
§
0.047
‡
0.554
§
0.077
‡
0.567
‡
M_L 0.581 0.452 0.062 0.574 0.098 0.607
FLLCP (B) -0.120
‡
H0.557
‡
0.450
§
0.047
‡
0.558
¶
0.075
‡
0.572
‡
M_L 0.585 0.453 0.062 0.573 0.100 0.608
FLMBC (B) -0.109
‡
H0.548
‡
0.447
§
0.047
‡
0.547
‡
0.078
‡
0.563
‡
M_L 0.579 0.451 0.062 0.580 0.098 0.613
LTHSC (B) 0.041 (0.07) H 0.559 (0.23) 0.446 (0.12) 0.049
‡
0.547
§
0.081
§
0.560
§
M_L 0.555 0.443 0.055 0.570 0.089 0.593
STHSC (B) 0.015 (0.50) H 0.552 (0.15) 0.445 (0.48) 0.048
‡
0.550
§
0.078
‡
0.558
‡
M_L 0.558 0.445 0.056 0.571 0.091 0.597
LCP (B) -0.092
§
H0.546
‡
0.444
‡
0.048
‡
0.557
¶
0.077
‡
0.569
‡
M_L 0.573 0.450 0.058 0.570 0.096 0.602
MBC (B) -0.056
§
H0.558
§
0.446
§
0.053
‡
0.555
§
0.084
‡
0.570
‡
M_L 0.572 0.450 0.059 0.573 0.096 0.606
CD45 (B) -0.003 (0.87) H 0.579 (0.35) 0.455
¶
0.050
‡
0.560 (0.09) 0.080
‡
0.577
‡
M_L 0.580 0.452 0.063 0.572 0.101 0.610
*Rs: Spearman correlation coefficients between EXP (the levels of gene expression) and GC3 (
‡
P < 5 × 10
-6
,
§
P < 0.005). P values are shown if there
was no significance (P > 0.05).
†
Wilcoxon test was used to determine whether GC3 and GCg of highly expressed genes (H) were lower (or higher)
than GC3 and GCg of mid to lowly expressed genes (M_L). Highly expressed genes and mid to lowly expressed genes were divided by quantiles of
0.67 (Q
0.67
) of the levels of gene expression (
‡
P < 0.001,
§
P < 0.01,
¶
P < 0.05). P values are shown if there was no significance (P > 0.05).
#
Wilcoxon
test was used to determine whether Ka, Ks, Ka/Ks and Ks_noDS of highly expressed genes (H) were lower than Ka, Ks, Ka/Ks and Ks_noDSof mid
to lowly expressed genes (M_L) (
‡
P < 0.001,
§
P < 0.01,
¶
P < 0.05). P values are shown if there was no significance (P > 0.05).
R35.6 Genome Biology 2007, Volume 8, Issue 3, Article R35 Ren et al. />Genome Biology 2007, 8:R35
Table 3
Fold changes of gene expression are correlated with GC3 and GCg
DP* (model) Rs
†
Class GC3
‡
GCg
‡
Ka
§
Ks
§
Ka/Ks
§
Ks_noDS
§
ESC/NSC (A) -0.175
¶
DPG FC > 2 0.522
¶
0.437
¶
0.049 (0.10) 0.555 (0.45) 0.084 (0.14) 0.584 (0.23)
FC < 0.5 0.584 0.454 0.044 (0.30) 0.545 (0.13) 0.075 (0.27) 0.580 (0.33)
DSG ESC 0.607
¥
0.448
¶
0.097
¶
0.627
¶
0.136
¶
0.703
¶
NSC 0.642 0.469 0.058
#
0.563 (0.29) 0.101
#
0.619
¥
NDPG 0.557 0.448 0.048 0.561 0.079 0.577
NSC/LVB (A) -0.378
¶
DPG FC > 2 0.510
¶
0.433
¶
0.042
#
0.548
¥
0.074
¥
0.570 (0.15)
FC < 0.5 0.636 0.461 0.042 (0.27) 0.549 (0.25) 0.069 (0.24) 0.589 (0.49)
DSG NSC 0.580
¶
0.453 (0.10) 0.050 (0.28) 0.583 (0.16) 0.068 (0.35) 0.632
¥
LVB 0.635 0.462 0.081
¶
0.592
#
0.123
¶
0.652
¶
NDPG 0.587 0.457 0.049 0.562 0.081 0.585
ESC/HSC (A) -0.338
¶
DPG FC > 2 0.505
¶
0.431
¶
0.042
#
0.542
#
0.072
¥
0.565
¥
FC < 0.5 0.610 0.469 0.052 (0.17) 0.547 (0.12) 0.082 (0.13) 0.583 (0.45)
DSG ESC 0.596
¶
0.447
¶
0.074
¶
0.603
#
0.107
¶
0.663
¶
HSC 0.646 0.472 0.086
¶
0.593
¥
0.133
¶
0.647
¶
NDPG 0.579 0.456 0.050 0.566 0.080 0.587
HSC/BM (A) 0.043 (0.08) DPG FC > 2 0.592
¥
0.459 (0.08) 0.065
¶
0.590
#
0.099
¶
0.627
#
FC < 0.5 0.565 0.451 0.067 (0.05) 0.576 (0.20) 0.107 (0.05) 0.609 (0.13)
DSG HSC 0.638
#
0.473
#
0.070
¶
0.567 (0.25) 0.104
#
0.639
#
BM 0.593 0.454 0.096
¶
0.615
#
0.148
¶
0.670
#
NDPG 0.575 0.454 0.049 0.562 0.080 0.584
ESC/FNSC (B) -0.238
¶
DPG FC > 2 0.528
¶
0.442
¶
0.045 (0.50) 0.560 (0.42) 0.081 (0.42) 0.590 (0.31)
FC < 0.5 0.598 0.454 0.053
¥
0.550 (0.19) 0.088
¥
0.580 (0.36)
DSG ESC 0.599
¶
0.455 (0.13) 0.083
¶
0.591
¶
0.125
¶
0.642
¶
FNSC 0.635 0.460 0.062
¶
0.573 (0.06) 0.100
¶
0.630
¶
NDPG 0.569 0.452 0.049 0.561 0.079 0.585
ESC/FLHSC (B) -0.003 (0.90) DPG FC > 2 0.566 (0.50) 0.450 (0.09) 0.046 (0.46) 0.576
¥
0.073 (0.36) 0.606
#
FC < 0.5 0.571 0.447 0.060
#
0.570 (0.08) 0.099
#
0.600
¥
DSG ESC 0.608 (0.32) 0.456 (0.44) 0.072
¶
0.571
¥
0.113
¶
0.625
¶
FLHSC 0.617 0.455 0.097
¶
0.599
¶
0.143
¶
0.640
¶
NDPG 0.562 0.450 0.051 0.557 0.082 0.579
FLHSC/FLLCP (B) -0.058
#
DPG FC > 2 0.572 (0.17) 0.446
¥
0.068 (0.08) 0.563 (0.44) 0.107 (0.06) 0.607 (0.16)
FC < 0.5 0.587 0.458 0.069
¥
0.594
¥
0.104 (0.07) 0.629
¥
Genome Biology 2007, Volume 8, Issue 3, Article R35 Ren et al. R35.7
comment reviews reports refereed researchdeposited research interactions information
Genome Biology 2007, 8:R35
blood cells (FLMBCs; Rs = -0.043, P = 0.02), but this corre-
lation coefficient was weaker than that between the levels of
gene expression and GC3 in FLMBCs. In our datasets, the fold
changes of gene expression were significantly correlated with
DSG FLHSC 0.600
¥
0.447
#
0.082
¶
0.564 (0.49) 0.123
¶
0.590 (0.50)
FLLCP 0.624 0.460 0.068
¶
0.570 (0.28) 0.110
¶
0.614
¥
NDPG 0.568 0.450 0.054 0.566 0.087 0.590
FLLCP/FLMBC (B) 0.108
¶
DPG FC > 2 0.602
#
0.459
#
0.062
#
0.602
¶
0.096
¥
0.631
¶
FC < 0.5 0.575 0.449 0.068
¶
0.566 (0.27) 0.107
¶
0.616
¥
DSG FLLCP 0.631
¶
0.465
¶
0.075
¶
0.581
#
0.116
¶
0.634
¶
FLMBC 0.594 0.448 0.088
¶
0.600
¶
0.135
¶
0.652
¶
NDPG 0.559 0.448 0.051 0.559 0.083 0.580
FLHSC/LTHSC (B) -0.136
¶
DPG FC > 2 0.537
¶
0.445 (0.82) 0.055 (0.14) 0.578 (0.06) 0.084 (0.41) 0.583 (0.29)
FC < 0.5 0.587 0.445 0.075
¶
0.567 (0.14) 0.108
¶
0.603
¥
DSG FLHSC 0.606 (0.77) 0.463
¶
0.066
¶
0.579
#
0.103
¶
0.622
¶
LTHSC 0.607 0.439 0.074
¶
0.586 (0.05) 0.112
¶
0.620
¥
NDPG 0.552 0.444 0.048 0.557 0.081 0.577
LTHSC/STHSC (B) 0.086
#
DPG FC > 2 0.567 (0.24) 0.437 (0.22) 0.084
¥
0.563 (0.26) 0.128 (0.05) 0.632
¥
FC < 0.5 0.536 0.448 0.071
¶
0.614
#
0.107
#
0.634
¥
DSG LTHSC 0.590 (0.92) 0.446
#
0.063
#
0.564 (0.31) 0.106
¶
0.595 (0.16)
STHSC 0.585 0.459 0.066
¶
0.575 (0.13) 0.109
¶
0.618
¥
NDPG 0.553 0.444 0.051 0.560 0.082 0.577
STHSC/LCP (B) 0.141
¶
DPG FC > 2 0.599
¶
0.449 (0.16) 0.076
¶
0.562 (0.43) 0.123
¶
0.615 (0.05)
FC < 0.5 0.544 0.441 0.070
#
0.590 (0.06) 0.106
#
0.606 (0.14)
DSG STHSC 0.599 (0.99) 0.455 (0.44) 0.083
¶
0.610
#
0.104
#
0.605 (0.13)
LCP 0.600 0.459 0.063
¶
0.578
¥
0.103
¶
0.617
¶
NDPG 0.552 0.445 0.050 0.560 0.082 0.580
LCP/MBC (B) -0.081
#
DPG FC > 2 0.542
¶
0.443
¥
0.054
¥
0.580
¥
0.086 (0.12) 0.596 (0.16)
FC < 0.5 0.584 0.450 0.066
#
0.570 (0.19) 0.103
#
0.610
¥
DSG LCP 0.606 (0.68) 0.456 (0.64) 0.072
¶
0.589
#
0.120
¶
0.626
#
MBC 0.610 0.457 0.081
¶
0.590
#
0.124
¶
0.634
¶
NDPG 0.560 0.448 0.051 0.558 0.084 0.582
*DP, differentiation pairs.
†
Rs: Spearman correlation coefficients (Rs) between FC (the fold change of gene expression) and GC3 (
¶
P < 5 × 10
-6
,
#
P <
0.005). P values are still shown if there was no significance (P > 0.05).
‡
Wilcoxon test was used to determine whether GC3 and GCg were different
in a particular differentiation pair between developmental-pivotal genes (DPGs) enriched in earlier (FC > 2) and later (FC < 0.5) stages, as well as
between developmental-specific genes (DSGs) expressed in the earlier and later stages (for example, FNSC refers to developmental specific genes in
FNSC of differentiation pair ESC/FNSC (
¶
P < 0.001,
#
P < 0.01,
¥
P < 0.05). P values are shown if there was no significance (P > 0.05).
§
Wilcoxon test
was used to determine whether Ka, Ks, Ka/Ks and Ks_noDS of DPGs and DSGs were higher (or lower) than Ka, Ks, Ka/Ks and Ks_noDS of non-
developmental-pivotal genes (NDPGs) (
¶
P < 0.001,
#
P < 0.01,
¥
P < 0.05). P values are still shown if there was no significance (P > 0.05).
Table 3 (Continued)
Fold changes of gene expression are correlated with GC3 and GCg
R35.8 Genome Biology 2007, Volume 8, Issue 3, Article R35 Ren et al. />Genome Biology 2007, 8:R35
recombination rates only in the differentiation pairs NSC/
LVB and FLLCP/FLMBC (Rs = -0.083 and 0.062, respec-
tively, P < 0.01; Additional data file 3). Moreover, these cor-
relation coefficients were weaker than those between the fold
changes of gene expression and GC3 in these differentiation
pairs (Table 3). In other differentiation pairs, no significant
correlations between the fold changes of gene expression and
recombination rates were observed (Rs range from -0.045 to
0.034, P > 0.05; Additional data file 3). We also observed that
the recombination rates of developmental-specific genes,
with their excessive usage of GC-ending codons, were not sig-
nificantly higher than those of non-development pivotal
genes (the fold changes of gene expression are within 0.5 and
2) (data not shown). Taken together, our results suggest that
the developmental stage-related patterns of codon usage are
not byproducts of the BGC effect.
The model of mutational bias proposes that the codon bias is
simply due to unbalanced base substitutions [15,56-60].
Transcriptional processes can increase the mutation fre-
quency from cytidine (C) to thymine (T) and adenosine (A) to
guanosine (G), because the single-stranded DNA that more
frequently appears during the course of transcription is more
sensitive to deamination [34-36]. This TAMB model thus pre-
dicts a positive correlation between the levels of gene expres-
sion and the T or G content. If TAMB is the only cause of the
excessive usage of T-ending and G-ending codons in highly
expressed genes, we would expect an increase in the T3/G3
(T/G content at the third codon position) and Ti/Gi (T/G con-
tent in the untranslated region) in parallel with the levels of
gene expression. To evaluate the influence of TAMB, we
measured the slopes of Ni (the nucleotide content in the
untranslated regions) and N3 (the nucleotide content at the
third codon position) with the levels of gene expression as the
descriptive index of their increase rates. Our results show that
although there was a parallel increase in G3 and Gi in LVB,
the increase in T3 (with the slopes ranging from 5.38 to
10.60) was more rapid than the increase in Ti (with the slopes
ranging from 1.86 to 5.03) in other cell types where the levels
of gene expression were negatively correlated with GC3
(Additional data file 2). Moreover, the increase in C3 (in LVB)
relative to the levels of gene expression was not due to the
contribution of TAMB. Consequently, although these results
cannot completely rule out a potential effect of TAMB, there
is a strong suggestion that some factors other than TAMB are
the primary cause underlying our observations.
Natural selection could act on mammalian genes, for exam-
ple, highly expressed genes are reported to prefer shorter
[19,61] and less introns [62], as well as cheaper amino acids
[62] (however, see [19]). Natural selection could also influ-
ence mammalian codon usage biases [62-68], for example, at
the levels of transcription [69,70], RNA processing [71-73],
translation [19,62,74,75] and mRNA secondary structure
[76], as well as at the protein level [77,78]. If codons are
selected to improve transcriptional efficiency, there would be
more GC-ending codons in highly expressed genes, as the
conformation of DNA with a higher GC content would facili-
tate transcription [69,70]. Therefore, it is not likely that the
excessive usage of AT-ending codons in highly expressed
genes is a result of this effect. If certain codons have selective
advantages of translational efficiency over other codons,
these codons would be used more frequently in highly
expressed than in weakly expressed genes. Therefore, the cor-
relations between the levels of gene expression and codon
usage seem to be consistent with this hypothesis. Taken
together, it is more likely that the model of translational selec-
tion, rather than BGC or TAMB, would account for these find-
ings, especially for the negative correlations between the
levels of gene expression and GC3.
If the codon bias of highly expressed genes has undergone
selective pressures, it would be useful to determine whether
selective pressures were still effective after the human-mouse
divergence. Assuming mutational rates are near homogene-
ous in the mammalian genome, there would be lower synon-
ymous substitution rates (Ks) between human-mouse
orthologous genes if selective pressure was still effective.
Except for HSCs, bone marrow (BM) of model A and CD45 of
model B, our results show that highly expressed genes had
lower Ks compared with mid to lowly expressed genes in all
other cell types (P < 0.05; Table 2). Previous studies have
indicated that the substitution rates at nonsynonymous sites
may indirectly affect silent substitution rates [79]. We thus
removed the codons in which doublet substitutions occurred
to recalculate synonymous substitution rates (Ks_noDS)
[80]. The data show that, in each of the 15 cell types in the dif-
ferent developmental stages, highly expressed genes had
lower Ks_noDS compared to mid to lowly expressed genes (P
< 0.05; Table 2). Moreover, we also demonstrate that the
nonsynonymous substitution rates (Ka) and Ka/Ks of highly
expressed genes are significantly lower than those of mid to
lowly expressed genes (P < 0.01; Table 2).
We next focused on the substitution rates of developmental-
pivotal genes and developmental-specific genes. We found
that the developmental-pivotal genes in the earlier develop-
mental stages of ESC/HSC and NSC/LVB had lower Ks and
Ka/Ks than non-developmental-pivotal genes (P < 0.05;
Table 3). Moreover, developmental-pivotal genes in the ear-
lier developmental stages of ESC/HSC had lower Ks_noDS
after removal of doublet substitutions (P < 0.05; Table 3).
These results suggest the possibility that negative selection
following human and mouse divergence may still be detecta-
ble in terms of the codon usage of some groups of develop-
mental-pivotal genes. Nevertheless, we also show that many
groups of developmental-pivotal genes, as well as almost all
groups of developmental-specific genes, have higher Ks, Ka/
Ks and Ks_noDS compared with non-developmental-pivotal
genes (Table 3).
Genome Biology 2007, Volume 8, Issue 3, Article R35 Ren et al. R35.9
comment reviews reports refereed researchdeposited research interactions information
Genome Biology 2007, 8:R35
Discussion
The models of stem cell differentiation are precise
descriptions of developmental hierarchies of
mammalian ontogenesis
In this paper, to investigate developmental-stage related pat-
terns of mammalian codon usage, we used two models of
stem cell differentiation to define the developmental-stage
related patterns of gene expression. Here we suggest that the
patterns of gene expression defined in these models are faith-
ful reflections of developmental regulation. First, develop-
ment, as a process of ontogenesis, can be divided into many
stages according to the steps of cellular differentiation. In our
models, distinct cell types within the processes of differentia-
tion were isolated with high homogeneity by strategies of
selective culture and fluorescence activated cell sorting
(FACS) (Table 1). To identify the patterns of gene expression
in early developmental stages, these strategies of cell isolation
seem more precise than those used previously, which postu-
lated that complete embryos represent 'early developmental
stages' [26,81], because embryos in fact are a mixture of dif-
ferentiated mature cells with undifferentiated stem cells. Sec-
ond, in our models, the processes of stem cell differentiation
(Figure 1b) were constructed according to published experi-
mental evidence. The pluripotency of ESCs can be examined
by injecting them into blastocysts to produce normal embryos
[82-84]. ESCs are able to differentiate into multipotent stem
cells (MSCs), including the MSCs in neural [85] and hemat-
opoietic [86] tissues. Moreover, both FNSCs [87] and adult
NSCs [88] are able to generate mature neural cells in vitro
and in vivo, including neurons, astrocytes and oligodendro-
cytes. Furthermore, both fetal liver hematopoietic stem cells
(FLHSCs) [89] and bone marrow HSCs (or long-term hemat-
opoietic stem cells (LTHSCs)) [90] can functionally repopu-
late entire hematopoietic systems in recipients. In these
repopulation processes, hematopoietic stem cells give rise to
mature blood cells by generating lineage-committed progeni-
tors (LCPs). Notably, in cell lineage tracing assays, FLHSCs
have been observed to acquire the ability to directly generate
LTHSCs during ontogenesis [91].
Developmental stage-related patterns of codon usage:
methodological artifacts or byproducts of other
correlations?
In this study, we observed that developmental stage-related
patterns of gene expression (that is, the 'levels of gene expres-
sion' and the 'fold changes of gene expression') were corre-
lated with GC3. Here we suggest that neither the
methodological bias of the microarray nor the effect of the
correlations between gene length and GC3 substantially influ-
ence these observations. Methodological issues are involved
in the correlations between the levels of gene expression and
codon usage. The SAGE and microarray analysis methods
introduce a risk of overestimating the levels of gene expres-
sion with high GC content [11,92]. Therefore, our observation
of excessive usage of AT-ending codons in highly expressed
genes is not due to a methodological bias of microarray anal-
ysis. On the contrary, the actual correlation coefficients
between the levels of gene expression and AT-ending codon
usage might be even higher. Correlations between patterns of
gene expression and gene length have been reported in mam-
mals [19,62]; therefore, it is necessary for us to identify
whether the correlations between the patterns of gene expres-
sion and GC3 are byproducts of these correlations. We sug-
gest that gene lengths do not substantially influence these
observations because, in our datasets, the levels of gene
expression were negatively correlated with the lengths of both
transcripts (ranging from -0.182 to -0.084, P < 10
-6
) and cod-
ing sequences (ranging from -0.172 to -0.084, P < 10
-6
) (Addi-
tional data file 2), whereas the levels of gene expression were
negatively correlated with GC3 in most cases (Table 2). More-
over, gene lengths do not substantially affect the correlations
between the fold changes of gene expression and GC3. In each
of nine of ten differentiation pairs in which these correlations
exist with significance (positively or negatively), the correla-
tions between the fold changes of gene expression and gene
lengths were weaker than, or were opposite to, the correla-
tions between the fold changes of gene expression and GC3
(Table 3; Additional data file 3).
Analyses of codon usage within developmental
hierarchies: implications for understanding of
evolutionary issues
Developmental processes are believed to be useful guides to
the exploration of evolutionary mechanisms [93]. One
famous example is the Haeckel's hypothesis that ontogeny
may recapitulate, to some extent, phylogeny. Although it is
clear that we can not simply regard the early stages of mam-
malian development as simple organisms [94], in this paper,
using models of stem cell differentiation covering early stages
of mammalian ontogeny, certain useful clues about evolu-
tionary issues at the molecular level have been obtained.
Some of these clues, for instance, the correlations between the
levels of gene expression and codon usage, are shown to be
helpful to understanding the codon usage biases that occur in
simple organisms [2-11]. In addition, stem cells are observed
as the units of natural selection [95,96] and the origin of
many types of cancer [97,98]. These observations suggest that
stem cells might play critical roles during evolutionary proc-
esses. Here we suggest that considering patterns of gene
expression in early stages of developmental hierarchies (that
is, stem cells and progenitor cells) might lead to a better
understanding of mammalian codon usage biases.
AT-ending optimal codons in early developmental stages
In this paper, we found that optimal codons displayed varia-
tion (AT-ending or GC-ending codons) in different cell types
within the developmental hierarchy. The 'optimal codons' are
defined here as those codons that are excessively used in
highly expressed genes. It has long been assumed that, in cer-
tain vertebrates, the optimal codons, if they exist, are consist-
ent with the major codons, which are, on average, used more
frequently when taking all the known transcripts of a species
R35.10 Genome Biology 2007, Volume 8, Issue 3, Article R35 Ren et al. />Genome Biology 2007, 8:R35
into account [16,18,19,62]. Notably, our results show that, in
some special circumstances, for example, in certain mouse
stem cells and progenitor cells in early developmental stages
of mammalian ontogeny, the optimal codons were the AT-
ending ones, while the mouse major codons are the GC-end-
ing ones (average GC3 content of mouse transcripts is 0.555,
based on Ensembl build 26). The difference between our
observations and previous results may be explained by the
fact that the previous studies, suggesting that GC-ending
codons are the optimal codons, defined the levels of gene
expression as average levels of gene expression in whole tis-
sues, or whole organisms in embryonic or adult stages, which
actually contain a mixture of all cell types in different devel-
opmental stages [16,18,19,62]. These strategies thus mainly
reflect the patterns of gene expression in mature cells, and
may not allow accurate characterization of gene expression
patterns in the early developmental stages because stem cells
and progenitor cells only constitute a negligible fraction of the
tissues.
Previous reports have indicated correlations between GC-
content and the patterns of gene expression in both human
and mouse [11,16-18,25,27,99,100]. Specifically, mouse GC3
content is positively correlated with levels of gene expression
in many tissues. The R
2
(R
2
: the correlation coefficient of
determination that indicates how much of the variability in
codon usage can be "explained by" variation in the levels of
gene expression) of these correlations is as high as 2.6%
(Spleen) and 2.3% [18]. In this work, we show that the R
2
of
the negative correlations between mouse GC3 and the levels
of gene expression could reach as high as 2.8% (ESCs of
model A). This value is comparable with previous observa-
tions [18]. Notably, in the models of stem cell differentiation,
defining the 'fold change of gene expression' as a novel pat-
tern of gene expression, we observed that the R
2
of correla-
tions between GC3 and the fold changes of gene expression in
NSC/LVB (R
2
= 14.3%), ESC/HSC (R
2
= 11.4%) and ESC/
FNSC (R
2
= 5.7%) were higher than the R
2
of correlations
between GC3 and other known patterns of gene expression
tested in the other mouse microarray dataset [16,18]. In this
dataset, the levels of gene expression were defined as the
average levels in each of 45 tissues [101]. We further tested
whether taking early developmental stages into consideration
could improve the predictability of codon usage by means of
gene expression. Using MVA, we found that the levels of gene
expression explained 16.0% (in 5 cell types of model A) and
15.5% (in 10 cell types of model B) of GC3 variation. These
values are much higher than the 8.8% obtained from the aver-
age levels of gene expression in each of the 45 tissues [101].
This difference between our and previous results suggests
that the AT-ending optimal codons in the early developmen-
tal stages seem to be critical to the understanding of the reg-
ularity of codon usage.
Possible explanations for the correlations between GC3 and the levels
of gene expression
It has been suggested that the model of translational selection
cannot be used to explain mammalian codon usage [14,102].
Conversely, recent studies have presented evidence that
translational selection might influence the synonymous sites
of coding regions [19,62,74,75]. These recent findings also
agree with the observations that synonymous changes could
dramatically influence translational efficiency in mammalian
cells [103-106]. In the present study, we tested the hypotheses
of BGC, TAMB and natural selection specifically at the levels
of transcription and translation to analyze the possible mech-
anisms behind the developmental stage-related patterns of
codon usage. From our results it is suggested that natural
selection at the translational level, compared to the other
hypotheses tested in this paper, most probably accounts for
the finding that the levels of gene expression are correlated
with GC3 in many cell types.
If the usage of synonymous codons correlates with transla-
tional efficiency, there might be a selective pressure to choose
the synonymous codon that matches the most abundant
tRNA. In unicellular organisms and invertebrate metazoans,
the optimal codons are in general correspondence with the
abundant tRNAs of high copy number [11-14,80,107]. Moreo-
ver, in the case of mammals, the abundances of tRNAs are
also assumed to correlate with their copy number [19,74].
However, based on this assumption, it would be difficult to
understand why optimal codons display variation (AT-ending
or GC-ending codons) in the same species. Although the bio-
logical bases of the variations of optimal codons remain an
issue for further investigation, we hypothesize that one of the
aspects of these pressures may be related to variations in spe-
cific biochemical environments, for example, the develop-
mental stage-related modification patterns of tRNA
molecules. It has been reported that biochemical modifica-
tion at the wobble positions of tRNA molecules helps regulate
their codon recognition preference [108-111]. For example,
uridine modified by thiolation or 5-carboxymethylation
exhibits a preference for A over G at the third position of the
codon [112]. Moreover, developmental stage-related patterns
of tRNA modification have been observed [113,114]. Taken
together, we suggest that the developmental stage-related
variation of optimal codons might be correlated with develop-
mental stage-related patterns of tRNA modification.
Possible explanations for the correlations between GC3 and the fold
change of gene expression
In this paper, we defined the 'fold change of gene expression'
as the ratio of the expression levels of the same gene in two
cell types from neighboring stages in the developmental hier-
archy. It is not surprising that the correlations between the
'fold change of gene expression' and GC3, in specific differen-
tiation pairs, are related to the correlations between the 'lev-
els of gene expression' and GC3 in these two cell types.
Moreover, if the correlations between the 'levels of gene
Genome Biology 2007, Volume 8, Issue 3, Article R35 Ren et al. R35.11
comment reviews reports refereed researchdeposited research interactions information
Genome Biology 2007, 8:R35
expression' and GC3 are the consequence of natural selection,
we would regard the correlations between the 'fold change of
gene expression' and GC3 as a reflection of the difference
between selective pressures in the cell types occupying earlier
and later developmental stages. In the differentiation pairs
ESC/NSC, NSC/LVB, ESC/HSC, ESC/FNSC, FLHSC/LTHSC
and LCP/mature blood cells (MBCs), selective pressure
towards AT-ending codons is much stronger in cell types of an
earlier rather than a later developmental stage; the genes
enriched in the earlier cell types will show a greater usage of
AT-ending codons than those in later cell types. In short-term
hematopoietic stem cells (STHSCs)/LCP, similar results were
obtained. Consistent with the explanation above, in ESC/
FLHSC, the selective pressures towards AT-ending codons
are very similar between the cell types of earlier and later
developmental stages, the patterns of codon usage between
the genes enriched in the earlier and later developmental
stages are not significantly different (Table 3). However, we
observed that, in FLHSC/FLLCP, FLLCP/FLMBC, and
LTHSC/STHSC, in which selective pressures towards AT-
ending codons are very similar for the cell types of earlier and
later developmental stages, the fold changes of gene expres-
sion were significantly correlated with AT3. We suggest that
these observations may be attributed to the fact that the
codon usage of many genes enriched in certain differentiation
pairs is affected by other factors that contribute to the codon
usage bias of this differentiation pair. Taken together, our
observations are consistent with the possibility that the
greater the differences between the putative selective pres-
sures of the cell types occupying earlier and later develop-
mental stages, the greater the variation in codon usage (GC3)
between genes enriched in the earlier and latter cell types
(Table 3). In the differentiation pairs, we also show that the
GC3 of the genes that were highly expressed in both earlier
and later developmental stages were correlated with the sum
of the correlation coefficients between the levels of gene
expression and GC3 in these two stages (that is, the putative
combination of selective pressures; Rs = 0.78).
Comparative genomic analysis of developmental stage-related genes
We also provide evidence of the presence of negative selection
at synonymous sites following the human-mouse divergence.
The observation that, in all mouse cell types, highly expressed
genes have a lower Ks_noDS (Ks after removing doublet sub-
stitution) is consistent with previous results showing that
synonymous substitution rates are lower in highly expressed
genes compared with other genes in bacteria and Drosophila
[9,115-117]. Considering the occurrence of negative selection
at synonymous sites, it is suggested that Ka/Ks, which have
long been used to evaluate protein evolutionary rates, carry a
risk of overestimation [64]. Therefore, early studies in which
exonic synonymous sites have been assumed neutral may
require reevaluation (also see [19,64,65]). Notably, even with
lower Ks, highly expressed genes and developmental-pivotal
genes in ESCs of the ESC/HSC differentiation pair still
showed lower evolutionary rates (Ka/Ks; Tables 2 and 3).
These findings are consistent with previous results that pro-
tein evolutionary rates are negatively correlated with levels of
gene expression from unicellular organisms to vertebrates
[118-120].
In many groups of developmental-pivotal and developmen-
tal-specific genes, we also show that both Ks and Ka/Ks are
higher than in non-developmental-pivotal genes. These
results suggest that the codon usage of most developmental-
pivotal and developmental-specific genes has been under less
selective constraints. Furthermore, the higher Ka/Ks of these
genes may imply that these genes have been subject to differ-
ent functional constraints after the divergence of human and
mouse. This explanation is consistent with the observation
that orthologous genes can play different roles in human and
mouse stem cells [121]. However, it should be noted that cur-
rent knowledge of the mechanisms of stem cell differentiation
is very limited. Therefore, further study of the function of
orthologous developmental-pivotal and developmental-spe-
cific genes will deepen our understanding of the higher Ks
and Ka/Ks in these genes.
Comparisons between developmental-pivotal genes and
developmental-specific genes
The expression of developmental-pivotal genes (regulated up
and down) and developmental-specific genes (regulated on
and off) is regulated by different strategies. After the combi-
nation of these two groups of genes, both GC3 and GCg still
differed significantly between the genes selectively expressed
at the earlier and later developmental stages of many differ-
entiation pairs (Additional data file 4). However, our data
show that these two groups of genes are different in their
molecular characteristics, genomic composition and the
related evolution rates. Therefore, in this paper, developmen-
tal-pivotal genes and developmental-specific genes are dis-
cussed separately.
First, compared with developmental-pivotal genes, develop-
mental-specific genes used more GC-ending codons and were
located in genomic regions with higher GC content in most
cases (Table 3; Additional data file 1). Second, the Ka, Ks,
Ks_noDS, and Ka/Ks for many groups of developmental-spe-
cific genes were significantly higher than those of the develop-
mental-pivotal genes (Table 3; Additional data file 5).
According to these observations, we suggest these two groups
of genes are different. Although more evidence is clearly still
necessary, the results suggest the possibility that the regula-
tion patterns of genes might be correlated with their codon
usage, genomic GC content and evolutionary rates.
Analyses of codon usage within developmental models:
implications for understanding differentiation
processes
The current study has applied analyses of codon usage to
processes of stem cell differentiation to gain a better under-
standing of developmental processes (that is, the processes of
R35.12 Genome Biology 2007, Volume 8, Issue 3, Article R35 Ren et al. />Genome Biology 2007, 8:R35
stem cell differentiation) at the genomic level [122]. First,
both developmental-pivotal genes and developmental-spe-
cific genes have been proposed, and many of them are exper-
imentally demonstrated, to be responsible for maintaining
cells at each developmental stage as well as regulating cell dif-
ferentiation processes [54,55]. We have shown that codon
usage, a 'silent' property of both developmental-pivotal genes
and developmental-specific genes, are different between the
earlier and later developmental stages in differentiation
pairs. These findings suggest that the genes responsible for
different developmental stages have different derivations and
regulation patterns. Moreover, developmental-pivotal genes
and developmental-specific genes exhibit different regulation
patterns. During differentiation, the transcriptional
intensities of developmental-pivotal genes need to be appro-
priately regulated up or down, whereas the transcription of
developmental-specific genes should be silenced in one stage
and activated in another. It has been suggested that chroma-
tin structures and the genome location of developmental-piv-
otal and developmental-specific genes are quite different:
developmental-pivotal genes might be located in euchroma-
tin, whereas most developmental-specific genes might be
located in facultative heterochromatin [123]. In this paper, we
demonstrate that developmental-specific genes generally use
more GC-ending codons than developmental-pivotal genes.
We suggest that this different molecular property may corre-
late with different regulation patterns and chromatin struc-
ture, but the precise mechanisms at the moment remain
unclear.
Second, it has been shown that the processes of stem cell dif-
ferentiation are accompanied by remodeling of the entire
chromatin structure [123-128]. However, little is known
about the characteristics of chromatin segments involved in
these remodeling processes. Previous studies have shown
that the chromatin segments in which developmental stage-
specific genes are located have been remodeled during differ-
entiation [129-132]. Moreover, it has been reported that
nucleosome formation potential is correlated with the GC
content of DNA [69]. Our results suggest that the GC content
of genomic regions where developmental-pivotal genes and
developmental-specific genes are located is different between
the earlier and later developmental stages in differentiation
pairs. Altogether, our results suggest that, during differentia-
tion, the genome segments that are involved in chromatin
remodeling are correlated with their GC content. It has been
suggested that mammalian genomes are made up of mosaic
'isochore' structures, which might relate to the variation in
GC content on the scale of hundreds of kilobases to mega-
bases [22,23,40,133,134]. Furthermore, the isochores are
proposed to correlate with tissue specificity [18]. Previous
work also shows that, during ESC differentiation, many dif-
ferentiation-induced replication-timing and expression
changes are restricted to AT-rich isochores [135]. Our find-
ings of developmental stage-correlated codon usage and GCg
content indicate that the isochores are related to different
developmental stages during mammalian ontogenesis.
Conclusion
In this investigation, using models of stem cell differentia-
tion, developmental stage-related patterns of mouse codon
usage have been observed. Notably, in early stages of mouse
ontogeny, we found a bias for AT-ending optimal codons.
Moreover, during mammalian ontogenesis, we also found
that genes selectively expressed during different developmen-
tal stages have different codon usage (GC3) and local GCg
content. We hypothesize that translational selection, com-
pared to other hypotheses such as BGC and TAMB, most
probably accounts for these codon usage biases, especially for
the AT-ending optimal codons. The selective constraints were
still detectable at synonymous sites of many groups of devel-
opmental stage-related genes. Moreover, at the same devel-
opmental stage, we also found that developmental-specific
genes usually used more GC-ending codons, had higher GCg
content and higher substitution rates compared with devel-
opmental-pivotal genes. Applying codon usage analysis in
developmental hierarchies, this paper provides new clues for
understanding differentiation processes. For example, the
genome segments that are involved in chromatin remodeling
may correlate with GC content. Further investigation will be
needed to better understand the significance and implica-
tions of the findings presented here.
Materials and methods
Genomic data
Removing 2,672 pseudo genes according to their annotations,
we extracted information on 31,022 transcripts from the
Mouse division (build 26) of the Ensembl genome database
for further analysis. To investigate the evolutionary conserva-
tion of mouse genes, we also extracted information from the
Human division (build 26) of the Ensembl database.
Microarray data
We used two independent oligonucleotide microarray data-
sets (Affymetrix MG-U74Av2) for the models of mouse stem
cell differentiation [54,55]. For dataset A, the raw data are
available from the website of Melton's lab [136]. We proc-
essed these raw data by Affymetrix MAS 5.0. For dataset B,
the raw data were processed by Affymetrix MAS 4.0 [55]. We
accessed these data from Science website [137]. For both
datasets, we used the 'Detection Call' provided by the Affyme-
trix MAS system to identify whether a transcript is present (P)
or absent (A); the marginal situation is marked as M.
The mapping relationships between Affymetrix probe-sets
and their corresponding transcripts were extracted from the
Ensembl database. The detailed mapping algorithms were
implemented by the Ensembl team [138].
Genome Biology 2007, Volume 8, Issue 3, Article R35 Ren et al. R35.13
comment reviews reports refereed researchdeposited research interactions information
Genome Biology 2007, 8:R35
For dataset A, we used the average levels of two replicates as
the levels of gene expression, if the probe-sets fulfilled the fol-
lowing criteria. First, in both replicates, the gene was
expressed stably such that the standard error (SE) was less
than a quarter of the measured expression value:
Second, the gene expression levels were stable between two
replicates such that the absolute value of difference between
the two replicates' expression values is smaller than half of
their mean value
According to the data provided, in dataset B, the average lev-
els of two to four replicates were used as the levels of gene
expression. Moreover, genes with expression levels below
200 were removed to confirm gene expression as suggested
by Su et al. [101].
To calculate the codon usage, only probe-sets corresponding
to unique transcripts on U74Av2 were considered.
Nucleotide composition analysis
The untranslated regions (UTRs) and coding sequences
(CDSs) of a given transcript were extracted from the Ensembl
database according to the entry's annotation and validated by
chromosome mapping. Sequences with ambiguous annota-
tions were checked manually. To evaluate the influence of
TAMB on gene composition, we calculated the nucleotide
content in UTRs and the third position of synonymous
codons in CDS for A, C, G and T [19,36]. We also calculated
nucleotide composition (GC fraction) in contiguous 20 kb
windows, as suggested by Lercher et al. [100], as genomic
background of a given gene (Tables 2 and 3)
Recombination rate estimates
Recombination rates across the mouse genome were esti-
mated by dividing the genetic length (cM) by the sequence
length (Mb) between genetic markers [49,139]. These data
were derived from The Whitehead Mouse Genetic Map web-
site [140].
Codon usage analyses
CodonW software was used to calculate the GC content at the
third codon positions (GC3) and the RSCU value of each syn-
onymous codon according to Sharp et al. [4]. Only genes with
CDS > 200 were considered.
Comparative genomics
We detected an orthologous relationship based on the
Ensembl build 26 EnsMart Database's annotation. The Ka, Ks
and Ka/Ks were calculated using Nei and Gojobori methods
[141] using PAML (yn00) [142,143] for each ortholog pair.
According to the PAML manual [144], we excluded genes with
Ks > 1 for further analyses. Synonymous substitution rates
after removing doublet substitutions (Ks_noDS) were calcu-
lated as previous described [80] (Tables 2 and 3).
Statistical analysis
Spearman's correlation test was used for analysis of paired
samples and linear regression analysis was performed by
standard routines using the statistical package R [145]. All
necessary scripts and/or programs are available.
Additional data files
The following additional data are available with the online
version of this paper. Additional data file 1 provides compar-
isons of GC3 and GCg between developmental-pivotal genes
and developmental-specific genes. Additional data file 2
includes supplementary information about the mechanisms
of our observations showing that levels of gene expression are
correlated with codon usage, recombination rate, gene length
and nucleotide composition. Additional data file 3 includes
supplementary information about the mechanisms of our
observations showing that the fold changes of gene expres-
sion are correlated with codon usage, recombination rate and
gene length. Additional data file 4 provides results on the GC3
and GCg of developmental-pivotal genes, developmental-spe-
cific genes and both together in each differentiation pair.
Additional data file 5 provides comparisons of substitution
rates between developmental-pivotal genes and developmen-
tal-specific genes.
Additional data file 1Comparisons of GC3 and GCg between developmental-pivotal genes and developmental-specific genesComparisons of GC3 and GCg between developmental-pivotal genes and developmental-specific genesClick here for fileAdditional data file 2Levels of gene expression are correlated with codon usage, recom-bination rate, gene length and nucleotide compositionLevels of gene expression are correlated with codon usage, recom-bination rate, gene length and nucleotide compositionClick here for fileAdditional data file 3Fold changes of gene expression are correlated with codon usage, recombination rate and gene lengthFold changes of gene expression are correlated with codon usage, recombination rate and gene lengthClick here for fileAdditional data file 4GC3 and GCg of developmental-pivotal genes, developmental-spe-cific genes and both together in each differentiation pairGC3 and GCg of developmental-pivotal genes, developmental-spe-cific genes and both together in each differentiation pairClick here for fileAdditional data file 5Comparisons of substitution rates between developmental-pivotal genes and developmental-specific genesComparisons of substitution rates between developmental-pivotal genes and developmental-specific genesClick here for file
Acknowledgements
We thank anonymous reviewers for valuable suggestions. This work is sup-
ported by the Ministry of Science and Technology Grant (2001CB510106),
National Nature Science Foundation of China for Outstanding Young Sci-
entist Award (30125022) and for Creative Research Groups (30421004) to
HD. We thank Dr Chung-I Wu, Dr Liping Wei, and Dr Johnny He for help-
ful discussions and Xiaojun Wang, Meiling Zhang, Wenzhe Lu, Dongbiao
Shen and Lingyun Xie for data collection. We are grateful to Bruce Michael
and Jiayuan Quan for assistance in manuscript editing.
References
1. Bulmer M: The selection-mutation-drift theory of synony-
mous codon usage. Genetics 1991, 129:897-907.
2. Gouy M, Gautier C: Codon usage in bacteria: correlation with
gene expressivity. Nucleic Acids Res 1982, 10:7055-7074.
3. Sharp PM, Li WH: An evolutionary perspective on synonymous
codon usage in unicellular organisms. J Mol Evol 1986, 24:28-38.
4. Sharp PM, Tuohy TM, Mosurski KR: Codon usage in yeast: cluster
analysis clearly differentiates highly and lowly expressed
genes. Nucleic Acids Res 1986, 14:5125-5143.
5. Coghlan A, Wolfe KH: Relationship of codon bias to mRNA
concentration and protein length in Saccharomyces
cerevisiae. Yeast 2000, 16:1131-1145.
6. Akashi H: Gene expression and molecular evolution. Curr Opin
Genet Dev 2001, 11:660-666.
7. Stenico M, Lloyd AT, Sharp PM: Codon usage in Caenorhabditis
elegans: delineation of translational selection and mutational
biases. Nucleic Acids Res 1994, 22:2437-2446.
8. Moriyama EN, Powell JR: Codon usage bias and tRNA abun-
SE
Exp
≤ 14/
exp exp
(exp ,exp )
.
12
12
05
−
≤
mean
R35.14 Genome Biology 2007, Volume 8, Issue 3, Article R35 Ren et al. />Genome Biology 2007, 8:R35
dance in Drosophila. J Mol Evol 1997, 45:514-523.
9. Powell JR, Moriyama EN: Evolution of codon usage bias in Dro-
sophila. Proc Natl Acad Sci USA 1997, 94:7784-7790.
10. Duret L, Mouchiroud D: Expression pattern and, surprisingly,
gene length shape codon usage in Caenorhabditis, Drosophila,
and Arabidopsis. Proc Natl Acad Sci USA 1999, 96:4482-4487.
11. Duret L: Evolution of synonymous codon usage in metazoans.
Curr Opin Genet Dev 2002, 12:640-649.
12. Dong H, Nilsson L, Kurland CG: Co-variation of tRNA abun-
dance and codon usage in Escherichia coli at different growth
rates. J Mol Biol 1996, 260:649-663.
13. Akashi H, Eyre-Walker A: Translational selection and molecular
evolution. Curr Opin Genet Dev 1998, 8:688-693.
14. Kanaya S, Yamada Y, Kinouchi M, Kudo Y, Ikemura T: Codon usage
and tRNA genes in eukaryotes: correlation of codon usage
diversity with translation efficiency and with CG-dinucle-
otide usage as assessed by multivariate analysis. J Mol Evol
2001, 53:290-298.
15. Duret L: tRNA gene number and codon usage in the C. elegans
genome are co-adapted for optimal translation of highly
expressed genes. Trends Genet 2000, 16:287-289.
16. Semon M, Mouchiroud D, Duret L: Relationship between gene
expression and GC-content in mammals: statistical signifi-
cance and biological relevance. Hum Mol Genet 2005,
14:421-427.
17. Konu O, Li MD: Correlations between mRNA expression lev-
els and GC contents of coding and untranslated regions of
genes in rodents. J Mol Evol 2002, 54:35-41.
18. Vinogradov AE: Isochores and tissue-specificity. Nucleic Acids Res
2003, 31:5212-5220.
19. Comeron JM: Selective and mutational patterns associated
with gene expression in humans: influences on synonymous
composition and intron presence. Genetics 2004,
167:1293-1304.
20. DeBry RW, Marzluff WF: Selection on silent sites in the rodent
H3 histone gene family. Genetics 1994, 138:191-202.
21. Mouchiroud D, Fichant G, Bernardi G: Compositional compart-
mentalization and gene composition in the genome of
vertebrates. J Mol Evol 1987, 26:198-204.
22. Bernardi G: The isochore organization of the human genome
and its evolutionary history - a review. Gene 1993, 135:57-66.
23. Bernardi G: The human genome: organization and evolution-
ary history. Annu Rev Genet 1995, 29:445-476.
24. Pesole G, Bernardi G, Saccone C: Isochore specificity of AUG ini-
tiator context of human genes. FEBS Lett 1999, 464:60-62.
25. Lercher MJ, Urrutia AO, Pavlicek A, Hurst LD: A unification of
mosaic structures in the human genome. Hum Mol Genet 2003,
12:2411-2415.
26. Ponger L, Duret L, Mouchiroud D: Determinants of CpG islands:
expression in early embryo and isochore structure. Genome
Res 2001, 11:1854-1860.
27. Goncalves I, Duret L, Mouchiroud D: Nature and structure of
human genes that generate retropseudogenes. Genome Res
2000, 10:672-678.
28. D'Onofrio G: Expression patterns and gene distribution in the
human genome.
Gene 2002, 300:155-160.
29. Zhang L, Li WH: Mammalian housekeeping genes evolve more
slowly than tissue-specific genes. Mol Biol Evol 2004, 21:236-239.
30. Plotkin JB, Robins H, Levine AJ: Tissue-specific codon usage and
the expression of human genes. Proc Natl Acad Sci USA 2004,
101:12588-12591.
31. Semon M, Lobry JR, Duret L: No evidence for tissue-specific
adaptation of synonymous codon usage in humans. Mol Biol
Evol 2006, 23:523-529.
32. Musto H, Cruveiller S, D'Onofrio G, Romero H, Bernardi G: Trans-
lational selection on codon usage in Xenopus laevis. Mol Biol
Evol 2001, 18:1703-1707.
33. Romero H, Zavala A, Musto H, Bernardi G: The influence of trans-
lational selection on codon usage in fishes from the family
Cyprinidae. Gene 2003, 317:141-147.
34. Fryxell KJ, Zuckerkandl E: Cytosine deamination plays a pri-
mary role in the evolution of mammalian isochores. Mol Biol
Evol 2000, 17:1371-1383.
35. Francino MP, Ochman H: Deamination as the basis of strand-
asymmetric evolution in transcribed Escherichia coli
sequences. Mol Biol Evol 2001, 18:1147-1150.
36. Green P, Ewing B, Miller W, Thomas PJ, Green ED: Transcription-
associated mutational asymmetry in mammalian evolution.
Nat Genet 2003, 33:514-517.
37. Iida K, Akashi H: A test of translational selection at 'silent' sites
in the human genome: base composition comparisons in
alternatively spliced genes. Gene 2000, 261:93-105.
38. Smith NG, Hurst LD: The effect of tandem substitutions on the
correlation between synonymous and nonsynonymous rates
in rodents. Genetics 1999, 153:1395-1402.
39. Bielawski JP, Dunn KA, Yang Z: Rates of nucleotide substitution
and mammalian nuclear gene evolution. Approximate and
maximum-likelihood methods lead to different conclusions.
Genetics 2000, 156:1299-1308.
40. Eyre-Walker A, Hurst LD: The evolution of isochores. Nat Rev
Genet 2001, 2:549-555.
41. Hurst LD, Williams EJ: Covariation of GC content and the silent
site substitution rate in rodents: implications for methodol-
ogy and for the evolution of isochores. Gene 2000, 261:107-114.
42. Chen FC, Wang SS, Chen CJ, Li WH, Chuang TJ: Alternatively and
constitutively spliced exons are subject to different evolu-
tionary forces. Mol Biol Evol 2006, 23:675-682.
43. Nickoloff JA: Transcription enhances intrachromosomal
homologous recombination in mammalian cells. Mol Cell Biol
1992, 12:5311-5318.
44. Droge P: Transcription-driven site-specific DNA recombina-
tion in vitro. Proc Natl Acad Sci USA 1993, 90:2759-2763.
45. Nicolas A: Relationship between transcription and initiation
of meiotic recombination: toward chromatin accessibility.
Proc Natl Acad Sci USA 1998, 95:87-89.
46. Fullerton SM, Bernardo Carvalho A, Clark AG: Local rates of
recombination are positively correlated with GC content in
the human genome. Mol Biol Evol 2001, 18:1139-1142.
47. Galtier N, Piganeau G, Mouchiroud D, Duret L: GC-content evolu-
tion in mammalian genomes: the biased gene conversion
hypothesis. Genetics 2001, 159:907-911.
48. Galtier N: Gene conversion drives GC content evolution in
mammalian histones. Trends Genet 2003, 19:65-68.
49. Meunier J, Duret L: Recombination drives the evolution of GC-
content in the human genome. Mol Biol Evol 2004, 21:984-990.
50. Montoya-Burgos JI, Boursot P, Galtier N: Recombination explains
isochores in mammalian genomes. Trends Genet 2003,
19:
128-130.
51. Khelifi A, Meunier J, Duret L, Mouchiroud D: GC content evolu-
tion of the human and mouse genomes: insights from the
study of processed pseudogenes in regions of different
recombination rates. J Mol Evol 2006, 62:745-752.
52. Arthur W: The emerging conceptual framework of evolution-
ary developmental biology. Nature 2002, 415:757-764.
53. Chang CC, Cook CE: Trends in genomic 'evo-devo'. Genome Biol
2002, 3:REPORTS4019.
54. Ramalho-Santos M, Yoon S, Matsuzaki Y, Mulligan RC, Melton DA:
"Stemness": transcriptional profiling of embryonic and adult
stem cells. Science 2002, 298:597-600.
55. Ivanova NB, Dimos JT, Schaniel C, Hackney JA, Moore KA, Lemischka
IR: A stem cell molecular signature. Science 2002, 298:601-604.
56. Wolfe KH, Sharp PM, Li WH: Mutation rates differ among
regions of the mammalian genome. Nature 1989, 337:283-285.
57. Eyre-Walker AC: An analysis of codon usage in mammals:
selection or mutation bias? J Mol Evol 1991, 33:442-449.
58. Sharp PM, Averof M, Lloyd AT, Matassi G, Peden JF: DNA sequence
evolution: the sounds of silence. Philos Trans R Soc Lond B Biol Sci
1995, 349:241-247.
59. Hughes AL, Yeager M: Comparative evolutionary rates of
introns and exons in murine rodents. J Mol Evol 1997,
45:125-130.
60. Francino MP, Ochman H: Isochores result from mutation not
selection. Nature 1999, 400:30-31.
61. Castillo-Davis CI, Mekhedov SL, Hartl DL, Koonin EV, Kondrashov
FA: Selection for short introns in highly expressed genes. Nat
Genet 2002, 31:415-418.
62. Urrutia AO, Hurst LD: The signature of selection mediated by
expression on human genes. Genome Res 2003, 13:2260-2264.
63. Eyre-Walker A: Evidence of selection on silent site base com-
position in mammals: potential implications for the evolu-
tion of isochores and junk DNA. Genetics 1999, 152:675-683.
64. Hurst LD, Pal C: Evidence for purifying selection acting on
silent sites in BRCA1. Trends Genet 2001, 17:62-65.
65. Chamary JV, Hurst LD: Similar rates but different modes of
sequence evolution in introns and at exonic silent sites in
rodents: evidence for selectively driven codon usage. Mol Biol
Genome Biology 2007, Volume 8, Issue 3, Article R35 Ren et al. R35.15
comment reviews reports refereed researchdeposited research interactions information
Genome Biology 2007, 8:R35
Evol 2004, 21:1014-1023.
66. Hellmann I, Zollner S, Enard W, Ebersberger I, Nickel B, Paabo S:
Selection on human genes as revealed by comparisons to
chimpanzee cDNA. Genome Res 2003, 13:831-837.
67. Chamary JV, Parmley JL, Hurst LD: Hearing silence: non-neutral
evolution at synonymous sites in mammals. Nat Rev Genet
2006, 7:98-108.
68. Schattner P, Diekhans M: Regions of extreme synonymous
codon selection in mammalian genes. Nucleic Acids Res 2006,
34:1700-1710.
69. Vinogradov AE: Noncoding DNA, isochores and gene expres-
sion: nucleosome formation potential. Nucleic Acids Res 2005,
33:559-563.
70. Vinogradov AE: DNA helix: the importance of being GC-rich.
Nucleic Acids Res 2003, 31:1838-1844.
71. Parmley JL, Chamary JV, Hurst LD: Evidence for purifying selec-
tion against synonymous mutations in mammalian exonic
splicing enhancers. Mol Biol Evol 2006, 23:301-309.
72. Willie E, Majewski J: Evidence for codon bias selection at the
pre-mRNA level in eukaryotes. Trends Genet 2004, 20:534-538.
73. Chamary JV, Hurst LD: Biased codon usage near intron-exon
junctions: selection on splicing enhancers, splice-site recog-
nition or something else? Trends Genet 2005, 21:256-259.
74. Lavner Y, Kotlar D: Codon bias as a factor in regulating expres-
sion via translation rate in the human genome. Gene 2005,
345:127-138.
75. Comeron JM: Weak selection and recent mutational changes
influence polymorphic synonymous mutations in humans.
Proc Natl Acad Sci USA 2006, 103:6940-6945.
76. Chamary JV, Hurst LD: Evidence for selection on synonymous
mutations affecting stability of mRNA secondary structure
in mammals. Genome Biol
2005, 6:R75.
77. Oresic M, Dehn M, Korenblum D, Shalloway D: Tracing specific
synonymous codon-secondary structure correlations
through evolution. J Mol Evol 2003, 56:473-484.
78. Archetti M: Selection on codon usage for error minimization
at the protein level. J Mol Evol 2004, 59:400-415.
79. Wolfe KH, Sharp PM: Mammalian gene evolution: nucleotide
sequence divergence between mouse and rat. J Mol Evol 1993,
37:441-456.
80. Duret L, Mouchiroud D: Determinants of substitution rates in
mammalian genes: expression pattern affects selection
intensity but not mutation rate. Mol Biol Evol 2000, 17:68-74.
81. Castillo-Davis CI, Hartl DL: Genome evolution and develop-
mental constraint in Caenorhabditis elegans. Mol Biol Evol 2002,
19:728-735.
82. Martin GR: Isolation of a pluripotent cell line from early
mouse embryos cultured in medium conditioned by terato-
carcinoma stem cells. Proc Natl Acad Sci USA 1981, 78:7634-7638.
83. Nagy A, Gocza E, Diaz EM, Prideaux VR, Ivanyi E, Markkula M, Ros-
sant J: Embryonic stem cells alone are able to support fetal
development in the mouse. Development 1990, 110:815-821.
84. Ying QL, Nichols J, Chambers I, Smith A: BMP induction of Id
proteins suppresses differentiation and sustains embryonic
stem cell self-renewal in collaboration with STAT3. Cell 2003,
115:281-292.
85. Ying QL, Stavridis M, Griffiths D, Li M, Smith A: Conversion of
embryonic stem cells into neuroectodermal precursors in
adherent monoculture. Nat Biotechnol 2003, 21:183-186.
86. Burt RK, Verda L, Kim DA, Oyama Y, Luo K, Link C: Embryonic
stem cells as an alternate marrow donor source: engraft-
ment without graft-versus-host disease. J Exp Med 2004,
199:895-904.
87. Qian X, Shen Q, Goderie SK, He W, Capela A, Davis AA, Temple S:
Timing of CNS cell generation: a programmed sequence of
neuron and glial cell production from isolated murine corti-
cal stem cells. Neuron 2000, 28:69-80.
88. Doetsch F, Caille I, Lim DA, Garcia-Verdugo JM, Alvarez-Buylla A:
Subventricular zone astrocytes are neural stem cells in the
adult mammalian brain. Cell 1999, 97:703-716.
89. Jordan CT, McKearn JP, Lemischka IR: Cellular and developmen-
tal properties of fetal hematopoietic stem cells. Cell 1990,
61:953-963.
90. Krause DS, Theise ND, Collector MI, Henegariu O, Hwang S, Gard-
ner R, Neutzel S, Sharkis SJ: Multi-organ, multi-lineage engraft-
ment by a single bone marrow-derived stem cell. Cell 2001,
105:369-377.
91. Gothert JR, Gustin SE, Hall MA, Green AR, Gottgens B, Izon DJ, Beg-
ley CG: In vivo fate-tracing studies using the Scl stem cell
enhancer: embryonic hematopoietic stem cells significantly
contribute to adult hematopoiesis. Blood 2005, 105:2724-2732.
92. Margulies EH, Kardia SL, Innis JW: Identification and prevention
of a GC content bias in SAGE libraries. Nucleic Acids Res 2001,
29:E60.
93. Gilbert SF: The morphogenesis of evolutionary developmen-
tal biology. Int J Dev Biol 2003, 47:467-477.
94. Gould SJ: Ontogeny and Phylogeny Cambridge: Harvard University
Press; 1977.
95. Laird DJ, De Tomaso AW, Weissman IL: Stem cells are units of
natural selection in a colonial ascidian. Cell 2005,
123:1351-1360.
96. Weissman IL: Stem cells: units of development, units of regen-
eration, and units in evolution. Cell 2000, 100:157-168.
97. Clarke MF, Fuller M: Stem cells and cancer: two faces of eve.
Cell 2006, 124:1111-1115.
98. Huntly BJ, Gilliland DG: Leukaemia stem cells and the evolution
of cancer-stem-cell research. Nat Rev Cancer
2005, 5:311-321.
99. Versteeg R, van Schaik BD, van Batenburg MF, Roos M, Monajemi R,
Caron H, Bussemaker HJ, van Kampen AH: The human transcrip-
tome map reveals extremes in gene density, intron length,
GC content, and repeat pattern for domains of highly and
weakly expressed genes. Genome Res 2003, 13:1998-2004.
100. Lercher MJ, Urrutia AO, Hurst LD: Clustering of housekeeping
genes provides a unified model of gene order in the human
genome. Nat Genet 2002, 31:180-183.
101. Su AI, Cooke MP, Ching KA, Hakak Y, Walker JR, Wiltshire T, Orth
AP, Vega RG, Sapinoso LM, Moqrich A, et al.: Large-scale analysis
of the human and mouse transcriptomes. Proc Natl Acad Sci
USA 2002, 99:4465-4470.
102. dos Reis M, Savva R, Wernisch L: Solving the riddle of codon
usage preferences: a test for translational selection. Nucleic
Acids Res 2004, 32:5036-5044.
103. Levy JP, Muldoon RR, Zolotukhin S, Link CJ Jr: Retroviral transfer
and expression of a humanized, red-shifted green fluores-
cent protein gene into human tumor cells. Nat Biotechnol 1996,
14:610-614.
104. Wells KD, Foster JA, Moore K, Pursel VG, Wall RJ: Codon optimi-
zation, genetic insulation, and an rtTA reporter improve
performance of the tetracycline switch. Transgenic Res 1999,
8:371-381.
105. Zhou J, Liu WJ, Peng SW, Sun XY, Frazer I: Papillomavirus capsid
protein expression level depends on the match between
codon usage and tRNA availability. J Virol 1999, 73:4972-4982.
106. Kudla G, Lipinski L, Caffin F, Helwak A, Zylicz M: High guanine and
cytosine content increases mRNA levels in mammalian cells.
PLoS Biol 2006, 4:e180.
107. Kanaya S, Yamada Y, Kudo Y, Ikemura T: Studies of codon usage
and tRNA genes of 18 unicellular organisms and quantifica-
tion of Bacillus subtilis tRNAs: gene expression level and spe-
cies-specific diversity of codon usage based on multivariate
analysis. Gene 1999, 238:143-155.
108. Agris PF:
Decoding the genome: a modified view. Nucleic Acids
Res 2004, 32:223-238.
109. Murphy FVt, Ramakrishnan V, Malkiewicz A, Agris PF: The role of
modifications in codon discrimination by tRNA(Lys)UUU.
Nat Struct Mol Biol 2004, 11:1186-1191.
110. Tong KL, Wong JT: Anticodon and wobble evolution. Gene
2004, 333:169-177.
111. Umeda N, Suzuki T, Yukawa M, Ohya Y, Shindo H, Watanabe K:
Mitochondria-specific RNA-modifying enzymes responsible
for the biosynthesis of the wobble base in mitochondrial
tRNAs. Implications for the molecular pathogenesis of
human mitochondrial diseases. J Biol Chem 2005,
280:1613-1624.
112. Ikemura T: Codon usage and tRNA content in unicellular and
multicellular organisms. Mol Biol Evol 1985, 2:13-34.
113. White BN, Tener GM, Holden J, Suzuki DT: Analysis of tRNAs
during the development of Drosophila. Dev Biol 1973,
33:185-195.
114. Hosbach HA, Kubli E: Transfer RNA in aging Drosophila: II. Iso-
acceptor patterns. Mech Ageing Dev 1979, 10:141-149.
115. Sharp PM, Li WH: The rate of synonymous substitution in
enterobacterial genes is inversely related to codon usage
bias. Mol Biol Evol 1987, 4:222-230.
116. Sharp PM, Li WH: On the rate of DNA sequence evolution in
Drosophila. J Mol Evol 1989, 28:398-402.
R35.16 Genome Biology 2007, Volume 8, Issue 3, Article R35 Ren et al. />Genome Biology 2007, 8:R35
117. Shields DC, Sharp PM, Higgins DG, Wright F: "Silent" sites in Dro-
sophila genes are not neutral: evidence of selection among
synonymous codons. Mol Biol Evol 1988, 5:704-716.
118. Pal C, Papp B, Hurst LD: Highly expressed genes in yeast evolve
slowly. Genetics 2001, 158:927-931.
119. Krylov DM, Wolf YI, Rogozin IB, Koonin EV: Gene loss, protein
sequence divergence, gene dispensability, expression level,
and interactivity are correlated in eukaryotic evolution.
Genome Res 2003, 13:2229-2235.
120. Subramanian S, Kumar S: Gene expression intensity shapes evo-
lutionary rates of the proteins encoded by the vertebrate
genome. Genetics 2004, 168:373-381.
121. Rao M: Conserved and divergent paths that regulate self-
renewal in mouse and human embryonic stem cells. Dev Biol
2004, 275:269-286.
122. Lowell S: Stem cells in the genomic age. Genome Biol 2006,
7:315.
123. Kosak ST, Groudine M: Form follows function: The genomic
organization of cellular differentiation. Genes Dev 2004,
18:1371-1384.
124. Akashi K, He X, Chen J, Iwasaki H, Niu C, Steenhard B, Zhang J, Haug
J, Li L: Transcriptional accessibility for genes of multiple tis-
sues and hematopoietic lineages is hierarchically controlled
during early hematopoiesis. Blood 2003, 101:383-389.
125. Ajamian F, Suuronen T, Salminen A, Reeben M: Upregulation of
class II histone deacetylases mRNA during neural differenti-
ation of cultured rat hippocampal progenitor cells. Neurosci
Lett 2003, 346:
57-60.
126. Lee JH, Hart SR, Skalnik DG: Histone deacetylase activity is
required for embryonic stem cell differentiation. Genesis
2004, 38:32-38.
127. Rasmussen TP: Embryonic stem cell differentiation: a
chromatin perspective. Reprod Biol Endocrinol 2003, 1:100.
128. Lee TI, Jenner RG, Boyer LA, Guenther MG, Levine SS, Kumar RM,
Chevalier B, Johnstone SE, Cole MF, Isono K, et al.: Control of
developmental regulators by Polycomb in human embryonic
stem cells. Cell 2006, 125:301-313.
129. Ballas N, Battaglioli E, Atouf F, Andres ME, Chenoweth J, Anderson
ME, Burger C, Moniwa M, Davie JR, Bowers WJ, et al.: Regulation of
neuronal traits by a novel transcriptional complex. Neuron
2001, 31:353-365.
130. Takizawa T, Nakashima K, Namihira M, Ochiai W, Uemura A, Yana-
gisawa M, Fujita N, Nakao M, Taga T: DNA methylation is a crit-
ical cell-intrinsic determinant of astrocyte differentiation in
the fetal brain. Dev Cell 2001, 1:749-758.
131. Song MR, Ghosh A: FGF2-induced chromatin remodeling reg-
ulates CNTF-mediated gene expression and astrocyte
differentiation. Nat Neurosci 2004, 7:229-235.
132. Kuwabara T, Hsieh J, Nakashima K, Taira K, Gage FH: A small mod-
ulatory dsRNA specifies the fate of adult neural stem cells.
Cell 2004, 116:779-793.
133. Bernardi G, Olofsson B, Filipski J, Zerial M, Salinas J, Cuny G, Meunier-
Rotival M, Rodier F: The mosaic genome of warm-blooded
vertebrates. Science 1985, 228:953-958.
134. Bernardi G: Isochores and the evolutionary genomics of
vertebrates. Gene 2000, 241:3-17.
135. Hiratani I, Leskovar A, Gilbert DM: Differentiation-induced repli-
cation-timing changes are restricted to AT-rich/long inter-
spersed nuclear element (LINE)-rich isochores. Proc Natl Acad
Sci USA 2004, 101:16861-16866.
136. Dataset A [ />stemness/index.html]
137. Dataset B [ />DC1]
138. Mapping Algorithms [ />microarray_probe_set_mapping.html]
139. Dietrich WF, Miller JC, Steen RG, Merchant M, Damron D, Nahf R,
Gross A, Joyce DC, Wessel M, Dredge RD, et al.: A genetic map of
the mouse with 4,006 simple sequence length
polymorphisms. Nat Genet 1994, 7:220-245.
140. Mouse Genetic Map [ />UniSTS_MapReports/Mus_musculus/10090.WI-Genetic.txt]
141. Nei M, Gojobori T: Simple methods for estimating the num-
bers of synonymous and nonsynonymous nucleotide
substitutions. Mol Biol Evol 1986, 3:418-426.
142. Yang Z: PAML: a program package for phylogenetic analysis
by maximum likelihood. Comput Appl Biosci 1997, 13:555-556.
143. Fischer A, Gilad Y, Man O, Paabo S: Evolution of bitter taste
receptors in humans and apes. Mol Biol Evol 2005, 22:432-436.
144. PAML Manual [ />145. Statistical Package R []