Báo cáo y học: "The transcriptional program underlying the physiology of clostridial sporulation" pptx
Bạn đang xem bản rút gọn của tài liệu. Xem và tải ngay bản đầy đủ của tài liệu tại đây (3.98 MB, 21 trang )
Genome Biology 2008, 9:R114
Open Access
2008Joneset al.Volume 9, Issue 7, Article R114
Research
The transcriptional program underlying the physiology of clostridial
sporulation
Shawn W Jones
*†‡
, Carlos J Paredes
*§
, Bryan Tracy
*
, Nathan Cheng
*¶
,
Ryan Sillers
*
, Ryan S Senger
†‡
and Eleftherios T Papoutsakis
†‡
Addresses:
*
Department of Chemical and Biological Engineering, Northwestern University, Sheridan Road, Evanston, IL 60208-3120, USA.
†
Department of Chemical Engineering, University of Delaware, Academy Street, Newark, DE 19716, USA.
‡
Delaware Biotechnology Institute,
University of Delaware, Innovation Way, Newark, DE 19711, USA.
§
Current address: Cobalt Biofuels, Clyde Avenue, Mountain View, CA 94043,
USA.
¶
Current address: The Zitter Group, New Montgomery Street, San Francisco, CA 94105, USA.
Correspondence: Eleftherios T Papoutsakis. Email:
© 2008 Jones et al.; licensee BioMed Central Ltd.
This is an open access article distributed under the terms of the Creative Commons Attribution License ( which
permits unrestricted use, distribution, and reproduction in any medium, provided the original work is properly cited.
Clostridial sporulation<p>A detailed microarray analysis of transcription during sporulation of the strict anaerobe and endospore former <it>Clostridium aceto-butylicum</it> is presented.</p>
Abstract
Background: Clostridia are ancient soil organisms of major importance to human and animal
health and physiology, cellulose degradation, and the production of biofuels from renewable
resources. Elucidation of their sporulation program is critical for understanding important
clostridial programs pertaining to their physiology and their industrial or environmental
applications.
Results: Using a sensitive DNA-microarray platform and 25 sampling timepoints, we reveal the
genome-scale transcriptional basis of the Clostridium acetobutylicum sporulation program carried
deep into stationary phase. A significant fraction of the genes displayed temporal expression in six
distinct clusters of expression, which were analyzed with assistance from ontological classifications
in order to illuminate all known physiological observations and differentiation stages of this
industrial organism. The dynamic orchestration of all known sporulation sigma factors was
investigated, whereby in addition to their transcriptional profiles, both in terms of intensity and
differential expression, their activity was assessed by the average transcriptional patterns of
putative canonical genes of their regulon. All sigma factors of unknown function were investigated
by combining transcriptional data with predicted promoter binding motifs and antisense-RNA
downregulation to provide a preliminary assessment of their roles in sporulation. Downregulation
of two of these sigma factors, CAC1766 and CAP0167, affected the developmental process of
sporulation and are apparently novel sporulation-related sigma factors.
Conclusion: This is the first detailed roadmap of clostridial sporulation, the most detailed
transcriptional study ever reported for a strict anaerobe and endospore former, and the first
reported holistic effort to illuminate cellular physiology and differentiation of a lesser known
organism.
Published: 16 July 2008
Genome Biology 2008, 9:R114 (doi:10.1186/gb-2008-9-7-r114)
Received: 5 March 2008
Revised: 6 June 2008
Accepted: 16 July 2008
The electronic version of this article is the complete one and can be
found online at />Genome Biology 2008, 9:R114
Genome Biology 2008, Volume 9, Issue 7, Article R114 Jones et al. R114.2
Background
Clostridia are of major importance to human and animal
health and physiology, cellulose degradation, bioremedia-
tion, and for the production of biofuels and chemicals from
renewable resources [1]. These obligate anaerobic, Gram-
positive, endospore-forming firmicutes include several major
human and animal pathogens, such as C. botulinum, C. perf-
ringens, C. difficile, and C. tetani, the cellulolytic C. thermo-
cellum and C. phytofermentans, several ethanologenic [2],
and many solventogenic (butanol, acetone and ethanol) spe-
cies [3]. Their sporulation/differentiation program is critical
for understanding important cellular functions or programs,
yet it remains largely unknown. We have recently examined
the similarity of the clostridia and bacilli sporulation pro-
grams using information from sequenced clostridial genomes
[1]. We concluded that, based on genomic information alone,
the two programs are substantially different, reflecting the
different evolutionary age and roles of these two genera. We
have also argued that C. acetobutylicum is a good model
organism for all clostridia [1]. Transcriptional or functional
genomic information is, however, necessary for detailing
these differences and for understanding clostridial differenti-
ation and physiology. Key issues awaiting resolution include:
the identification of the mid to late sigma and sporulation fac-
tors and their regulons; the orchestration and timing of their
action; the set of genes employed by the cells in the mid and
late stages of spore maturation; identification of candidate
histidine kinases that might be capable of phosphorylating
the master regulator (Spo0A) of sporulation; and some func-
tional assessment of the roles of several sigma factors of
unknown function encoded by the C. acetobutylicum
genome. Furthermore, an understanding of the transcrip-
tional basis of the complex physiology of this organism will go
a long way to improve our ability to metabolically engineer,
for practical applications, its complex sporulation and meta-
bolic programs. Such information generates tremendous new
opportunities for further exploration of this complex anaer-
obe and its clostridial relatives, and constitutes a firm basis
for future detailed genetic and functional studies.
Using a limited in scope and resolution transcriptional study,
we have previously shown that it is possible to use DNA-
microarray-based transcriptional analysis to generate valua-
ble functional information related to stress response [4,5],
initiation of sporulation [6] and the early sporulation pro-
gram of C. acetobutylicum [7]. In order to be able to accu-
rately study the transcriptional orchestration underlying the
complete sporulation program of the cells, it was necessary to
develop a more sensitive and accurate microarray platform, a
better mRNA isolation protocol (in order to isolate RNA from
the mid and late stationary phases), as well as to use a much
higher frequency of observation and sampling. We also aimed
to employ more sophisticated bioinformatic tools in order to
globally interrogate any desirable cellular program and relate
it to the characteristic phenotypic metabolism and sporula-
tion of this organism. The results of this extensive study are
presented here as a single, undivided story, which offers
unprecedented insights and a tremendous wealth of informa-
tion for further explorations. Furthermore, it serves as a par-
adigm of what can be effectively accomplished with the now
highly accurate DNA-microarray analysis in generating a
robust transcriptional roadmap and in illuminating the phys-
iology of a lesser understood organism.
Results and discussion
Metabolism and differentiation of C. acetobutylicum:
identification of a new cell type?
We aimed to relate the metabolic and morphological charac-
teristics of the cells in a typical batch culture, whereby cells
underwent a full differentiation program, to the transcrip-
tional profile of the cell population [8]. The metabolism of
solventogenic clostridia is characterized by an initial acidog-
enic phase followed by acid re-assimilation and solvent pro-
duction [7]. As shown in Figure 1a, the peak of butyrate
concentration, around 16 hours after the start of the culture,
coincided with the initiation of butanol production. Around
this time, the culture transitioned from exponential growth to
stationary phase and initiated solventogenesis and sporula-
tion. This period is called the transitional phase and is indi-
cated by the gray bar in Figure 1a and all following figures.
The butanol concentration increased to over 150 mM until
hour 45, after which no substantial change in solvent or acid
concentration took place. Nevertheless, cells continued to
display morphological changes well past hour 60. Solven-
togenic clostridia display a series of morphological forms over
this differentiation program: vegetative, clostridial, fore-
spore, endospore, and free-spore forms [9]. In addition to
phase-contrast microscopy, we found that by using Syto-9 (a
green dye assumed to stain live cells) and propidium iodide
(PI; a red dye assumed to stain dead cells) [10] we could
microscopically distinguish these morphologies and identify
new cell subtypes. Staining by these two dyes did not follow
typical expectations. During exponential growth, vegetative
cells, characterized by a thin-rod morphology, were visibly
motile under the microscope, which is consistent with the
finding that chemotaxis and motility genes were highly
expressed during this time [7]. When double stained with
Syto-9 and PI dyes, these vegetative cells took on a predomi-
nantly red color, indicating the uptake of more PI than Syto-
9 (Figure 1b, I, II). At the onset of butanol production, swol-
len, cigar-shaped clostridial-form cells began to appear (Fig-
ure 1b, III). These clostridial forms (confirmed by phase-
contrast microscopy; data not shown), generally assumed to
be the cells that produce solvents [8], were far less motile
than exponential-phase cells and stained almost equally with
both dyes, taking on an orange color. Clostridial forms per-
sisted until solvent production decreased, after which fore-
spore forms (cells with one end swollen, which is indicative of
a spore forming) and endospore forms (cells with the middle
swollen, which is indicative of a developing spore) became
visible [9]. These cells stained almost exclusively green,
Genome Biology 2008, Volume 9, Issue 7, Article R114 Jones et al. R114.3
Genome Biology 2008, 9:R114
indicating an uptake of more Syto-9 than PI (Figure 1b, IV-
VI). The sporulation process is completed when the mother
cell undergoes autolysis to release the mature spore. Mature
free spores could be seen as early as hour 44 (Figure 1b, V).
Later, around hour 58 (Figure 1b, VI), a portion of the cells
became motile again. Though these cells appear like vegeta-
tive cells, they stained predominantly green, instead of red,
and did not produce appreciable amounts of acid. We hypoth-
esize that this staining change reflects modifications in mem-
brane composition due to different environmental conditions
(presence of solvents and other metabolites) rather than cell
viability and assume that this newly identified cell type has
different transcriptional characteristics, which we tested
next.
The transcriptional program of clostridial
differentiation
To ensure that important transcriptional, physiological, and
morphological changes were captured [7,8], RNA samples
were taken every hour during exponential phase and every
two hours after that until late stationary phase when sam-
pling frequency decreased. mRNA from 25 timepoints (Fig-
ure 1a) were selected for transcriptional analysis by
hybridizing pairs of 22k oligonucleotide microarrays on a dye
swap configuration using an mRNA pool as reference. There
were 814 genes, or 21% of the genome, that surpassed the
threshold of expression in at least 20 of the 25 microarray
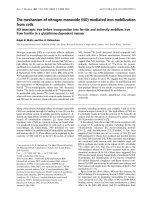
Morphological and gene expression changes C. acetobutylicum undergoes during exponential, transitional, and stationary phasesFigure 1
Morphological and gene expression changes C. acetobutylicum undergoes during exponential, transitional, and stationary phases. (a) Growth and acid and
solvent production curves as they relate to morphological and transcriptional changes during sporulation. The gray bar indicates the beginning of the
transitional phase as determined by solvent production. A
600
with microarray sample (filled squares); A
600
(open squares); butyrate (filled circles); butanol
(filled triangles). Roman numerals correspond with those in (b), and bars and numbers along the top correspond to the clusters in (c). (b) Morphological
changes during sporulation. When stained with Syto-9 (green) and PI (red), vegetative cells take on a predominantly red color (I and II). At peak butanol
production, swollen, cigar-shaped clostridial-form cells appear (arrow in III), which stain almost equally with both dyes, and persist until late stationary
phase. Towards the end of solvent production (IV), endospore (arrow 1) forms are visible, and clostridial (arrow 2) forms are still present. As the culture
enters late stationary phase (V and VI), cells stain almost exclusively green, regardless of morphology. All cell types are still present, including free spores
(arrows in V and VI), and vegetative cells identified by their motility. (c) Average expression profiles for each K-means cluster generated using a moving
average trendline with period 3. (d) Expression of the 814 genes (rows) at 25 timepoints (columns, hours 6, 7, 8, 9, 10, 12, 14, 16, 18, 20, 22, 24, 26, 28,
30, 32, 34, 36, 38, 40, 44, 48, 54, 58, and 66). Genes with higher expression than the reference RNA are shown in red and those with lower expression as
green. Saturated expression levels: ten-fold difference.
Exponential (1)
Vegetative form
134 genes (hour 6-10)
Transitional (2)
Vegetative form
139 genes (hour 10-18)
Stationary (3)
Clostridial form
175 genes (hour 18-36)
Early stationary (4)
Clostridial form
84 genes (hour 18-24)
Middle stationary (5)
Clostridial form
120 genes (hour 24-36)
Late stationary (6)
Endospore/free spore
162 genes (hour 36-66)
6
12
22 66
Time (h)
I
V
V
I
II
IV
III
1
2
10
1.0
0.1
0.01
100
A
600
10
20 30 40 50 60
Time (h)
0
50
100
150
200
Concentration (mM)
12
45 6
3
(c) (d)
(a)
I
II III IV
VV
I
(b)
32 44
612
2
26
6
Time (h)
32 44
Genome Biology 2008, 9:R114
Genome Biology 2008, Volume 9, Issue 7, Article R114 Jones et al. R114.4
timepoints and had two or more timepoints differentially
expressed at a 95% confidence level [11]; these genes were
classified as having a temporal differential expression profile.
We chose these strict selection criteria in order to robustly
identify the key expression patterns of the differentiation
process. We relaxed these criteria in subsequent gene ontol-
ogy-driven analyses. Expression data were extensively vali-
dated by, first, quantitative reverse transcription PCR (Q-RT-
PCR) analysis (focusing on key sporulation factors) from a
biological replicate culture (Figure 2), and, second, by sys-
tematic comparison to our published (but limited in scope
and duration) microarray study (see Additional data file 1 for
Figure S1 and discussion).
Six distinct clusters of temporal expression patterns were
selected (Figure 1c,d) by K-means to achieve a balance
between inter- and intra-cluster variability. To examine tran-
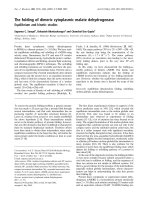
Q-RT-PCR and microarray data comparisonFigure 2
Q-RT-PCR and microarray data comparison. RNA from a biological replicate bioreactor experiment was reverse transcribed into cDNA for the Q-RT-
PCR. All expression ratios are shown relative to the first timepoint for both Q-RT-PCR (open circles) and microarray data (filled squares). Asterisks
represent data below the cutoff value for microarray analysis. Samples were taken every six hours starting from hour 6 and continuing until hour 48. The
genes examined were from several operons with different patterns of expression.
*
*
*
*
*
*
*
*
*
**
*
*
*
Expression ratio relative to first timepoint
abrB
sinR
spo0A sigE
sigG
sigF
spoIIE
sigK
spoIIID
spoIIIAA
100
10
1
0.1
100
10
1
0.1
10
1
0.1
100
10
1
0.1
1,000
24 36 48
Time (h)
0.01
120
24 36 48120243648120
Genome Biology 2008, Volume 9, Issue 7, Article R114 Jones et al. R114.5
Genome Biology 2008, 9:R114
scriptional changes in larger functional groups (for example,
transcription, motility, translation), each cluster was ana-
lyzed according to the Cluster of Orthologous Groups of
proteins (COG) classification [12] and the functional genome
annotation [13]. To determine if a COG functional group was
overrepresented in any of the K-means clusters, first the per-
centage of each group in the genome was determined, and
then the percentage of each group was determined in each of
the K-means clusters. By comparing the percentage in the K-
means clusters to the genome percentage, we could identify
overrepresented groups (Additional data file 2).
Exponential phase: motility, chemotaxis, nucleotide and primary
metabolism
The first cluster contains 134 genes highly expressed during
exponential growth (hours 6 to 10; see Additional data file 2
for a list of the genes). This cluster characterizes highly motile
vegetative cells (Figure 1b, I) and, given the minimal amount
of knowledge on the genes responsible for motility and chem-
otaxis in clostridia, our analysis offers the possibility of iden-
tifying these genes at the genome scale [14]. This cluster
includes the flagella structural components flagellin and flbD,
the main chemotaxis response regulator, cheY (CAC0122;
responsible for flagellar rotation in B. subtilis [15]), as well as
several methyl-accepting chemotaxis receptor genes
(CAC0432, CAC0443, CAC0542, CAC1600, CAP0048). COG
analysis showed that genes related to cell motility (COG class
N) and nucleotide transport and metabolism (COG class F)
were overrepresented in this cluster (Additional data file 2).
In order to investigate cell motility further, all genes that fell
within this COG class were hierarchically clustered according
to their expression profiles (see Additional data file 3 for Fig-
ure S2 and discussion). Interestingly, the two main cell motil-
ity gene clusters, the first including most of the flagellar
assembly and motor proteins and the second containing most
of the known chemotaxis proteins, clustered together and dis-
played a bimodal expression pattern (Figure S2). The genes
were not only expressed during exponential phase but also
during late stationary phase, around hour 38, which is con-
sistent with the observation that a motile cell population was
again observed in late stationary phase. Included in the cate-
gory of nucleotide transport and metabolism are several
purine and pyrimidine biosynthesis genes: a set of five con-
secutive genes, purECFMN, the bi-functional purQ/L gene,
purA, pyrPR, pyrD, and pyrI. Two other purine synthesis
genes (purH, purD) showed very similar profiles but were not
classified within this cluster by the clustering algorithm. Veg-
etative cells, which correspond to this cluster, produce ATP
through acidogenesis, whereby the cells uptake glucose and
convert it to acetic and butyric acid. Because glucose is the
main energy source, multiple genes for glucose transport
were included within this cluster, including the glucose-spe-
cific phosphotransferase gene, ptsG, the glucose kinase glcK
and CAP0131, the gene most similar to B. subtilis glucose per-
mease glcP. The genes required for the metabolism of glucose
to pyruvate did not show temporal regulation, suggesting that
expression of these genes is constitutive-like (see Additional
data file 3 for Figure S3 and discussion). Acetic acid produc-
tion genes pta and ack were not temporally expressed, but
butyrate production genes ptb and buk were. Though
expressed throughout exponential phase, the expression of
both ptb and buk
slightly peaked during late exponential
phase, as previously seen [7], and thus fall in the transitional
(second) cluster. Analysis of the expression patterns of all the
genes involved in acidogenesis, not just the differentially
expressed genes discussed here, is included in Figure S3 in
Additional data file 3. Finally, the expression patterns of the
two classes of hydrogenases (iron only and nickel-iron) were
investigated (Figure S3 in Additional data file 3). hydA, the
iron only hydrogenase that catalyzes the production of molec-
ular hydrogen, was expressed only during exponential phase,
whereas the iron-nickel hydrogenase, mbhS and mbhL, was
expressed throughout stationary phase.
Initiation of sporulation: abrB, sinR, lipid and iron metabolism
The transitional phase is captured by 139 genes in the second
cluster (Figure 1c,d; Additional data file 2). It is made up of
genes that show elevated expression between hours 10 and 18
and is when solvent formation was initiated. This cluster
characterizes the shift from vegetative cells to cells commit-
ting to sporulation and thus includes two important regula-
tors of sporulation, abrB (CAC0310) and sinR (CAC0549),
which are discussed in more detail below. Also characteristic
of this shift from vegetative growth to sporulation was the
overrepresentation of genes related to energy production and
conversion (COG class C), since sporulation is an energy
intensive process. Solvent production began in the transi-
tional phase, though the genes responsible for solvent pro-
duction fall in the next (third) cluster; the third cluster
partially overlaps with this second cluster but is distinguished
by a sustained expression pattern. In response to these sol-
vents, C. acetobutylicum undergoes a change in its mem-
brane composition and fluidity, generally decreasing the ratio
between unsaturated to saturated fatty acids [16-18]. Consist-
ent with this change, genes related to lipid metabolism (COG
class I) were overrepresented in this cluster. To further inves-
tigate this COG class, all genes identified as COG class I were
hierarchically clustered (see Additional data file 3 for Figure
S4 and discussion). Seven genes that were upregulated just
before the onset of sporulation fall within the same operon
and are related to fatty acid synthesis. In contrast, many of
the most characterized genes involved in fatty acid synthesis
(accBC, fabDFZ, and acp) maintain a fairly flat profile
throughout the timecourse (Figure S4 in Additional data file
3). Also within this cluster is the gene responsible for cyclo-
propane fatty acid synthesis (cfa), though classified in COG
class M (cell envelope biogenesis) and not COG class I.
Importantly, the ratio of cyclopropane fatty acids in the outer
membrane has been shown to increase as cells enter station-
ary phase [18,19], but the overexpression of this gene alone
was unable to produce a solvent tolerant strain [19]. Though
not overrepresented in this cluster, all the genes within COG
Genome Biology 2008, 9:R114
Genome Biology 2008, Volume 9, Issue 7, Article R114 Jones et al. R114.6
class M were also hierarchically clustered (see Additional data
file 3 for Figure S5 and discussion). The transitional cluster
also included several genes related to iron transport and
regulation like the fur family iron uptake regulator CAC2634,
the iron permease CAC0788, feoA, feoB, fhuC, and two iron-
regulated transporters (CAC3288, CAC3290), which is con-
sistent with the earlier, more limited data [7]. Significantly,
iron-limitation has been found to promote solventogenesis
[20].
Solventogenesis, clostridial form, stress proteins, and early sigma
factors
The third cluster (Figure 1c,d; Additional data file 2) of 175
upregulated genes represents the solventogenic/stationary
phase as it contains all key solventogenic genes. This cluster
characterizes the transcriptional pattern of clostridial cells,
the unique developmental stage in clostridia and first
recognizable cell type of the sporulation cascade, and exhib-
ited a longer upregulation of gene expression than the previ-
ous two clusters. Indeed, its range overlapped the previous
(second) and the next two (fourth and fifth) clusters. The
clostridial form is generally recognized to be the form respon-
sible for solvent production [8,21] and is distinguished mor-
phologically as swollen cell forms with phase bright granulose
within the cell [21]. This cluster captures both of these char-
acteristics with the inclusion of the solventogenic genes and
several granulose formation genes. The solventogenic genes
adhE1-ctfA-ctfB, adc, and bdhB were initially induced during
transitional phase, the second cluster, but were expressed
throughout stationary phase and were thus placed within this
cluster. Two granulose formation genes, glgC (CAC2237) and
CAC2240, and a granulose degradation gene, glgP
(CAC1664), were included within this cluster. The other two
granulose formation genes, glgD (CAC2238) and glgA
(CAC2239), though not included in this cluster, displayed a
similar expression profile to glgC and CAC2240. The con-
comitant requirement of NADH during butanol production
drove the expression of three genes involved in NAD forma-
tion: nadABC. Expression of the stress-response gene hsp18,
a heat-shock related chaperone, and the ctsR-yacH-yacI-
clpC operon, containing the molecular chaperone clpC and
the stress-gene repressor ctsR, also fell in this cluster and par-
alleled the expression of the solventogenic genes (see Addi-
tional data file 3 for Figure S6). Other important stress-
response genes, groEL-groES (CAC2703-04) and hrcA-
grpE-dnaK-dnaJ (CAC1280-83), mirrored this expression
pattern, though were not differentially expressed according to
the strict criteria employed for selecting the genes of Figure
2c,d (Figure S6 in Additional data file 3). Although genes
encoded on the pSOL1 megaplasmid [22] represent less than
5% of the genome, they constitute 15% of genes in this cluster.
pSOL1 harbors all essential solvent-formation genes and,
importantly, some unknown gene(s) essential for sporulation
[22]. Besides the genes listed in this cluster, the vast majority
of the genes located on pSOL1 were expressed throughout sta-
tionary phase, with most being upregulated at the onset of
solventogenesis (see Additional data file 3 for Figure S7). Sev-
eral key sporulation-specific sigma factors (
σ
F
, σ
E
, σ
G
) and the
σ
F
-associated anti-sigma factors in the form of the tricistronic
spoIIA operon (CAC2308-06) belong to this cluster along
with one of the two paralogs of spoVS (CAC1750) and one of
three spoVD paralogs (CAP0150). The second spoVS paralog
(CAC1817) did not meet the threshold of expression in 12 of
the 25 timepoints; the other two paralogs of spoVD
(CAC0329, CAC2130) were above the expression cutoff but
did not show significant temporal regulation. Of unknown
significance was the expression of a large cluster of genes
involved in the biosynthesis of the branched-chain amino
acids valine, leucine and isoleucine (CAC3169-74) coinciding
with the onset of solventogenesis, as shown before [7,23], as
well as the upregulation of several glycosyltranferases (see
Additional data file 3 for Figure S8). The upregulation of
valine, leucine, and isoleucine synthesis genes could be indic-
ative of a membrane fluidity adaptation [7]. In B. subtilis,
these branched-chain amino acids can be converted into
branched-chain fatty acids and change the membrane fluidity
[24], and under cold shock stress, B. subtilis downregulates a
number of genes related to valine, leucine, and isoleucine syn-
thesis [25]. Therefore, this upregulation may be another
mechanism to change membrane fluidity, though the ratio of
unbranched and branched fatty acids has not been reported
in studies investigating membrane composition [16-18,26].
Stationary phase carbohydrate (beyond glucose) and amino acid
metabolism
The fourth cluster (Figure 1c,d; Additional data file 2) of 84
genes represents a sharp induction of expression between 18
and 24 hours (early stationary phase). This cluster falls within
the stationary (third) cluster described above. This is a com-
pact group, with 70% belonging to one of three COG catego-
ries: carbohydrate transport and metabolism, transport and
metabolism of amino acids, and inorganic ion transport and
metabolism. A number of different carbohydrate substrate
pathways, from monosaccharides (fructose, galactose, man-
nose, and xylose) to disaccharides (lactose, maltose, and
sucrose) to complex carbohydrates (cellulose, glycogen,
starch, and xylan), were investigated, and many exhibited
upregulation during stationary phase, though only a few are
highly expressed (see Additional data file 3 for Figure S9).
The significance of this upregulation of non-glucose pathways
is unknown, because sufficient glucose remains in the media
(approximately 200 mM or about 44% of the initial glucose
level). Of particular interest was the upregulation of several
genes related to starch and xylan degradation (Figure S9 in
Additional data file 3). The two annotated α-amylases
(CAP0098 and CAP0168) along with the less characterized
glucosidases and glucoamylase were all upregulated through-
out stationary phase and a number were highly expressed,
like CAC2810 and CAP0098. Also upregulated were the pre-
dicted xylanases CAC2383, CAP0054, and CAC1037, with
CAP0054 and CAC1037 being highly expressed during sta-
tionary phase. Mirroring this pattern were CAC1086, a xylose
Genome Biology 2008, Volume 9, Issue 7, Article R114 Jones et al. R114.7
Genome Biology 2008, 9:R114
associated transcriptional regulator, and the highly expressed
CAC2612, a xylulose kinase. The genes related to glycogen
metabolism are believed to be involved in granulose
formation, as discussed earlier. Several genes for arginine
biosynthesis (argF, argGH, argDB, argCJ, carB) were
induced during this time, probably as a result of its depletion
in the culture medium.
Genes underlying the activation of the sporulation machinery and the
genes for tryptophan and histidine biosynthesis
The fifth cluster (Figure 1c,d; Additional data file 2), repre-
senting the middle stationary phase, contains 120 genes
mainly expressed between hours 24 and 36, and again falls
within the stationary (third) cluster described above. Most of
the genes in this cluster activate the sporulation-related
sigma factors (σ
F
, σ
E
, σ
G
) or are putatively regulated by them.
These include spoIIE, the phosphatase that dephosphorylates
SpoIIAA and results in the activation of σ
F
, and the σ
E
-
dependent operons spoVR (involved in cortex synthesis),
spoIIIAA-AH (required for the activation of σ
G
), and spoIVA
(involved in cortex formation and spore coat assembly). The
σ
G
-dependent spoVT gene has two paralogs in C. acetobutyl-
icum (CAC3214, CAC3649); the transcriptional pattern sug-
gests that CAC3214, included in this cluster, is the real spoVT.
Sporulation-related genes included in this cluster are three
cotF genes, one cotJ gene, one cotS gene, the spore matura-
tion protein B, a small acid soluble protein (CAC2365), and
two spore lytic enzymes (CAC0686, CAC3244). Though sev-
eral sporulation-related genes are included in the next (sixth)
cluster as well, most, beyond those listed here, are upregu-
lated in mid-stationary phase (see Additional data file 3 for
Figure S10 and discussion). Seven genes of the putative
operon (CAC3157-63) encoding genes for tryptophan synthe-
sis from chorismate and ten genes for histidine synthesis
(CAC0935-43, CAC3031) were also included here.
Spore maturation and late-stationary phase vegetative cells
The sixth cluster, representative of the late stationary phase,
includes 162 genes mainly expressed after hour 36 (Figure
1c,d; Additional data file 2). This cluster captured the expres-
sion profiles of the forespore and endospore forms, free
spores, and late-stage vegetative-like cells. The endospore
form represents the last stage before mature spores are
released, and therefore fewer sporulation-related genes are
within this cluster than previous ones. The sporulation-
related genes included in this cluster are two small acid-solu-
ble proteins (CAC1522 and CAC2372), a spore germination
protein (CAC3302), a spore coat biosynthesis protein
(CAC2190) and a spore protease (CAC1275). Also within this
cluster are the two phosphotransferase genes, CAC2958 (a
galactitol-specific transporter) and CAC2965 (a lactose-spe-
cific transporter), another annotated cheY (CAC2218), vari-
ous enzymes related to different sugar pathways (CAC2180,
CAC2250, CAC2954), and two glycosyltransferases
(CAC2172, CAC3049). Expression of these genes may be
reflective of the late-stage vegetative-like cells observed dur-
ing microscopy and demonstrate they have a different genetic
profile compared to the early vegetative cells. Interestingly,
this cluster is enriched in defense mechanism genes (COG
class V) like a phospholipase (CAC3026) and multidrug
transporters that may play a role in resistance to a variety of
environmental toxins.
General processes: cell division and ribosomal proteins
Two additional gene classes (cell division and ribosomal pro-
teins), though not overrepresented in any of the six clusters
described above, were investigated because of their impor-
tance in cellular processes and interesting expression pat-
terns. COG class D (cell division and chromosome
partitioning), besides important genes for vegetative sym-
metric division, includes ftsAZ, important for both symmetric
and asymmetric cell division, and soj (a regulator of spo0J)
and spoIIIE, important for proper chromosomal partitioning
between the mother cell and prespore. These genes, along
with several uncharacterized genes, were upregulated at the
beginning of sporulation (see Additional data file 3 for Figure
S11). Almost all the ribosomal proteins were downregulated
as the culture entered stationary phase, and interestingly,
about half of those downregulated genes were again upregu-
lated in mid-stationary phase and remained upregulated until
late-stationary phase (see Additional data file 3 for Figure
S12). This upregulation is likely related to the late-stage veg-
etative-like cells seen.
Expression and activity patterns of sporulation-related
sigma factors and related genes
Expression of sporulation transcription factors
Sporulation in bacilli is initiated by a multi-component phos-
phorelay [27], which is absent in clostridia, but the master
regulator of sporulation, Spo0A, is conserved [1,13]. Briefly,
in B. subtilis, phosphorylated Spo0A promotes the expression
of prespore-specific sigma factor σ
F
and mother cell-specific
sigma factor σ
E
[28]. σ
F
is followed by σ
G
, which is controlled
by both σ
F
and σ
E
, and σ
E
is followed by σ
K
, which is control-
led by σ
E
and SpoIIID [28]. sigH expression, in bacilli, is
induced before the onset of sporulation and aids spo0A tran-
scription [28]. Here, sigH expression underwent a modest
two-fold induction, relative to the first timepoint, during the
onset of sporulation but never increased beyond three-fold, in
contrast to all other sporulation factors (Figure 3a). spo0A
expression also peaked during the onset of sporulation at over
12-fold and maintained a minimum of 3-fold induction until
hour 36 (Figure 3a,b). Once phosphorylated, in bacilli and
likely in C. acetobutylicum [29], Spo0A regulates the expres-
sion of the operons encoding sigF, sigE, and spoIIE [30], the
latter of which acts as an activator of σ
F
. sigF and sigE exhib-
ited an initial 16- and 8-fold induction, respectively, at hour
12, the timing of peak spo0A expression, but a second higher
level of induction, 46- and 66-fold, respectively, was reached
later at hour 24 (Figure 3c) and confirmed with Q-RT-PCR
(Figure 2). The plateau or decrease in expression of spo0A,
sigF, and sigE coincided with the peak expression of two
Genome Biology 2008, 9:R114
Genome Biology 2008, Volume 9, Issue 7, Article R114 Jones et al. R114.8
known repressors, abrB and sinR, of sporulation genes in B.
subtilis (Figure 3b), the former repressing the expression of
spo0A promoters and the latter directly binding to the
promoter sequences of the spo0A, sigF, and sigE operons
[31,32]. C. acetobutylicum contains three paralogs of abrB,
among which CAC0310 exhibited the highest promoter activ-
ity and, when downregulated, causes delayed sporulation and
decreased solvent formation [33]. sinR (CAC0549) expres-
sion in C. acetobutylicum was previously reported [33] to be
weak, but our data show a significant amount of expression
and suggest a similar role as that in B. subtilis. In B. subtilis,
Spo0A either indirectly (sinR) or directly (abrB) represses
the genes of these two repressors [32,34]. The expression pat-
terns of both genes did decrease after peak Spo0A~P deduced
activity (Figure 4b; see below), indicating a similar regulatory
network may be involved in C. acetobutylicum. sigF, sigE and
sigG have very similar expression patterns (Figure 3c). Both
sigF and sigE are activated by Spo0A~P, so similar expres-
sion profiles were expected. In B. subtilis, a sigG transcript is
also detected early, but this transcript is read-through from
sigE, located immediately upstream of sigG, and is not trans-
lated [35,36]. Translation of sigG occurs when the gene is
expressed as a single cistron from a σ
F
-dependent promoter
located between sigE and sigG [35,36]. In C. acetobutylicum,
sigE and sigG are also located adjacent to each other, but a σ
F
promoter was not predicted between the two genes [37].
Thus, it was predicted that sigG is only expressed as part of
the sigE operon (consisting of spoIIGA, the processing
enzyme for σ
E
, and sigE). Our transcriptional data seem to
support this prediction because all three genes, spoIIGA,
sigE, and sigG, have very similar transcriptional patterns
(Figure 3f), suggesting they are expressed as a single tran-
script, like the spoIIAA-spoIIAB-sigF operon (Figure 3e).
However, from Northern blots probing against sigE-sigG,
three separate transcripts were seen: one for spoIIGA-sigE-
sigG, one for spoIIGA-sigE, and one for sigG [29]. Unfortu-
nately, the current data cannot resolve this issue definitively,
since the microarrays only detect if a transcript is present or
not.
Deduced activity profiles of sporulation factors
We also desired to estimate the activity profiles for the key
sporulation factors (σ
H
, Spo0A, σ
F
, σ
E
, and σ
G
; Figure 4). We
did so by averaging the expression profiles of known or
robustly identifiable canonical genes of their regulons [1]. To
adjust for differences in relative expression levels, expression
profiles were standardized before averaging [7]. This is a sur-
rogate reporter assay, which we believe is as accurate as most
reporter assays. For a detailed discussion of the genes used to
construct the plots, see Additional data file 4. For all of the
plots (Figure 4), peak activity took place after peak expres-
sion, as expected. Of all the factors, σ
H
activity peaked first,
during early transitional phase, and this was followed by a
decrease in activity until stationary phase, when activity
increased again (Figure 4a,f). Spo0A~P activity was the next
to peak, during late transitional phase, and stayed fairly con-
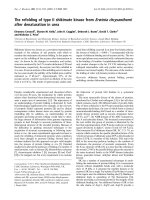
Investigation of the sporulation cascade in C. acetobutylicumFigure 3
Investigation of the sporulation cascade in C. acetobutylicum. (a-f)
Expression profiles of sporulation genes shown as ratios against the first
expressed timepoint. (a) The first three sporulation factors: spo0A (red
filled triangles), sigH (black filled squares), and sigF (open blue circles). (b)
spo0A (red filled triangles) and possible sporulation regulators: abrB (open
black circles) and sinR (green filled diamonds). (c) Sporulation factors
downstream of spo0A: sigF (open blue circles), sigE (black filled triangles),
and sigG (open red squares). (d) Genes related to sigK expression: spoIIID
(blue filled diamonds), yabG (red filled triangles), and spsF (black filled
triangles). (e) spoIIA operon: spoIIAA (black filled diamonds), spoIIAB (red
filled triangles), and sigF (open blue circles). (f) spoIIG operon and sigG:
spoIIGA (green filled diamonds), sigE (black filled triangles), and sigG (open
red squares). The gray bar indicates the onset of transitional phase. (g)
Ranked expression intensities. White denotes a rank of 1, while dark blue
denotes a rank of 100 (see scale). Gray squares indicate timepoints at
which the intensity did not exceed the threshold value. Bracketed genes
are predicted to be coexpressed as an operon.
(a) (b)
(c)
Expression ratio
100
10
1
0.1
100
10
1
0.1
100
10
1
0.1
1,000
0 12 24 36 48 60 0 12 24 36 48 60
0 1224364860
(g)
Time
6101826344466
150100
Rank scale
0 1224364860
100
10
1
0.1
(d)
CAC2071 - spo0A
CAC0310 - abrB
CAC0549 - sinR
CAC3152 - sigH
CAC2308 - spoIIAA
CAC2307 - spoIIAB
CAC2306 - sigF
CAC1694 - spoIIGA
CAC1695 - sigE
CAC1696 - sigG
CAC3205 - spoIIE
CAC2898 - spoIIR
CAC2093 - spoIIIAA
CAC2092 - spoIIIAB
CAC2091 - spoIIIAC
CAC2090 - spoIIIAD
CAC2088 - spoIIIAF
CAC2087 - spoIIIAG
CAC2086 - spoIIIAH
CAC2859 - spoIIID
CAC2905 - yabG
CAC2190 - spsF
(e)
0 1224364860
10
1
0.1
100
01224364860
10
1
0.1
100
1,000
(f)
Time (h) Time (h)
Time (h)
Expression ratioExpression ratio
Genome Biology 2008, Volume 9, Issue 7, Article R114 Jones et al. R114.9
Genome Biology 2008, 9:R114
stant throughout the rest of the timecourse (Figure 4b,f). σ
F
activity had an initial induction during transitional phase, but
then stayed constant until 24 hours (Figure 4c,f). After 24
hours, the activity increased again and stayed fairly constant
at this higher activity level for the rest of the culture. σ
E
activ-
ity increased slightly during late transitional phase, but its
major increase occurred after 24 hours during mid-stationary
phase (Figure 4d,f). Like the previous sigma factors, σ
G
activ-
ity increased throughout early stationary phase and early
mid-stationary phase, but the major increase occurred after
hour 30 (Figure 4e,f). The activity of all of the factors, except
for Spo0A and σ
F
, decreased during late stationary phase at
hour 38. σ
G
activity began to increase slightly again at hour 48
but did not peak again. Considering only major peaks in activ-
ity, the Bacillus model of sporulation is generally true with
the peaks progressing from σ
H
to Spo0A~P to σ
F
to σ
E
and
finally to σ
G
(Figure 4f).
Can we deduce the activation and processing of
σ
F
,
σ
E
, and
σ
G
from
transcriptional data?
In B. subtilis, the sigma factors downstream of Spo0A (σ
F
, σ
E
,
and σ
G
) are all regulated by a complex network of interactions
[1]. We desired to examine if our transcriptional data could be
used to do a first test to determine whether the mechanisms
employed in the B. subtilis model are valid for C. acetobutyl-
icum. In B. subtilis, σ
F
is held inactive in the pre-divisional
cell by the anti-σ
F
factor SpoIIAB. σ
F
is released when the
anti-anti-σ
F
factor SpoIIAA is dephosphorylated by SpoIIE,
resulting in SpoIIAA binding to SpoIIAB, which then releases
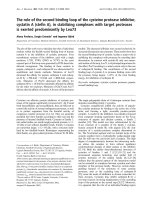
Transcriptional and putative activity profiles for the major sporulation factorsFigure 4
Transcriptional and putative activity profiles for the major sporulation factors. The standardized expression ratios compared to the RNA reference pool of
(a) sigH, (b) spo0A, (c) sigF, (d) sigE, and (e) sigG are shown in black, while the activity profiles based on the averaged standardized profiles of canonical
genes under their control are shown in red. Putative genes (based on the B. subtilis model) responsible for activating σ
F
(spoIIE), σ
E
(spoIIR), and σ
G
(spoIIIA
operon) are shown as light blue diamonds. For the spoIIIA operon, the individual standardized ratios (Figure S13g in Additional data file 4) were averaged
together. The gray bar indicates the onset of the transitional phase. (f) Compilation of the activity profiles for sigH (red), spo0A (blue), sigF (green), sigE
(black), and sigG (purple). The numbers along the top correspond to the clusters in Figure 1c,d and the bars indicate the timing of each cluster.
(a) (b) (c)
(d)
(e)
Expression ratio
1.6
1.3
1.0
0.8
0122
43
64860
0 12243
64
86
0
0122
4
3
64
8
6
0
0
12 24
36 48
60
01
224364
860
Time (h)
01
22
4364860
0.6
1.6
1.3
1.0
0.8
0.6
1.6
1.3
1.0
0.8
0.6
1.6
1.3
1.0
0.8
0.6
1.6
1.3
1.0
0.8
0.6
(f)
1.6
1.3
1.0
0.8
0.6
12
3
45
6
2.1
Expression ratioExpression ratio
Time (h) Time (h)
Time (h)
Genome Biology 2008, 9:R114
Genome Biology 2008, Volume 9, Issue 7, Article R114 Jones et al. R114.10
σ
F
. In C. acetobutylicum, spoIIAB (CAC2307) and spoIIAA
(CAC2308) are transcribed on the same operon as sigF (Fig-
ure 3e), but spoIIE (CAC3205) is transcribed separately. The
initial increase in σ
F
activity during the transitional phase was
not accompanied by an increase in spoIIE expression, but the
peak in σ
F
activity did occur after spoIIE upregulation (Figure
4c). Despite the sustained level of σ
F
activity, sigF and spoIIE
decreased in expression, though spoIIE expression did
increase slightly again after 48 hours (Figure 4c). In B. subti-
lis, the pro-σ
E
translated from the sigE gene undergoes
processing from SpoIIGA, which must interact with SpoIIR in
order to accomplish the σ
E
activation. In C. acetobutylicum,
SpoIIGA (CAC1694) is transcribed on the same operon as
sigE (Figure 3f), and SpoIIR is coded by CAC2898. σ
E
activity
increased with the induction of spoIIR (Figure 4d), suggest-
ing a similar mechanism as in B. subtilis. Finally, σ
G
activa-
tion in B. subtilis is dependent upon the eight genes within
the spoIIIA operon. Here, the second and larger increase in
σ
G
activity followed peak expression of the spoIIIA operon,
but the early increase in σ
G
activity was not characterized by a
large induction of spoIIIA expression (Figure 4e). We tenta-
tively conclude that the B. subtilis processing and activation
model does generally hold true in C. acetobutylicum, but fur-
ther investigation is needed to determine the exact timing and
interaction of the various factors and their activators.
Is there a functional sigK?
In B. subtilis, σ
K
is formed by splicing together two genes
(spoIVCB and spoIIIC), both under the control of σ
E
and
SpoIIID [38], separated by a skin element [39]. In contrast, a
single gene encoding σ
K
has been annotated in C.
acetobutylicum [13]. The gene was initially identified using a
PCR-approach [40] and was later detected by primer exten-
sion in a phosphate-limited, continuous culture of C. aceto-
butylicum DSM 1731 [41]. spoIIID, which controls sigK
expression with σ
E
in B. subtilis, reached peak expression at
hour 30, which is consistent with it being under σ
E
control
(Figure 3d) [42]. However, at no timepoint in this study did
sigK exceed the cutoff expression criterion. Q-RT-PCR also
showed a significantly lower sigK induction compared to the
other sigma factors and suggests the transcript, if expressed,
is at much lower levels than any other gene analyzed (Figure
2). The putative main σ
K
processing enzyme, SpoIVFB
(CAC1253), also did not exceed the cutoff criterion. To help
determine if there is an active σ
K
, we investigated two genes
controlled by σ
K
in B. subtilis. yabG (CAC2905), which
encodes a protein involved in spore coat assembly, was upreg-
ulated mid-stationary phase and peaked at hour 30 (Figure
3d), and spsF (CAC2190), involved in spore coat synthesis,
was not upregulated until late stationary phase, at hour 38
(Figure 3d). From these two genes, it is difficult to determine
whether a functional sigK gene exists or not. Clearly they are
both transcribed, but based on its expression pattern, yabG
could fall under the control of σ
E
instead of σ
K
. spsF upregu-
lation is late enough to possibly indicate σ
K
regulation though.
Ideally, more genes need to be investigated to draw firmer
conclusions, but because few σ
K
regulon homologs exist in C.
acetobutylicum, we cannot currently determine if there is σ
K
activity or not.
Distinct profiles of sensory histidine kinases: which for
Spo0A?
Revisiting the orphan kinases
As discussed, phosphorylated Spo0A is responsible for initi-
ating sporulation in both bacilli and clostridia along with sol-
vent formation in C. acetobutylicum. In bacilli, Spo0A is
phosphorylated via a multi-component phosphorelay [43],
initiated by five orphan histidine kinases, KinA-E (kinases
that lack an adjacent response regulator); this phosphorelay
system is absent in all sequenced clostridia [1]. Alternatively,
Spo0A in clostridia may be directly phosphorylated by a his-
tidine kinase, orphan or not, as was hypothesized in [1,7].
This alternative was demonstrated in C. botulinum, where the
orphan kinase CBO1120 was able to phosphorylate Spo0A
[44]. In C. acetobutylicum, five true orphan kinases have
been identified with a sixth orphan, CAC2220, identified as
CheA, which has a known response regulator [1].
A kinase that could directly phosphorylate Spo0A is expected
to have a peak in expression before or during the activation of
Spo0A, as the orphan kinases in B. subtilis do [45-47]. As a
measure of Spo0A activity, the expression of the sol operon
(CAP0162-64) was used, as before [7], because it is induced
by Spo0A~P. The initial induction of the sol operon, almost
100-fold, occured at hour 10 (before spo0A reached it maxi-
mum expression), with detectable levels of butanol appearing
before the second induction of the sol operon. This second
induction, of another 10-fold, followed the peak in spo0A
expression (Figure 5a). It is clear that some level of phospho-
rylated Spo0A exists at 10 hours; therefore, kinase candidates
must display an increase in expression before 10 hours. Of the
five orphan kinases (Figure 5b,c), CAC2730 displayed the ear-
liest peak followed by CAC0437, CAC0903, and CAC3319.
CAC0323 never displayed a prominent peak in expression
either before or after sol operon induction (Figure 5b) and
likely does not play a role in phosphorylating Spo0A. Of the
remaining four, CAC0437 and CAC2730 peaked only once
before the initial sol operon induction, while CAC0903
peaked before each induction of the sol operon (Figure 5b,c).
CAC3319 expression slightly mirrored that of the sol operon,
with an increase before initial induction followed by a pla-
teau, and an increase in expression again until it peaked just
after the sol operon peaked (Figure 5c). The proteins encoded
by CAC0437 and CA0903 displayed the most similarity to the
protein encoded by CBO1120, the orphan kinase in C. botuli-
num shown to phosphorylate Spo0A [44].
Non-orphan kinase expression
Though primarily interested in orphan kinases because of the
similarity to the B. subtilis model, a two-component response
system could also be responsible for the phosphorylation of
Spo0A. The remaining 30 annotated histidine kinases were
Genome Biology 2008, Volume 9, Issue 7, Article R114 Jones et al. R114.11
Genome Biology 2008, 9:R114
also investigated to determine if any displayed a peak in
expression before the initial induction of the sol operon
(Additional data file 5). Six kinases (Figure 5d,e) were found
to have a peak in expression at 8 hours. CAC0290 and
CAC3430 subsequently decreased in expression while
CAC0225 and CAC0863 maintained expression at initial lev-
els. Despite a dip in expression at hour 9, CAC1582 main-
tained an increased expression level from 8 hours on.
CAC2434 peaked at hour 8, dropped back to initial levels, but
then steadily increased with the second induction of the sol
operon.
Sigma factors of unknown function: a first assessment
of their functional roles
Seventeen sigma factors are annotated on the C. acetobutyli-
cum genome, including two on pSOL1. Two, sigK (CAC1689)
and CAC1770 (a sigK-like sigma factor), are expressed at very
low levels and two others, CAC1509 (annotated 'specialized
sigma subunit of RNA polymerase') and CAC1226 (one of two
annotated sigAs), are only above the expression cutoff in 8
out of 25 timepoints, and these timepoints are not
consecutively expressed. Among the expressed sigma factors,
six, CAP0157, CAP0167, CAC3267, CAC1766, CAC2052, and
CAC0550, are of unknown function, while the remaining
seven expressed sigma factors (σ
H
, σ
F
, σ
E
, σ
G
, σ
A
, σ
D
, and σ
54
/
rpoN) are of predicted known function. To assess the poten-
tial role of the remaining six sigma factors of unknown func-
tion, we examined the transcriptional profiles (Figure 6a,b)
and probed the binding motifs in their promoter regions for
predicted Spo0A, σ
A
, σ
E
, and σ
F
/σ
G
binding motifs [37].
Transcriptional analysis of the sigma factors of unknown function
Loss of pSOL1 impairs sporulation at the level of spo0A
expression [7,48], thus generating increased interest for
Expression profiles of uncharacterized sensory histidine kinases that could phosphorylate Spo0AFigure 5
Expression profiles of uncharacterized sensory histidine kinases that could phosphorylate Spo0A. Gene and operon profiles are ratios compared against
the first expressed timepoint. Gray bar indicates the onset of the transitional phase. (a) Activation of Spo0A as represented through the upregulation of
the sol operon (black filled diamonds; CAP0162-164) and the production of butanol (green crosses). Activation occurs before spo0A (red filled triangles)
reaches peak expression. (b) Expression of the orphan kinases CAC0323 (blue filled diamonds), CAC0437 (green filled triangles), and CAC0903 (red filled
circles) relative to the sol operon (black filled diamonds) (right-hand side vertical axis). (c) Expression of the orphan kinases CAC2730 (blue filled squares)
and CAC3319 (open red circles) relative to the sol operon (black filled diamonds) (right-hand side vertical axis). (d) Expression of the two-component
kinases CAC0225 (green filled circles), CAC0290 (red filled squares), and CAC0863 (open blue diamonds) relative to the sol operon (black filled
diamonds) (right-hand side vertical axis). (e) Expression of the two-component kinases CAC1582 (green filled squares), CAC2434 (open blue circles), and
CAC3430 (open red diamonds) relative to the sol operon (black filled diamonds) (right-hand side vertical axis). (f) Ranked expression intensities. White
denotes a rank of 1, while dark blue denotes a rank of 100 (see scale). Plot covers the entire timecourse, whereas the previous figures only covered the
first 14 hours. Gray squares indicate timepoints at which the intensity did not exceed the threshold value.
(a) (b) (c)
(d)
100
10
1
0.1
1,000
5101520
20
0
40
60
80
Expression ratio
Concentration (mM)
100
10
1
0.1
1,000
100
10
1
0.1
1,000
100
10
1
0.1
1,000
510
1
520
Time (h)
5 10 15 20 5 10 15 20
10
1
0.1
10
1
0.1
100
10
1
0.1
(e)
5101520
100
10
1
0.1
1,000
10
1
0.1
100
CAP0162 - adhE1
CAP0163 - crfA
CAP016
4 - ctfB
CAC2071 - spoA
CAC0323
CAC0437
CAC0903
CAC2730
CAC3319
CAC0225
CAC0290
CAC0863
CAC1582
CAC2434
CAC3430
sol expression
sol expression
Kinase expression
sol expression
sol expression
(f)
Time
61
01
82
6
3
4
44
66
Time (h)
sol operon
Orphan kinases
Two-component kinases
150100
Rank scale
Time (h)
Time (h)
Kinase expression
Kinase expression
Kinase expression
Genome Biology 2008, 9:R114
Genome Biology 2008, Volume 9, Issue 7, Article R114 Jones et al. R114.12
Expression profiles of sigma factors with unknown function and the effects of down-regulationFigure 6
Expression profiles of sigma factors with unknown function and the effects of down-regulation. (a) Expression profiles of CAC3267 (open triangles),
CAP0167 (filled squares), and CAP0157 (open circles) as ratios compared to the first expressed timepoint. Gray bar indicates the onset of transitional
phase. (b) Expression profiles of CAC0550 (filled circles), CAC2052 (open squares), and CAC1766 (filled triangles) as ratios compared to the first
expressed timepoint. Gray bar indicates the onset of transitional phase. (c) Ranked expression intensities of the sigma factors. White denotes a rank of 1,
while dark blue denotes a rank of 100 (see scale). Gray squares indicate timepoints at which the intensity did not exceed the threshold value. (d)
Microscopy time-course of asRNA strains compared to WT and plasmid control strains. Microscopy samples from WT (I) and pSOS95del (II) cultures (as
controls) and three asRNA strains taken for two timepoints over a course of 72 hours. At 72 hours, WT (I) and pSOS95del (II) exhibit the typical
clostridial forms (white arrows), while asCAP0166 (III) shows advanced differentiation with forespores and endospores (orange arrows) already visible.
Strains asCAP0166 (III), asCAP0167 (IV), and asCAC1766 (V) show a novel, extra-swollen clostridial form (yellow arrows).
(a)
(b)
Expression ratio
01224364860
01224364860
100
10
1
0.1
0.01
100
10
1
0.1
0.01
72 h48 h
CAC3267
CAP0167
CAP0157
CAC0550
CAC2052
CAC1766
Expression ratio
Time (h)
Time (h)
(c)
Time
(d)
I
II
III
IV
V
I
II
III
IV
V
1 50 100
Rank scale
6 101826344466
Time (h)
Genome Biology 2008, Volume 9, Issue 7, Article R114 Jones et al. R114.13
Genome Biology 2008, 9:R114
sigma factors located on the pSOL1 plasmid as these may play
a role in the regulation of sporulation. Two sigma factors,
CAP0157 and CAP0167, are located on pSOL1 and are anno-
tated as 'special sigma factor (σ
F
/σ
E
/σ
G
family)' and 'special-
ized sigma factor (σ
F
/σ
E
family)', respectively. It was
predicted that CAP0167 is putatively co-transcribed with
CAP0166 from a promoter of the σ
F
/σ
G
family [37] and it dis-
played an expression pattern similar to that of spo0A, consist-
ent with the computational prediction of an 0A box [29] and
two reverse 0A boxes in its promoter region (Figure 6a).
CAP0157 was expressed from an unidentified promoter late
in the timecourse (40+ hours) and thus may be involved in
late-stage sporulation, despite its low level of expression at
hour 20 (Figure 6a). CAC3267, putatively the fourth gene in
an operon starting with CAC3270 and ending with CAC3264
[37], was mainly expressed during early exponential growth
(Figure 6a), then decreased, and peaked again around 14
hours, after which expression decreased again. This pattern
of expression suggests that it plays a role in vegetative growth
and possibly early sporulation. CAC0550, putatively tran-
scribed from a σ
A
promoter as a single cistron [37], was
mainly transcribed early with its expression ending after 20-
24 hours (Figure 6b), suggesting that it is not involved in
sporulation. CAC1766, expressed from an unknown pro-
moter, displayed a unique pattern with a progressive buildup
starting around hours 8-12 and a distinct peak around hour
22 (Figure 6b). CAC2052 is annotated as 'DNA-dependent
RNA polymerase σ-subunit' and was putatively expressed
together with CAC2053, a hypothetical protein, from a σ
A
and/or a σ
F
/σ
G
promoter [37]. Our data suggest that it is
unlikely to be transcribed from a σ
F
/σ
G
promoter without any
other effectors, as their transcription peaked at hour 16, when
there was very little (if any) σ
F
or σ
G
activity (Figure 6b).
Phylogenetic tree comparison
To help determine a possible function for these sigma factors,
a phylogenetic tree was constructed of σ
70
sigma factors from
ten species, including B. subtilis and all sequenced clostridial
species. The resulting tree (Additional data file 6) contains
eleven major branches, and of these, seven can be definitively
classified based on known sigma factors within the branch.
These categories are extracytoplasmic function (ECF), sporu-
lation factors (sigF, sigE, and sigG), sigH, sigA (a basal sigma
factor), sigD (regulates chemotaxis and motility), and sigB (a
general response sigma factor). Two factors, CAC3267 and
CAC1766, fell within ECF branches. CAC3267 fell within an
ECF branch close to the B. subtilis σ
V
, a sigma factor of
unknown function, and σ
M
, a sigma factor essential for
growth and survival in high salt concentrations. CAC1766 fell
within a different ECF branch close to B. subtilis σ
Z
, a sigma
factor of unknown function, and CAC1509, a sigma factor
expressed for less than eight consecutive timepoints. The
remaining four factors fell within clusters with other clostrid-
ial sigma factors of unknown function, though several could
have possible ECF function.
Antisense RNA knock-down of four sigma factors: 'fat' clostridial
forms and enhanced glucose metabolism
Of the six expressed sigma factors of unknown function,
CAP0157, CAP0167, CAC2052, and CAC1766 were chosen for
further study because the timing and shape of their expres-
sion patterns suggested potential involvement in sporulation
and/or solventogenesis. Since the two processes are coupled,
phenotypic changes in differentiation may affect solvent pro-
duction, as has been previously observed [4,6,29,33,49].
Antisense RNA (asRNA) knock-down was chosen over knock-
ing out the genes, because knockouts are still extremely
difficult to produce in this and all other clostridia. Indeed, to
date, only a handful of knockouts have been created [29,50-
53], and these have only been achieved after screening thou-
sands of transformants [51-53]. Recently, a group II intron
system has been developed for clostridia [54], but this system
was not yet available when these experiments were carried
out. In contrast, asRNA is relatively quick, has been shown to
reduce gene expression by up to 90% [33,55,56] and has been
used to knock-down a large number of genes with a high level
of specificity [33,49,55-59]. asRNA constructs (see Additional
data file 7 for specific sequences used) were designed against
CAP0157, CAP0167, CAC2052, and CAC1766 along with
CAC2053 and CAP0166, the first genes in the operons
predicted to contain CAC2052 and CAP0167, respectively
[37]. Cultures of these strains were examined and compared
against the wild type (WT) and plasmid control strain
824(pSOS95del) for cell morphology differences and meta-
bolic changes.
Microscopy results from the asRNA-strain cultures revealed
both novel morphologies and apparently altered differentia-
tion (Figure 6d). Most notable were changes in strains
asCAP0166, asCAP0167 and asCAC1766. Typical WT cultures
display a predominately vegetative, symmetrically dividing
population through 72 hours as evidenced by the thin, rod-
shaped, phase dark cells (Figure 6d, I). By 72 hours, WT cul-
tures exhibited only a small percentage of swollen, cigar-
shaped clostridial forms and then a proportional population
of free spores by 96 hours.
pSOS95del cultures exhibited clostridial forms by 48 hours,
suggesting an accelerated differentiation compared to WT, as
has been seen before in our laboratory (Figure 6d, II). More-
over, a greater percentage of clostridial forms and free spores
compared to WT were observed at 72 and 96 hours, respec-
tively. asCAP0166 cultures generated a large percentage of
clostridial forms and endospores/free spores by hours 48 and
72, respectively (Figure 6d, III). This differentiation is accel-
erated in comparison to pSOS95del. By hour 96, asCAP0166
cultures exhibited predominately vegetative cells apparently
derived from germinated spores (data not shown).
asCAP0167 cultures also exhibited accelerated differentiation
and displayed a novel (to our knowledge) form of cellular
morphology that was most profoundly observable at 72 hours
(Figure 6d, IV). This novel morphology has qualities of an
Genome Biology 2008, 9:R114
Genome Biology 2008, Volume 9, Issue 7, Article R114 Jones et al. R114.14
excessively swollen clostridial cigar-form (which makes them
look much shorter than normal clostridial forms), with what
appears to be endospore formation occurring, but without the
associated phase bright characteristics seen in the 72 hour
asCAP0166 cultures. The asCAP0166 culture displayed cells
in this novel morphological state as well, but to a lesser
extent, although it is possible that because of its faster sporu-
lation, such cell forms appeared prior to 72 hours. The
asCAC1766 cultures also exhibited altered differentiation;
most importantly, at 72 hours the majority of the cells exhib-
ited a very swollen clostridial-form morphology similar to
that in the asCAP0167 cultures at 72 hours, but slightly more
elongated (Figure 6d, V).
To further characterize this novel cell form, transmission
electron microscopy (TEM) and scanning electron micros-
copy images of cells were taken for strains asCAP0167 and
asCAC1766. To determine morphological differences
involved in differentiation, the TEM images were compared
against cell images taken from the plasmid control strain
(Figure 7). For both asRNA strains, the very swollen cell
forms observed can be documented as approximately 2.5-4
μm long, and 1.1-1.3 μm in diameter, and should be compared
to control or WT swollen clostridial forms, which are 3.5-6
μm long and 0.8-1 μm in diameter. Forespore and endospore
forms of both asCAP0167 (Figure 7c,d) and asCAC1766
(Figure 7e,f) displayed a pinched end not seen in the plasmid
control (Figure 7b). A slight pinching is seen in the clostridial
forms of the plasmid control strain (Figure 7a), but this is
probably indicative that an asymmetric division is about to
occur. Rather, the pinched ends seen in the antisense strains
occur after asymmetric division and while the spore is devel-
oping within the mother cell. These pinched ends are also
noticeable in the scanning electron microscopy images (Fig-
ure 8). Though granulose is distinguishable in most of the
TEM images (Figure 7c,d,f), it is not the characteristic elec-
tron translucent seen in typical clostridial, forespore, and
endospore forms (Figure 7a,b). These differences were seen
throughout the culture and additional TEM images of both
the plasmid control and the antisense strains are included in
Additional data file 8.
Glucose, acetone, and butanol concentrations from two to
four biological replicates for each strain were averaged
together, and the results are shown in Table 1. We averaged
data from cultures that displayed similar characteristics;
most cultures did so despite the fact that each culture was
inoculated from a different colony for each strain. Acetone
and butanol levels were typical for WT and control cultures,
with the WT producing 90 mM of acetone and 150 mM of
butanol and the plasmid-control strain producing 80 mM of
acetone and 160 mM of butanol [60]. By 192 hours, all strains
had either produced comparable amounts of butanol to the
WT and the plasmid control strain or had somewhat outper-
formed these two strains. The most significant differences
were that all asRNA strains consumed higher levels of glucose
and also had a delayed metabolism in terms of product forma-
tion. These metabolic changes, although preliminary, are
consistent with and support the large changes in the kinetics
of sporulation observed by microscopy.
Conclusion
This detailed and previously unrevealed transcriptional road-
map has allowed for the first time a complete investigation of
the genetic events associated with clostridial differentiation.
We were able to link distinct and striking global
transcriptional changes to previously known important mor-
phological and physiological changes. To date, this is the most
complete genetic analysis of the different morphological
forms: vegetative, clostridial, and forespore/endospore.
Importantly, this analysis was performed on a mixed culture,
which may either dilute or produce noise in the data, but
investigation of the clusters identified revealed that these
clusters do capture important known processes. We were also
able to identify a cell population late in the timecourse similar
to vegetative cells. Visually, these late cells looked and acted
like vegetative cells, and transcriptionally, they were also
fairly similar. The major cell motility and chemotaxis genes
were upregulated both early and late in the timecourse
(Figure S2 in Additional data file 3), as were the ribosomal
proteins (Figure S12 in Additional data file 3). Also, the cell
division associated genes rodA, ftsE, and ftsX follow the same
transcriptional pattern of both early and late expression (Fig-
ure S11 in Additional data file 3). Although, these cells stain
differently from the early vegetative cells, probably due to
changes in membrane structure in response to the presence of
solvents and do not produce detectable levels of acids or sol-
vents, we believe these cells are germinated cells from spores
produced early in the timecourse. While the triggers for both
sporulation and germination are not known [1], the culture
late in the timecourse is less acidic because of the acid reas-
similation, and pH has been shown to be a trigger for sporu-
lation [21].
This study has also allowed the first full comparison to the
widely studied B. subtilis sporulation program. We have con-
fidently identified the temporal orchestration of all known
sporulation-related transcription factors and conclude the
Bacillus model generally holds true with the cascade pro-
gressing in the following manner: σ
H
, Spo0A, σ
F
, σ
E
, and σ
G
(Figure 4f). In addition, we can conclude that the major acti-
vating/processing proteins involved in sigma factor activa-
tion in B. subtilis play a similar role in C. acetobutylicum,
though additional investigation is needed to clarify their role.
Of significance is the lack of sigK signal. The genes responsi-
ble for transcribing sigK in B. subtilis, sigE and spoIIID, were
expressed, but the putative processing enzyme spoIVFB was
not. Two genes under the control of σ
K
in B. subtilis were
expressed, but their expression patterns are not consistent
with each other. Based on the expression pattern of yabG, it
Genome Biology 2008, Volume 9, Issue 7, Article R114 Jones et al. R114.15
Genome Biology 2008, 9:R114
Figure 7
TEM images of the novel cell forms. (a-b) TEM images of the plasmid control strain pSOS95del: typical elongated clostridial form with electron translucent
granulose (a); typical endospore form with a developing endospore at one end of the cell and electron translucent granulose still visible at the other end of
the cell (b). (c-d) TEM images of the antisense strain asCAP0167. (e-f) TEM images of the antisense strain asCAC1766. Red arrows in (c-f) indicate
pinched portions of the cell membrane not seen in the control strain and are characteristic of this novel cell type. Also noticeable is the electron dense
granulose in the antisense strains, in contrast to the electron translucent granulose in the control samples.
(a)
(c)
(b)
(e)
(d)
(f)
1,000 nm 1,000 nm
1,000 nm 1,000 nm
1,000 nm 1,000 nm
Genome Biology 2008, 9:R114
Genome Biology 2008, Volume 9, Issue 7, Article R114 Jones et al. R114.16
could be controlled by σ
E
, while the late expression of spsF
could be an indication of σ
K
activity.
Finally, in order to determine if one of the annotated sigma
factors of unknown function could be a sigK-like gene, we
first investigated their transcriptional profiles. CAP0157 was
a possible candidate with its upregulation late in the time-
course, as was CAC1766 since its expression was sustained
throughout the stationary phase (Figure 6a,b). Neither of
these genes, nor any of the other sigma factors of unknown
function, clustered close to the known sporulation-related
sigma factors on the phylogenetic tree (Additional data file 6),
but when downregulated using asRNA, both CAC1766 and the
CAP0167 operon (CAP0166 and CAP0167) displayed altered
differentiation (Figures 6d, 7 and 8). Though involved in dif-
ferentiation, the exact role of these two sigma factors is diffi-
cult to assess because of the incomplete silencing of the genes
through asRNA downregulation. Mature free spores and typ-
ical endospore forms without a pinched end are still seen
(data not shown), but whether these develop from the novel
cell types or from cells not affected by the antisense cannot be
determined. Interestingly, both CAP0167 and CAC1766 clus-
tered together with other clostridial sigma factors and closer
to ECF sigma factors than to the major sporulation sigma fac-
tors sigF, sigE, and sigG (Additional data file 6). In B. subtilis,
ECF sigma factors do not play a role in differentiation [61,62],
though a triple mutant in sigM, sigW, and sigX did display
altered phenotypes [62]. The fact that CAC1766 and CAP0167
appear to affect the developmental process of sporulation
(Figures 7 and 8; Additional data file 8) suggests either that
ECF factors may play a role in sporulation in clostridia or that
a novel category of sigma factors exist in clostridia that play a
role in sporulation.
Materials and methods
Fermentation analysis
Two cultures of C. acetobutylicum ATCC 824 were grown in
pH controlled (pH >5) bioreactors (Bioflow II and 110, New
Brunswick Scientific, Edison, NJ, USA) [7]. Cell density, sub-
strate and product concentrations were analyzed as described
[56].
RNA isolation and cDNA labeling
Samples were collected by centrifuging 3-10 ml of culture at
5,000×g for 10 minutes, 4°C and storing the cell pellets at -
85°C. Prior to RNA isolation, cells were washed in 1 ml SET
buffer (25% sucrose, 50 mM EDTA [pH 8.0], and 50 mM
Tris-HCl [pH 8.0]) and centrifuged at 5,000×g for 10 min-
utes, 4°C. Pellets were processed similarly to [7] but with the
noted modifications. Cells were lysed by resuspending in 220
μl SET buffer with 20 mg/ml lysozyme (Sigma, St. Louis, MO,
USA) and 4.55 U/ml proteinase K (Roche, Indianapolis, IN,
USA) and incubated at room temperature for 6 minutes. Fol-
lowing incubation, 40 mg of acid-washed glass beads (≤106
μm; Sigma) were added to the solution, and the mixture was
continuously vortexed for 4 minutes at room temperature.
Immediately afterwards, 1 ml of ice cold TRIzol (Invitrogen,
Carlsbad, CA, USA) was added; 500 μl of sample was diluted
with an equal volume of ice cold TRIzol and purified. Follow-
ing dilution, 200 μl of ice cold chloroform was added to each
sample, mixed vigorously for 15 s, and incubated at room
temperature for 3 minutes. Samples were then centrifuged at
12,000 rpm in a tabletop microcentrifuge for 15 minutes at
4°C. The upper phase was saved and diluted by adding 500 μl
of 70% ethanol. Samples were then applied to the RNeasy
Mini Kit (Qiagen, Valencia, CA, USA), following the manufac-
turer's instructions. To minimize genomic DNA contamina-
tion, samples were incubated with the RW1 buffer at room
temperature for 4 minutes. The method disrupted all cell
types equally, as evidenced by microscopy (data not shown).
cDNA was generated and labeled as described [7]. The refer-
Table 1
Concentrations of glucose, acetone, and butanol for asRNA strains
96 hours 144 hours 192 hours*
Sample Glucose
†
Acetone
†
Butanol
†
Glucose
†
Acetone
†
Butanol
†
Glucose
†
Acetone
†
Butanol
†
Wild type 165 91 157 143 74 157 120 61 162
pSOS95del
‡
264 57 97 136 83 169 125 57 158
asCAC1766 274 67 84 118 123 169 114 97 163
asCAC2052 294 49 69 191 84 122 116 92 154
asCAC2053 285 54 77 158 94 142 94 88 161
asCAP0157 314 49 63 198 91 122 96 111 174
asCAP0166 290 55 77 118 125 167 77 91 176
asCAP0167 294 54 73 78 125 180 56 98 185
*At 192 hours, significant amounts of acetone had evaporated along with small amounts of butanol. However, the cultures were still metabolically
active, as indicated by the decreased amounts of glucose and increased amounts of butanol.
†
Concentrations are mM.
‡
pSOS95del was used as a
plasmid control strain.
Genome Biology 2008, Volume 9, Issue 7, Article R114 Jones et al. R114.17
Genome Biology 2008, 9:R114
ence RNA pool contained 25 μg of RNA from samples taken
from the same culture at 8, 10, 12, 14, 16, 18, 20, 22, 24, 26,
28, 30, 32, 34, 36, 38, 40, 44, 48, 54, 58, and 66 h.
Microarray analysis
Agilent technology 22k arrays, (GEO accession number
GPL4412) as described in [63], were hybridized, washed, and
scanned per Agilent's recommendations. Spot quantification
employed Agilent's eXtended Dynamic Range technique with
Scanning electron microscopy (SEM) images of the novel cell formsFigure 8
Scanning electron microscopy (SEM) images of the novel cell forms. SEM images of the antisense strains (a-c) asCAP0167 and (d-f) asCAC1766. Red
arrows in indicate pinched portions of the cell membrane not seen in the control strain and are characteristic of this novel cell type.
(a)
(c)
(b)
(e)
(d)
(f)
2.50 µm 5.00 µm
2.50 µm 2.50 µm
2.50 µm 2.50 µm
Genome Biology 2008, 9:R114
Genome Biology 2008, Volume 9, Issue 7, Article R114 Jones et al. R114.18
gains of 100% and 10% (Agilent's Feature Extraction software
(v. 9.1)). Normalization and slide averaging was carried out as
described [7,63]. A minimum intensity of 50 intensity units
was used as described [63]. Microarray data have been depos-
ited in the Gene Expression Omnibus database under acces-
sion number GSE6094. To gain a qualitative measure of the
abundance of an mRNA transcript, the averaged normalized
log mean intensity values were ranked on a scale of 1 (lowest
intensity value) to 100 (highest intensity value). Genes were
clustered using TIGR's MEV program [64].
Quantitative RT-PCR
Q-RT-PCR was performed as described [48]. Specific primer
sequences are included in Additional data file 9; CAC3571 was
used as the housekeeping gene.
Microscopy
For light microscopy, samples were stored at -85°C after 15%
glycerol was added to the sampled culture. Samples were then
pelleted, washed twice with 1% w/v NaCl and fixed using 50
μl of 0.05% HCl/0.5% NaCl solution to a final count of 10
6
cells/μl. Slides were imaged using a Leica widefield
microscope with either phase contrast or Syto-9 and PI dyes
(Invitrogen LIVE/DEAD BacLight Kit) to distinguish cell
morphology.
For electron microscopy, samples were fixed by addition of
16% paraformaldehyde and 8% glutaraldehyde to the culture
medium for a final concentration of 2% paraformaldehyde
and 2% glutaraldehyde. For cultures grown on plates, colo-
nies were scraped from the agar and suspended in 2% para-
formaldehyde and 2% glutaraldehyde in 0.1 M sodium
cacodylate buffer (pH 7.4). Cultures were fixed for 1 h at room
temperature, pelleted and resuspended in buffer.
For transmission electron microscopy, bacteria were pelleted,
embedded in 4% agar and cut into 1 mm × 1 mm cubes. The
samples were washed three times for 15 minutes in 0.1 M
sodium cacodylate buffer (pH 7.4), fixed in 1% osmium
tetroxide in buffer for 2 h, and then washed extensively with
buffer and double de-ionized water. Following dehydration in
an ascending series of ethanol (25, 50, 75, 95, 100, 100%; 15
minutes each), the samples were infiltrated with Embed-812
resin in 100% ethanol (1:3, 1:2, 1:1, 2:1, 3:1; 1 h each) and then
several changes in 100% resin. After an overnight infiltration
in 100% resin, the samples were embedded in BEEM capsules
and polymerized at 65°C for 48 h. Blocks were sectioned on a
Reichert-Jung UltracutE ultramicrotome and ultrathin sec-
tions were collected onto formvar-carbon coated copper
grids. Sections were stained with methanolic uranyl acetate
and Reynolds' lead citrate [65] and viewed on a Zeiss CEM
902 transmission electron microscope at 80 kV. Images were
recorded with an Olympus Soft Imaging System GmbH Meg-
aview II digital camera. Brightness levels were adjusted in the
images so that the background between images appeared
similar.
For scanning electron microscopy, fixed samples were incu-
bated on poly-L-lysine coated silica wafers for 1 h and then
rinsed three times for 15 minutes in 0.1 M sodium cacodylate
buffer (pH 7.4). The samples were fixed with 1% osmium
tetroxide in buffer for 2 h, washed in buffer and double de-
ionized water, and then dehydrated in ethanol (25, 50, 75, 95,
100, 100%; 15 minutes each). The wafers were critical point
dried in an Autosamdri 815B critical point drier and mounted
onto aluminum stubs with silver paint. The samples were
coated with Au/Pd with a Denton Bench Top Turbo III sput-
ter-coater and viewed with a Hitachi 4700 FESEM at 3.0 kV.
Phylogenetic tree generation
Based on the genome annotations available at NCBI, we con-
sidered any sigma factor that was annotated as σ
70
or unanno-
tated. A second filter was applied by requiring that all the
sequences should contain a Region 2, the most conserved
region of the σ
70
protein. All members of this class of sigma
factor contain Region 2, and it was modeled with the HMM
pfam04542. This criterion removed CAC0550, CAC1766 and
CAP0157, but they were added to the list again despite their
lack of a Region 2. The alignment was made using ClustalW
1.83 using the default settings and visualized as a radial tree
as created by Phylodraw v. 0.8 from Pusan National
University.
Generation and characterization of antisense strains
Oligonucleotides were designed to produce asRNA comple-
mentary to the upstream 20 bp and first 30-40 bp of the tar-
geted genes' transcripts (Additional data file 7). The
constructs were cloned into pSOS95del under the control of a
thiolase (thl) promoter and confirmed by restriction digest.
Plasmids were then methylated and transformed into C. ace-
tobutylicum ATCC 824, as previously described [33,55,56].
Strains were grown in 10 ml cultures and characterized using
microscopy and HPLC to analyze final product concentra-
tions [56].
Abbreviations
asRNA, antisense RNA; COG, Cluster of Orthologous Groups;
ECF, extracytoplasmic function; PI, propidium iodide; Q-RT-
PCR, quantitative reverse transcription PCR; TEM, transmis-
sion electron microscopy; WT, wild type.
Authors' contributions
SWJ carried out the microarray experiments, helped with the
electron microscopy, helped analyze the data, and drafted
and finalized the manuscript. CJP designed the microarray
platform used, helped with the bioinformatic tools used in the
analysis, and drafted parts of the manuscript. BT carried out
all the microscopy except the electron microscopy and gener-
ated the antisense RNA strains. NC carried out the microar-
ray experiments and helped with the generation of the
antisense strains. RS helped design the microarray experi-
Genome Biology 2008, Volume 9, Issue 7, Article R114 Jones et al. R114.19
Genome Biology 2008, 9:R114
ments, carried out the Q-RT-PCR experiments, helped ana-
lyze the data, and drafted parts of the manuscript. RSS helped
with the bioinformatic tools used in the analysis. ETP helped
in the design of all the experiments, the analysis and interpre-
tation of the data, and helped in the organization, draft and
editing of the manuscript. All authors read and approved the
final manuscript.
Additional data files
The following additional data are available. Additional data
file 1 is a figure comparing the present microarray study to an
earlier microarray study that examined the early sporulation
of C. acetobutylicum followed by a brief discussion. Addi-
tional data file 2 contains tables detailing the COG analysis for
each cluster and all the genes placed in each cluster. Addi-
tional data file 3 contains figures of the transcriptional pro-
files, in terms of both intensity and differential expression, of
specific gene clusters with brief discussions following several
figures. Additional data file 4 is a composite figure showing
the individual expression profiles of the genes that were
standardized and averaged and is followed by a brief
discussion on how the genes used to construct the deduced
activity plots were chosen. Additional data file 5 is a figure
showing the differential expression and intensity of all anno-
tated histidine kinases and response regulators. Additional
data file 6 is a figure showing the phylogenetic tree resulting
from the alignment of the σ
70
-related and unannotated sigma
factors from ten bacterial species. Additional data file 7 is a
table listing the sequences for each asRNA construct. Addi-
tional data file 8 contains figures showing additional TEM
images of the plasmid control strain, asCAP0167, and
asCAC1766. Additional data file 9 is a table listing the primer
sequences used in the Q-RT-PCR experiments.
Additional data file 1Comparison of the present microarray study to an earlier microar-ray study that examined the early sporulation of C. acetobutylicumComparison of the present microarray study to an earlier microar-ray study that examined the early sporulation of C. acetobutylicum.Click here for fileAdditional data file 2COG analysis for each cluster and all the genes placed in each clusterCOG analysis for each cluster and all the genes placed in each cluster.Click here for fileAdditional data file 3Transcriptional profiles, in terms of both intensity and differential expression, of specific gene clustersTranscriptional profiles, in terms of both intensity and differential expression, of specific gene clusters.Click here for fileAdditional data file 4Profiles of the genes that were standardized and averagedIncludes a brief discussion on how the genes used to construct the deduced activity plots were chosen.Click here for fileAdditional data file 5Differential expression and intensity of all annotated histidine kinases and response regulatorsDifferential expression and intensity of all annotated histidine kinases and response regulators.Click here for fileAdditional data file 6Phylogenetic tree resulting from the alignment of the σ
70
-related and unannotated sigma factors from ten bacterial speciesPhylogenetic tree resulting from the alignment of the σ
70
-related and unannotated sigma factors from ten bacterial species.Click here for fileAdditional data file 7Sequences for each asRNA constructSequences for each asRNA construct.Click here for fileAdditional data file 8TEM images of the plasmid control strain, asCAP0167, and asCAC1766TEM images of the plasmid control strain, asCAP0167, and asCAC1766.Click here for fileAdditional data file 9Primer sequences used in the Q-RT-PCR experimentsPrimer sequences used in the Q-RT-PCR experiments.Click here for file
Acknowledgements
We acknowledge the use of the Northwestern University Keck Biophysics
Facility, the Northwestern University Biological Imaging Facility for the light
microscopy, and Shannon Modla in the Delaware Biotechnology Institute
Bio-Imaging Facility for the electron microscopy. Supported by NSF grant
(BES-0418157) and an NIH/NIGMS Biotechnology Training grant (T32-
GM08449) fellowship for Bryan Tracy.
References
1. Paredes CJ, Alsaker KV, Papoutsakis ET: A comparative genomic
view of clostridial sporulation and physiology. Nat Rev Microbiol
2005, 3:969-978.
2. Demain AL, Newcomb M, Wu JH: Cellulase, clostridia, and
ethanol. Microbiol Mol Biol Rev 2005, 69:124-154.
3. Woods DR: The genetic engineering of microbial solvent
production. Trends Biotechnol 1995, 13:259-264.
4. Alsaker KV, Spitzer TR, Papoutsakis ET: Transcriptional analysis
of spo0A overexpression in Clostridium acetobutylicum and its
effect on the cell's response to butanol stress. J Bacteriol 2004,
186:1959-1971.
5. Tomas CA, Beamish J, Papoutsakis ET: Transcriptional analysis of
butanol stress and tolerance in Clostridium acetobutylicum. J
Bacteriol 2004, 186:2006-2018.
6. Zhao Y, Tomas CA, Rudolph FB, Papoutsakis ET, Bennett GN: Intra-
cellular butyryl phosphate and acetyl phosphate concentra-
tions in Clostridium acetobutylicum and their implications for
solvent formation. Appl Environ Microbiol 2005, 71:530-537.
7. Alsaker KV, Papoutsakis ET: Transcriptional program of early
sporulation and stationary-phase events in Clostridium
acetobutylicum. J Bacteriol 2005, 187:7103-7118.
8. Jones DT, Westhuizen A van der, Long S, Allcock ER, Reid SJ, Woods
DR: Solvent production and morphological changes in
Clostridium acetobutylicum. Appl Environ Microbiol 1982,
43:1434-1439.
9. Long S, Jones DT, Woods DR: Sporulation of Clostridium aceto-
butylicum P262 in a defined medium. Appl Environ Microbiol 1983,
45:1389-1393.
10. Comas-Riu J, Vives-Rego J: Cytometric monitoring of growth,
sporogenesis and spore cell sorting in Paenibacillus polymyxa
(formerly Bacillus polymyxa).
J Appl Microbiol 2002, 92:475-481.
11. Yang H, Haddad H, Tomas C, Alsaker K, Papoutsakis ET: A segmen-
tal nearest neighbor normalization and gene identification
method gives superior results for DNA-array analysis. Proc
Natl Acad Sci USA 2003, 100:1122-1127.
12. Tatusov RL, Galperin MY, Natale DA, Koonin EV: The COG data-
base: a tool for genome-scale analysis of protein functions
and evolution. Nucleic Acids Res 2000, 28:33-36.
13. Nölling J, Breton G, Omelchenko MV, Makarova KS, Zeng Q, Gibson
R, Lee HM, Dubois J, Qiu D, Hitti J, GTC Sequencing Center Produc-
tion, Finishing, and Bioinformatics Teams, Wolf YI, Tatusov RL,
Sabathe F, Doucette-Stamm L, Soucaille P, Daly MJ, Bennett GN,
Koonin EV, Smith DR: Genome sequence and comparative
analysis of the solvent-producing bacterium Clostridium
acetobutylicum. J Bacteriol 2001, 183:4823-4838.
14. Lyristis M, Boynton ZL, Petersen D, Kan Z, Bennett GN, Rudolph FB:
Cloning, sequencing, and characterization of the gene
encoding flagellin, flaC, and the post-translational modifica-
tion of flagellin, FlaC, from Clostridium acetobutylicum
ATCC824. Anaerobe 2000, 6:69-79.
15. Welch M, Oosawa K, Aizawa SI, Eisenbach M: Effects of phospho-
rylation, Mg2+, and conformation of the chemotaxis protein
CheY on its binding to the flagellar switch protein FliM. Bio-
chemistry 1994, 33:10470-10476.
16. Baer SH, Blaschek HP, Smith TL: Effect of butanol challenge and
temperature on lipid composition and membrane fluidity of
butanol-tolerant Clostridium acetobutylicum. Appl Environ
Microbiol 1987, 53:2854-2861.
17. Lepage C, Fayolle F, Hermann M, Vandecasteele J-P: Changes in
membrane lipid composition of Clostridium acetobutylicum
during acetone-butanol fermentation: effects of solvents,
growth temperature and pH. J Gen Microbiol 1987, 133:103-110.
18. Vollherbst-Schneck K, Sands JA, Montenecourt BS: Effect of buta-
nol on lipid composition and fluidity of Clostridium aceto-
butylicum ATCC 824. Appl Environ Microbiol 1984,
47:193-194.
19. Zhao Y, Hindorff LA, Chuang A, Monroe-Augustus M, Lyristis M, Har-
rison ML, Rudolph FB, Bennett GN: Expression of a cloned cyclo-
propane fatty acid synthase gene reduces solvent formation
in Clostridium acetobutylicum ATCC 824. Appl Environ Microbiol
2003, 69:2831-2841.
20. Peguin S, Soucaille P: Modulation of carbon and electron flow in
Clostridium acetobutylicum by iron limitation and methyl vio-
logen addition. Appl Environ Microbiol 1995, 61:403-405.
21. Jones DT, Woods DR: Acetone-butanol fermentation
revisited. Microbiol Rev 1986, 50:484-524.
22. Cornillot E, Nair RV, Papoutsakis ET, Soucaille P: The genes for
butanol and acetone formation in Clostridium acetobutylicum
ATCC 824 reside on a large plasmid whose loss leads to
degeneration of the strain. J Bacteriol 1997, 179:5442-5447.
23. Schaffer S, Isci N, Zickner B, Dürre P: Changes in protein
synthesis and identification of proteins specifically induced
during solventogenesis in Clostridium acetobutylicum. Electro-
phoresis 2002, 23:110-121.
24. Mansilla MC, Cybulski LE, Albanesi D, de Mendoza D: Control of
membrane lipid fluidity by molecular thermosensors. J
Bacteriol 2004, 186:6681-6688.
25. Kaan T, Homuth G, Mader U, Bandow J, Schweder T: Genome-
wide transcriptional profiling of the Bacillus subtilis cold-
shock response. Microbiology 2002, 148:3441-3455.
26. Johnston NC, Goldfine H: Lipid composition in the classification
of the butyric acid-producing clostridia. J Gen Microbiol 1983,
129:1075-1081.
27. Burbulys D, Trach KA, Hoch JA: Initiation of sporulation in B.
subtilis is controlled by a multicomponent phosphorelay. Cell
Genome Biology 2008, 9:R114
Genome Biology 2008, Volume 9, Issue 7, Article R114 Jones et al. R114.20
1991, 64:545-552.
28. Stragier P, Losick R: Molecular genetics of sporulation in Bacil-
lus subtilis. Annu Rev Genet 1996, 30:297-241.
29. Harris LM, Welker NE, Papoutsakis ET: Northern, morphological,
and fermentation analysis of spo0A inactivation and overex-
pression in Clostridium acetobutylicum ATCC 824. J Bacteriol
2002, 184:3586-3597.
30. Molle V, Fujita M, Jensen ST, Eichenberger P, Gonzalez-Pastor JE, Liu
JS, Losick R: The Spo0A regulon of Bacillus subtilis. Mol Microbiol
2003, 50:1683-1701.
31. Cervin MA, Lewis RJ, Brannigan JA, Spiegelman GB: The Bacillus
subtilis regulator SinR inhibits spoIIG promoter transcription
in vitro without displacing RNA polymerase. Nucleic Acids Res
1998, 26:3806-3812.
32. Mandic-Mulec I, Doukhan L, Smith I: The Bacillus subtilis SinR pro-
tein is a repressor of the key sporulation gene spo0A. J
Bacteriol 1995, 177:4619-4627.
33. Scotcher MC, Rudolph FB, Bennett GN: Expression of abrB310
and sinR, and effects of decreased abrB310 expression on the
transition from acidogenesis to solventogenesis, in Clostrid-
ium acetobutylicum ATCC 824. Appl Environ Microbiol 2005,
71:1987-1995.
34. Perego M, Spiegelman GB, Hoch JA: Structure of the gene for the
transition state regulator, abrB: regulator synthesis is con-
trolled by the
spo0A sporulation gene in Bacillus subtilis. Mol
Microbiol 1988, 2:689-699.
35. Chary VK, Meloni M, Hilbert DW, Piggot PJ: Control of the expres-
sion and compartmentalization of (sigma)G activity during
sporulation of Bacillus subtilis by regulators of (sigma)F and
(sigma)E. J Bacteriol 2005, 187:6832-6840.
36. Sun DX, Cabrera-Martinez RM, Setlow P: Control of transcription
of the Bacillus subtilis spoIIIG gene, which codes for the fore-
spore-specific transcription factor sigma G. J Bacteriol 1991,
173:2977-2984.
37. Paredes CJ, Rigoutsos I, Papoutsakis ET: Transcriptional organiza-
tion of the Clostridium acetobutylicum genome. Nucleic Acids
Res 2004, 32:1973-1981.
38. Kroos L, Kunkel B, Losick R: Switch protein alters specificity of
RNA polymerase containing a compartment-specific sigma
factor. Science 1989, 243:526-529.
39. Stragier P, Kunkel B, Kroos L, Losick R: Chromosomal rearrange-
ment generating a composite gene for a developmental
transcription factor. Science 1989, 243:507-512.
40. Sauer U, Treuner A, Buchholz M, Santangelo JD, Dürre P: Sporula-
tion and primary sigma factor homologous genes in Clostrid-
ium acetobutylicum. J Bacteriol 1994, 176:6572-6582.
41. Santangelo JD, Kuhn A, Treuner-Lange A, Dürre P: Sporulation and
time course expression of sigma-factor homologous genes in
Clostridium acetobutylicum. FEMS Microbiol Lett 1998,
161:157-164.
42. Tatti KM, Jones CH, Moran CP Jr: Genetic evidence for interac-
tion of sigma E with the spoIIID promoter in Bacillus subtilis.
J Bacteriol 1991, 173:7828-7833.
43. Piggot PJ, Hilbert DW: Sporulation of Bacillus subtilis.
Curr Opin
Microbiol 2004, 7:579-586.
44. Wörner K, Szurmant H, Chiang C, Hoch JA: Phosphorylation and
functional analysis of the sporulation initiation factor Spo0A
from Clostridium botulinum. Mol Microbiol 2006, 59:1000-1012.
45. Jiang M, Shao W, Perego M, Hoch JA: Multiple histidine kinases
regulate entry into stationary phase and sporulation in Bacil-
lus subtilis. Mol Microbiol 2000, 38:535-542.
46. Dartois V, Djavakhishvili T, Hoch JA: Identification of a mem-
brane protein involved in activation of the KinB pathway to
sporulation in Bacillus subtilis. J Bacteriol 1996, 178:1178-1186.
47. LeDeaux JR, Grossman AD: Isolation and characterization of
kinC, a gene that encodes a sensor kinase homologous to the
sporulation sensor kinases KinA and KinB in Bacillus subtilis.
J Bacteriol 1995, 177:166-175.
48. Alsaker KV, Paredes CJ, Papoutsakis ET: Design, optimization and
validation of genomic DNA microarrays for examining the
Clostridium acetobutylicum transcriptome. Biotechnol Bioprocess
Eng 2005, 10:432-443.
49. Scotcher MC, Bennett GN: SpoIIE regulates sporulation but
does not directly affect solventogenesis in Clostridium aceto-
butylicum ATCC 824. J Bacteriol 2005, 187:1930-1936.
50. Green EM, Boynton ZL, Harris LM, Rudolph FB, Papoutsakis ET, Ben-
nett GN: Genetic manipulation of acid formation pathways by
gene inactivation in Clostridium acetobutylicum ATCC 824.
Microbiology 1996, 142:2079-2086.
51. Huang IH, Waters M, Grau RR, Sarker MR: Disruption of the gene
(spo0A) encoding sporulation transcription factor blocks
endospore formation and enterotoxin production in entero-
toxigenic Clostridium perfringens type A. FEMS Microbiol Lett
2004, 233:
233-240.
52. Raju D, Waters M, Setlow P, Sarker MR: Investigating the role of
small, acid-soluble spore proteins (SASPs) in the resistance
of Clostridium perfringens spores to heat. BMC Microbiol 2006,
6:50.
53. Sarker MR, Carman RJ, McClane BA: Inactivation of the gene
(cpe) encoding Clostridium perfringens enterotoxin elimi-
nates the ability of two cpe-positive C. perfringens type A
human gastrointestinal disease isolates to affect rabbit ileal
loops. Mol Microbiol 1999, 33:946-958.
54. Heap JT, Pennington OJ, Cartman ST, Carter GP, Minton NP: The
ClosTron: a universal gene knock-out system for the genus
Clostridium. J Microbiol Methods 2007, 70:452-464.
55. Desai RP, Papoutsakis ET: Antisense RNA strategies for meta-
bolic engineering of Clostridium acetobutylicum. Appl Environ
Microbiol 1999, 65:936-945.
56. Tummala SB, Welker NE, Papoutsakis ET: Design of antisense
RNA constructs for downregulation of the acetone forma-
tion pathway of Clostridium acetobutylicum. J Bacteriol 2003,
185:1923-1934.
57. Perret S, Maamar H, Belaich JP, Tardif C: Use of antisense RNA to
modify the composition of cellulosomes produced by
Clostridium cellulolyticum. Mol Microbiol 2004, 51:599-607.
58. Raju D, Setlow P, Sarker MR: Antisense-RNA-mediated
decreased synthesis of small, acid-soluble spore proteins
leads to decreased resistance of Clostridium perfringens
spores to moist heat and UV radiation. Appl Environ Microbiol
2007, 73:2048-2053.
59. Tummala SB, Junne SG, Papoutsakis ET: Antisense RNA downreg-
ulation of coenzyme A transferase combined with alcohol-
aldehyde dehydrogenase overexpression leads to predomi-
nantly alcohologenic Clostridium acetobutylicum fermenta-
tions. J Bacteriol 2003, 185:3644-3653.
60. Tomas CA, Welker NE, Papoutsakis ET: Overexpression of
groESL in Clostridium acetobutylicum results in increased sol-
vent production and tolerance, prolonged metabolism, and
changes in the cell's transcriptional program. Appl Environ
Microbiol 2003, 69:4951-4965.
61. Asai K, Ishiwata K, Matsuzaki K, Sadaie Y: A viable Bacillus subtilis
strain without functional extracytoplasmic function sigma
genes. J Bacteriol 2008, 190:2633-2636.
62. Mascher T, Hachmann AB, Helmann JD: Regulatory overlap and
functional redundancy among Bacillus subtilis extracytoplas-
mic function sigma factors. J Bacteriol 2007, 189:6919-6927.
63. Paredes CJ, Senger RS, Spath IS, Borden JR, Sillers R, Papoutsakis ET:
A general framework for designing and validating oligomer-
based DNA microarrays and its application to Clostridium
acetobutylicum. Appl Environ Microbiol 2007, 73:4631-4638.
64. Saeed AI, Sharov V, White J, Li J, Liang W, Bhagabati N, Braisted J,
Klapa M, Currier T, Thiagarajan M, Sturn A, Snuffin M, Rezantsev A,
Popov D, Ryltsov A, Kostukovich E, Borisovsky I, Liu Z, Vinsavich A,
Trush V, Quackenbush J: TM4: a free, open-source system for
microarray data management and analysis. Biotechniques 2003,
34:374-378.
65. Reynolds ES: The use of lead citrate at high pH as an electron-
opaque stain in electron microscopy. J Cell Biol 1963,
17:208-212.
66. Frey M: Hydrogenases: hydrogen-activating enzymes. Chembi-
ochem 2002, 3:153-160.
67. Gorwa MF, Croux C, Soucaille P: Molecular characterization and
transcriptional analysis of the putative hydrogenase gene of
Clostridium acetobutylicum ATCC 824. J Bacteriol 1996,
178:2668-2675.
68. Moir A, Corfe BM, Behravan J: Spore germination. Cell Mol Life Sci
2002, 59:403-409.
69. Igarashi T, Setlow P: Transcription of the
Bacillus subtilis gerK
operon, which encodes a spore germinant receptor, and
comparison with that of operons encoding other germinant
receptors. J Bacteriol 2006, 188:4131-4136.
70. Dürre P, Hollergschwandner C: Initiation of endospore forma-
tion in Clostridium acetobutylicum. Anaerobe 2004, 10:69-74.
71. Makino S, Moriyama R: Hydrolysis of cortex peptidoglycan dur-
ing bacterial spore germination. Med Sci Monit 2002,
Genome Biology 2008, Volume 9, Issue 7, Article R114 Jones et al. R114.21
Genome Biology 2008, 9:R114
8:RA119-127.
72. Ishikawa S, Yamane K, Sekiguchi J: Regulation and characteriza-
tion of a newly deduced cell wall hydrolase gene (cwlJ) which
affects germination of Bacillus subtilis spores. J Bacteriol 1998,
180:1375-1380.
73. Kodama T, Takamatsu H, Asai K, Kobayashi K, Ogasawara N, Watabe
K: The Bacillus subtilis yaaH gene is transcribed by SigE RNA
polymerase during sporulation, and its product is involved in
germination of spores. J Bacteriol 1999, 181:4584-4591.
74. Moriyama R, Fukuoka H, Miyata S, Kudoh S, Hattori A, Kozuka S, Yas-
uda Y, Tochikubo K, Makino S: Expression of a germination-spe-
cific amidase, SleB, of bacilli in the forespore compartment
of sporulating cells and its localization on the exterior side of
the cortex in dormant spores. J Bacteriol 1999, 181:2373-2378.
75. Setlow P: Mechanisms which contribute to the long-term sur-
vival of spores of Bacillus species. Soc Appl Bacteriol Symp Ser
1994, 23:49S-60S.
76. Bourne N, FitzJames PC, Aronson AI: Structural and germination
defects of Bacillus subtilis spores with altered contents of a
spore coat protein. J Bacteriol 1991, 173:6618-6625.
77. Roels S, Driks A, Losick R: Characterization of spoIVA, a sporu-
lation gene involved in coat morphogenesis in Bacillus
subtilis. J Bacteriol 1992, 174:575-585.
78. Takamatsu H, Imamura A, Kodama T, Asai K, Ogasawara N, Watabe
K: The yabG gene of Bacillus subtilis encodes a sporulation
specific protease which is involved in the processing of sev-
eral spore coat proteins.
FEMS Microbiol Lett 2000, 192:33-38.
79. Takamatsu H, Watabe K: Assembly and genetics of spore pro-
tective structures. Cell Mol Life Sci 2002, 59:434-444.
80. Driks A: Proteins of the spore core and coat. In Bacillus subtilis
and its Closest Relatives: From Genes to Cells Edited by: Sonenshein AL,
Hoch JA, Losick R. Washington, DC: American Society for
Microbiology; 2002:527-535.
81. Britton RA, Eichenberger P, Gonzalez-Pastor JE, Fawcett P, Monson
R, Losick R, Grossman AD: Genome-wide analysis of the sta-
tionary-phase sigma factor (sigma-H) regulon of Bacillus
subtilis. J Bacteriol 2002, 184:4881-4890.
82. Wang ST, Setlow B, Conlon EM, Lyon JL, Imamura D, Sato T, Setlow
P, Losick R, Eichenberger P: The forespore line of gene expres-
sion in Bacillus subtilis. J Mol Biol 2006, 358:16-37.
83. Eichenberger P, Fujita M, Jensen ST, Conlon EM, Rudner DZ, Wang
ST, Ferguson C, Haga K, Sato T, Liu JS, Losick R: The program of
gene transcription for a single differentiating cell type during
sporulation in Bacillus subtilis. PLoS Biol 2004, 2:e328.