Báo cáo y học: "Diarrhea as a cause of mortality in a mouse model of infectious colitis" ppt
Bạn đang xem bản rút gọn của tài liệu. Xem và tải ngay bản đầy đủ của tài liệu tại đây (1.21 MB, 19 trang )
Genome Biology 2008, 9:R122
Open Access
2008Borenshteinet al.Volume 9, Issue 8, Article R122
Research
Diarrhea as a cause of mortality in a mouse model of infectious
colitis
Diana Borenshtein
*
, Rebecca C Fry
*†¶
, Elizabeth B Groff
‡
,
Prashant R Nambiar
‡¥
, Vincent J Carey
§
, James G Fox
*†‡
and
David B Schauer
*†‡
Addresses:
*
Department of Biological Engineering, Massachusetts Institute of Technology, Massachusetts Avenue, Cambridge, MA 02139, USA.
†
Center of Environmental Health Sciences, Massachusetts Institute of Technology, Massachusetts Avenue, Cambridge, MA 02139, USA.
‡
Division of Comparative Medicine, Massachusetts Institute of Technology, Massachusetts Avenue, Cambridge, MA 02139, USA.
§
Harvard
Medical School, Longwood Avenue, Boston, MA 02115, USA.
¶
Current address: Department of Environmental Sciences and Engineering, The
University of North Carolina at Chapel Hill, Dauer Drive, Chapel Hill, NC 27599, USA.
¥
Current address: Genzyme Corporation, Mountain
Road, Framingham, MA 01701, USA.
Correspondence: David B Schauer. Email:
© 2008 Borenshtein et al.; licensee BioMed Central Ltd.
This is an open access article distributed under the terms of the Creative Commons Attribution License ( which
permits unrestricted use, distribution, and reproduction in any medium, provided the original work is properly cited.
Profiling diarrhea<p>Analysis of gene expression in the colons of <it>Citrobacter rodentium</it>-infected susceptible and resistant mice suggests that mor-tality is associated with impaired intestinal ion transport.</p>
Abstract
Background: Comparative characterization of genome-wide transcriptional changes during
infection can help elucidate the mechanisms underlying host susceptibility. In this study,
transcriptional profiling of the mouse colon was carried out in two cognate lines of mice that differ
in their response to Citrobacter rodentium infection; susceptible inbred FVB/N and resistant outbred
Swiss Webster mice. Gene expression in the distal colon was determined prior to infection, and at
four and nine days post-inoculation using a whole mouse genome Affymetrix array.
Results: Computational analysis identified 462 probe sets more than 2-fold differentially expressed
between uninoculated resistant and susceptible mice. In response to C. rodentium infection, 5,123
probe sets were differentially expressed in one or both lines of mice. Microarray data were
validated by quantitative real-time RT-PCR for 35 selected genes and were found to have a 94%
concordance rate. Transcripts represented by 1,547 probe sets were differentially expressed
between susceptible and resistant mice regardless of infection status, a host effect. Genes
associated with transport were over-represented to a greater extent than even immune response-
related genes. Electrolyte analysis revealed reduction in serum levels of chloride and sodium in
susceptible animals.
Conclusion: The results support the hypothesis that mortality in C. rodentium-infected susceptible
mice is associated with impaired intestinal ion transport and development of fatal fluid loss and
dehydration. These studies contribute to our understanding of the pathogenesis of C. rodentium and
suggest novel strategies for the prevention and treatment of diarrhea associated with intestinal
bacterial infections.
Published: 4 August 2008
Genome Biology 2008, 9:R122 (doi:10.1186/gb-2008-9-8-r122)
Received: 26 October 2007
Revised: 1 May 2008
Accepted: 4 August 2008
The electronic version of this article is the complete one and can be
found online at />Genome Biology 2008, 9:R122
Genome Biology 2008, Volume 9, Issue 8, Article R122 Borenshtein et al. R122.2
Background
Acute diarrheal illness is one of the most important health
problems in the world today, particularly in young children in
developing countries. This life-threatening illness occurs in
approximately four billion individuals per year and causes
more than two million deaths worldwide each year [1]. The
most common cause of diarrhea is gastrointestinal infection.
Infection results in increased intestinal secretion and/or
decreased intestinal absorption followed by fluid and electro-
lyte loss and dehydration that can be fatal if not treated [2,3].
Among the most important bacterial causes of diarrhea are
enteropathogenic and enterohaemorrhagic Escherichia coli
(EPEC and EHEC, respectively) [4]. These pathogens pro-
duce ultrastructural changes characterized by intimate bacte-
rial adhesion to the apical surface of enterocytes, effacement
of microvilli, and pedestal formation, which are called
'attaching and effacing' (A/E) lesions. The pathophysiology of
diarrhea due to infection with A/E pathogens is not well
understood. Proposed mechanisms include decreased
absorptive surface epithelium, disruption of tight junctions
and intestinal barrier function, impaired ion transport, and
induction of inflammation [5,6].
Citrobacter rodentium, a murine A/E pathogen, possesses
similar virulence factors as EPEC and EHEC, and produces
comparable ultrastructural changes in the distal colon of
infected mice (reviewed in [7,8]). Typically, this organism
causes severe, but self-limiting, epithelial hyperplasia with a
variable degree of inflammation in the distal colon of most
inbred and outbred lines of laboratory mice. Exceptions
include suckling animals or C3H substrains (independent of
toll-like receptor 4 status), which demonstrate 60-100% mor-
tality by approximately two weeks after infection with C.
rodentium [9-12]. We recently discovered that adult FVB/N
mice (FVB) are also extremely susceptible to C. rodentium
infection [13]. Inbred FVB mice are derived from outbred
Swiss Webster (SW) mice and, since SW are known to be
resistant, comparative studies between these cognate lines of
mice were performed. Twelve-week old FVB mice infected
with C. rodentium developed a high degree of mortality and
severe colitis compared with their outbred SW counterparts,
which had more typical subclinical disease in response to
infection. Differences in disease outcome were observed
despite comparable expression of tumor necrosis factor-α,
interferon-γ, and inducible nitric oxide synthase in suscepti-
ble and resistant animals. The results of our previous study
suggested that the cause of death in C. rodentium-infected
FVB mice was hypovolemia due to dehydration [13]. To char-
acterize the mechanistic basis for the striking difference in
disease outcome between two closely related lines of mice, we
used microarray analysis to determine global patterns of gene
expression in susceptible FVB and resistant SW mice infected
with C. rodentium. GeneChips
®
from Affymetrix were
employed to identify and quantify both host-dependent and
infection-dependent alterations in host gene expression;
results were confirmed by quantitative real-time PCR (qRT-
PCR), immunohistochemistry, and serology. We identified
predominant functional categories of differentially regulated
genes and potential candidates for susceptibility, both of
which have implications for future studies of C. rodentium
pathogenesis. Based on these findings, we propose testable
hypotheses about newly implicated host genes and their
potential role in the development of infectious colitis and
diarrhea.
Results
Infection of FVB and SW mice with C. rodentium
To characterize the differences in gene expression between
susceptible FVB and resistant SW mice, animals were ana-
lyzed before C. rodentium infection and at two different time
points post-inoculation. Time points were selected to reveal
differentially expressed genes prior to infection (uninocu-
lated), following establishment of infection but before the
development of disease (4 days post-inoculation (dpi)), and
after the development of colitis but before the development of
appreciable mortality (9 dpi). As expected, sham-dosed 12-
week old mice were found to be indistinguishable at 4 and 9
dpi; therefore, samples from these uninoculated control ani-
mals were combined and treated as a single group for each
line of mouse (experimental design is presented in Additional
data file 1).
Details of FVB susceptibility to C. rodentium infection were
previously reported [13]. Here, FVB and SW mice infected
with C. rodentium developed comparable alterations in body
weight, fecal bacterial shedding, and no appreciable colonic
lesions at 3-4 dpi (Figure 1). By 8 dpi, body weight gain was
not significantly different between infected and uninoculated
control SW mice (107.5 ± 2.0% and 106.3 ± 1.8% of initial
body weight, respectively; Figure 1a), whereas infected FVB
mice developed significant weight loss compared to uninocu-
lated controls (97.6 ± 2.2% and 103.4 ± 1.8%, respectively, p
< 0.05). Likewise, fecal bacterial shedding was higher in FVB
mice than in SW mice at 8 dpi (8.1 ± 0.2 versus 7.5 ± 0.2 log10
CFU/g feces, respectively, p < 0.05; Figure 1b). At 9 dpi, FVB
mice infected with C. rodentium had significant pathological
lesions, including colonic inflammation and hyperplasia (Fig-
ure 1c,d), and mild dysplasia (data not shown). Infected SW
mice developed comparable hyperplasia, but less inflamma-
tion and no dysplasia at 9 dpi (p < 0.0001). The median lesion
scores for infected versus control FVB mice were 2.5 versus 0
for inflammation, 2 versus 0 for hyperplasia, and 0.5 versus 0
for dysplasia. The median lesion scores for infected versus
control SW mice were 2 versus 0 for inflammation, 2 versus 0
for hyperplasia, and 0 versus 0 for dysplasia. Samples for
microarray analysis were selected based on the clinical signs,
infection status, and severity of lesions, and are shown in Fig-
ure 1.
Genome Biology 2008, Volume 9, Issue 8, Article R122 Borenshtein et al. R122.3
Genome Biology 2008, 9:R122
Gene expression analysis of FVB and SW mice during
C. rodentium infection
Transcriptional profiling was performed on RNA isolated
from full-thickness descending colon tissues. Differential
expression analysis of pairwise comparisons (see Material
and methods) identified 462 probe sets (1% of the total
number of probe sets) significantly different between SW and
FVB mice prior to infection (Figure 2a). In response to C.
rodentium inoculation, 5,123 probe sets (11.4%) were either
induced or repressed by more than two-fold in one or both of
the lines of mice. The number of significantly modulated
genes in response to infection was greater in susceptible FVB
mice than in resistant SW mice, particularly as disease pro-
gressed. Specifically, infected FVB mice had 2,195 and 3,297
differentially expressed probe sets at 4 and 9 dpi, respectively,
compared with uninoculated controls, whereas infected SW
mice had 1,798 and 1,945 differentially expressed probe sets
at 4 and 9 dpi, respectively, compared to uninoculated con-
trols (Figure 2a). Overall, alterations in 5,585 (12.4%) probe
sets were detected during the course of the experiment. Most
of the differences were within a ±7-fold range (Additional
data file 2).
Validation of microarray results by qRT-PCR
To confirm the results obtained with GeneChips
®
, quantita-
tive real-time fluorigenic RT-PCR (TaqMan) was performed
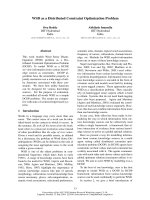
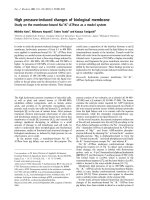
C. rodentium infection in adult susceptible inbred FVB mice and resistant outbred SW miceFigure 1
C. rodentium infection in adult susceptible inbred FVB mice and resistant outbred SW mice. (a) Significant weight loss was observed in infected FVB mice at
8 dpi (p < 0.05). Weight was normalized and expressed as percent change of initial baseline. Red and green indicate SW and FVB mice, respectively; open
and filled bars represent uninoculated and infected mice, respectively. Values are mean ± standard error of the mean. (b) Fecal bacterial counts were
similar in both lines of mice at 3 dpi, but FVB mice had higher bacterial shedding at 8 dpi (p < 0.05). Bacterial counts were log10 transformed. (c) FVB mice
infected with C. rodentium developed colonic inflammation that was significantly more severe than the milder colitis in SW mice at 9 dpi (p < 0.0001). (d)
Infected FVB and SW mice developed comparable hyperplasia at 9 dpi. Experimental groups included 20, 10, and 7 uninoculated control, 4 dpi, and 9 dpi
FVB mice, respectively, and 16, 10, and 10 SW mice in the corresponding groups. Each symbol represents one animal; filled symbols in red or green
represent SW or FVB mice selected for array analysis. Mean or median lines for each group are presented. *p < 0.05; **p < 0.01.
(a)
(c)
3 dpi
110
105
100
95
90
8 dpi
9
8
7
6
5
4
p < 0.0001
p < 0.0001
4
3
2
1
0
Body weight change
(% of initial weight)
(b)
(d)
Bacterial shedding
(log10 CFU/g feces)
Inflammation
1
0
4
3
2
Hyperplasia
*
*
*
SW 3 dpi
FVB 3 dpi
SW 8 dpi
FVB 8 dpi
SW control
FVB control
SW 4 dpi
FVB 4 dpi
SW 9 dpi
FVB 9 dpi
SW control
FVB control
SW 4 dpi
FVB 4 dpi
SW 9 dpi
FVB 9 dpi
**
Genome Biology 2008, 9:R122
Genome Biology 2008, Volume 9, Issue 8, Article R122 Borenshtein et al. R122.4
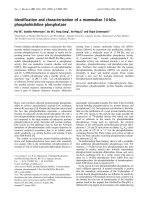
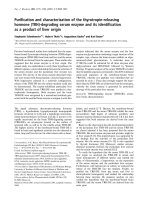
Figure 2
Differential expression of genes between and within the lines of mice prior to, and in response to, C. rodentium infection. (a) Summary of transcripts
differentially expressed in individual and combined comparisons. The analysis was performed using an Affymetrix whole mouse genome oligonucleotide
chip (430 2.0 Array), which contains >45,000 probe sets comprising expression levels of >39,000 transcripts and variants from >34,000 well-characterized
mouse genes. The normalization and processing of the results were performed using DNA-Chip Analyzer (dChip) software implementing model-based
expression analysis. One percent of the total probe sets presented on the array were more than two-fold differentially expressed between SW and FVB
mice prior to infection. In response to C. rodentium inoculation, 11.4% of the probe sets were either induced or repressed in one or both of the lines of
mice. There were more differentially expressed genes in response to infection in susceptible FVB mice than in resistant SW mice, especially as disease
progressed. Overall, alterations in 12.4% of the probe sets were detected throughout the experiment. (b) Validation of microarray results by qRT-PCR
(TaqMan) of selected genes. Transcript levels were normalized to the endogenous control GAPDH, and expressed as fold change compared with
untreated control FVB mice, which were set at 1, using the Comparative Ct method. The resultant log2 ratios were matched with corresponding log2
ratios detected in microarray analysis and subjected to Pearson correlation analysis. Significant correlation was observed between the two assays (Pearson
correlation coefficient r = 0.87, R
2
= 0.75, p < 0.0001). Pearson correlations for individual genes ranged from 0.67 to 1. Only two out of 35 examined
genes did not confirm the array results, yielding a predictability rate of 94%.
Comparisons
Number of
altered
probe sets
Strain - basal effect Sp versus Fp 462
Strain early infection response Si4 versus Fi4 557
Strain - late infection / inflammatory response Si9 versus Fi9 1,065
SW 4 dpi response compared with uninfected Si4 versus Sp 1,798
SW 9 dpi response compared with uninfected Si9 versus Sp 1,945
SW disease progression response 9 dpi
compared with 4 dpi Si9 versus Si4 901
FVB 4 dpi response compared with uninfected Fi4 versus Fp 2,195
FVB 9 dpi response compared with uninfected Fi9 versus Fp 3,297
FVB disease progression response 9 dpi
compared with 4 dpi Fi9 versus Fi4 1,506
Total
All combined
comparisons 5,585
(a)
(b)
Microarray ratios (log2)
-
Bivariate normal ellipse P = 0.99
Linear fit
-8 -7 -6 -5 -4 -3 -2 -1 0 1 2 3 4 5 6 7
qRT-PCR ratios (log2)
10
5
0
-5
-10
Genome Biology 2008, Volume 9, Issue 8, Article R122 Borenshtein et al. R122.5
Genome Biology 2008, 9:R122
for 35 selected genes. Correlation analysis was performed by
comparing expression ratios from microarray results versus
ratios determined by TaqMan analysis (Figure 2b). A signifi-
cant correlation was observed between the two assays (Pear-
son correlation coefficient r = 0.87, R
2
= 0.75, p < 0.0001).
Individual Pearson correlation coefficients ranged from 0.67
to 1 in all but 2 out of 35 genes (Crry and Slc10a2; Additional
data file 3). The overall concordance of the microarray results
with qRT-PCR was 94%, which compares favorably or even
exceeds that reported for data processing by dChip [14]. Side-
by-side comparisons of microarray and qRT-PCR results are
presented in Additional data file 4.
Analysis of genes differentially expressed between
susceptible and resistant mice (host effect)
To identify genes that were differentially expressed between
susceptible FVB mice and resistant SW mice as a function of
time during infection, comparative analysis of common and
unique genes modulated at individual time points was per-
formed (Sp versus Fp or Si4 versus Fi4 or Si9 versus Fi9; see
the 'Array design and hybridization' section in Materials and
methods for descriptions of the different groups). The results
presented in the Venn diagram in Figure 3a represent seven
subsets of differentially expressed genes between SW and
FVB mice. Overall, 1,547 probe sets (3.4%), were more than
two-fold differentially expressed between the two lines of
mice (a complete list of genes with host effect is presented in
Additional data file 5).
This set of genes was subjected to principal component anal-
ysis (PCA; Figure 3b; Additional data file 6), yielding robust
separation of SW and FVB mice for all time points in principal
component (PC)2. Consistent with their inbred strain back-
ground, there was tighter clustering of uninoculated control
FVB mice than uninoculated control outbred SW mice. PC1
yielded robust separation of infected from uninoculated con-
trol FVB mice, but was not able to discriminate infected from
uninoculated control SW mice. Thus, PC1 is composed of fac-
tors contributing to morbidity associated with infection. As
expected, similar results were obtained by hierarchical clus-
tering (Additional data file 7). Distinct branches for uninocu-
lated, 4 dpi, and 9 dpi FVB mice, along with robust separation
between uninoculated and infected SW mice, was in good
agreement with the results of PCA. Interestingly, PCA applied
on any of the individual subgroups presented in the Venn dia-
gram was not sufficient to clearly distinguish between exper-
imental groups (data not shown). This suggested that all 1,547
genes were required for reliable discrimination of mice by
host genetic background and infection status and, hence,
were called 'genes with host effect'.
To characterize these transcripts biologically, enrichment
analysis of genes with host effect by their functional annota-
tion with Gene Ontology (GO) was performed. Approximately
25% of these genes were assigned to the GO category 'trans-
port', making it one of the most prevalent categories. On the
other hand, only 11% of genes were assigned to the 'immune
response' category (Figure 3c). Similar results were obtained
when the most significantly differentially expressed genes
with host effect were analyzed (more than eight-fold differ-
ence, presented in Additional data files 8 and 9), which iden-
tified 'transporter activity' among the most significantly
enriched functional categories; using the hypergeometric test
for establishing a cutoff threshold revealed significant enrich-
ment (p < 0.05; Additional data file 10).
To identify host-dependent temporal changes upon infection,
an analysis was used that contrasts the magnitude of gene
expression induced upon infection in one line of mouse (ratio
relative to uninoculated) to changes induced upon infection
in the other line of mouse (ratio relative to uninoculated),
termed delta eta (Materials and methods). Out of 1,385 probe
sets detected by delta eta analysis (Additional data file 11),
468 were differentially expressed between the lines of mice at
4 dpi, 1,173 probe sets at 9 dpi, and 256 at both time points.
The most significant candidates differentially expressed by
more than 8-fold included 36 genes, the majority of which
were also identified by pairwise comparisons described
above. Interestingly, delta eta analysis also discovered novel
candidates that were not identified by pairwise comparisons
(Additional data files 11 and 12), including the gene for
aquaporin 4 (Aqp4), which was upregulated in SW mice but
not in FVB mice. Functional classification of these transcripts
revealed significant enrichment in 'transporter activity',
'immune response', 'antigen binding', 'channel or pore class
transporter activity',' and 'carbohydrate binding' categories
(p < 0.05; Additional data file 13).
To ensure that the results were not biased by using a single
computational technique, we also analyzed these data using a
Robust Multichip Average algorithm and linear modeling
with a moderate t-test (see Materials and methods; Addi-
tional data files 14-18). These results also identified signifi-
cant enrichment of GO categories with transport functions
among genes altered by infection in a host-dependent man-
ner (p < 0.0005; Additional data files 16 and 17).
Differential expression of genes involved in intestinal
ion transport and its regulation
The prevalence of transport genes within the set of differen-
tially expressed transcripts detected by different analytical
methods supports the hypothesis that high mortality in C.
rodentium-infected FVB mice results from severe diarrhea
and dehydration as a consequence of electrolyte imbalance
[13]. We next concentrated on genes implicated in intestinal
ion transport as well as genes with regulatory and/or signal-
ing functions. GO annotations are not complete for all tran-
scripts, and the genes involved in intestinal transport do not
comprise a single distinct group in the pathway analysis.
Therefore, differentially expressed genes (Table 1; Figure 4;
Additional data file 19) were selected for validation by qRT-
PCR and further characterization based on our current
Genome Biology 2008, 9:R122
Genome Biology 2008, Volume 9, Issue 8, Article R122 Borenshtein et al. R122.6
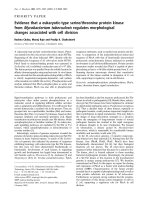
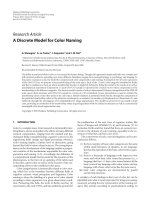
Genes contributing to host susceptibilityFigure 3
Genes contributing to host susceptibility. (a) Comparative analysis of gene expression profiles of SW versus FVB genes prior to infection or at 4 and 9 dpi
is shown as a Venn diagram. Overall, 1,547 genes were differentially expressed between the lines of mice (Additional data file 5) and divided into 7 distinct
subsets. Group A represents genes that were differentially expressed between the mouse lines at all time points. Groups B, C, and D represent genes that
were differentially expressed at two conditions/time points. Groups E, F, and G represent genes unique to uninfected status, 4 dpi and 9 dpi, respectively.
Each subset represents the comparison of resistant outbred SW mice to susceptible inbred FVB mice at the indicated time point. Numbers in parentheses
represent the number of differentially expressed probe sets in each group. Significantly enriched GO clusters (p < 0.05 by hypergeometric test) for each
group and for all sets of genes with host effect are given in Additional data file 20. (b) PCA distinguished SW from FVB mice in PC2. PC1 established
negative correlation of infected and uninoculated FVB mice, but did not discriminate SW mice by infection status. Thus, PC1 represents morbidity
associated with infection. (c) The prevalence of genes within GO categories was assessed by FatiGO analysis. Only categories containing more than 5% of
genes are shown. Genes from transport processes were overrepresented.
controls 4 dpi
9 dpi
A
(146)
B
(72)
C
(107)
D
(66)
E
(178)
F
(232)
G
(746)
E
(
178
)
controls
controls
4 dp
i
F
(
232
)
B
(72)
4 dpi
9
dpi
G
(746)
(746)
(
D
(
66
)
)
C
(
107
)
A
(146)
9 dpi
A
(146)
B
(72)
C
(107)
D
(66)
E
(178)
F
(232)
G
(746)
(c)
(a) (b)
Principal component 1 (morbidity status)
Principal component 2 (host genetic background)
FVB
9 dpi
FVB
4 dpi
SW 9 dpi
FVB control
SW control
SW 4 dpi
+25
-25
-50
+30
0
0
SI4_2
SI4_1
Si9_2
SI4_3
Si9_1
Si9_3
S9_2
S4_2
S4_1
S9_1
Fi9_2
Fi9_3
Fi4_3
Fi4_1
F9_3
F9_2
F9_1
F4_2
Protein metabolism
Transport
Cellular macromolecule metabolism
Biopolymer metabolism
Nucleobase, nucleoside, nucleotide and nucle
Regulation of cellular metabolism
Immune response
Lipid metabolism
Ion transport
Cellular biosynthesis
Response to pest, pathogen or parasite
Phosphorus metabolism
Generation of precursor metabolites and ener
Cellular lipid metabolism
Electron transport
Cell surface receptor linked signal transduc
Organic acid metabolism
Biological process. Level: 5
0 20 40 60 80 100
25.10%
24.90%
5.18%
6.57%
6.57%
11.95%
10.56%
24.70%
14.34%
17.33%
9.16%
8.96%
8.37%
7.97%
7.17%
7.17%
6.57%
Genome Biology 2008, Volume 9, Issue 8, Article R122 Borenshtein et al. R122.7
Genome Biology 2008, 9:R122
qRT-PCR of genes involv transport and its regulationFigure 4
qRT-PCR of genes involved in intestinal transport and its regulation. The expression of genes was normalized to uninoculated FVB mice. Each symbol
represents one animal. Lines indicate group means.
Fold difference (relative to averaged uninfected FVB, log10 scale)
SW
FVB
SW 4 dpi
FVB 4 dpi
SW 9 dpi
FVB 9 dpi
SW
FVB
SW 4 dpi
FVB 4 dpi
SW 9 dpi
FVB 9 dpi
Dra (Slc26a3)
p < 0.001
p < 0.001
p < 0.001
p < 0.001
p < 0.001 p < 0.01 p < 0.01
p < 0.001 p < 0.001 p < 0.001
p < 0.001
p < 0.001
p < 0.05 p < 0.01
CFTR
FosB
CA I
Ait (Slc5a8)
Adora2b
Pept2 (Slc15a2)
Aqp8
CA IV
Atp1b2
1
0
-1
-2
-3
-4
3
2
1
0
-1
1
0
-1
-2
-3
-4
1
0
-1
-2
-3
-4
1
0
-1
-2
-3
-4
1
0
-1
-2
1
0
-1
-2
1
0
-1
-2
-3
1
0
-1
-2
2
1
0
-1
-2
Genome Biology 2008, 9:R122
Genome Biology 2008, Volume 9, Issue 8, Article R122 Borenshtein et al. R122.8
Table 1
Genes involved in intestinal ion transport and its regulation
Probe set ID Gene Gene name/
aliases
Locus
link
SW over
FVB, control*
SW over
FVB, 4 dpi
SW over
FVB, 9 dpi
Main functions
Transporters
1425382_a_at
1434449_at
1447745_at
aquaporin 4 Aqp4, mMIWC 11829 -1.88 1.15 Water transport
1417828_at aquaporin 8 Aqp8 11833 3.14
†
Water transport
1449475_at ATPase, H
+
/K
+
transporting,
nongastric, alpha polypeptide
cHKA, Atp12a 192113 1.68 Potassium and proton
ion transport
1422009_at
1435148_at
ATPase, Na
+
/K
+
transporting,
beta 2 polypeptide
Atp1b2, Amog 11932 -2.99
†
-2.56 Potassium and sodium
ion transport
1435945_a_at potassium intermediate/small
conductance calcium-activated
channel, subfamily N, member 4
Kcnn4, SK4, IK1 16534 -0.93
†
Potassium ion
transport
1425088_at sodium channel, nonvoltage-gated,
type I, alpha
mENaC, Scnn1a 20276 0.9 Sodium ion transport
1417623_at
1448780_at
solute carrier family 12, member 2 Nkcc1, Slc12a2 20496 -0.96
†
Sodium:potassium:
chloride cotransport
1417600_at solute carrier family 15 (H
+
/
peptide transporter), member 2
Slc15a2, Pept2 57738 -5.28
‡
-3.69
§
-5.53
‡
Oligopeptide and
proton transport
1419343_at solute carrier family 15 (oligopeptide
transporter), member 1
Slc15a1, Pept1 56643 0.59 3.79
†
Oligopeptide and
proton transport
1429467_s_at
1421445_at
1427547_a_at
solute carrier family 26, member
3
Slc26a3, Dra 13487 6.04
§
Anion exchanger
activity, transport
1425606_at solute carrier family 5 (iodide
transporter), member 8
Ait, Slc5a8 216225 1.79
†
Ion transport
1437259_at solute carrier family 9 (sodium/
hydrogen exchanger), member 2
NHE2, Slc9a2 226999 2.12
§
Sodium transport
1441236_at solute carrier family 9 (sodium/
hydrogen exchanger), member 3
NHE3, Slc9a3 105243 0.84 Sodium transport
Regulators
1434430_s_at
1434431_x_at
1450214_at
adenosine A2b receptor Adora2b 11541 -1.72
¶
-2.89
§
-1.89
†
G-protein coupled
receptor protein
signaling pathway
1431130_at calcineurin B homologous protein 2
(2010110P09Rik)
Chp2, Cbhp2 70261 2.38
§
Sodium ion transport;
regulation of pH
1455869_at calcium/calmodulin-dependent
protein kinase II, beta
Camk2b 12323 -0.85 -3.39 -2.46 G1/S transition;
calcium transport and
signaling
1416193_at carbonic anhydrase 1 Car1, CA I 12346 3.4
†
One-carbon
compound
metabolism,
maintenance of pH
1448949_at
1418094_s_at
carbonic anhydrase 4 Car4, CA IV 12351 5.32
†
One-carbon
compound
metabolism,
maintenance of pH,
anion transport
1422134_at FBJ osteosarcoma oncogene B Fosb 14282 -2.54
†
-1.75 Regulation of
transcription
1435162_at protein kinase, cGMP-dependent,
type II
Prkg2 19092 -1.69
†
Signal transduction
1438115_a_at
1438116_x_at
1450982_at
solute carrier family 9 (sodium/
hydrogen exchanger), isoform 3
regulator 1
NHERF1, EBP50,
Slc9a3r1
26941 1.1
†
Regulation of sodium:
hydrogen exchange
1451602_at sorting nexin 6 Snx6, TFAF2 72183 -3.98
‡
-4.01 -4.95
§
Protein and ion
transport
*The numbers represent log2 ratios resulting from individual groups comparison. Significance by t-test was:
†
p < 0.05;
§
p ≤ 0.005;
¶
p ≤ 0.0005;
‡
p ≤
0.00005. Genes whose expression was confirmed by qRT-PCR are in bold.
Genome Biology 2008, Volume 9, Issue 8, Article R122 Borenshtein et al. R122.9
Genome Biology 2008, 9:R122
understanding of colonic ion transport (reviewed in [15,16]).
Four general patterns of gene expression changes were
observed.
First, a number of transcripts had distinct transcriptional
activity between the two lines of mice at all time points. For
example, FVB mice had consistently four- to eight-fold higher
expression of the adenosine A2B receptor gene (Adora2b).
Second, a group of genes, although consistently overex-
pressed in FVB mice compared to SW mice, also exhibited dif-
ferent expression as a function of time during infection. The
Sorting nexin gene (Snx6; overexpressed in FVB mice by 16-
to 31-fold compared with SW mice) had increased expression
at 4 dpi by approximately 2-fold in both lines of mice. How-
ever, at 9 dpi, expression of Snx6 remained elevated in FVB
mice, but returned to normal in SW mice. Another example
was proton-dependent high affinity oligopeptide transporter
Pept2 (Slc15a2), which was overexpressed in FVB mice by 15-
to 51-fold. Slc15a2 was upregulated in infected SW mice by 2-
fold at 4 dpi and downregulated by 4-fold at 9 dpi, whereas in
infected FVB mice its expression decreased by 11-fold at 9 dpi.
Third, some genes were differentially expressed in infected
mice as early as 4 dpi, indicating a rapid response and/or
involvement in regulation. For example, expression of the
Na
+
/K
+
-ATPase beta 2 subunit gene (Atp1b2) was increased
in SW mice by only 2.5- and 6-fold at 4 and 9 dpi, whereas in
infected FVB mice it was induced by 10- and 55-fold, respec-
tively. Similar changes were observed in the transcription fac-
tor FBJ osteosarcoma oncogene B gene (Fosb), with 3-fold
increased expression in infected SW mice at both time points,
and 12- and 16-fold changes in FVB mice at 4 and 9 dpi,
respectively. The calcium/calmodulin-dependent protein
kinase gene (Camk2b) had 4-fold decreased expression in SW
mice at 4 dpi, but 2.5-fold increase in expression in FVB mice
at 9 dpi. Expression of the basolateral water channel
aquaporin gene (Aqp4) was induced in both lines of mice at 4
dpi, but more significantly in SW mice (approximately seven-
fold increase compared with approximately two-fold increase
in FVB mice). At 9 dpi, expression of Aqp4 remained elevated
in SW mice, but returned to baseline in FVB mice (Table 1;
Additional data file 2).
The fourth and largest group was composed of genes differen-
tially expressed between infected FVB and SW mice as dis-
ease progressed, at 9 dpi. Many of these genes had
remarkable decreases in expression, including down-regu-
lated in adenoma Dra (Slc26a3; 1,100- versus 3-fold change
in FVB versus SW mice at 9 dpi), aquaporin Aqp8 (268- ver-
sus 2-fold change), and carbonic anhydrases CA I and CA IV
(87- versus 0.8-fold, and 586- versus 2.5-fold change, respec-
tively). Less dramatic changes included downregulation of
the sodium/hydrogen exchangers Slc9a2 (NHE2; 11- versus
2.5-fold decrease in FVB versus SW mice at 9 dpi) and Slc9a3
(NHE3; 8- versus 3-fold change), the apical iodide trans-
porter (Slc5a8; 13- versus 1.6-fold change), the epithelial Na+
channel (ENaC) alpha subunit encoded by Scnn1a (2.7-fold
decrease in FVB mice versus no change in SW mice), the
sodium-hydrogen exchanger regulatory factor Slc9a3r1
(NHERF1 a.k.a. EBP-50; 2-fold versus no change) and
2010110P09Rik encoding the calcineurin B homologous
protein Chp2 (8- versus 2-fold change). Expression of the
ouabain-sensitive H
+
,K
+
-ATPase Atp12a (cHKA) had
decreased in FVB mice by 2.5-fold but increased in SW mice
by 1.5-fold at 9 dpi. Likewise, the potassium channel Kcnn4
(SK4) and the cGMP-dependent protein kinase Prkg2 were
upregulated by more than 2-fold in infected FVB mice with-
out notable changes in the expression of these genes in SW
mice (Table 1; Additional data file 19).
In addition to genes identified by microarray analysis, we ver-
ified the expression of cystic fibrosis transmembrane con-
ductance regulator homolog (Cftr), which serves as the main
chloride channel in the intestine and other tissues. Two tran-
scripts corresponding to this gene showed opposite results by
microarray analysis (Additional data files 2 and 19), bringing
into question the importance of changes in expression of this
gene in our model. Nevertheless, to create a clearer picture of
intestinal ion transport in C. rodentium-infected mice, we
analyzed expression by qRT-PCR and found no difference in
Cftr expression between SW and FVB mice, though a subtle
(4-fold) decrease in mRNA levels was observed in FVB mice
at 9 dpi (Figure 4).
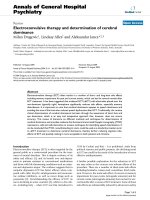
Expression of Dra and CA IV gene products
To validate the results of genomic profiling at the transcrip-
tional level, we analyzed expression of the most significantly
downregulated proteins, Dra and CA IV, by immunohisto-
chemistry (Figure 5). Strong apical expression of Dra was
observed throughout the colon in uninoculated SW and FVB
mice (Figure 5a,b), as has been reported previously [17]. By 9
dpi, patchy loss of Dra expression with detectible signal in the
adjacent segments of epithelium was found in some areas of
the distal colon in SW mice (Figure 5c). Infected FVB mice, on
the other hand, demonstrated complete lack of Dra expres-
sion in the distal colon (Figure 5d). Dra exhibited a gradient
of expression from the distal to proximal colon, with levels of
expression in the proximal colon of infected FVB mice
approximating those in the distal colon of uninoculated con-
trol FVB mice (data not shown). Similar results were found
for CA IV. The expression of CA IV in uninoculated SW and
FVB mice was localized to the surface epithelium, as has been
reported previously [18] (Figure 5e,f). There were diffuse
areas with partial loss of CA IV staining in infected SW mice
(Figure 5g) compared with complete lack of CA IV expression
in the distal colon of FVB mice at 9 dpi (Figure 5h). No signal
was detected using normal IgG as a negative control.
Alterations in serum electrolytes
Gene expression profiling identified significant differences in
expression of ion transporters that could contribute to
Genome Biology 2008, 9:R122
Genome Biology 2008, Volume 9, Issue 8, Article R122 Borenshtein et al. R122.10
diarrhea and fluid and electrolyte loss in FVB mice. Because
severe alterations in electrolyte homeostasis can lead to
changes in serum chemistry, we measured serum electrolytes
in SW and FVB mice (Figure 6). While no changes in electro-
lyte levels were detected in SW mice during infection, infected
FVB mice developed significant hypochloremia and
hyponatremia (p < 0.001). The mean concentrations of serum
chloride were 102.4 ± 1.8, 105.5 ± 2.3, and 104.8 ± 2.3 mEq/
l in SW mice before infection and at 4 and 9 dpi, respectively,
and 102.9 ± 1.8, 99.6 ± 2.1, and 91.5 ± 2.3 mEq/l in FVB mice
before infection and at 4 and 9 dpi, respectively. Sodium
concentrations in serum were 146.4 ± 1.5, 144.7 ± 1.9, and
147.2 ± 1.9 mEq/l in SW mice before infection and at 4 and 9
dpi, respectively, and 144.2 ± 1.5, 139.6 ± 1.7, and 138.5 ± 1.9
mEq/l in FVB mice before infection and at 4 and 9 dpi,
respectively. Anion gap, total CO
2
and potassium levels were
comparable in all groups at all time points (data not shown),
whereas Na
+
/K
+
ratios were lower in infected FVB mice at 9
dpi (16.0 ± 0.9 compared with 20.5 ± 0.9 in SW at 9 dpi, p <
0.005).
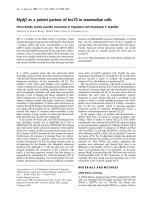
Validation of Dra and CA IV expression by immunohistochemistryFigure 5
Validation of Dra and CA IV expression by immunohistochemistry.
Colonic samples were stained with antibodies against (a-d) Dra or (e-h)
CA IV. Normal apical expression of proteins was observed in distal colon
from uninoculated SW (a,e) and FVB (b,f) mice. By 9 dpi, partial loss of
protein expression was observed in infected SW mice (c,g) compared with
complete lack of expression in infected FVB mice (d,h). Original
magnifications are 200×.
(a) (b)
(c) (d)
(e) (f)
(g) (h)
Serum electrolyte levelsFigure 6
Serum electrolyte levels. Infected FVB mice had (a) hypochloremia, (b)
hyponatremia, and (c) altered Na
+
/K
+
ratio in serum compared with
infected SW mice. Each symbol represents an individual mouse; lines
indicate means of the group. *p < 0.05; **p < 0.01.
(a)
(b)
(c)
Chloride (mEq/L)
Sodium (mEq/L)
Na
+
/K
+
ratio
SW control
FVB control
SW 4 dpi
FVB 4 dpi
SW 9 dpi
FVB 9 dpi
30
20
10
0
160
150
140
130
120
120
110
100
90
80
70
60
**
**
*
*
p = 0.0008
p = 0.0047
p = 0.0042
Genome Biology 2008, Volume 9, Issue 8, Article R122 Borenshtein et al. R122.11
Genome Biology 2008, 9:R122
Discussion
Global expression profiling is emerging as a powerful method
to characterize host-pathogen interactions [19], although
many of the studies to date have been performed on cultured
cells rather than in vivo. Here we present the first global
expression analysis of host response to infection with an A/E
bacterial pathogen. The goal of this study was to characterize
the pathophysiological basis of susceptibility to C. rodentium
infection in FVB mice. In order to accomplish this, we per-
formed quantitative analysis of the transcriptome of distal
colon tissues from FVB and SW mice before and during C.
rodentium infection. These studies revealed profound basal
and infection-dependent differences between susceptible
FVB mice and resistant SW mice.
Many studies of C. rodentium interactions with host cells
have focused on immune responses and the actin cytoskele-
ton [7,8]. Indeed, a substantial fraction of functional catego-
ries of differentially expressed genes that we identified are
involved in immune responses and cellular adhesion (Addi-
tional data file 20). However, results from our group as well
as others suggest that innate and adaptive immunity, though
important in determining the development of morbidity, is
not the most critical factor in determining mortality. Suscep-
tible FVB mice are able to clear C. rodentium infection, are
fully protected against mortality by fluid therapy (without
affecting clinical disease and the severity of colonic lesions),
and demonstrate similar expression of pro-inflammatory and
immunomodulatory genes in the colon compared to resistant
SW mice [13]. Likewise, the status of LPS responsiveness
(toll-like receptor 4 sufficiency) in different substrains of C3H
mice infected with a high number of C. rodentium does not
affect the incidence of mortality [11,12]. These observations
suggest that the immune status of mice does not contribute to
the ability to survive infection, but most likely affects clear-
ance of the pathogen.
Genes differentially expressed between FVB and SW mice,
including the most significant candidate susceptibility genes,
were highly enriched for transport activity (Figure 3c; Addi-
tional data files 10 and 13). These results demonstrated a
larger fraction of transport genes than immune-related genes
in determining susceptibility to C. rodentium infection and
were confirmed using different computational algorithms
(Figures 3c; Additional data file 16). In addition, serum
chemistry analysis showed significant hypochloremia and
hyponatremia in infected FVB mice (Figure 6), consistent
with marked electrolyte losses in animals suffering from
severe diarrhea [17,20,21]. We previously suggested that
mortality in FVB mice infected with C. rodentium could be
attributed to hypovolemia induced by severe diarrhea [13].
Results from this study suggest that intestinal ion distur-
bances rather than immune-related processes are responsible
for the dramatic phenotype in C. rodentium-infected FVB
mice. Here, we discuss potential candidate genes for suscep-
tibility identified by microarray analysis and how they could
contribute to mortality in FVB mice infected with C. roden-
tium. Our working hypothesis for the overall mechanism of
susceptibility is presented in Figure 7.
Candidates for susceptibility: genes involved in ion
transport and its regulation
The main function of the adult colon is to absorb Na
+
, Cl
-
, K
+
,
short-chain fatty acids (SCFAs) and fluid and to secrete
HCO
3
-
and mucus (reviewed in [15,16]). The osmotic gradient
created by active salt transport using ion transporters and
channels is the driving force for passive water movement in/
out of the lumen. Water transport can also occur actively
through specific water channels, aquaporins. The absorptive
functions of the colon are usually dominant, whereas during
diarrhea transport favors more electrolyte secretion and less
absorption, resulting in loss of fluid into intestinal lumen
[15,16]. Secretion of fluid and mucus into the lumen is an
important mucosal defense mechanism that serves to dilute
and wash away injurious substances from the epithelial
surface [22]. However, these mechanisms also can lead to
hypovolemia, circulatory collapse and multiple organ failure
when profound fluid losses result in marked decrease in
plasma volume [3].
In FVB mice, transcriptional changes in transporters and sig-
naling or regulatory genes were more dramatic than in SW
mice during C. rodentium infection, particularly at 9 dpi (Fig-
ure 7).
Chloride absorption
The most remarkable difference between infected FVB mice
and SW mice was in Slc26a3, which encodes the down-regu-
lated in adenoma (Dra) protein. Dra mediates apical sodium-
independent reabsorption of chloride into epithelial cells and
excretion of bicarbonate into the lumen [23]. Mutation in Dra
is associated with congenital chloride diarrhea, a recessive
inherited intestinal disorder characterized by watery diarrhea
and severe dehydration, high levels of fecal chloride, electro-
lyte disturbances, including hypochloremia and
hyponatremia, leading to metabolic alkalosis, hypokalemia,
and death if untreated [15,23]. The Dra
-/-
mouse is the only
mouse model for intestinal transporter deficiency that devel-
ops substantial diarrhea and serum electrolyte imbalances
[17], whereas NHE2
-/-
, NHE3
-/-
, cHKA
-/-
, Aqp4
-/-
and Aqp8
-/-
mice have subtle, if any, changes in stool water content and
normal serum levels of chloride and sodium [24-29]. In addi-
tion, a recent report described inhibition of intestinal apical
chloride absorption mediated by DRA in Caco-2 cells infected
with EPEC [30]. Dramatic downregulation of Dra mRNA (by
1,100-fold at 9 dpi) and lack of Dra expression in the distal
colon of infected FVB mice strongly implicate Slc26a3 as a
susceptibility factor in fatal diarrhea induced by AE
pathogens.
Genome Biology 2008, 9:R122
Genome Biology 2008, Volume 9, Issue 8, Article R122 Borenshtein et al. R122.12
Working model for the pef colonic ion transport in fatal diarrhea in C. rodentium-infected FVB miFigure 7
Working model for the pathogenesis of colonic ion transport in fatal diarrhea in C. rodentium-infected FVB mice. Normal ion transport in the large intestine
is mediated largely by the coupled action of the anion exchanger DRA, CFTR, sodium/proton exchangers NHE2/3, potassium transporters and carbonic
anhydrases (see Discussion). (a) alterations in ion transport in C. rodentium-infected SW mice, including subtle decreases in expression of some apical
transporters and compensatory increases in basolateral water channel Aqp4 expression. (b) Profound changes in infected FVB mice consisting of mild to
marked downregulation of the majority of apical transporters involved in intestinal Na
+
and Cl
-
absorption and bicarbonate secretion, along with
upregulation of basolateral transporters providing the driving force for chloride secretion. In addition, constitutively higher levels of Pept2 and Adora2b
expression in FVB mice (indicated by asterisks) can contribute to alterations in cytosolic pH and cAMP during infection, thereby further affecting ion
exchange. The cumulative effect may ultimately result in severe diarrhea and lead to death in these susceptible animals. Vesicular trafficking of some
proteins (A2B receptor, aquaporins, NHE3, ATPases) and paracellular transport are not addressed here. Colors indicate fold change in gene expression
identified by microarray or qRT-PCR: light green ≥2-fold decrease; dark green ≥8-fold decrease; pink ≥2-fold increase; red ≥8-fold increase.
H
2
O + CO
2
Na
+
K
+
2Cl
-
NKCC1
ATP1b2
3Na
+
2K
+
Dra
2Cl
-
HCO
3
-
Cl
-
Na
+
ENaC
Aqp8
H
2
O
NHE2/3
Na
+
H
+
N
H
E
R
F
H
2
O + CO
2
HCO
3
-
HCO
3
-
+ H
+
CAIV
Adora2b*
Adenosine
cAMP
Pept2*
Peptides
H
+
SK4
K
+
Apical
Infected susceptible (FVB)
Basolateral
Aqp4*
H
2
O
FosB
Ion channels
Receptors
Cytoskeleton proteins
cHKA
K
+
H
+
Ait
SCFA
Na
+
CHP2
Cftr
N
H
E
R
F
H
2
O + CO
2
Na
+
K
+
2Cl
-
NKCC1
ATP1b2
3Na
+
2K
+
Dra
2Cl
-
HCO
3
-
Cl
-
Na
+
ENaC
Aq
p8
H
2
O
NHE2/3
Na
+
H
+
NHERF
CAI
H
2
O + CO
2
HCO
3
-
HCO
3
-
+ H
+
CAIV
Adora2b*
Adenosine
cAMP
Pept2*
H
+
Peptides
SK4
K
+
Apical
Basolateral
Infected resistant (SW)
Aqp4*
H
2
O
FosB
Ion channel
Receptors
Cytoskeleton proteins
cHKA
K
+
H
+
Ait
SCFA
Na
+
CHP2
Cftr
NHERF
H
+
CAI
(a)
(b)
Genome Biology 2008, Volume 9, Issue 8, Article R122 Borenshtein et al. R122.13
Genome Biology 2008, 9:R122
Chloride secretion
There are conflicting data regarding regulation of Slc26a3 by
cystic fibrosis transmembrane conductance regulator
(CFTR), the major chloride channel [31-34]. In this study,
expression of Cftr was only slightly decreased in FVB mice at
9 dpi and was not associated with changes in Slc26a3 mRNA.
Similar observations were made by Umar et al. [35], who
reported subtle changes in Cftr expression in whole distal
colon from SW mice infected with C. rodentium. Although
isolated crypts exhibited a greater increase in the levels of Cftr
mRNA and protein, this did not correlate with large increases
in transmucosal cAMP-dependent Cl
-
current [35], suggest-
ing that other factors play an important role in regulating
chloride transport during C. rodentium infection. For exam-
ple, chloride secretion via CFTR and other chloride channels
can be activated by cAMP, cGMP, and calcium [5,36].
Camk2b and Prkg2, which would be expected to be down-
stream of these signals, were increased in infected FVB but
not SW mice. This is consistent with a post-transcriptional
mechanism of CFTR involvement in C. rodentium-induced
diarrhea. Notably, the same signaling pathways are also
implicated in inhibition of sodium/proton exchange and elec-
trogenic Na
+
absorption in colon [16,37].
Sodium absorption
Expression of ENaC, NHE2 and NHE3, which are the main
sodium channels involved in apical electrogenic and elec-
troneutral sodium absorption, pH maintenance and fluid bal-
ance in intestine [16,37], was decreased by infection in FVB
mice, and to a lesser extent in SW mice. Downregulation of
the calcineurin B homologous protein (CHP), which is
required for Na
+
/H
+
exchange activity [38], further indicates
that intestinal transport is affected at the transcriptional and
post-transcriptional levels in infected FVB mice. Coupling of
DRA, CFTR, and NHE3 activity is mediated by PDZ-binding
scaffold proteins (reviewed in [39]). One such protein,
EBP50, encoded by Slc9a3r1 (NHERF1), is required for
cAMP-mediated inhibition of NHE3 activity and stimulation
of CFTR activity. The interaction of NHERF1 with the type III
secretion system effector Map was recently implicated in the
pathogenesis of EPEC and C. rodentium [40]. The decrease in
expression of EBP50 in infected FVB mice may represent an
unsuccessful attempt to control diarrhea. It is notable that
decreased expression of individual sodium transport genes
was mild (2- to 13-fold), but collectively the failure to reab-
sorb sodium contributes to mortality.
Potassium transport
The driving force for apical Cl
-
secretion is dependent on
basolateral potassium recycling through Na
+
,K
+
-ATPase and
K
+
channels [36]. Infected FVB mice demonstrated marked
increases in expression of Atp1b2, which encodes Na
+
,K
+
-
ATPase beta-2 isoform at both 4 and 9 dpi, and to a lesser
extent increased expression of potassium channels KCNN4
and NKCC1 at 9 dpi. Furthermore, Na
+
,K
+
-ATPase activity
was recently shown to be indirectly stimulated by SNX6 [41].
This gene was not only consistently overexpressed in FVB
mice at all times compared to SW mice, but also was upregu-
lated in FVB mice at 4 and 9 dpi. These changes could poten-
tiate electrogenic Cl
-
secretion and, hence, fluid loss. While
basolateral potassium transporters were mainly upregulated
in infected FVB mice, the luminal ouabain-sensitive H
+
,K
+
-
ATPase (cHKA) encoded by Atp12a was downregulated in
FVB mice but not in SW mice at 9 dpi. This ATPase was
reported to regulate Dra activity in the colons of NHE3-defi-
cient mice [42]. Furthermore, compensatory increases in
intestinal cHKA expression have been observed in a number
of ion transporter gene knockout mouse models [17,27], indi-
cating its role in maintaining intestinal ion homeostasis.
Thus, impaired transcriptional activity of potassium trans-
porters can contribute to the pathogenesis of diarrhea in C.
rodentium-susceptible animals.
Bicarbonate metabolism and pH regulation
The activity of many intestinal transporters is regulated by
intracellular pH. Rapid diffusion and equilibration of protons
entering enterocytes at the apical membrane is dependent on
carbonic anhydrases, enzymes that catalyze the reversible
hydration/dehydration of CO
2
and water [43]. Carbonic
anhydrases, especially cytosolic CA I and membrane-associ-
ated CA IV, are known to play a role in ion and water trans-
port in the small intestine and distal colon [44-47]. Because
inhibition of carbonic anhydrases is associated with marked
decreases in sodium, chloride and water absorption as well as
bicarbonate secretion [47-49], profound downregulation of
CA I and CA IV in infected FVB mice at 9 dpi suggest their
critical role in C. rodentium-induced mortality.
Additional proteins able to affect intracellular pH include oli-
gopeptide-proton symporters Pept1 and Pept2, whose expres-
sion was differentially expressed between FVB and SW mice.
Although H
+
/dipeptide transport is coupled with Na
+
/H
+
exchanger and carbonic anhydrase activity in Caco-2 cells and
mouse enterocytes isolated from small intestine [43,50], the
function of these transporters in distal colon is not clear
[51,52].
SCFA transport
Both cytosolic and luminal pH is regulated by butyrate and
other SCFAs produced by enteric bacterial fermentation of
undigested carbohydrates and dietary fiber. SCFAs, following
ileal or colonic absorption by nonionic diffusion or via a
SCFA/HCO
3
-
(OH) exchange mechanism, maintain mucosal
integrity and stimulate water and electrolyte absorption by
acidification of colonocytes and activation of apical Na
+
/H
+
and Cl
-
/HCO
3
-
exchangers [45,53,54]. Therefore, decreased
butyrate/SCFAs availability due to downregulation of the
Na
+
-dependent SCFA transporter Slc5a8 (Ait) in FVB mice at
9 dpi might affect mucosal permeability, disturb acid-base
homeostasis, and inhibit ion absorption in the colon, thereby
contributing to C. rodentium-mediated diarrhea in suscepti-
ble FVB mice. This is similar to the decreased expression of
Genome Biology 2008, 9:R122
Genome Biology 2008, Volume 9, Issue 8, Article R122 Borenshtein et al. R122.14
the epithelial SCFA transporter MCT-1, and the subsequent
decrease in butyrate uptake reported in Caco-2 cells infected
with EPEC [53]. This inhibitory effect is dependent on a func-
tional type III secretion system (escN, espA, espB, or espD
genes), but did not require known effector proteins encoded
by espF, espG, espH, or map [53]. These results suggest that
intimate attachment and perhaps a yet unidentified bacterial
effector protein(s) are necessary for decreased butyrate
uptake in host cells.
Water transport
As mentioned previously, water passes through cells either
passively, following the osmotic gradient created by chloride
and sodium transport, or is transported by means of specific
water channels, aquaporins [55]. A number of aquaporins
were differentially expressed in infected FVB mice compared
with SW mice. Apical channel Aqp8 was profoundly downreg-
ulated in FVB mice at 9 dpi, which could interfere with fluid
transport from the intestinal lumen in susceptible animals. In
resistant SW mice, fluid loss caused by decreased ion reab-
sorption is compensated for by upregulation of the basola-
teral channel Aqp4, which counteracts movement of water
into the lumen. Although a slight increase in Aqp4 expression
was observed in FVB mice at 4 dpi, the transcript levels
returned to baseline at 9 dpi. These results are consistent with
a recent report implicating mislocalization of aquaporins 2
and 3 in C. rodentium diarrhea [56]. Thus, the function of
water channels in C. rodentium-infected FVB mice deserves
further investigation.
Transcriptional regulation
Among the transcription factors differentially expressed
between susceptible and resistant mice, Fosb was the most
affected early in infection. The upregulation of Fosb in
infected FVB mice at 4 dpi was more appreciable than the
subtle increase observed in SW mice at that time point. This
trend continued at 9 dpi as well. FosB is an 'immediate-early'
nuclear protein from the Fos family of transcription factors.
Dimerization of Fos and Jun proteins causes binding to acti-
vator protein 1 (AP-1) promoter sites. AP-1 complexes affect
expression of many genes, including ion channels, receptors,
cytoskeletal proteins and signaling molecules [57,58]. Within
the set of genes with a strain effect, 67% were predicted to
have AP-1 binding sites. This included many potential candi-
dates for susceptibility, such as Aqp4 and Aqp8, cHKA, CA I,
Slc26a3, Slc5a8, Slc9a2, NHERF1, and Fosb itself (data not
shown). Early upregulation of Fosb in infected FVB mice may
indicate that FosB contributes to fatal diarrhea independent
of, and prior to, inflammation-mediated effects. Further
studies are needed to determine the signals that upregulate
Fosb expression in susceptible mice, FosB partners in DNA
binding and FosB target genes.
Inflammatory effectors
Inflammatory mediators are also implicated in the pathogen-
esis of diarrhea. A good example is adenosine, a secretagogue
released by polymorphonuclear cells, eosinophils and mast
cells in inflammatory conditions [59-61]. Breakdown of ATP
released from injured cells during infection is an additional
possible source of adenosine, as has been proposed for path-
ogens with type III secretion systems such as EPEC, E. coli
O157:H7, and Salmonella enterica [62]. Adenosine signaling
is mediated by G-protein-coupled receptors, of which A2BAR
encoded by Adora2b is the predominant adenosine receptor
in intestinal epithelial cells [61]. Downstream signaling by
activated A2BAR results in cAMP- and arachidonic acid-
dependent activation of potassium channels and intestinal Cl
-
secretion [59,61,63,64]. The consistently higher Adora2b
expression in FVB mice may predispose susceptible animals
to this diarrhea-inducing pathway and contribute to the sus-
ceptibility of FVB mice to C. rodentium infection.
Epithelial differentiation
Notably, a number of genes profoundly downregulated in sus-
ceptible FVB mice, such as Slc26a3 (Dra), Aqp8, CAIV, and
Slc5a8 (Ait), are also implicated in the development of
colonic tumors [65-68]. Thus, relative loss of differentiated
epithelium due to erosions and ulcerations and/or expansion
of less well differentiated proliferating cells in the crypt com-
partment [13] could contribute to altered transcriptional
activity in infected FVB mice. However, expression of other
markers of differentiation, such as sucrase-isomaltase, alka-
line phosphatase, villin, intestinal trefoil factor 3, and Krup-
pel-like factor 4 [69,70], was unchanged or not altered to the
same extent in infected FVB mice, indicating that erosions or
hyperplasia alone can not fully account for the dramatic loss
of expression of Dra, Aqp8, CAIV, and Ait in susceptible FVB
mice.
Developmental regulation
Expression of many genes identified in our global analysis
change during postnatal development. This includes sodium
exchangers, aquaporins and carbonic anhydrases with higher
levels of expression and PEPT proteins with lower expression
in adults animals compared with suckling or weanling ani-
mals [52,71-75]. This suggests that mortality in C. rodentium-
infected adult FVB mice and young mice of all strains and
stocks may result from a common pathogenic mechanism,
such as inadequate apical ion, proton and water transport in
the distal colon leading to dehydration and hypovolemic
shock. Therefore, genes identified by microarray analysis
deserve further study and may account for susceptibility to
fatal infectious diarrhea in young mice and other mammals.
Applications to other models of diarrhea
Ion imbalances are implicated in other non-infectious animal
models of diarrhea. Thus, mice with defects in cytoskeletal
intermediate filaments, like keratin 8-deficient mice (in an
FVB/N background), demonstrate ion transport impairment
before the onset of colonic hyperproliferation and inflamma-
tion. Interestingly, those animals develop diarrhea despite
normal tight junction permeability [76], raising the possibil-
Genome Biology 2008, Volume 9, Issue 8, Article R122 Borenshtein et al. R122.15
Genome Biology 2008, 9:R122
ity that tight junction abnormalities contribute to, but do not
directly cause, mortality in C. rodentium-infected FVB mice.
In addition, significant impairment of sodium and chloride
absorption and bicarbonate secretion is found in colitis-
prone IL-2
-/-
mice [77]. Chemical induction of colitis by treat-
ment with dextran sulfate sodium results in substantial
downregulation of carbonic anhydrases CA I and CA IV and
aquaporins Aqp4 and Aqp8 [78-80]. These results indicate
that infectious diarrhea and noninfectious inflammation-
associated diarrhea may have common mechanisms of patho-
genesis and further justify the use of C. rodentium-infected
FVB mice for studying fluid and electrolyte imbalance.
Conclusion
We present the first gene expression profiling of C. rodentium
infection in vivo. The genomic analysis of the host response to
infection generated novel testable hypotheses regarding this
enteric murine pathogen's ability to cause disease and mor-
tality in FVB mice. Marked impairment in intestinal ion
homeostasis was predicted by microarray analysis and con-
firmed by qRT-PCR, immunohistochemistry and serum elec-
trolyte measurements. The fact that the majority of
genetically manipulated mice with a single deficiency in ion
transporters develop only mild, if any, diarrhea and no appre-
ciable serum electrolyte disturbances indicates the existence
of compensatory mechanisms. It is likely that in the disease
state (for example, diarrhea induced by C. rodentium) many
genes involved in intestinal ion transport, signaling and reg-
ulation act together. In that regard, orchestrated alterations,
such as downregulation of the main apical colonic transport-
ers, upregulation of basolateral ion channels and other
changes in regulatory signals observed in susceptible FVB
mice upon C. rodentium infection, may provide a basic mech-
anism for the development of severe diarrhea and fatal dehy-
dration in susceptible strains compared with resistant strains
of mice. Our study identified potential candidate genes for
susceptibility that can be used to develop new strategies for
preventing and treating intestinal inflammation and fatal
diarrhea.
Materials and methods
Media, bacterial strains, and growth conditions
Lennox L (LB) broth and LB agar (Difco Laboratories,
Detroit, MI, USA) were used for routine cultivation of bacte-
ria. MacConkey lactose agar (Difco Laboratories) supple-
mented with 40 μg/ml of kanamycin was used for
quantitative microbiology of fecal samples. The kanamycin-
resistant C. rodentium strain DBS120 (pCRP1::Tn5, Kan
r
)
[13] was used for infections.
Animal infections
Inbred FVB/NTac and outbred Swiss Webster Tac:SW
females with 40 and 36 female two-week-old pups, respec-
tively, were purchased from Taconic Laboratories (German-
town, NY, USA). Because animals came from different barrier
units, mixing of bedding from weaning until the time of inoc-
ulation (12 weeks of age) was performed twice a week to
obtain comparable microbial status and minimize commen-
sal microbiota biases. Animals were housed in microisolator
cages in a specific pathogen-free facility approved by the
Association for Assessment and Accreditation of Laboratory
Animal Care and maintained on pelleted rodent chow (Lab-
Diet, Purina Mills, Inc., Richmond, IN, USA) and water ad
libitum. At 12 weeks of age, infectious colitis was induced by
intragastric inoculation with 1.9 × 10
9
CFU of DBS120 as
described previously [13]. A total of 37 FVB and 36 SW mice
were used in the inoculation study as described in Additional
data file 1. Animals were weighed and monitored for fecal
bacterial shedding prior to inoculation and at 3, 6, and 8 dpi.
The lower limit of detection for quantitative microbiology was
1 CFU/mg of feces. Animals were euthanized at 4 and 9 dpi.
At necropsy, the colon of each mouse was collected asepti-
cally, feces were removed from the lumen, and the distal
colon was transected in-half longitudinally. Half of the distal
colon was snap frozen in liquid nitrogen and stored at -80°C
until RNA was extracted. The rest of the tissue was fixed in
10% neutral-buffered formalin for 24-48 hours, processed
routinely, paraffin embedded, sectioned at 5 μm, and stained
with hematoxylin and eosin. Sections were scored for lesions
on a scale of 0 to 4 (none, minimal, mild, moderate, and
severe) by a veterinary pathologist (PRN) blinded to experi-
mental groups. All experiments were approved by the MIT
Animal Care and Use Committee.
RNA extraction
Total RNA was extracted from frozen distal colon using Trizol
reagent according to the recommendations of the manufac-
turer (Invitrogen, Carlsbad, CA, USA). RNA was treated with
DNase I and purified using an RNeasy Clean-up kit as recom-
mended by the manufacturer (Qiagen, Valencia, CA, USA).
The total RNA concentration and 260/280 ratio was evalu-
ated spectrophotometrically. Only samples with a 260/280
ratio between 1.8 and 2.1 were further processed. RNA sam-
ples were evaluated using an Agilent 2100 Bioanalyzer (Agi-
lent, Palo Alto, CA, USA) and consistently demonstrated
high-quality RNA with distinct 28S and 18S peaks and no evi-
dence of degradation.
Array design and hybridization
Global gene expression analysis was performed on the distal
colon with two to three mice per group. Because no difference
for any parameters was observed in uninfected mice at 4 or 9
dpi, the animals were pooled into an uninoculated control
group for each line of mouse. The selection of representative
samples for microarray analysis was based on known infec-
tion status and colonic lesions. The final number of biological
replicates for each condition was n = 5 for uninoculated FVB
mice ('Fp' group), n = 4 for uninoculated SW mice ('Sp'
group), and n = 3 for infected animals from each line at each
time point ('Fi4', 'Si4', 'Fi9', and 'Si9', respectively; Additional
Genome Biology 2008, 9:R122
Genome Biology 2008, Volume 9, Issue 8, Article R122 Borenshtein et al. R122.16
data file 1). One-cycle target labeling of isolated RNA, hybrid-
ization, washing/staining and scanning was carried out in the
Whitehead Institute Center for Microarray Technology (Cam-
bridge, MA, USA) as detailed at [81]. First- and second-strand
cDNA syntheses were performed using SuperScript double-
stranded cDNA synthesis kit (Invitrogen). Second strand
DNA synthesis, clean-up of the double-stranded cDNA, and
synthesis and clean-up of biotin-labeled cRNA were com-
pleted according to Affymetrix protocols (Santa Clara, CA,
USA). cRNA (20 μg) was fragmented and hybridized as rec-
ommended by Affymetrix to the GeneChip
®
Murine Genome
430 2.0 Arrays containing 45,037 probe sets that correspond
to over 34,000 well characterized mouse genes. Each sample
was hybridized to one array, using a total of 21 chips. Arrays
were scanned using a GeneChip scanner 3000, enabling for
high-resolution scanning as recommended (Affymetrix). The
expression output for all samples met quality control require-
ments (data not shown). Presence call for all arrays ranged
from 58-66%. Microarray results were tightly correlated
between biological replicates within and between the animal
groups (Additional data file 21).
Identifying differentially expressed genes
Cell intensity files (*.cel) containing hybridization signals
were generated with GeneChip Operating Software (GCOS
1.2). Normalization and processing were carried out using
DNA-Chip Analyzer (dChip) software [82] implementing
model-based expression index analysis using an outlier
detection algorithm to eliminate potential cross-hybridizing
probes [83]. Normalization using an invariant set of genes, in
which all arrays are normalized to a common baseline array
with median intensity, was followed by background correc-
tion and log2 transformation. The perfect match-only model
was applied in order to reduce noise. A mean value was calcu-
lated from signal log2 ratios for each gene and group. Gene
expression was considered to be significant when it was
changed by more than two-fold (an average log2 ratio above
1.0 or below -1.0). Genes were clustered by tightness with cen-
troid-linkage method using 1 - r (where r is the Pearson cor-
relation coefficient) as the distance measure while redundant
probes were masked. Results were visualized using heat maps
showing color-coded expression levels (red = high expres-
sion, black = medium expression, and green = low expres-
sion) and vertically drawn gene trees. Functional enrichment
analysis was performed on non-redundant genes with known
functions using two methods; within dChip software using a
hypergeometric test with p < 0.05 and at least four function-
ally annotated genes if not otherwise indicated. In addition,
the web-based Fast Assignment and Transference of Infor-
mation using Gene Ontology (FatiGO) Plus tool [84,85] was
used for calculating the prevalence of GO functional groups.
The results of inclusive analysis at the fifth level of depth and
more than 5% of GO categories enrichment are presented.
Temporal changes in response to infection were addressed
using a 'delta eta' analysis to identify significant differential
transcript modulation in response to treatment where for
each transcript [log2 (FVB infected/FVB uninoculated) - log2
(SW infected/SW uninoculated)] where FC >1.5. For each
gene, delta eta values for 4 and 9 dpi were calculated as
log2(Si4 versus Sp) - log2(Fi4 versus Fp) and log2(Si9 versus
Sp) - log2(Fi9 versus Fp), respectively. The results were proc-
essed in Spotfire and subjected to enrichment GO analysis by
dChip. All Affymetrix and GO annotations were based on Feb-
ruary 2007 data files.
Results obtained by dChip data processing were compared to
other analytical methods: the raw CEL files were processed
using the Robust Multichip Average algorithm [86] and dif-
ferentially expressed genes were identified using linear mod-
eling with a moderated t-statistic for each gene (Limma
package) [87], available as part of BioConductor software.
Temporal infection-induced trends between the groups were
determined by a linear model with false discovery rate <0.05
and 2-fold cut-off threshold. To discriminate gene behavior,
random forest analysis to predict four classes (strain × infec-
tion status) was applied with p < 0.05. Enrichment analysis
was performed within dChip with p < 0.0005, and the preva-
lence of functional groups was determined with FatiGO as
indicated above.
Raw data and normalized microarray expression data have
been deposited at the Gene Expression Omnibus (GEO) [88]
under the accession number GSE8025.
TaqMan quantitative RT-PCR
Total RNA (5 μg) was used to generate cDNA with Super-
ScriptII RT (Invitrogen) as recommended by the manufac-
turer. cDNA (100 ng) was amplified in a 25 μl reaction volume
with Applied Biosystems (Branchburg, NJ, USA) predesigned
primers and probes (TaqMan Gene Expression Assays; Addi-
tional data file 3) in an ABI Prism Sequence Detection System
7700 (Applied Biosystems) using standard TaqMan proto-
cols. Transcript levels were normalized to the endogenous
control glyceraldehyde-3-phosphate dehydrogenase
(GAPDH), and expressed as fold change compared with aver-
aged uninoculated control FVB mice, which were set at 1,
using the Comparative Ct method [89]. The resultant ratios
were matched with corresponding comparisons from micro-
array analysis and subjected to Pearson correlation analysis.
The number of samples used for TaqMan were n = 10 in uni-
noculated control groups and n = 6-8 samples for infected
groups in each line of mice (Additional data file 1). Each reac-
tion was carried out in duplicate.
Immunohistochemical analysis
The expression of Dra and CA IV in formalin fixed paraffin-
embedded tissues was detected using rabbit anti-Slc26a3
(kind gift from Dr Schweinfest [17], diluted 1:100) and goat
anti-CA IV (AF2414, R&D Systems, Minneapolis, MN, USA;
diluted 1:800) polyclonal antibodies. After heat induced
epitope retrieval (pH 6), primary Dra antibodies were
detected with biotinylated goat anti-rabbit IgG (E0432, Dako,
Genome Biology 2008, Volume 9, Issue 8, Article R122 Borenshtein et al. R122.17
Genome Biology 2008, 9:R122
Carpinteria, CA, USA) and normal rabbit IgG (x0936, Dako)
was used as a negative control. CA IV antibodies were
detected with biotinylated rabbit anti-goat IgG (b7014,
Sigma, St. Louis, MO, USA) and goat HRP-polymer kit
(ghp516g, Biocare Medical, Concord, CA, USA), whereas nor-
mal goat IgG (#005-000-003, Jackson Immuno, West Grove,
PA, USA) was used as a negative control. Sections were
stained using diaminobenzidine as a substrate and counter-
stained with hematoxylin.
Measuring serum electrolyte levels
Electrolytes in serum were assayed by IDEXX Preclinical
Research Services (IDEXX Laboratories, Inc., North Grafton,
MA, USA) using electrolyte Panel 957, including bicarbonate,
chloride, potassium, sodium, Na
+
/K
+
ratio and anion gap,
with 200 μl samples of serum.
Statistics
Data are presented as mean values ± the standard error of
mean or median values (for nonparametric data). Statistical
analyses were performed using GraphPad PRISM version 4.0
(GraphPad Software, Inc., San Diego, CA, USA) or JMP 5.0.1
software (SAS Institute Inc., Cary, NC, USA). Statistical dif-
ferences were determined by using nonparametric Kruskal-
Wallis test followed by Dunn's Multiple Comparison test or
with one-way ANOVA followed by Student's t-test or Tukey's
Multiple Comparison Test. Whenever Bartlett's test showed
unequal variances, analysis of gene expression was
performed on transformed data. A p-value < 0.05 was
regarded as statistically significant.
Abbreviations
A/E, attaching and effacing; AP, activator protein; AQP,
aquaporin; CA, carbonic anhydrase; CFTR, cystic fibrosis
transmembrane conductance regulator; dChip, DNA-Chip
Analyzer; dpi, days post inoculation; Dra, down-regulated in
adenoma; EHEC, enterohaemorrhagic E. coli; EPEC, enter-
opathogenic E. coli; FatiGO, Fast Assignment and Transfer-
ence of Information using Gene Ontology; FVB, FVB/N mice;
GO, Gene Ontology; NHE, Na/H exchanger; PC, principle
component; PCA, principal component analysis; qRT-PCR,
quantitative real-time PCR; SCFAs, short-chain fatty acids;
SW, Swiss Webster.
Authors' contributions
DB conceived of the studies, designed them, performed the
statistical analysis, and drafted the manuscript. RCF partici-
pated in the design of the study and bioinformatic analysis.
EBG carried out the genomic studies. PRN scored the his-
topathological slides. VJC participated in bioinformatic
analysis. JGF conceived of the studies and participated in
manuscript drafting. DBS conceived of the studies, partici-
pated in their design and coordination, and drafted the man-
uscript. All authors read and approved the final manuscript.
Additional data files
The following additional data are available. Additional data
file 1 is a table listing the number of animals used for experi-
ments. Additional data file 2 is a table listing all differentially
expressed genes. Additional data file 3 is a table displaying
validation of microarray results by quantitative RT-PCR
(TaqMan) on selected genes. Additional data file 4 is a figure
showing side-by-side comparison of gene expression ana-
lyzed by microarray and qRT-PCR. Additional data file 5 is a
table listing genes with host effect. Additional data file 6 is a
table listing PCA parameters. Additional data file 7 is a figure
showing hierarchical clustering of genes with host effect.
Additional data file 8 is a table listing the most significant var-
iably expressed genes with host effect. Additional data file 9 is
a figure showing hierarchical clustering of the most differen-
tially expressed genes with host effect. Additional data file 10
is a table summarizing enrichment by GO categories of the
most differentially expressed genes with host effect. Addi-
tional data file 11 is a table listing the variably expressed genes
as a function of time (delta eta analysis). Additional data file
12 is a figure showing hierarchical clustering of the most dif-
ferentially expressed genes from delta eta analysis. Additional
data file 13 is a table summarizing enrichment by GO catego-
ries of the most differentially expressed genes from delta eta
analysis. Additional data file 14 is a table listing the genes with
host effect analyzed by BioConductor. Additional data file 15
is a table listing the genes with host × infection effect analyzed
by BioConductor. Additional data file 16 is a figure showing
FatiGO analysis on genes identified by BioConductor analy-
sis. Additional data file 17 is a table summarizing enrichment
by GO categories of genes detected by BioConductor analysis.
Additional data file 18 is a figure showing genes with most
predictive power obtained from BioConductor analysis. Addi-
tional data file 19 is a figure presenting hierarchical clustering
of genes discussed in text as potentially contributing to devel-
opment of intestinal ion disturbances and diarrhea. Addi-
tional data file 20 is a table listing enriched GO categories in
the set of genes with host effect and by groups indicated in
Figure 3a. Additional data file 21 is a figure showing correla-
tion of raw intensities between biological replicates validating
microarray results.
Additional data file 1Number of animals used for experimentsNumber of animals used for experiments.Click here for fileAdditional data file 2All differentially expressed genesAll differentially expressed genes.Click here for fileAdditional data file 3Validation of microarray results by quantitative RT-PCR (TaqMan) on selected genesValidation of microarray results by quantitative RT-PCR (TaqMan) on selected genes.Click here for fileAdditional data file 4Side-by-side comparison of gene expression analyzed by microar-ray and qRT-PCRSide-by-side comparison of gene expression analyzed by microar-ray and qRT-PCR.Click here for fileAdditional data file 5Genes with host effectGenes with host effect.Click here for fileAdditional data file 6PCA parametersPCA parameters.Click here for fileAdditional data file 7Hierarchical clustering of genes with host effectHierarchical clustering of genes with host effect.Click here for fileAdditional data file 8The most significant variably expressed genes with host effectThe most significant variably expressed genes with host effect.Click here for fileAdditional data file 9Hierarchical clustering of the most differentially expressed genes with host effectHierarchical clustering of the most differentially expressed genes with host effect.Click here for fileAdditional data file 10Enrichment by GO categories of the most differentially expressed genes with host effectEnrichment by GO categories of the most differentially expressed genes with host effect.Click here for fileAdditional data file 11Variably expressed genes as a function of time (delta eta analysis)Variably expressed genes as a function of time (delta eta analysis).Click here for fileAdditional data file 12Hierarchical clustering of the most differentially expressed genes from delta eta analysisHierarchical clustering of the most differentially expressed genes from delta eta analysis.Click here for fileAdditional data file 13Enrichment by GO categories of the most differentially expressed genes from delta eta analysisEnrichment by GO categories of the most differentially expressed genes from delta eta analysis.Click here for fileAdditional data file 14Genes with host effect analyzed by BioConductorGenes with host effect analyzed by BioConductor.Click here for fileAdditional data file 15Genes with host × infection effect analyzed by BioConductorGenes with host × infection effect analyzed by BioConductor.Click here for fileAdditional data file 16FatiGO analysis on genes identified by BioConductor analysisFatiGO analysis on genes identified by BioConductor analysis.Click here for fileAdditional data file 17Enrichment by GO categories of genes detected by BioConductor analysisEnrichment by GO categories of genes detected by BioConductor analysis.Click here for fileAdditional data file 18Genes with most predictive power obtained from BioConductor analysisGenes with most predictive power obtained from BioConductor analysis.Click here for fileAdditional data file 19Hierarchical clustering of genes discussed in text as potentially contributing to development of intestinal ion disturbances and diarrheaHierarchical clustering of genes discussed in text as potentially contributing to development of intestinal ion disturbances and diarrhea.Click here for fileAdditional data file 20Enriched GO categories in the set of genes with host effect and by groups indicated in Figure 3aEnriched GO categories in the set of genes with host effect and by groups indicated in Figure 3a.Click here for fileAdditional data file 21Correlation of raw intensities between biological replicates validat-ing microarray resultsCorrelation of raw intensities between biological replicates validat-ing microarray results.Click here for file
Acknowledgements
We thank Jennifer Love for technical assistance with Array hybridization
and processing, and Kathy Cormier for assistance with immunohistochem-
ical analyses. We also thank the MIT Division of Comparative Medicine
(DCM) for help with mouse husbandry. This work was supported by Public
Health Service grants P01 CA26731, T32 ES07020, and P30 ES02109. DB
was supported by a National Institute of Health graduate research fellow-
ship and partially by a Biogen Idec, Inc. fellowship. The authors have
declared that no competing interests exist.
References
1. Kosek M, Bern C, Guerrant RL: The global burden of diarrhoeal
disease, as estimated from studies published between 1992
and 2000. Bull World Health Organ 2003, 81:197-204.
2. Casburn-Jones AC, Farthing MJ: Management of infectious
diarrhoea. Gut 2004, 53:296-305.
Genome Biology 2008, 9:R122
Genome Biology 2008, Volume 9, Issue 8, Article R122 Borenshtein et al. R122.18
3. Mello PM, Sharma VK, Dellinger RP: Shock overview. Semin Respir
Crit Care Med 2004, 25:619-628.
4. Nataro JP, Kaper JB: Diarrheagenic Escherichia coli. Clin Microbiol
Rev 1998, 11:142-201.
5. Berkes J, Viswanathan VK, Savkovic SD, Hecht G: Intestinal epithe-
lial responses to enteric pathogens: effects on the tight junc-
tion barrier, ion transport, and inflammation. Gut 2003,
52:439-451.
6. Vallance BA, Finlay BB: Exploitation of host cells by enteropath-
ogenic Escherichia coli. Proc Natl Acad Sci USA 2000, 97:8799-8806.
7. Luperchio SA, Schauer DB: Molecular pathogenesis of Citro-
bacter rodentium and transmissible murine colonic
hyperplasia. Microbes Infect 2001, 3:333-340.
8. Mundy R, MacDonald TT, Dougan G, Frankel G, Wiles S: Citrobacter
rodentium of mice and man. Cell Microbiol 2005, 7:1697-1706.
9. Barthold SW, Coleman GL, Jacoby RO, Livestone EM, Jonas AM:
Transmissible murine colonic hyperplasia. Vet Pathol 1978,
15:223-236.
10. Barthold SW, Osbaldiston GW, Jonas AM: Dietary, bacterial, and
host genetic interactions in the pathogenesis of transmissi-
ble murine colonic hyperplasia. Lab Anim Sci 1977, 27:938-945.
11. Khan MA, Ma C, Knodler LA, Valdez Y, Rosenberger CM, Deng W,
Finlay BB, Vallance BA: Toll-like receptor 4 contributes to colitis
development but not to host defense during Citrobacter
rodentium infection in mice. Infect Immun 2006, 74:2522-2536.
12. Vallance BA, Deng W, Jacobson K, Finlay BB: Host susceptibility to
the attaching and effacing bacterial pathogen Citrobacter
rodentium. Infect Immun 2003, 71:3443-3453.
13. Borenshtein D, Nambiar PR, Groff EB, Fox JG, Schauer DB: Devel-
opment of fatal colitis in FVB mice infected with Citrobacter
rodentium. Infect Immun 2007, 75:3271-3281.
14. Rosati B, Grau F, Kuehler A, Rodriguez S, McKinnon D: Compari-
son of different probe-level analysis techniques for oligonu-
cleotide microarrays. Biotechniques 2004, 36:316-322.
15. Field M: Intestinal ion transport and the pathophysiology of
diarrhea. J Clin Invest 2003, 111:931-943.
16. Kunzelmann K, Mall M: Electrolyte transport in the mammalian
colon: mechanisms and implications for disease. Physiol Rev
2002, 82:245-289.
17. Schweinfest CW, Spyropoulos DD, Henderson KW, Kim JH, Chap-
man JM, Barone S, Worrell RT, Wang Z, Soleimani M: slc26a3 (dra)-
deficient mice display chloride-losing diarrhea, enhanced
colonic proliferation, and distinct up-regulation of ion trans-
porters in the colon. J Biol Chem 2006, 281:37962-37971.
18. Fleming RE, Parkkila S, Parkkila AK, Rajaniemi H, Waheed A, Sly WS:
Carbonic anhydrase IV expression in rat and human gas-
trointestinal tract regional, cellular, and subcellular
localization. J Clin Invest 1995, 96:2907-2913.
19. Coombes BK, Hardwidge PR, Finlay BB: Interpreting the host-
pathogen dialogue through microarrays. Adv Appl Microbiol
2004, 54:291-331.
20. Al-Majali AM, Asem EK, Lamar CH, Robinson JP, Freeman MJ, Saeed
AM: Studies on the mechanism of diarrhoea induced by
Escherichia coli heat-stable enterotoxin (STa) in newborn
calves. Vet Res Commun 2000, 24:327-338.
21. George JW, Lerche NW: Electrolyte abnormalities associated
with diarrhea in rhesus monkeys: 100 cases (1986-1987). J Am
Vet Med Assoc 1990, 196:
1654-1658.
22. Hecht G: Innate mechanisms of epithelial host defense: spot-
light on intestine. Am J Physiol 1999, 277:C351-C358.
23. Höglund P, Haila S, Socha J, Tomaszewski L, Saarialho-Kere U, Kar-
jalainen-Lindsberg ML, Airola K, Holmberg C, de la Chapelle A, Kere
J: Mutations of the Down-regulated in adenoma (DRA) gene
cause congenital chloride diarrhoea. Nat Genet 1996,
14:316-319.
24. Bachmann O, Riederer B, Rossmann H, Groos S, Schultheis PJ, Shull
GE, Gregor M, Manns MP, Seidler U: The Na+/H+ exchanger iso-
form 2 is the predominant NHE isoform in murine colonic
crypts and its lack causes NHE3 upregulation. Am J Physiol Gas-
trointest Liver Physiol 2004, 287:G125-G133.
25. Meneton P, Schultheis PJ, Greeb J, Nieman ML, Liu LH, Clarke LL,
Duffy JJ, Doetschman T, Lorenz JN, Shull GE: Increased sensitivity
to K+ deprivation in colonic H,K-ATPase-deficient mice. J
Clin Invest 1998, 101:536-542.
26. Schultheis PJ, Clarke LL, Meneton P, Harline M, Boivin GP, Stemmer-
mann G, Duffy JJ, Doetschman T, Miller ML, Shull GE: Targeted dis-
ruption of the murine Na+/H+ exchanger isoform 2 gene
causes reduced viability of gastric parietal cells and loss of
net acid secretion. J Clin Invest 1998, 101:1243-1253.
27. Schultheis PJ, Clarke LL, Meneton P, Miller ML, Soleimani M, Gawenis
LR, Riddle TM, Duffy JJ, Doetschman T, Wang T, Giebisch G, Aronson
PS, Lorenz JN, Shull GE: Renal and intestinal absorptive defects
in mice lacking the NHE3 Na+/H+ exchanger. Nat Genet 1998,
19:282-285.
28. Wang KS, Ma T, Filiz F, Verkman AS, Bastidas JA: Colon water
transport in transgenic mice lacking aquaporin-4 water
channels. Am J Physiol Gastrointest Liver Physiol 2000,
279:G463-G470.
29. Yang B, Song Y, Zhao D, Verkman AS: Phenotype analysis of
aquaporin-8 null mice. Am J Physiol Cell Physiol 2005,
288:C1161-C1170.
30. Gill RK, Borthakur A, Hodges K, Turner JR, Clayburgh DR, Saksena
S, Zaheer A, Ramaswamy K, Hecht G, Dudeja PK: Mechanism
underlying inhibition of intestinal apical Cl/OH exchange
following infection with enteropathogenic E. coli. J Clin Invest
2007,
117:428-437.
31. Chernova MN, Jiang L, Shmukler BE, Schweinfest CW, Blanco P,
Freedman SD, Stewart AK, Alper SL: Acute regulation of the
SLC26A3 congenital chloride diarrhoea anion exchanger
(DRA) expressed in Xenopus oocytes. J Physiol 2003, 549:3-19.
32. Greeley T, Shumaker H, Wang Z, Schweinfest CW, Soleimani M:
Downregulated in adenoma and putative anion transporter
are regulated by CFTR in cultured pancreatic duct cells. Am
J Physiol Gastrointest Liver Physiol 2001, 281:G1301-G1308.
33. Simpson JE, Gawenis LR, Walker NM, Boyle KT, Clarke LL: Chloride
conductance of CFTR facilitates basal Cl-/HCO3- exchange
in the villous epithelium of intact murine duodenum. Am J
Physiol Gastrointest Liver Physiol 2005, 288:G1241-G1251.
34. Wheat VJ, Shumaker H, Burnham C, Shull GE, Yankaskas JR, Soleimani
M: CFTR induces the expression of DRA along with Cl(-)/
HCO(3)(-) exchange activity in tracheal epithelial cells. Am J
Physiol Cell Physiol 2000, 279:C62-C71.
35. Umar S, Scott J, Sellin JH, Dubinsky WP, Morris AP: Murine colonic
mucosa hyperproliferation. I. Elevated CFTR expression and
enhanced cAMP-dependent Cl(-) secretion. Am J Physiol Gas-
trointest Liver Physiol 2000, 278:G753-G764.
36. Barrett KE, Keely SJ: Chloride secretion by the intestinal epi-
thelium: molecular basis and regulatory aspects. Annu Rev
Physiol 2000, 62:535-572.
37. Zachos NC, Tse M, Donowitz M: Molecular physiology of intes-
tinal Na+/H+ exchange. Annu Rev Physiol 2005, 67:411-443.
38. Pang T, Su X, Wakabayashi S, Shigekawa M: Calcineurin homolo-
gous protein as an essential cofactor for Na+/H+ exchangers.
J Biol Chem 2001, 276:17367-17372.
39. Lamprecht G, Seidler U: The emerging role of PDZ adapter pro-
teins for regulation of intestinal ion transport. Am J Physiol Gas-
trointest Liver Physiol 2006, 291:G766-G777.
40. Simpson N, Shaw R, Crepin VF, Mundy R, FitzGerald AJ, Cummings
N, Straatman-Iwanowska A, Connerton I, Knutton S, Frankel G: The
enteropathogenic Escherichia coli type III secretion system
effector Map binds EBP50/NHERF1: implication for cell sig-
nalling and diarrhoea. Mol Microbiol 2006, 60:349-363.
41. Yoon T, Kim M, Lee K: Inhibition of Na,K-ATPase-suppressive
activity of translationally controlled tumor protein by sort-
ing nexin 6. FEBS Lett 2006, 580:3558-3564.
42. Melvin JE, Park K, Richardson L, Schultheis PJ, Shull GE: Mouse
down-regulated in adenoma (DRA) is an intestinal Cl(-)/
HCO(3)(-) exchanger and is up-regulated in colon of mice
lacking the NHE3 Na(+)/H(+) exchanger. J Biol Chem 1999,
274:22855-22861.
43. Stewart AK, Boyd CA, Vaughan-Jones RD: A novel role for car-
bonic anhydrase: cytoplasmic pH gradient dissipation in
mouse small intestinal enterocytes. J Physiol 1999, 516:209-217.
44. Alvarez BV, Loiselle FB, Supuran CT, Schwartz GJ, Casey JR: Direct
extracellular interaction between carbonic anhydrase IV and
the human NBC1 sodium/bicarbonate co-transporter. Bio-
chemistry 2003, 42:12321-12329.
45. Charney AN, Dagher PC: Acid-base effects on colonic electro-
lyte transport revisited. Gastroenterology 1996, 111:1358-1368.
46. Clarke LL, Harline MC: Dual role of CFTR in cAMP-stimulated
HCO3- secretion across murine duodenum. Am J Physiol 1998,
274:G718-G726.
47. Fonti R, Latella G, Caprilli R, Frieri G, Marcheggiano A, Sambuy Y:
Carbonic anhydrase I reduction in colonic mucosa of
patients with active ulcerative colitis. Dig Dis Sci 1998,
43:2086-2092.
Genome Biology 2008, Volume 9, Issue 8, Article R122 Borenshtein et al. R122.19
Genome Biology 2008, 9:R122
48. Charney AN, Alexander-Chacko J, Gummaconda R, Egnor RW:
Non-catalytic role of carbonic anhydrase in rat intestinal
absorption. Biochim Biophys Acta 2002, 1573:141-148.
49. Charney AN, Egnor RW, Henner D, Rashid H, Cassai N, Sidhu GS:
Acid-base effects on intestinal Cl- absorption and vesicular
trafficking. Am J Physiol Cell Physiol 2004, 286:C1062-C1070.
50. Thwaites DT, Ford D, Glanville M, Simmons NL: H(+)/solute-
induced intracellular acidification leads to selective activa-
tion of apical Na(+)/H(+) exchange in human intestinal epi-
thelial cells. J Clin Invest 1999, 104:629-635.
51. Meredith D, Boyd CA: Structure and function of eukaryotic
peptide transporters. Cell Mol Life Sci 2000, 57:754-778.
52. Shen H, Smith DE, Brosius FC 3rd: Developmental expression of
PEPT1 and PEPT2 in rat small intestine, colon, and kidney.
Pediatr Res 2001, 49:789-795.
53. Borthakur A, Gill RK, Hodges K, Ramaswamy K, Hecht G, Dudeja PK:
Enteropathogenic Escherichia coli inhibits butyrate uptake in
Caco-2 cells by altering the apical membrane MCT1 level.
Am J Physiol Gastrointest Liver Physiol 2006, 290:G30-G35.
54. Vidyasagar S, Barmeyer C, Geibel J, Binder HJ, Rajendran VM: Role
of short-chain fatty acids in colonic HCO(3) secretion. Am J
Physiol Gastrointest Liver Physiol 2005, 288:G1217-G1226.
55. Ma T, Verkman AS: Aquaporin water channels in gastrointesti-
nal physiology. J Physiol 1999, 517:317-326.
56. Guttman JA, Samji FN, Li Y, Deng W, Lin A, Finlay BB: Aquaporins
contribute to diarrhoea caused by attaching and effacing
bacterial pathogens. Cell Microbiol 2007, 9:131-141.
57. Chen F, Ma L, Al-Ansari N, Shneider B: The role of AP-1 in the
transcriptional regulation of the rat apical sodium-depend-
ent bile acid transporter. J Biol Chem 2001, 276:38703-38714.
58. Nestler EJ, Hyman SE: Regulation of gene expression. In Neu-
ropsychopharmacology: The Fifth Generation of Progress Edited by: Davis
KL, Charney DS, Coyle JT, Nemeroff C. New York: Lippincott Wil-
liams and Wilkins; 2002:217-228.
59. Madara JL, Patapoff TW, Gillece-Castro B, Colgan SP, Parkos CA,
Delp C, Mrsny RJ: 5'-adenosine monophosphate is the
neutrophil-derived paracrine factor that elicits chloride
secretion from T84 intestinal epithelial cell monolayers. J
Clin Invest 1993, 91:2320-2325.
60. Marquardt DL, Gruber HE, Wasserman SI: Adenosine release
from stimulated mast cells. Proc Natl Acad Sci USA 1984,
81:6192-6196.
61. Strohmeier GR, Reppert SM, Lencer WI, Madara JL: The A2b ade-
nosine receptor mediates cAMP responses to adenosine
receptor agonists in human intestinal epithelia. J Biol Chem
1995, 270:2387-2394.
62. Crane JK, Olson RA, Jones HM, Duffey ME: Release of ATP during
host cell killing by enteropathogenic E. coli and its role as a
secretory mediator. Am J Physiol Gastrointest Liver Physiol 2002,
283:G74-G86.
63. Barrett KE, Bigby TD: Involvement of arachidonic acid in the
chloride secretory response of intestinal epithelial cells. Am
J Physiol 1993, 264:C446-C452.
64. Cobb BR, Ruiz F, King CM, Fortenberry J, Greer H, Kovacs T, Sor-
scher EJ, Clancy JP: A(2) adenosine receptors regulate CFTR
through PKA and PLA(2). Am J Physiol Lung Cell Mol Physiol 2002,
282:L12-L25.
65. Birkenkamp-Demtroder K, Olesen SH, Sorensen FB, Laurberg S,
Laiho P, Aaltonen LA, Orntoft TF: Differential gene expression in
colon cancer of the caecum versus the sigmoid and
rectosigmoid. Gut 2005, 54:374-384.
66. Croner RS, Foertsch T, Brueckl WM, Guenther K, Siebenhaar R,
Stremmel C, Matzel KE, Papadopoulos T, Kirchner T, Behrens J,
Klein-Hitpass L, Stuerzl M, Hohenberger W, Reingruber B: Com-
mon denominator genes that distinguish colorectal carci-
noma from normal mucosa. Int J Colorectal Dis 2005, 20:
353-362.
67. Fischer H, Stenling R, Rubio C, Lindblom A: Differential expres-
sion of aquaporin 8 in human colonic epithelial cells and
colorectal tumors. BMC Physiol 2001, 1:1.
68. Reichling T, Goss KH, Carson DJ, Holdcraft RW, Ley-Ebert C, Witte
D, Aronow BJ, Groden J: Transcriptional profiles of intestinal
tumors in Apc(Min) mice are unique from those of embry-
onic intestine and identify novel gene targets dysregulated in
human colorectal tumors. Cancer Res 2005, 65:166-176.
69. Ho SB: Cytoskeleton and other differentiation markers in the
colon. J Cell Biochem Suppl 1992, 16G:119-128.
70. Mariadason JM, Nicholas C, L'Italien KE, Zhuang M, Smartt HJ, Heerdt
BG, Yang W, Corner GA, Wilson AJ, Klampfer L, Arango D, Augen-
licht LH: Gene expression profiling of intestinal epithelial cell
maturation along the crypt-villus axis. Gastroenterology 2005,
128:1081-1088.
71. Bates MD, Erwin CR, Sanford LP, Wiginton D, Bezerra JA, Schatzman
LC, Jegga AG, Ley-Ebert C, Williams SS, Steinbrecher KA, Warner
BW, Cohen MB, Aronow BJ: Novel genes and functional rela-
tionships in the adult mouse gastrointestinal tract identified
by microarray analysis. Gastroenterology 2002, 122:1467-1482.
72. Bekku S, Mochizuki H, Takayama E, Shinomiya N, Fukamachi H, Ichi-
nose M, Tadakuma T, Yamamoto T: Carbonic anhydrase I and II
as a differentiation marker of human and rat colonic
enterocytes. Res Exp Med (Berl) 1998, 198:175-185.
73. Collins JF, Kiela PR, Xu H, Zeng J, Ghishan FK: Increased NHE2
expression in rat intestinal epithelium during ontogeny is
transcriptionally mediated. Am J Physiol 1998, 275:C1143-C1150.
74. Collins JF, Xu H, Kiela PR, Zeng J, Ghishan FK: Functional and
molecular characterization of NHE3 expression during
ontogeny in rat jejunal epithelium. Am J Physiol 1997,
273:C1937-C1946.
75. Purkerson JM, Schwartz GJ: Expression of membrane-associated
carbonic anhydrase isoforms IV, IX, XII, and XIV in the rab-
bit: induction of CA IV and IX during maturation. Am J Physiol
Regul Integr Comp Physiol 2005, 288:R1256-R1263.
76. Toivola DM, Krishnan S, Binder HJ, Singh SK, Omary MB:
Keratins
modulate colonocyte electrolyte transport via protein
mistargeting. J Cell Biol 2004, 164:911-921.
77. Barmeyer C, Harren M, Schmitz H, Heinzel-Pleines U, Mankertz J, Sei-
dler U, Horak I, Wiedenmann B, Fromm M, Schulzke JD: Mecha-
nisms of diarrhea in the interleukin-2-deficient mouse model
of colonic inflammation. Am J Physiol Gastrointest Liver Physiol 2004,
286:G244-G252.
78. Hardin JA, Wallace LE, Wong JF, O'Loughlin EV, Urbanski SJ, Gall DG,
MacNaughton WK, Beck PL: Aquaporin expression is downreg-
ulated in a murine model of colitis and in patients with ulcer-
ative colitis, Crohn's disease and infectious colitis. Cell Tissue
Res 2004, 318:313-323.
79. Mizoguchi E, Xavier RJ, Reinecker HC, Uchino H, Bhan AK, Podolsky
DK, Mizoguchi A: Colonic epithelial functional phenotype var-
ies with type and phase of experimental colitis. Gastroenterol-
ogy 2003, 125:148-161.
80. Renes IB, Verburg M, Van Nispen DJ, Taminiau JA, Buller HA, Dekker
J, Einerhand AW: Epithelial proliferation, cell death, and gene
expression in experimental colitis: alterations in carbonic
anhydrase I, mucin MUC2, and trefoil factor 3 expression. Int
J Colorectal Dis 2002, 17:317-326.
81. Whitehead Institute Center for Microarray Technology
Protocols [ />82. DNA-Chip Analyzer (dChip) Software: Analysis and Visuali-
zation of Gene Expression and SNP Microarrays [http://
www.dchip.org]
83. Li C, Wong WH: Model-based analysis of oligonucleotide
arrays: expression index computation and outlier detection.
Proc Natl Acad Sci USA 2001, 98:31-36.
84. Fast Assignment and Transference of Information using
Gene Ontology (FatiGO) []
85. Al-Shahrour F, Diaz-Uriarte R, Dopazo J: FatiGO: a web tool for
finding significant associations of Gene Ontology terms with
groups of genes. Bioinformatics 2004, 20:578-580.
86. Irizarry RA, Bolstad BM, Collin F, Cope LM, Hobbs B, Speed TP:
Summaries of Affymetrix GeneChip probe level data. Nucleic
Acids Res 2003, 31:e15.
87. Smyth GK: Limma: Linear models for microarray data.
In Bio-
informatics and Computational Biology Solutions Using R and Bioconductor
Edited by: Gentleman R, Carey V, Dudoit S, Irizarry RA, Huber W.
New York: Springer; 2005:397-420.
88. Gene Expression Omnibus (GEO) [http://
www.ncbi.nlm.nih.gov/geo/]
89. PE Applied Biosystems, User Bulletin no. 2 [http://
hcgs.unh.edu/protocol/realtime/UserBulletin2.pdf]