Báo cáo y học: "he miR-17-5p microRNA is a key regulator of the G1/S phase cell cycle transition" pdf
Bạn đang xem bản rút gọn của tài liệu. Xem và tải ngay bản đầy đủ của tài liệu tại đây (841.32 KB, 14 trang )
Genome Biology 2008, 9:R127
Open Access
2008Cloonanet al.Volume 9, Issue 8, Article R127
Research
The miR-17-5p microRNA is a key regulator of the G1/S phase cell
cycle transition
Nicole Cloonan
*
, Mellissa K Brown
*
, Anita L Steptoe
*
, Shivangi Wani
*
,
Wei Ling Chan
^*
, Alistair RR Forrest
*‡
, Gabriel Kolle
*
, Brian Gabrielli
†
and
Sean M Grimmond
*
Addresses:
*
Institute for Molecular Bioscience, The University of Queensland, Carmody Road, St Lucia, 4072, Australia.
†
Diamantina Institute
for Cancer, Immunology and Metabolic Medicine, Princess Alexandra Hospital, Ipswich Road, Woolloongabba, 4102, Australia.
‡
Genomic
Sciences Center, RIKEN Yokohama Institute, Yokohama, 230-0045 Japan.
Correspondence: Sean M Grimmond. Email: ^ Deceased
© 2008 Cloonan et al.; licensee BioMed Central Ltd.
This is an open access article distributed under the terms of the Creative Commons Attribution License ( which
permits unrestricted use, distribution, and reproduction in any medium, provided the original work is properly cited.
miRNA regulation of proliferation <p>Novel targets of the oncogenic miR-17-92 cluster have been identified and the mechanism of regulation of proliferation at the G1/S phase cell cycle transition via the miR-17-5p microRNA has been elucidated.</p>
Abstract
Background: MicroRNAs are modifiers of gene expression, acting to reduce translation through
either translational repression or mRNA cleavage. Recently, it has been shown that some
microRNAs can act to promote or suppress cell transformation, with miR-17-92 described as the
first oncogenic microRNA. The association of miR-17-92 encoded microRNAs with a surprisingly
broad range of cancers not only underlines the clinical significance of this locus, but also suggests
that miR-17-92 may regulate fundamental biological processes, and for these reasons miR-17-92
has been considered as a therapeutic target.
Results: In this study, we show that miR-17-92 is a cell cycle regulated locus, and ectopic
expression of a single microRNA (miR-17-5p) is sufficient to drive a proliferative signal in HEK293T
cells. For the first time, we reveal the mechanism behind this response - miR-17-5p acts specifically
at the G1/S-phase cell cycle boundary, by targeting more than 20 genes involved in the transition
between these phases. While both pro- and anti-proliferative genes are targeted by miR-17-5p,
pro-proliferative mRNAs are specifically up-regulated by secondary and/or tertiary effects in
HEK293T cells.
Conclusion: The miR-17-5p microRNA is able to act as both an oncogene and a tumor suppressor
in different cellular contexts; our model of competing positive and negative signals can explain both
of these activities. The coordinated suppression of proliferation-inhibitors allows miR-17-5p to
efficiently de-couple negative regulators of the MAPK (mitogen activated protein kinase) signaling
cascade, promoting growth in HEK293T cells. Additionally, we have demonstrated the utility of a
systems biology approach as a unique and rapid approach to uncover microRNA function.
Published: 14 August 2008
Genome Biology 2008, 9:R127 (doi:10.1186/gb-2008-9-8-r127)
Received: 25 March 2008
Revised: 3 July 2008
Accepted: 14 August 2008
The electronic version of this article is the complete one and can be
found online at /> Genome Biology 2008, Volume 9, Issue 8, Article R127 Cloonan et al. R127.2
Genome Biology 2008, 9:R127
Background
MicroRNAs (miRNAs) are short, non-coding, RNA regulators
of gene expression that have been identified in a broad range
of eukaryotes. In addition to regulating growth, development,
differentiation, and metabolism in model organisms, some
miRNAs have also been classified as tumor suppressors or
oncogenes (reviewed in [1]).
The first reported and most well studied oncomiR is the
human miR-17-92 polycistron: a cluster of seven miRNAs
derived from the c-myc regulated c13orf25 locus at chromo-
some 13q31.3 [2]. miRNA 17-5p is homologous with two other
miRNAs within this cluster (miRs 18 and 20), while miR-19a
differs by only one nucleotide from miR-19b-1 [3]. The status
of miR-17-3p as a functional miRNA is still controversial [4-
6]. The entire cluster also has paralogues within the genome,
at chromosome Xq26.2 (hsa-mir-106a, has-mir-18b, has-
mir-20b, hsa-mir-19b-2, hsa-mir-92-2) and chromosome
7q22.1 (hsa-mir-106b, hsa-mir-93, hsa-mir-25) [2,3,5]. The
former has been implicated in the progression of T-cell leuke-
mia [7], while the latter has yet to be implicated in any disease
state.
By contrast, over-expression of the mir-17-92 locus has been
identified in lung cancers [3], chronic myeloid leukemias [6],
B-cell and mantle cell lymphomas [2,8], hepatocellular
tumors [9], bladder cancers [10], and breast, colon, pancreas,
prostate, and stomach solid tumors [11]. Additionally, the
mir-17-92 cluster appears to act as a tumor suppressor in
some breast and ovarian cancer cell lines [12]. The associa-
tion of miR-17-92 with a broad range of cancers not only
underlines the clinical significance of this locus, but also sug-
gests that miR-17-92 may regulate fundamental biological
processes.
Although miRNAs are generally predicted to target hundreds
of genes [13,14], experimental evidence of miRNA-mRNA
interactions from the miR-17-92 cluster has been limited to a
few key components. Previous work has confirmed that
CDKN1B is regulated by the miR-17-92 cluster [15]; E2F1-3,
NCOA3, and RBL2 are targets of hsa-mir-17-5p [5,12,16,17];
PCAF, RUNX1, and TGFBR2 are targets of both miR-17-5p
and miR-20a [11,18-20]; CTGF is a target of miR-18a [21];
and PTEN and THBS1 are targets of miR-19a [21,22]. Many of
these targets are known cell cycle regulators, although none of
these interactions are sufficient to explain the oncogenic
potential of this locus. The specific mechanisms of either the
tumor suppressor or oncogenic activities of the miR-17-92
miRNAs remain unknown.
In this study, we employ a systems biology approach to
uncover a large network of interacting genes that are directly
targeted by miR-17-5p. We show that ectopic expression of
miR-17-5p leads to dysregulation of normal cell cycle progres-
sion and a pro-proliferative response in HEK293T cells. For
the first time, we show how this miRNA can drive both pro-
and anti-proliferative signals, allowing for the switch between
oncogenic and tumor suppressor activities.
Results
The mir-17-92 locus is cell cycle regulated
While previous studies have shown that the miR-17-92 locus
is regulated by Myc and the E2F family of transcription fac-
tors, the regulation of this gene during the cell cycle has not
yet been explored. To determine whether this locus was
expressed in a phase-specific manner, we performed quanti-
tative real-time PCR (qRT-PCR) on RNA isolated from syn-
chronized G1/G0, S, and G2/M populations of HeLa cells
(which express moderate amounts of miR-17-5p) to detect the
expression of endogenous mir-17-92 pri-RNA. The synchrony
of the cells was confirmed by flow cytometry analyses of their
DNA profiles (Figure 1a). We found that the mir-17-92 locus
is differentially expressed during the different stages of the
HeLa cell cycle, and has its highest expression in G2/M (Fig-
ure 1b). Similarly, we find that the mature miR-17-5p miRNA
follows the same profile as the pri-mRNA, with its highest
expression in G2/M (Figure 1c). While it is clear that the miR-
17-92 locus is not essential for cell cycle progression (as many
cell lines do not express this gene), the phase enriched expres-
sion of this locus suggests that its biological function is cell
cycle related.
miR-17-5p is sufficient to drive a proliferative signal in
HEK293T cells
Although the entire miR-17-92 locus has been implicated in
the progression of tumor development, several groups have
previously reported differences in absolute expression of the
individual miRNAs from this cluster [2,3,11,15], and non-
coordinated dynamic expression of these same miRNAs
[6,16,20]. Together, these data suggest that although these
miRNAs are derived from the same transcript, they are differ-
entially regulated into their mature (active) form. As differen-
tial regulation may allow for different functions, we wondered
whether individual miRNAs could drive the proliferative
response seen with miR-17-92 over-expression [3,16,19], or
whether this phenotype was caused by synergistic action of
the entire cluster. To address this, we undertook functional
network analysis using Ingenuity Pathways Analysis (IPA).
By using this web-based tool, findings presented in more than
200,000 peer-reviewed publications could be queried to
determine the biological functions of genes predicted to be
targets of the miR-17-92 polycistron.
For each miRNA in the miR-17-92 cluster, we reviewed its tar-
get genes, as previously predicted by PicTar (a miRNA-mRNA
interaction predictor based on thermodynamic potential and
evolutionarily conserved target sites [13]). We used IPA to
screen for potentially enriched functional categories for these
gene sets. To gauge the robustness of these annotations, we
performed parallel analyses on similarly sized randomly
selected gene sets. A functional category was deemed
Genome Biology 2008, Volume 9, Issue 8, Article R127 Cloonan et al. R127.3
Genome Biology 2008, 9:R127
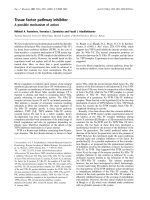
Phase enriched expression of the miR-17-92 locusFigure 1
Phase enriched expression of the miR-17-92 locus. (a) HeLa cells were synchronized by double-thymidine block and synchrony was assessed by flow
cytometry analysis of propidium iodide stained cells. DNA profiles are show from top to bottom as follows: asynchronous cells, S-phase cells (T = 0 h;
synchrony >97%), G2/M phase cells (T = 8 h; synchrony >93%), and G1/GO phase cells (T = 14 h; synchrony >74%). Within each profile, cells classified as
G1/G0 are depicted in dark blue, S-phase are depicted in orange, and G2/M are depicted in light blue. (b) Graph showing relative expression of miR17-92
pri-miRNAs in synchronized HeLa S phase, G2/M phase, and G1/G0 phase cell populations as assessed by qRT-PCR. (c) Graph showing relative expression
of miR17-5p mature miRNAs in synchronized HeLa S phase, G2/M phase, and G1/G0 phase cell populations as assessed by qRT-PCR (mean ± SEM).
(a) (b)
Phase of HeLa cell cycle
0
1
2
3
4
5
6
7
8
S phase G2/M phase G1/G0 phase
Relative expression
(c)
Relative expression
Phase of HeLa cell cycle
S phase G2/M phase G1/G0 phase
0
1
2
3
4
DNA content
Cell number
Asynchronous
DNA content
Cell number
T = 0 hrs
DNA content
Cell number
T = 8 hrs
DNA content
Cell number
T = 14 hrs
G2/M phase
G1/G0 phase
S phase
pri-miRNA
mature-miRNA
Genome Biology 2008, Volume 9, Issue 8, Article R127 Cloonan et al. R127.4
Genome Biology 2008, 9:R127
significantly enriched if its IPA score was more than four
standard deviations above the mean score determined for the
random gene lists.
Of the seven miRNAs in the cluster, only miR-17-5p and miR-
20a showed significant enrichment in any functional cate-
gory, with both showing enrichment in genes that encode
known cell cycle regulators, including four of the previously
verified mir-17-5p targets; E2F1, NCOA3, PCAF, and RBL2
(Figure 2a). Within the cell cycle category, there was noted
enrichment for genes associated with G1/S phase specific
functions (Figure 2b): cell cycle progression, arrest in G1
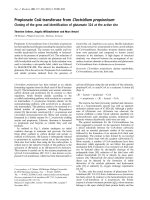
miR-17-5p is sufficient to drive a proliferative signal in HEK293T cellsFigure 2
miR-17-5p is sufficient to drive a proliferative signal in HEK293T cells. (a) Graph displaying the significance of functional enrichment for PicTar predicted
targets of miR-17-5p and miR-20a from the miR-17-92 cluster. Arrows indicate the mean significance of randomly selected gene sets of equivalent size, and
the grey boxes show ± 4 standard deviations. (b) Graph displaying the significance of enrichment for genes acting at the G1/S cell cycle boundary. (c)
Graph depicting the proliferation rates of HEK293T cells transiently transfected with miR-17-5p precursor dsRNA and those transfected with control
dsRNA. (d) Graph depicting proliferation rates of HEK293T cells stably over-expressing plasmid-expressed miR-17-5p and HEK293T cells stably selected
for the plasmid-control.
0.0
0.5
1.0
1.5
2.0
2.5
3.0
3.5
4.0
Cell cycle
progression
G1 phase S phase G2 phase G2/M
phase
Mitosis Meiosis Interphase
Cell cycle sub-category:
-log(significance)
miR-17-92 cluster
Functional category: cell cycle
0.0
0.5
1.0
1.5
2.0
2.5
3.0
3.5
4.0
4.5
5.0
miR-17-5p miR-17-3p miR-18 miR-19a miR-20a miR-19b-1 miR-92-1
(a)
-log(significance)
miR-17-5p
(b)
0
20 40 60
80
100 120
0.0
0.2
0.4
0.6
0.8
1.0
miR-17-5p #1
miR-17-5p #2
miR-17-5p #3
Control #1
Control #2
Control #3
Hours post seeding
MTT activity
(c) (d)
MTT activity
10nM control
10nM miR-17-5p
50nM control
50nM miR-17-5p
Hours post transfection
0
20 40 60
80
100
0.0
0.2
0.4
0.6
Genome Biology 2008, Volume 9, Issue 8, Article R127 Cloonan et al. R127.5
Genome Biology 2008, 9:R127
phase, and entry into S phase. The enrichment of all these cat-
egories was more than five standard deviations away from
what was seen for random sampling of similar sized sets of
targets. The complete list of G1/S-phase related predictions is
detailed in Additional data file 1. This analysis suggested that
miR-17-5p may act by targeting genes involved in the G1 to S
phase transition.
The miRNAs 17-5p and 20a share extensive sequence similar-
ity, reflected in the significant overlap between predicted tar-
gets, however Hayashita et al. [3] found that miR-20a could
not produce the hyper-proliferative phenotype in A549 cells.
We therefore chose to focus our study further on the miR-17-
5p-target network. We examined the effect of ectopic expres-
sion of miR-17-5p on HEK293T cell proliferation using a dou-
ble-stranded RNA (dsRNA) miR-17-5p precursor, or a dsRNA
negative control miRNA precursor. HEK293T cells have low
levels of endogenous miR-17-5p expression, and miR-17-5p
treated HEK293Ts proliferated faster post-transfection than
the control cells (Figure 2c). To confirm this phenotype, we
created vector based constructs with expression of miR-17-5p
and created independent stable HEK293T cell lines with
puromycin selection. The miR-17-5p activity of these cells was
confirmed by luciferase reporter activity (Additional data file
2). The proliferative rate of the stable miR-17-5p cell lines
(hereafter HEK293T-17-5p) was also significantly faster than
the parental vector sequence alone (HEK293T-control; Fig-
ure 2d). Taken together, these results demonstrate that over-
expression of miR-17-5p is sufficient to drive a proliferative
signal in HEK293T cells.
Over-expression of miR-17-5p alters the cell cycle
profile of HEK293T cells
We used flow cytometry to examine the DNA profiles of asyn-
chronous populations of HEK293T-17-5p and control cell
lines. HEK293T-17-5p cells differ significantly in their cell
cycle distribution when compared to the control cell lines
with a higher proportion of cells within S phase and less in
G1/G0 (Figure 3). These data are consistent with an early exit
from the G1/G0 stage, and can account for the rapid prolifer-
ation observed above. There was no observable difference in
cell size between these cell lines or wild-type HEK293T cells
as measured by flow cytometry forward scatter (data not
shown). These data support the prediction above that miR-
17-5p acts at the transition from G1 to S phase.
Validation of predicted binding sites by luciferase
assays
In order to dissect the mechanisms of the miR-17-5p prolifer-
ative response, it was necessary to determine the endogenous
mRNA targets of this miRNA. Predicted target sites were
cloned into the 3' untranslated region (UTR) of a luciferase
expressing vector, and transfected into the HEK293T 17-5p#1
stable cell line. Luciferase activity (directly proportional to
translation from the plasmid) was measured in the presence
of either a 2'-O-Methyl antisense oligoribonucleotide (ASO)
specific for miR-17-5p, or a scrambled sequence ASO. If the
luciferase expression of a test plasmid is inhibited by miRNA
binding, then the presence of a specific miRNA ASO should
result in an increase of luciferase activity. Figure 4a shows the
assay results for 121 binding sites from 46 genes. We confirm
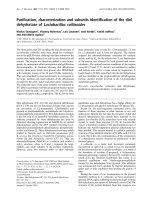
Over-expression of miR-17-5p alters the cell cycle profile of HEK293T cellsFigure 3
Over-expression of miR-17-5p alters the cell cycle profile of HEK293T cells. Graph and FACS plots displaying differences in cell cycle phases, as
determined by FACS analysis, between normal and miR-7-5p expressing HEK293T cells. Cells over-expressing miR-17-5p have an altered cell cycle profile,
with significantly less cells with G1/G0 DNA content, and significantly more with S-phase DNA content (mean ± SEM; asterisks indicate p ≤ 0.05 in a
Student's t-test).
Proportion of cells (%)
G1/G0 S G2/M
60
40
20
0
**
HEK293T cells
HEK293T + miR-17-5p cells
HEK293T HEK293T + miR-17-5p
Cell number
G1/G0 phase S phase G2/M phase
Cell number
DNA content
Genome Biology 2008, Volume 9, Issue 8, Article R127 Cloonan et al. R127.6
Genome Biology 2008, 9:R127
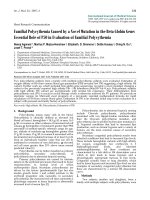
Validation of predicted binding sites by luciferase reporter assaysFigure 4
Validation of predicted binding sites by luciferase reporter assays. Synthetic oligonucleotides encoding 60 nucleotides that encompass predicted miRNA
binding sites were cloned into luciferase reporter vectors. (a) These constructs were co-transfected into HEK293T-17-5p cells with a β-galactosidase
expressing plasmid, and either a 17-5p 2'-O-Me ASO or a scrambled sequence ASO. Luciferase signals were normalized to β-galactosidase signals (as a
control for transfection efficiency), and the mean and standard error relative to the scrambled ASO control are shown. Constructs that show a significant
increase in luciferase expression with miR-17-5p ASO treatment (p ≤ 0.05 in a Student's t-test) are indicated in black. (b) Selected constructs were co-
transfected into HEK293T (wild-type cells that express very low levels of miR-17-5p) with a β-galactosidase expressing plasmid, and either a short dsRNA
precursor for miR-17-5p or a negative control dsRNA precursor. Mean and standard errors of luciferase signals normalized to β-galactosidase activity are
shown, and all sites except PPARA-B show significantly less luciferase activity with miR-17-5p treatment compared to control miRNA treatment (p ≤ 0.05
in a Student's t-test).
Relative luciferase activity
0.0
0.2
0.4
0.6
0.8
1
1.2
BCL2L11 IRF MAPK9 PCAF PPARA-B PPARA-C RBL1-A RBL1-B TSG101 NR4A3
GAB1 PKD1
PKD2-A PKD2-C
Control miRNA hsa-miR-17-5p
pMIR-REPORT constructs
(a)
(b)
0
0.5
1
1.5
2
2.5
3
APBB2-A
APBB2-B
APBB2-C
APP-A
APP-B
APP-C
APP-D
BCL2L11-A
BCL2L11-B
BCL2L11-C
BCL2L11-D
BCL2L11-E
CCND1-A
CCND1-B
CCND1-C
CCND1-D
CCND2-A
CCND2-B
CCNG2A
CCNG2-B
CDKN1A
CDKN1A-B
CDKN1A-C
CRK-A
CRK-B
CUL3-A
CUL3-B
CUL3-C
CUL3-D
DMTF1-A
DMTF1-B
E2F1-A
E2F1-B
E2F1-C
E2F3-A
E2F3-B
E2F5-A
EREG-A
EREG-B
EREG-C
EREG-D
FOXO1A-A
FOXO1A-B
FOXO1A-C
FOXO1A-D
FOXO1A-E
FOXO1A-F
GAB1-A
HAS2-A
HDAC4-A
HDAC4-B
HDAC4-C
HDAC4-D
HIF1-A
HIF1A-B
IRF1-A
KHDRBS1-A
KHDRBS1-B
KPNA2-A
MAP3K8-A
MAP3K8-B
MAPK9-A
MYCN-A
MYCN-B
NCOA3-A
NCOA3-B
NCOA3-C
NCOA3-D
NR4A3-A
NR4A3-B
NR4A3-C
PCAF-A
PCAF-C
PDGFRA-A
PDGFRA-B
PDGFRA-C
PKD1-A
PKD2-A
PKD2-B
PKD2-C
PKD2-D
PPARA-A
PPARA-B
PPARA-C
PPARA-D
PPARA-E
PPARA-F
PPARA-H
PTEN-A
RB1-A
RB1-B
RB1CC1-A
RB1CC1-B
RBBP7-A
RBL1-A
RBL1-B
RBL2-A
RBL2-B
RBL2-C
RNF111
SMAD7-A
STAT3-A
STAT3-B
STAT3-C
STAT3-D
TIMP2-A
TIMP2-B
TIMP2-B
TIMP2-C
TNXIP-A
TNXIP-B
TNXIP-C
TP53INP1-A
TP53INP1-B
TP53INP1-C
TP53INP1-D
TP53INP1-E
TP53INP1-F
TP53INP1-G
TSG101-A
WEE1-A
Relative luciferase activity
pMIR-REPORT constructs
Genome Biology 2008, Volume 9, Issue 8, Article R127 Cloonan et al. R127.7
Genome Biology 2008, 9:R127
interactions for NCOA3, and demonstrate an additional 18
targets of miR-17-5p, including GAB1, MAPK9, MYCN, PKD1,
PKD2, RBL1, and TSG101, all of which are known to be
involved in tumorigenesis and/or transformation of cells. As
an additional test, we also transfected a number of these con-
structs into wild-type HEK293T cells with either a dsRNA
miR-17-5p precursor, or a dsRNA negative control miRNA
precursor. From 14 constructs tested, we find 13 with signifi-
cantly less expression of luciferase when treated with the
miR-17-5p dsRNA compared to the same constructs treated
with the negative control dsRNA (Figure 4b). These data have
confirmed our results above, and additionally confirmed
BCL2L11 and PCAF as targets of miR-17-5p, all three of which
are also known to be involved with cancer development.
Although we did not confirm the known interactions of E2F1
and RBL2 in these assays, we note that the single-site
approach taken here will not detect a synergistic effect of mul-
tiple miRNA binding sites in the 3'UTR. Our assay shows that
both E2F1 and RBL2 have multiple sites with miR-17-5p
binding potential, although none reach significance individu-
ally. As we have confirmed the translational repression of
both E2F1 and RBL2 in this system (data not shown, and Fig-
ure 5a, respectively), we applied this threshold to our results,
and identified another four targets (APP, CDKN1A, EREG,
and CUL3) that may also be regulated by miR-17-5p.
MAPK9 translation is targeted by miR-17-5p
MAPK9 (more commonly known as JNK2) is an important
member of the mitogen activated protein kinase (MAPK)
family. MAPK9 is a negative regulator of cellular proliferation
through a protein-protein interaction with its substrate JUN,
targeting this transcription factor for protein-degradation.
Knockout of MAPK9 stabilizes the JUN protein, resulting in
increased CCND1 expression and rapid exit from G1 [23]. Our
finding that miR-17-5p is capable of interacting with
sequence in the 3'UTR of MAPK9 mRNA suggests that
MAPK9 could be an important contributor to the hyper-pro-
liferative phenotype caused by miR-17-5p. To examine this
further we assessed the level of endogenous MAPK9 and
CCND1 proteins after transient transfection with the miR-17-
5p plasmid. We used protein expression of RBL2 as a positive
control for miR-17-5p activity, and ACTB levels as a control
for loading (Figure 5a). We see RBL2 and MAPK9 protein lev-
els reduced in cells transfected with the miR-17-5p plasmid,
but not with the plasmid control. MAPK9 protein levels are
also significantly decreased in stable HEK293T-17-5p cell
lines (Figure 5b). Additionally, we see an increase in CCND1
protein expression, confirming that de-coupling of the MAPK
pathway from G1/S transition could contribute to our hyper-
proliferative phenotype.
miR-17-5p targets both suppressors and promoters of
cellular proliferation
Amongst the confirmed targets of miR-17-5p are several
inhibitors of cellular proliferation (such as TSG101, RBL1,
and MAPK9), and their suppression is consistent with the
pro-proliferative phenotype observed in HEK293T-17-5p
cells. Conversely, several known promoters of cellular prolif-
eration (such as MYCN, NCOA3, and NR4A3) were also found
to be targets of miR17-5p, results that are not consistent with
our pro-proliferative phenotype. In order to understand this
miR-17-5p targets MAPK9 translationFigure 5
miR-17-5p targets MAPK9 translation. (a) Immunoblot analysis of miR-17-
5p targets. Beta Actin (loading control), CCND1 and miR17-5p targets
RBL2 and MAPK9 were assessed in untransfected, vector transfected and
miR-17-5p transiently transfected lines. RBL2 and MAPK9 show lower
protein levels while CCDN1 protein levels were dramatically increased in
the miR17-5p expressing cell line. (b) Quantification of MAPK9
expression levels (assessed by immunoblot) in HEK293T-17-5p cell lines,
and vector control cell lines grown under the same conditions. Mean and
standard errors of independent experiments are shown (p = 0.02 in a
Student's t-test).
untransfected
pSilencer “negative”
pSilencer “miR-17-5p”
CCND1
MAPK9
RBL2
ACTB
(a)
(b)
HEK293T-17-5pHEK293T-control
1.2
1.0
0.8
0.6
0.4
0.2
0.0
Relative MAPK9 protein expression
Genome Biology 2008, Volume 9, Issue 8, Article R127 Cloonan et al. R127.8
Genome Biology 2008, 9:R127
apparent contradiction, we used IPA to examine known rela-
tionships between the targets of miR-17-5p (Additional data
file 3) [24]. We find that this is a highly interacting network,
comprising of many known transcriptional regulators that
have known protein-DNA interactions with other members of
the network.
In mammalian cells, miRNAs generally affect the protein out-
put of a gene by inhibiting the translation of the mRNA. How-
ever, by changing the levels of a transcriptional regulator, a
miRNA can indirectly affect the levels of mRNAs from other
genes, which may include other targets of the miRNA. If the
mRNA levels of a miRNA target are increased sufficiently,
then this target will be able to overcome the effects of transla-
tional suppression, and maintain or increase protein levels.
In the case of miR-17-5p, if proliferation-inhibitors suppress
the mRNA levels of proliferation-promoters, then the conse-
quential reduction of inhibitor-protein would lead to an
increased level of promoter-mRNA, stabilizing the pro-prolif-
erative signal. An example of this exists in our network -
STAT3 protein (proliferation-inhibitor) inhibits the tran-
scription of IRF1 mRNA (proliferation-promoter) [25].
We used qRT-PCR to examine the mRNA levels of 20 con-
firmed miR-17-5p targets, 3 possible miR-17-5p targets, and 7
other cell cycle related genes (CCND1, CCND2, CCNG2, E2F3,
E2F5, RB1, and WEE1) in HEK293T cells with both transient
(Figure 6a) and stable (Figure 6b) over-expression miR-17-
5p. By examining both the transient and stable states, we are
able to discriminate secondary effects of the miRNA (changes
arising from miRNA suppression of transcriptional regula-
tors) from tertiary effects (changes arising from secondary
changes). For example, IRF1 mRNA was increased 2.6-fold in
transiently transfected lines, likely to result as a secondary
effect of STAT3 translational suppression (levels of STAT3
mRNA did not change in either transient or stable systems).
Other changes in mRNA levels were clearly tertiary effects,
such as E2F3 and WEE1 mRNA levels.
Consistent with the miR-17-5p oncogenic potential of consti-
tutive expression, most anti-proliferative targets (12 in total)
displayed either down-regulation or little change to mRNA
levels, while pro-proliferative target mRNAs (8 in total) dis-
played marked increases in expression of 5-fold or greater in
stable cell lines, leading to a net pro-proliferative signal (Fig-
ure 7a).
Discussion
Understanding the mechanism through which the miR-17-92
locus is able to promote cellular proliferation and tumorigen-
esis in multiple cell lines and tissues is essential if miRNAs
from this polycistron are to be seriously considered as thera-
peutic targets. Here we have demonstrated the ability of a sin-
gle miRNA from this locus, miR-17-5p, to drive a hyper-
proliferative phenotype, acting to suppress the G1/S cell cycle
checkpoint and dramatically increase the proliferation rate of
the cell. We reveal that miR-17-5p targets a large genetic
network of interacting proteins that act co-ordinately to con-
trol the transition from G1 to S phase. Rather than "fine tun-
ing" cell cycle progression as previously suggested [26], we
propose that this coordinated targeting allows miR-17-5p to
efficiently de-couple negative regulators of the MAPK signal-
ing cascade, promoting growth in HEK293T cells (Figure 7a).
If the primary function of miR-17-5p is to interfere with cell
cycle regulation, then we might expect: that the primary tran-
script encoding miR-17-5p and the mature miRNA are cell
cycle regulated; and that its maximal expression will be at a
time prior to the mature miRNAs maximal activity. For exam-
ple, the G1 specific proteins CCND1 and CCND2 have their
peak mRNA expression in G2/M [27], which allows time for
transport and translation before the mature protein is
required. Similarly, the process of miRNA maturation
involves multiple processing and transportation steps, and
non-coordinated dynamic expression of miRNAs from the
miR-17-92 cluster suggests that this process is highly regu-
lated [6,16,20]. Indeed, we find that the locus is cell cycle reg-
ulated, and the maximal expression of mature miR-17-5p is in
the G2/M phase of HeLa cells. This timing allows transla-
tional suppression of proteins that affect the activity of pro-
teins that start to accumulate in this phase, and confirms a
likely functional action upon the G1/S transition boundary.
The miR-17-92 locus is known to be regulated by the MYC
oncogene, and the E2F family of transcription factors
[5,17,28]. Phase-enriched expression of miR-17-92 was not
previously observed in serum stimulated primary fibroblasts
[5]; however, the typical degree of synchrony achievable with
this cell type (60-80%) may have prevented detection of
phase-enrichment within this experiment [27,29,30]. In our
study, we observed the lowest expression of this gene during
S-phase. Interestingly, miR-17-92 expression also decreased
(non-significantly) at 16 hours in synchronized fibroblasts
[5], which is a time-point consistent with the induction of S-
phase in this cell type [31]. Although not tested here, it seems
likely that any periodicity of the miR-17-92 locus would be
driven by the cell-cycle regulated E2F family of transcription
factors [27] rather than the transiently expressed MYC [32].
Regulation of the G1/S transition by miRNAs has previously
been reported as essential for germ line stem cell division in
Drosophila melanogaster, allowing stem cells to proliferate
in an environment where most other cells are quiescent [33].
Interestingly, the Drosophila bypass appears to be mediated
through the Dap protein, an orthologue of human CDKN1A.
In our study, CDKN1A was found to be a possible target of
miR-17-5p directly, but more importantly was central to our
genetic network, with at least five miR-17-5p targets acting to
influence the levels of this protein (Figure 7). Consistent with
a similar endogenous function in vertebrates, the miR-17-92
locus is highly expressed in mouse embryonic stem cells and
Genome Biology 2008, Volume 9, Issue 8, Article R127 Cloonan et al. R127.9
Genome Biology 2008, 9:R127
chicken embryos, with expression levels decreasing during
development and differentiation [34,35]. Two recent studies
also show that expression of this miRNA is reduced when
cells exit the cell cycle. The miR-17-92 cluster of miRNAs is
down-regulated in female primordial germ cells as they enter
meiosis (and exit from their normal, rapidly proliferating
state) [36]. In B cells, expression of miR-17-5p is critical for
early B cell development, but expression is greatly reduced
upon B cell maturation, also marked by exit from the cell cycle
[37].
Whilst miR-17-5p is capable of interacting with a number of
known promoters of cellular proliferation, the mRNA levels
of these genes in the stable system are greatly increased, lead-
ing to counteraction of the activity of miR-17-5p translational
repression. This discrepancy cannot be explained by factors
miR-17-5p perturbation of the transcriptional regulator networkFigure 6
miR-17-5p perturbation of the transcriptional regulator network. qRT-PCR analysis of G1/S network mRNA levels, including 20 confirmed targets of miR-
17-5p. (a) Cells transiently transfected with miR-17-5p dsRNA. (b) Cells with stable over-expression of plasmid-encoded miR-17-5p. In each case, the
level of expression has been normalized to HPRT, and the means and standard errors are shown relative to the negative control.
(a)
BCL2L11
CCNG2
CDKN1A
E2F3
E2F5
GAB1
IRF1
MAP3K8
MAPK9
MYCN
NR4A3
PCAF
PDK2
PTEN
TSG101
CCND2
FOX01A
WEE1
CCND1
PDK1
RB1
HIF1A
RBL2
APP
PPARA
RBL1
STAT3
CRK
E2F1
NCOA3
Relative expression
0.0
0.1
1.0
10.0
100.0
(b)
BCL2L11
CCNG2
CDKN1A
E2F3
E2F5
GAB1
IRF1
MAP3K8
MAPK9
MYCN
NR4A3
PCAF
PDK2
PTEN
TSG101
CCND2
FOX01A
WEE1
CCND1
PDK1
RB1
HIF1A
RBL2
APP
PPARA
RBL1
STAT3
CRK
E2F1
NCOA3
Relative expression
0.0
0.1
1.0
10.0
100.0
Genome Biology 2008, Volume 9, Issue 8, Article R127 Cloonan et al. R127.10
Genome Biology 2008, 9:R127
Figure 7
Network model summarizing the role of miR-17-5p in promoting cellular proliferation. (a) An integrated network model of results presented in this study.
Each node present is either a possible (light green) or a confirmed/literature supported target of miR-17-5p (dark green). The shape of each node reflects
whether the gene product encodes a pro-proliferative signal (square) or anti-proliferative signal (circle). The edges represent published interactions
between nodes and are classified as either activation (arrowheads) or inhibition (perpendicular ends). All edges are supported by at least one reference
from the literature. Finally, nodes whose mRNA levels have been examined by qRT-PCR appear in the grey boxes, and those with similar expression
profiles are grouped together. This analysis shows that while miR-17-5p targets both pro- and anti-proliferative targets, pro-proliferative targets are
specifically up-regulated in the HEK293T-17-5p network. (b) A proposed model depicting the ability of miR-17-5p to act as both a tumor suppressor and
an oncogene, depending on the cellular context, and using the same color and shape schema as above. In a situation where pro-proliferative genes
dominate (left), suppression of anti-proliferative targets is reinforced by removal of self-regulatory signals and increased suppression by pro-proliferative
regulators. These signals combine and lead to a net proliferative (oncogenic) outcome. In situations where anti-proliferative genes dominate (right),
suppression of pro-proliferative signals is reinforced, leading to a net anti-proliferative signal. In this case, removal of miR-17-5p results in a pro-
proliferative signal - a classic tumor suppressor outcome.
No change or down-
regulated mRNA
Up-regulated mRNA
Promoter of cellular proliferation
Inhibitor of cellular proliferation
Possible target of miR-17-5p
Target of miR-17-5p
(a)
(b)
miR-17-5p
Proliferation
miR-17-5p
Proliferation
Genome Biology 2008, Volume 9, Issue 8, Article R127 Cloonan et al. R127.11
Genome Biology 2008, 9:R127
that interfere with miRNA binding, as the cells used to test
miRNA-mRNA interactions were also used to assay endog-
enous mRNA and protein levels. Rather, the compensatory
increase of mRNA levels is likely due to the combinatorial
effect of withdrawing a number of important transcriptional
regulators. This highlights the importance of considering bio-
logical phenotypes as the result of genetic networks subject to
multiple layers of regulation, rather than the overly simplistic
view of single molecular interactions driving phenotypes.
This network model can also explain the ability of miR-17-5p
to act as an oncogene or a tumor suppressor in different cel-
lular contexts, dependant on the expression of other tran-
scriptional regulators. In cell systems where the expression of
the proliferation-promoters dominates, miR-17-5p would
stabilize the pro-proliferative signal by removing prolifera-
tion-inhibitors, and increasing the mRNA levels of prolifera-
tion-promoters. Conversely, in systems where proliferation-
inhibitors dominate, withdrawal of miR-17-5p would lead to
increased proliferation-promoters and decreased mRNA lev-
els of proliferation-inhibitors (Figure 7b).
We have uncovered a large genetic network in this study,
although it is likely that this does not represent the complete
story. Only genes known to be involved with the cell cycle
were considered for this analysis, and as IPA interactions are
based only on published data, little studied molecules, or mol-
ecules not previously associated with progression of the cell
cycle are likely to be overlooked. Novel components of this
network are likely to be identified by dual interactions with
miR-17-5p and its target genes. The methods of pathway anal-
ysis presented here provide a unique and rapid approach to
the discovery of miRNA function, regardless of how few
miRNA-mRNA interactions have been previously described.
Conclusion
We find that miR-17-92 is a cell cycle regulated locus, and a
single miRNA from this cluster, miR-17-5p, is sufficient to
drive a hyper-proliferative phenotype in HEK293T cells. This
miRNA acts to suppress the G1/S cell cycle checkpoint and
dramatically increase the proliferation rate of the cell by tar-
geting a large genetic network of interacting proteins. This
coordinated targeting allows miR-17-5p to efficiently de-cou-
ple negative regulators of the MAPK signaling cascade, pro-
moting growth in HEK293T cells. Targeting of both
proliferation-promoters and proliferation-inhibitors allows
this miRNA to act as both a tumor suppressor and an onco-
gene in different cellular contexts.
Materials and methods
Network and functional analyses
miRNA-mRNA interactions were predicted by PicTar [38].
Sets of 1,000 random genes were generated using the random
gene selection tool [39]. Lists of GenBank gene identifiers
were uploaded into IPA [40]. Each gene identifier was
mapped to its corresponding gene object in the Ingenuity
Pathways Knowledge Base. The Functional Analysis tool
identified the biological functions that were most represented
in data sets uploaded. Although IPA uses a Fischer's exact test
to calculate a p-value, we did not use this to determine the sig-
nificance of this enrichment. Instead, the mean and standard
deviation of the negative log of the p-values derived from ran-
dom gene sets was calculated for each biological function
tested. A biological function was considered to be signifi-
cantly enriched if the negative log of the p-value was more
than four standard deviations away from the mean for that
function.
Plasmid construction
Predicted target sites of miR-17-5p were cloned into the SpeI
and HindIII sites of pMIR-REPORT Luciferase (Ambion,
Austin, TX, USA). Synthetic oligos corresponding to 60
nucleotides surrounding the target sequence were annealed
before ligation into the pMIR plasmid. To create plasmids
expressing miR-17-5p, synthetic oligos were annealed and
ligated into the BamH1 and HindIII sites of pSilencer 4.1
CMV-puro (Ambion). A list of all primers used is available in
Additional data file 4. All constructs were verified by
sequencing.
Selection of stable pSilencer cell lines
HEK293T cells were maintained in DMEM (Invitrogen,
Mount Waverley, VIC, Australia) containing 10% (v/v) fetal
calf serum, in a 5% CO
2
atmosphere at 37°C. Cells were trans-
fected with either pSilencer-17-5p (HEK293T-17-5p) or the
parent pSilencer plasmid (HEK293T-control) using Effectene
(Qiagen, Doncaster, VIC, Australia) according to manufac-
turer's instructions. After 24 h, puromycin selection began at
500 ng/ml. After one week, selection pressure was increased
to 1 μg/ml puromycin. Individual colonies were selected two
weeks post-transfection, and tested for miRNA activity (Addi-
tional data file 2).
MTT cell proliferation assays
HEK293T cells were transiently transfected with either 10 or
50 nM of the appropriate pre-miR miRNA precursor
(Ambion), using HiPerfect (Qiagen) according to the manu-
facturer's instructions. Stable pSilencer cell lines were plated
at 1 × 10
4
cells per well. MTT (3-[4,5-dimethylthiazol-2-yl]-
2,5-diphenyl tetrazolium bromide) activity was assayed using
a Cell Growth Determination Kit (Sigma-Aldrich, Castle Hill,
NSW, Australia) according to the manufacturer's instructions
and detected on a PowerWave XS spectrophotometer
(BioTek, Winooski, VT, USA). Doubling times were calculated
from best-fit curves generated in GraphPad Prism 4 (Graph-
pad Software, La Jolla, CA, USA).
Cell cycle blocks and synchronization
Thymidine
HEK293T-17-5p and HEK293T-control cells were treated
with 2.5 mM thymidine (Sigma-Aldrich) for 16 h, released
Genome Biology 2008, Volume 9, Issue 8, Article R127 Cloonan et al. R127.12
Genome Biology 2008, 9:R127
into fresh media for 8 h, and treated again with 2.5 mM thy-
midine for another 16 h.
Hydroxyurea
HEK293T-17-5p and HEK293T-control cells were incubated
with 2 mM hydroxyurea (Sigma-Aldrich) for 16 h.
Serum starvation
HEK293T-17-5p and HEK293T-control cells were incubated
in DMEM with no fetal calf serum for 48 h. HeLa cells were
synchronized by incubation for 18 h with 2.5 mM thymidine
(Sigma-Aldrich), released into fresh media for 8 h, and
treated again with 2.5 mM thymidine for another 18 h. To
obtain synchronized populations, these cells were then
released for 0 h (S phase), 8 h (G2/M), and 14 h (G1/G0).
Chemically synchronized populations were verified by flow
cytometry.
Flow cytometry
All cells were harvested and fixed in 70% ethanol at -20°C
overnight, then resuspended in buffer (5 mM EDTA, PBS, pH
7.4) approximately 1 h prior to analysis. DNA was stained
using 40 μg/ml propidium iodide (Sigma-Aldrich), and RNA
was removed using 400 μg/ml RNase A (Sigma-Aldrich).
Cells were filtered through 35 μm cell strainer mesh (Becton
Dickinson, North Ryde, NSW, Australia) and analyzed on
Becton Dickinson LSR II flow cytometer fitted with 488 nm
laser. Cell data were gated using WinList v6.0 and analyzed in
Modfit LT v3.0, both programs from Verity Software House
(Topsham, ME, USA).
Luciferase assays of potential miRNA binding sites
HEK293T-17-5p#1 cells were co-transfected with 50 ng of a
pMIR-REPORT Luciferase construct, 50 ng of pMIR-
REPORT β-galactosidase (Ambion), and 10 pmol of 2'-O-Me
ASOs. Anti-17-5p and control sequences were previously
described [5]. After transfection, cells were incubated for 22-
24 h prior to assaying. For transient expression assays with
dsRNA, HEK293T cells were transfected as above, substitut-
ing either 10 or 50 nM of the appropriate pre-miR miRNA
precursor (Ambion) for ASOs. After transfection, cells were
incubated for 42 h prior to harvesting. Luciferase activity was
assayed using the Luciferase Assay System (Promega Corpo-
ration, Alexandria NSW, Australia), and detected on a Wallac
1420 luminometer (Perkin Elmer, Waltham, MA, USA). β-
Galactosidase activity was determined using the β-Galactosi-
dase Enzyme Assay System (Promega), and detected on a
PowerWave XS spectrophotometer (BioTek). Luciferase
activity was normalized to β-galactosidase activity in each
well. Assays were conducted in triplicate, and independently
repeated three times.
RNA purification and qRT-PCR analyses
Total RNA was purified from cell pellets using either an RNe-
asy Mini Kit (Qiagen), or a miRNeasy Mini Kit (Qiagen), and
in both cases RNA integrity was assessed using an Agilent
Bioanalyzer 2100. For mRNA, cDNA was synthesized using
SuperScript III (Invitrogen), and qRT-PCR was performed
using SYBR green PCR master-mix (Applied Biosystems,
Scoresby, VIC, Australia). For mature miRNA, cDNA was
synthesized using a Taqman MicroRNA RT Kit (Applied Bio-
systems), and qRT-PCR was performed using a miR-17-5p
MicroRNA Taqman assay (Applied Biosystems). All RT-PCR
was performed on an Applied Biosystems 7000 Sequence
Detection System. Control reactions without reverse tran-
scriptase were performed to check for DNA contamination.
Details of all primers used are available in Additional data file
4.
Antibodies and immunoblots
Cells were washed twice with PBS and resuspended in sample
buffer (50 mM Tris-Cl pH 6.8; 100 mM dithiothreitol; 2% (w/
v) SDS; 10% (v/v) glycerol), and allowed to lyse on ice for 10
minutes. After lysis, samples were cleared by centrifugation at
10,000 × g for 10 minutes at 4°C. Samples were analyzed by
immunoblot using standard procedures [41]. Rabbit anti-
actin (Sigma-Aldrich) was used at 1 in 200. Rabbit anti-cyclin
D1 (SP4; Neomarkers Inc, Freemont, CA, USA), rabbit anti-
SAPK/JNK (56G8, Cell Signaling Technology, Boston, MA,
USA), and mouse anti-Rb2 (10/Rb2; Becton Dickinson) were
all used at 1 in 500. Goat-anti-mouse-HRP and goat-anti-rab-
bit-HRP (Bio-Rad, Gladesville, NSW, Australia) were used at
1 in 2,000, and detected using the SuperSignal West Pico
Chemiluminescent Substrate (Pierce Biotechnology, Murar-
rie, QLD, Australia).
Abbreviations
ASO, 2'-O-Methyl antisense oligoribonucleotide; DMEM,
Dulbecco's modified Eagle's media; dsRNA, double-stranded
RNA; IPA, Ingenuity Pathways Analysis; MAPK, mitogen
activated protein kinase; miRNA, microRNA; MTT, 3-[4,5-
dimethylthiazol-2-yl]-2,5-diphenyl tetrazolium bromide;
PBS, phosphate-buffered saline; qRT-PCR, quantitative real
time PCR; UTR, untranslated region.
Authors' contributions
NC and SG conceived and coordinated the study, and drafted
the manuscript. NC, SG, and AF participated in experimental
design and data analysis. NC analyzed miRNA function, and
performed MTT assays. BG synchronized the HeLa cells. MB
and BG generated the DNA profiles. SW, MB, GK, and WC
performed qRT-PCR. AS, SW, WC, and NC cloned miRNA
target sites. AS and NC generated stable cell lines, and per-
formed luciferase and β-galactosidase assays. AS, SW, and NC
performed western blots. All authors read and approved the
final manuscript.
Genome Biology 2008, Volume 9, Issue 8, Article R127 Cloonan et al. R127.13
Genome Biology 2008, 9:R127
Additional data files
The following additional data are available with the online
version of this paper. Additional data file 1 is a table listing the
G1/S associated mRNAs predicted to be targets of miR-17-5p.
Additional data file 2 is a figure showing the validation of
miR-17-5p activity in stable HEK293T cell lines over-express-
ing miR-17-5p. Additional data file 3 is a figure depicting the
interactions between miR-17-5p targets and cell cycle compo-
nents. An interactive version of this figure where literature
support and gene/protein information can be viewed through
IPA is available [24]. Additional data file 4 is table listing all
primers used in this study.
Additional data file 1G1/S associated mRNAs predicted to be targets of miR-17-5pG1/S associated mRNAs predicted to be targets of miR-17-5p.Click here for fileAdditional data file 2Validation of miR-17-5p activity in stable HEK293T cell lines over-expressing miR-17-5pValidation of miR-17-5p activity in stable HEK293T cell lines over-expressing miR-17-5p.Click here for fileAdditional data file 3Interactions between miR-17-5p targets and cell cycle componentsAn interactive version of this figure where literature support and gene/protein information can be viewed through IPA is available [24].Click here for fileAdditional data file 4Primers used in this studyPrimers used in this study.Click here for file
Acknowledgements
NC is supported by a UQ postdoctoral research fellowship, MKB is a recip-
ient of an Australian Postgraduate Award, and SMG is an Australian
NHMRC Senior Research Fellow. We are also grateful for the excellent
technical assistance provided by QBI flow cytometry staff, particularly
Geoff Osbourne, and Virginia Nink. This work was funded in part by
NHMRC project grant number 456140. We thank Casey Spiller for the gift
of mouse anti-RB2 antibody.
References
1. Kloosterman WP, Plasterk RHA: The diverse functions of Micro-
RNAs in animal development and disease. Developmental Cell
2006, 11:441-450.
2. He L, Thomson JM, Hemann MT, Hernando-Monge E, Mu D, Good-
son S, Powers S, Cordon-Cardo C, Lowe SW, Hannon GJ, Hammond
SM: A microRNA polycistron as a potential human oncogene.
Nature 2005, 435:828-833.
3. Hayashita Y, Osada H, Tatematsu Y, Yamada H, Yanagisawa K, Tom-
ida S, Yatabe Y, Kawahara K, Sekido Y, Takahashi T: A polycistronic
microRNA cluster, miR-17-92, is overexpressed in human
lung cancers and enhances cell proliferation. Cancer Research
2005, 65:9628-9632.
4. Lee EJ, Baek M, Gusev Y, Brackett DJ, Nuovo GJ, Schmittgen TD: Sys-
tematic evaluation of microRNA processing patterns in tis-
sues, cell lines, and tumors. RNA 2008, 14:35-42.
5. O'Donnell KA, Wentzel EA, Zeller KI, Dang CV, Mendell JT: c-Myc-
regulated microRNAs modulate E2F1 expression. Nature
2005, 435:839-843.
6. Venturini L, Battmer K, Castoldi M, Schultheis B, Hochhaus A, Muck-
enthaler MU, Ganser A, Eder M, Scherr M: Expression of the miR-
17-92 polycistron in chronic myeloid leukemia (CML)
CD34(+) cells. Blood 2007, 109:4399-4405.
7. Landais S, Landry S, Legault P, Rassart E: Oncogenic potential of
the miR-106-363 cluster and its implication in human T-cell
leukemia. Cancer Research 2007, 67:5699-5707.
8. Rinaldi A, Poretti G, Kwee I, Zucca E, Catapano CV, Tibiletti MG, Ber-
toni F: Concomitant MYC and microRNA cluster miR-17-92
(C13orf25) amplification in human mantle cell lymphoma.
Leukemia & Lymphoma 2007, 48:410-412.
9. Kutay H, Bai SM, Datta J, Motiwala T, Pogribny I, Frankel W, Jacob ST,
Ghoshal K: Downregulation of miR-122 in the rodent and
human hepatocellular carcinomas. Journal of Cellular Biochemistry
2006, 99:671-678.
10. Gottardo F, Liu CG, Ferracin M, Calin GA, Fassan M, Bassi P, Sevig-
nani C, Byrne D, Negrini M, Pagano F, Gomella LG, Croce CM, Baffa
R: Micro-RNA profiling in kidney and bladder cancers. Uro-
logic Oncology-Seminars and Original Investigations 2007, 25:387-392.
11. Volinia S, Calin GA, Liu CG, Ambs S, Cimmino A, Petrocca F, Visone
R, Iorio M, Roldo C, Ferracin M, Prueitt RL, Yanaihara N, Lanza G,
Scarpa A, Vecchione A, Negrini M, Harris CC, Croce CM: A micro-
RNA expression signature of human solid tumors defines
cancer gene targets. Proceedings of the National Academy of Sciences
of the United States of America 2006, 103:2257-2261.
12. Hossain A, Kuo MT, Saunders GF: Mir-17-5p regulates breast
cancer cell proliferation by inhibiting translation of AIB1
mRNA. Molecular and Cellular Biology 2006, 26:8191-8201.
13. Krek A, Grun D, Poy MN, Wolf R, Rosenberg L, Epstein EJ, MacMe-
namin P, da Piedade I, Gunsalus KC, Stoffel M, Rajewsky N: Combi-
natorial microRNA target predictions. Nature Genetics 2005,
37:495-500.
14. Lewis BP, Burge CB, Bartel DP: Conserved seed pairing, often
flanked by adenosines, indicates that thousands of human
genes are microRNA targets. Cell 2005, 120:15-20.
15. Cui J-W, Li Y-J, Sarkar A, Brown J, Tan Y-H, Premyslova M, Michaud
C, Iscove N, Wang G-J, Ben-David Y: Retroviral insertional acti-
vation of the Fli-3 locus in erythroleukemias encoding a clus-
ter of microRNAs that convert Epo-induced differentiation
to proliferation. Blood 2007, 110:2631-2640.
16. Lu Y, Thomson JM, Wong HYF, Hammond SM, Hogan BLM: Trans-
genic over-expression of the microRNA miR-17-92 cluster
promotes proliferation and inhibits differentiation of lung
epithelial progenitor cells. Developmental Biology 2007,
310:442-453.
17. Sylvestre Y, De Guire V, Querido E, Mukhopadhyay UK, Bourdeau V,
Major F, Ferbeyre G, Chartrand P: An E2F/miR-20a autoregula-
tory feedback loop. Journal of Biological Chemistry 2007,
282:2135-2143.
18. Fontana L, Pelosi E, Greco P, Racanicchi S, Testa U, Liuzzi F, Croce
CM, Brunetti E, Grignani F, Peschle C: MicroRNAs 17-5p-20a-
106a control monocytopoiesis through AML1 targeting and
M-CSF receptor upregulation. Nature Cell Biology 2007,
9:775-U790.
19. Tagawa H, Karube K, Tsuzuki S, Ohshima K, Seto M: Synergistic
action of the microRNA-17 polycistron and Myc in aggres-
sive cancer development. Cancer Science 2007, 98:1482-1490.
20. Triboulet R, Mari B, Lin YL, Chable-Bessia C, Bennasser Y, Lebrigand
K, Cardinaud B, Maurin T, Barbry P, Baillat V, Reynes J, Corbeau P,
Jeang KT, Benkirane M:
Suppression of microRNA-silencing
pathway by HIV-1 during virus replication. Science 2007,
315:1579-1582.
21. Dews M, Homayouni A, Yu D, Murphy D, Sevignani C, Wentzel E,
Furth EE, Lee WM, Enders GH, T Mendell J, Thomas-Tikhonenko A:
Augmentation of tumor angiogenesis by a Myc-activated
microRNA cluster. Nature Genetics 2006, 38:1060-1065.
22. Lewis BP, Shih Ih, Jones-Rhoades MW, Bartel DP, Burge CB: Predic-
tion of Mammalian MicroRNA Targets. Cell 2003,
115:787-798.
23. Sabapathy K, Hochedlinger K, Nam SY, Bauer A, Karin M, Wagner EF:
Distinct roles for JNK1 and JNK2 in regulating JNK activity
and c-Jun-dependent cell proliferation. Molecular Cell 2004,
15:713-725.
24. Expression Genomics Laboratory [http://grim
mond.imb.uq.edu.au/miR-17-5p/supp.html]
25. Ho HH, Ivashkiv LB: Role of STAT3 in Type I Interferon
Responses: NEGATIVE REGULATION OF STAT1-
DEPENDENT INFLAMMATORY GENE ACTIVATION. J
Biol Chem 2006, 281:14111-14118.
26. Carleton M, Cleary MA, Linsley PS: MicroRNAs and cell cycle
regulation. Cell Cycle 2007, 6:2127-2132.
27. Whitfield ML, Sherlock G, Saldanha AJ, Murray JI, Ball CA, Alexander
KE, Matese JC, Perou CM, Hurt MM, Brown PO, Botstein D: Identi-
fication of genes periodically expressed in the human cell
cycle and their expression in tumors. Molecular Biology of the Cell
2002, 13:1977-2000.
28. Woods K, Thomson JM, Hammond SM: Direct regulation of an
oncogenic micro-RNA cluster by E2F transcription factors.
Journal of Biological Chemistry 2007, 282:2130-2134.
29. Fonagy A, Swiderski C, Wilson A, Bolton W, Kenyon N, Freeman JW:
Cell cycle regulated expression of nucleolar antigen P120 in
normal and transformed human fibroblasts. Journal of Cellular
Physiology 1993, 154:16-27.
30. Tobey RA, Valdez JG, Crissman HA: Synchronization of human
diploid fibroblasts at multiple stages of the cell cycle. Experi-
mental Cell Research; DOE Project 1988, 179(2):400-416.
31. Iyer VR, Eisen MB, Ross DT, Schuler G, Moore T, Lee JC, nbsp F,
Trent JM, Staudt LM, Hudson J Jr, Boguski MS, Lashkari D, Shalon D,
Botstein D, Brown PO: The Transcriptional Program in the
Response of Human Fibroblasts to Serum. Science 1999,
283:83-87.
32. Oswald F, Lovec H, Moroy T, Lipp M: E2f-Dependent Regulation
of Human Myc - Transactivation by Cyclin-D1 and Cyclin-a
Overrides Tumor-Suppressor Protein Functions. Oncogene
1994, 9:2029-2036.
33. Hatfield SD, Shcherbata HR, Fischer KA, Nakahara K, Carthew RW,
Genome Biology 2008, Volume 9, Issue 8, Article R127 Cloonan et al. R127.14
Genome Biology 2008, 9:R127
Ruohola-Baker H: Stem cell division is regulated by the micro-
RNA pathway. Nature 2005, 435:974-978.
34. Darnell DK, Kaur S, Stanislaw S, Konieczka JK, Yatskievych TA, Antin
PB: MicroRNA expression during chick embryo
development. Developmental Dynamics 2006, 235:3156-3165.
35. Thomson JM, Parker J, Perou CM, Hammond SM: A custom micro-
array platform for analysis of microRNA gene expression.
Nature Methods 2004, 1:47-53.
36. Hayashi K, Chuva de Sousa Lopes SM, Kaneda M, Tang F, Hajkova P,
Lao K, O'Carroll D, Das PP, Tarakhovsky A, Miska EA, Surani MA:
MicroRNA Biogenesis Is Required for Mouse Primordial
Germ Cell Development and Spermatogenesis. PLoS ONE
2008, 3:e1738.
37. Ventura A, Young AG, Winslow MM, Lintault L, Meissner A, Erkeland
SJ, Newman J, Bronson RT, Crowley D, Stone JR, Jaenisch R, Sharp
PA, Jacks T: Targeted Deletion Reveals Essential and Overlap-
ping Functions of the miR-17~92 Family of miRNA Clusters.
Cell 2008, 132:875-886.
38. PicTar [ />39. RSA-tools - random gene selection [ />random-genes_form.cgi]
40. Ingenuity Systems [ />41. Sambrook J, Russell D: Molecular Cloning: A laboratory Man-
ual. 3rd edition. New York: Cold Spring Harbor Laboratory Press;
2001.