Báo cáo y học: " Gene expression regulation in the context of mouse interspecific mosaic genomes" pdf
Bạn đang xem bản rút gọn của tài liệu. Xem và tải ngay bản đầy đủ của tài liệu tại đây (1.58 MB, 18 trang )
Genome Biology 2008, 9:R133
Open Access
2008L'Hôteet al.Volume 9, Issue 8, Article R133
Research
Gene expression regulation in the context of mouse interspecific
mosaic genomes
David L'Hôte
*†‡§
, Catherine Serres
‡
, Reiner A Veitia
*†‡
,
Xavier Montagutelli
¶
, Ahmad Oulmouden
§
and Daniel Vaiman
*†‡¥
Addresses:
*
U567 Department of Genetics and Development, Institut Cochin, INSERM, 24 rue du Faubourg St Jacques, Paris, 75014, France.
†
UMR8104 Department of Genetics and Development, Institut Cochin, CNRS, 24 rue du Faubourg St Jacques, Paris, 75014, France.
‡
Faculté
de médecine, Hôpital Cochin, Université Paris Descartes, 24 rue du Faubourg St Jacques, Paris, 75014, France.
§
UMR 1061, Unité de Génétique
Moléculaire Animale, INRA/Université de Limoges, Université de Limoges, 123 Av. Albert Thomas, Limoges, 87060, France.
¶
Unité de
Génétique des Mammifères, Institut Pasteur, 25 rue du Docteur Roux, Paris, 75724, France.
¥
Department of Animal Genetics, INRA, Domaine
de Vilvert, Jouy-en-Josas, 78352, France.
Correspondence: Daniel Vaiman. Email:
© 2008 L'Hôte et al.; licensee BioMed Central Ltd.
This is an open access article distributed under the terms of the Creative Commons Attribution License ( which
permits unrestricted use, distribution, and reproduction in any medium, provided the original work is properly cited.
Gene regulation in mouse mosaic genomes<p>The testis transcriptome of mouse strains containing homozygous segments of <it>Mus spretus</it> origin in a <it>Mus musculus</it> background was analyzed.</p>
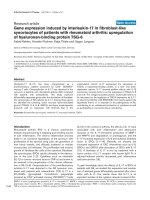
Abstract
Background: Accumulating evidence points to the mosaic nature of the mouse genome.
However, little is known about the way the introgressed segments are regulated within the context
of the recipient genetic background. To address this question, we have screened the testis
transcriptome of interspecific recombinant congenic mouse strains (IRCSs) containing segments of
Mus spretus origin at a homozygous state in a Mus musculus background.
Results: Most genes (75%) were not transcriptionally modified either in the IRCSs or in the parent
M. spretus mice, compared to M. musculus. The expression levels of most of the remaining
transcripts were 'dictated' by either M. musculus transcription factors ('trans-driven'; 20%), or M.
spretus cis-acting elements ('cis-driven'; 4%). Finally, 1% of transcripts were dysregulated following
a cis-trans mismatch. We observed a higher sequence divergence between M. spretus and M.
musculus promoters of strongly dysregulated genes than in promoters of similarly expressed genes.
Conclusion: Our study indicates that it is possible to classify the molecular events leading to
expressional alterations when a homozygous graft of foreign genome segments is made in an
interspecific host genome. The inadequacy of transcription factors of this host genome to recognize
the foreign targets was clearly the major path leading to dysregulation.
Background
Speciation is defined as the evolutionary process generating
new species. It relies on reproductive isolation leading to the
separate evolution of genomes. In the 'house mouse species
complex' genomic exchanges do occur, and the laboratory
mouse itself is considered as a mosaic of other subspecies.
Indeed, laboratory mouse strains have originated from a lim-
ited number of founder populations of mixed genetic consti-
tution [1,2].
A recent analysis of the fine structure of single nucleotide pol-
ymorphism (SNP) variation in the mouse genome revealed
Published: 27 August 2008
Genome Biology 2008, 9:R133 (doi:10.1186/gb-2008-9-8-r133)
Received: 11 June 2008
Accepted: 27 August 2008
The electronic version of this article is the complete one and can be
found online at /> Genome Biology 2008, Volume 9, Issue 8, Article R133 L'Hôte et al. R133.2
Genome Biology 2008, 9:R133
the existence of long segments with extremely high levels of
polymorphism (one-third of the genome). This highly poly-
morphic subgenome is expected to originate partly from mul-
tiple subspecies [2], which suggests that the genomes of
inbred strains (that is, Mus musculus) are mosaics of chromo-
some segments derived from other subspecies [1]. These
results have been confirmed and extended to other mouse
strains derived from the wild [3].
In spite of the accumulating evidence pointing to the mosaic
nature of the inbred mouse genome in structural terms, little
is known about the way the introgressed segments are regu-
lated within the context of the recipient genetic background.
Several microarray profiling experiments have been per-
formed to compare expression in hybrid mice from different
mouse subspecies and species [4,5]. In these studies, the tar-
get tissues were brain, liver and testes, as representative of
behavior, metabolism and reproduction, respectively. The
first study showed an excess in differentially regulated genes
in the testis compared to brain and liver between Mus spretus
and M. musculus. The second study completed the first by
analyzing expression in the hybrid between subspecies; it
confirmed the over-representation of genes differentially
expressed in the testis compared to other tissues. Also, the
authors suggest that inheritance is generally 'additive'
(expression in the hybrid being generally near the midpoint
between the expression of the two parent subspecies). Con-
sistent observations have been independently published [6].
By contrast, other studies showed that hybrids may display
'non-additive' gene-expression patterns [7,8]. In the hybrid,
the merging of two different subgenomes might lead to cis-
trans incompatibilities that would explain the reported novel
gene-expression patterns, as shown in Drosophila [9].
Indeed, it is expected that cis- (that is, regulatory sequences
linked to the gene) and trans- (that is, transcription factors)
regulatory elements within species coevolved through com-
pensatory changes, and cannot always be mingled without so-
called 'transcriptome shock', that is, massive gene dysregula-
tion caused by the association of genomes that have evolved
separately [10-12].
Most interspecific studies on gene expression profiling in
mammals have been performed by analyzing separately the
two or more species under scrutiny, or their hybrids. Clearly,
expression in hybrids is made very complex, for instance, by
the generation of a large quantity of abnormal heteromeric
proteins [13]. Therefore, analyzing expression in a genuine
mosaic genome would facilitate interpretation. Inter- or sub-
specific hybrids constitute a first step in establishing a stable
genomic mosaic, if followed by backcrosses and consecutive
sib-pair crosses. In the present study, we took advantage of an
original genetic model, a panel of interspecific recombinant
congenic mouse strains (IRCSs) [14], to explore the behavior
of chromosome segments introgressed in a foreign genome at
a homozygous state. The model is composed of 53 strains
obtained from interspecific crosses between C57BL/6 mice
and the SEG strain derived from the species M. spretus. The
C57Bl/6 genome is in fact composed of a mixture of unequal
proportions of three distinct mouse lineages (M. musculus
domesticus, M. musculus musculus and M. musculus cas-
taneus) [2,15]. Despite the complexity of the species structure
in mice, it is clear that M. spretus diverged from the house
mouse complex more than 1.5 million years ago [16].
We show that the position of interspecifically introgressed
segments is readily detectable by their expression alterations
in the testis transcriptome. Using the IRCS model, we were
able to classify the genes in categories according to their capa-
bility to correctly cope with the host genome due to their
trans, cis or cis × trans dominant mode of regulation. In addi-
tion, we show that the gene expression dysregulation is corre-
lated with the SNP content differentiating M. musculus and
M. spretus in cis-regions.
Results and discussion
M. spretus segments in the IRCS are enriched in genes
transcriptionally altered compared to B6
In order to explore gene expression in a mosaic mouse
genome, we have exploited existing IRCS mice. For this, we
hybridized Nimblegen mouse expression microarrays with
pooled testis cDNA (12 testes per strain) from three recom-
binant congenic strains (97C, 137F and 44H), and the parent
strains C57Bl6/j (M. musculus B6) and SEG/Pas (M. spretus,
SEG). Together, these three recombinant congenic strains
carry about 5% of the introgressed M. spretus genome in a M.
musculus background. Complete information on the strains,
their origin, construction and mapping details is available in
[14], and described in Figures 1, 2, 3 for the three strains
under scrutiny. The Nimblegen arrays interrogate a total of
42,586 mouse transcripts, each transcript being represented
by nine 60-mer oligonucleotides. We have found that the
hybridization output is very robust. This translates into the
fact that for 95% of the genome, we have four highly corre-
lated fluorescence values per transcript (R > 0.98; see the
Gene Expression Omnibus profile). This clearly shows that
despite the genetic separation of the strains for more than 40
generations, their expression signatures are very similar.
Indeed, this constitutes the most stringent criteria of biologi-
cal replication. The same reasoning applies to the approxi-
mately 10 Mb M. spretus segment shared by 137F and 44H.
Indeed, this constitutes a biological replicate for this M. spre-
tus region (r = 0.84, p = 1.10
-17
, n = 59), while it drops to a
non-significant value when the same fragment is compared
between 97C (B6 genomic origin for this region) and 137F or
44H; this is illustrated in Figure 4a.
Moreover, we checked the microarray data by quantitative
PCR and obtained a very good agreement (R = 0.92 (R
2
=
0.84), n = 12, p < 0.001; Figure 4b). We considered a tran-
script as expressed when the fluorescence level was >100, this
Genome Biology 2008, Volume 9, Issue 8, Article R133 L'Hôte et al. R133.3
Genome Biology 2008, 9:R133
fluorescence ranging from 20 to more than 60,000 (average
approximately 3,100). The application of this threshold pro-
vided a selection of 37,432 transcripts (87.8%). To compare
expression levels of transcripts between strains, we consid-
ered a gene as differentially expressed if a four-fold difference
of expression was observed compared with the B6 parent.
This threshold was chosen since it corresponds roughly to 1%
of differentially regulated transcripts, a widely accepted
threshold. The number of SEG and IRCS genes whose expres-
sion ratios with respect to B6 were modified at the four-fold
threshold is summarized in Table 1. Between the two parent
species, 20.9% of the transcripts were modified in the testis,
with a similar amount of repressed and induced genes. Con-
cerning the IRCS expression profiles, we found 0.09%, 0.18%
and 0.23% of significantly modified transcripts at the pan-
genomic level, for 97C, 137F and 44H, respectively. This is
roughly proportional to the total size of M. spretus segments
in each IRCS. Since this proportionality is lost for genes out-
side segments of M. spretus origin (that is, 'genetic back-
ground'), the correlation was mainly due to dysregulation of
genes located within the M. spretus-derived segments. In 97C
and 44H there was a significant excess of under-expressed
genes, while interestingly, the opposite situation was
observed in 137F. This could be due to the presence 'by
chance' of one or a few potent transcriptional activators in the
M. spretus segments of 137F.
Next, we asked whether the M. spretus segments were
homogenous in terms of gene expression dysregulation. In
addition, we wished to test if dysregulated genes outside the
M. spretus segments were clustered. We therefore deter-
mined the sum of the log
2
of the expression ratios of induced
or repressed genes in sliding windows of 50 transcripts (Fig-
ures 5, 6, 7). In order to test whether the number of modified
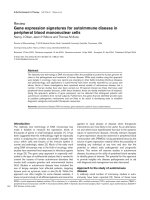
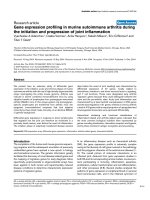
Position and size of the DNA segment of M. spretus origin in the M. musculus background for 97C, an IRCS used in the studyFigure 1
Position and size of the DNA segment of M. spretus origin in the M. musculus background for 97C, an IRCS used in the study. The segments of
M. spretus origin are displayed in yellow. The small horizontal bars represent the position of genetic markers analyzed to build the map (see
details in [14]). The picture was drawn before the analysis of testis expressional data, and a new segment found on chromosome 6 is thus not
represented (see text); this segment is clearly visible on the expression profiles of chromosome 6 (Figure 6).
Genome Biology 2008, Volume 9, Issue 8, Article R133 L'Hôte et al. R133.4
Genome Biology 2008, 9:R133
genes in a given chromosome region was significantly higher
than the background, we performed 1,000 permutations of
gene order for each chromosome; for each of them the maxi-
mum value obtained was kept as a threshold for significance,
represented by horizontal lines in Figures 5, 6, 7.
We could detect 11 clusters of modified genes. Ten of these
clusters matched to IRCS segments according to available
mapping information based on the genotyping of approxi-
mately 800 microsatellite markers and SNPs. Two discrepan-
cies were observed, on chromosomes 6 and 15. On
chromosome 6 (Figure 6), we detected a set of modified genes
significantly clustered, which did not correspond to a known
M. spretus segment in the 97C IRCS. To test whether this
group was a region of B6 or SEG origin, we genotyped poly-
morphic microsatellites located inside the region
(D6MIT224, D6MIT321, D6MIT313), which demonstrated
the existence of a previously undetected approximately 9 Mb
MMU6 M. spretus segment. By contrast, we failed to detect a
small segment predicted by genotyping on MMU15 previ-
ously detected by a single SNP. Typing new microsatellites
(D15MIT87 and D15MIT154, located at 0.6 and 0.2 Mb on
each side of this SNP, respectively), did not make it possible
to confirm the existence of a segment of M. spretus origin.
In short, we show that statistically assessing gene expression
alterations made it possible to detect all M. spretus segments,
uncover a previously undetected one (on MMU6), and dis-
qualify a M. spretus segment that was very likely a false-pos-
itive (on MMU15). In the rest of the study, we will consider
the combination of the 11 segments of M. spretus origin
present in the three IRCSs as a whole. Overall, the proportion
of dysregulated genes in the M. spretus segments inside the
IRCS was 6.2% (144/2320) compared to 0.06% in the rest of
the genome. Thus, the ratio of dysregulated genes is consider-
ably higher in the M. spretus fragments than outside them.
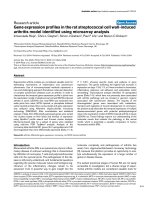
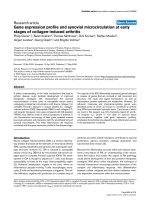
Position and size of the DNA segment of M. spretus origin in the M. musculus background for 137F miceFigure 2
Position and size of the DNA segment of M. spretus origin in the M. musculus background for 137F mice. This strain contains three M. spretus
segments estimated at 1.44% of the genome.
Genome Biology 2008, Volume 9, Issue 8, Article R133 L'Hôte et al. R133.5
Genome Biology 2008, 9:R133
We did not detect chromosome clusters of dysregulated genes
outside M. spretus segments; however, we considered the
possibility that these genes could belong to common func-
tional pathways (functionally clustered). We analyzed
induced and repressed genes in the genomic background of
the IRCSs, using the DAVID functional classification tool to
identify putative functional clusters [17]. This approach did
not result in relevant and significant grouping of genes
according either to a given function or to a specific keyword.
This is likely due to the presence of more than one M. spretus-
type transcription factor in the segments, each of them
impacting on a restricted number of targets, which weakens
the power of the clustering analysis. We observed that
amongst the genes that are dysregulated in the M. musculus
background of the IRCSs (67), about 90% (59) were also dif-
ferentially regulated compared to their M. spretus orthologs.
This suggests that transcription factors of M. spretus origin
were unable to regulate M. musculus genes, neither in a B6
nor in a SEG fashion (Figure 8c).
Exploring gene expression patterns in the IRCSs
In order to analyze more precisely the way genes are regu-
lated in M. spretus segments, we calculated correlations
between gene expression levels in the IRCSs and each of the
two parent species, B6 (M. musculus) and SEG (M. spretus),
and between the two parent species themselves. This analysis
was carried out considering either the complete set of 37,432
transcripts, the restricted set of 2,320 transcripts located
inside the segments (dysregulated or not), or exclusively the
144 modified genes (Tables 2 and 3).
We found a strong positive correlation between B6 and SEG
testicular transcriptomes (0.89, p < 0.0001), indicating over-
all a similar regulation of testis transcription in the two spe-
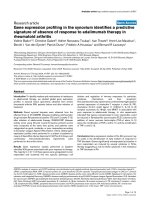
Position and size of the DNA segment of M. spretus origin in the M. musculus background for 44H mice, which apparently contains seven frag-mentsFigure 3
Position and size of the DNA segment of M. spretus origin in the M. musculus background for 44H mice, which apparently contains seven frag-
ments. In fact, the small fragment on chromosome 15 was not confirmed, neither by the expression analysis nor by the genotyping of addi-
tional markers (see text, and Figures 5-7, green dots).
Genome Biology 2008, Volume 9, Issue 8, Article R133 L'Hôte et al. R133.6
Genome Biology 2008, 9:R133
cies. In a similar way, in the larger context of mammalian
genome expression regulation, and expression regulation in
various organs, a vast majority of genes is consistently regu-
lated between species, such as human and chimpanzee [18],
or cattle and pigs [19]. When the correlation was calculated
between the IRCSs and B6, we observed a stronger correla-
tion coefficient (0.99), indicating that introgressing about 2%
of a foreign genome does not notably perturb the whole tran-
scription profile, at least in the testis. We can therefore
hypothesize that there is no strong detectable transcriptional
epistatic effect between the introgressed segments and the
genetic M. musculus background. Consistently, the correla-
tion between the IRCS and SEG transcriptomes is very similar
to that between B6 and SEG. Since this correlation may result
either from a direct correlation between IRCS and SEG testic-
ular gene expression or through a correlation involving the B6
genome, we also calculated partial correlations corrected for
B6 effects (Table 3). This type of correlation is aimed at find-
ing correlations between two variables after removing the
effects of a third one. We observed that, on the whole tran-
script dataset, we lose completely the correlation between the
IRCSs and the SEG parent (correlation coefficient shifts from
0.88 to 0.016), showing that this correlation between SEG
and the IRCSs is indirect and can be almost entirely explained
by their correlation with B6. It means that when the B6 testis
transcriptome (taken as a reference) is removed from the
analysis, no specific correlation persists between SEG and the
IRCSs. This suggests that the same set of genes drives normal
testis function in B6, SEG and the IRCSs.
Then, considering only the genes located in the 11 M. spretus
segments of the IRCSs, we observed similar correlations to
those observed at the pan-genomic level between B6 and the
IRCSs, B6 and SEG, and SEG and the IRCSs (Tables 2 and 3).
When partial correlations were considered, we conserved a
significant correlation between B6 and the IRCSs and, inter-
estingly, the correlation between the IRCSs and SEG became
significant compared to the correlation computed using the
whole set of transcripts (0.36, p < 0.0001 versus 0.016). This
indicates that part of the genes located within the M. spretus
segments conserve a SEG behavior even though they are
present in a M. musculus background. This partial correlation
between SEG and the IRCSs could, therefore, be a measure of
the proportion of genes for which the regulation is independ-
ent from the genetic background. The correlation coefficient
remained high between B6 and the IRCSs for genes located
inside the M. spretus segment (0.82), showing that a majority
of these genes is adequately regulated when introgressed in a
background evolving separately for two million years [16].
This correlation can be taken as a measure of conservation of
cis-trans co-evolution mechanisms, since it implies that B6
transcriptional factors are generally able to correctly regulate
the expression levels of M. spretus genes driven by their orig-
inal regulatory sequences.
We then calculated correlation coefficients for modified genes
in the IRCS segments. The correlation was estimated at 0.69
between B6 and the IRCSs, which is still significant but, as
expected, lower than in the pangenomic (0.99) or all-seg-
ments categories (0.96). This positive and strong correlation
indicates that the observed dysregulation involves subtle
quantitative effects, generally enhancing or decreasing gene
expression without drastic inversion. Interestingly, when the
correlation between B6 and the IRCSs is corrected for SEG
effects, the correlation coefficient is not significant (-0.15),
suggesting that the correlation essentially originates from
genes regulated similarly between B6 and SEG in this cate-
Assessment of reproducibility of the microarray dataFigure 4
Assessment of reproducibility of the microarray data. (a) Linear
regression analysis for the 60 genes located in an approximately 10
Mb region of M. spretus origin (MMU19) shared by 44H and 137F
strains, and of M. musculus origin in the B6 and 97C strains (Figures
2, 3 and 7). The x-axis represents the log
2
of the expression ratios
between 137F and B6. The y-axis represents the log
2
of the expression
ratio between either 44H and B6, or 97C and B6. As expected, there
is a highly significant correlation between the 44H/B6 ratio versus
the 137F/B6 ratio (blue dots), since 44H and 137F both contain a
segment of M. spretus origin at this chromosomal location, while
there is no significant correlation between the 97C/B6 ratio versus
the 137F/B6 ratio (red dots), due to dysregulations described in the
text. (b) Linear regression between expression levels obtained by
microarray or quantitative RT-PCR (QRT-PCR) for a sample of
twelve genes.
y = 0.8197x + 0.0572
r = 0.84
p = 1.00E-17
y = 0.0451x + 0.0696
r = 0.18 (ns)
-8
-6
-4
-2
0
2
4
-8 -6 -4 -2 0 2 4
Log
2
(44H/B6) or Log
2
(97C/B6)
Log
2
(137F/B6)
y = 0.5856x - 0.3222
r = 0.92
-10
-8
-6
-4
-2
0
2
4
6
8
10
-10 -8 -6 -4 -2 0 2 4 6 8 10
QRT-PCR Log
2
expression ratio
Microarray Log
2
expression ratio
Itga2
(a)
(b)
p = 2.110E-5
Aldh1a7
Ndufaf2
Pde7a
Gadphs
Sdha
Psmc3
Gadph
Zmat5
E0300010A14Rik
Pcsk1
Slc6a19
Genome Biology 2008, Volume 9, Issue 8, Article R133 L'Hôte et al. R133.7
Genome Biology 2008, 9:R133
gory. Reciprocally, when the partial correlation is considered
between the IRCSs and SEG for the same genes, we observed
a positive and significant correlation coefficient (0.54), sug-
gesting that, in this case, an important part of the dysregu-
lated genes in the IRCS segments behaved in a SEG-like
fashion.
In conclusion, when interspecific segments are introgressed,
genes deal with the genomic environment according to vari-
ous schemes: about 90% conserve their regulation; and
approximately 10% are dysregulated compared to B6, but in
this case most present an expression level consistent with the
SEG parent.
In order to refine these conclusions, genes located within the
M. spretus segments of the IRCSs (2,320) were categorized
into four groups according to their expressional statuses rela-
tive to B6. First, we decided to filter genes modified between
2- and 4-fold from the dataset, which made it possible to keep
1,467 transcripts (Figure 9). The four classes were: class 0 (n
= 1,095), genes that are not transcriptionally modified, nei-
ther in the IRCSs (M. spretus segments in a M. musculus
genome), nor in the parental M. spretus mice (M. spretus seg-
ments in a M. spretus genome); class 1 (n = 316), genes that
are not modified in the IRCSs, but are modified in M. spretus;
class 2 (n = 16), genes that are modified in the IRCSs but not
in M. spretus; and class 3 (n = 40), genes that are modified
both in the IRCSs and in M. spretus. We also calculated cor-
relation coefficients between the IRCSs and SEG for genes in
each class after correction for the B6 effect (partial correla-
tions; Figure 9).
For genes belonging to class 0, the expression behavior is
compatible with two non-exclusive possibilities: low cis/
trans divergence; and, in presence of genuine cis/trans diver-
gence, the robustness of the transcriptional response buffers
these variations.
The expression of genes of class 1 was not correlated between
the IRCSs and SEG. This suggests that, in this case, trans-act-
ing factors from the B6 background are able to bring gene
expression to a B6-like level (trans-driven effect). Taking into
account that this category is abundantly represented (about
20% of genes in the segments), these differences between B6
and SEG could be relevant for understanding species-specific
differences in gene expression.
For genes of class 2, the least abundant class (about 1%), there
was no correlation between SEG and the IRCSs. Since these
genes were regulated similarly between SEG and B6, we con-
cluded that their expression was disrupted in a new fashion,
due to their introgression in an interspecific genetic back-
ground. It can be hypothesized that selection acted to main-
tain a constant level of gene expression through time (and so
maintain a phenotype) by developing compensatory cis and
trans changes (cis/trans co-adaptation). In consequence, for
genes of class 2, when SEG segments are introgressed in the
B6 genome, cis- and trans-regulatory elements are no longer
adjusted and gene expression is dysregulated. Similar obser-
vations based on theoretical and experimental considerations
have been published recently [9,20].
For genes belonging to class 3 (dysregulated in the IRCSs and
presenting a different expression level between B6 and SEG),
we found a significant positive correlation between the IRCSs
Table 1
Dysregulated genes (compared to B6 expression levels) in M. spretus and the IRCSs
All genes considered
Pan genomic (37,432) SEG 44H 137F 97C
Under-expressed 3,290 57 15 26
Over-expressed 3,560 19 45 2
∑ 6,850 76 60 28
Percentage of modified genes 20.90 0.23 0.18 0.09
Proportion of under-expressed (%) 48.0 75.0 25.0 92.9
Only genes inside B6 segments considered
Genetic background (variable number according to the strain) 44H 137F 97C
Under-expressed 21 2 11
Over-expressed 330 0
∑ 24 32 11
Percentage of modified genes 0.06 0.09 0.03
Proportion of under-expressed (%) 87.5 6.3 100.0
A statistical overview of genes with modified expression in the various genomic contexts examined in this study, compared to the B6 strain
taken as a reference.
Genome Biology 2008, Volume 9, Issue 8, Article R133 L'Hôte et al. R133.8
Genome Biology 2008, 9:R133
and SEG (r = 0.53, p < 0.0001). This indicates that these
genes, regulated differently between the two parental species,
and differently expressed in the IRCSs compared to B6, keep
a SEG behavior in a B6 background. The regulation of these
genes is probably cis-driven, suggesting that their proximal
regulatory elements are sufficient to yield a M. spretus-like
expression level, whatever the background. It was interesting
to check whether all these genes behaved in a similar way
between SEG and the IRCSs. Therefore, we plotted the tran-
scriptional log ratio of the IRCSs/B6 versus SEG/B6 (Figure
10). This graph shows that, amongst the 40 genes of class 3, 6
did not display a SEG-like expression level. Four genes were
even regulated in an opposite fashion. These outliers explain
why the correlation coefficient was only of 0.53.
We also tried to characterize these expression classes at the
functional level, using the DAVID software, but we did not
succeed in clustering genes in functional groups or according
to specific keywords.
We then evaluated the testis-specific gene proportion in each
class, at a pan-genomic level and inside M. spretus segments
(Figure 11). At the 'pan-genomic' level, approximately 6% of
the genes were specifically expressed in the testis. This value
was significantly different from the proportion of testis-spe-
cific transcripts in the IRCS segments (8.8%, p < 0.0002), as
well as from the percentage of testis-specific genes of class 0
exclusively (10.0%, p < 0.0002). This indicates that M. spre-
tus segments are enriched in testis-specific genes belonging
A representation of expression levels along IRCS chromosomes where M. spretus segments were detected by analyzing the testis transcriptome for chromosomes 1, 2 and 3Figure 5
A representation of expression levels along IRCS chromosomes where M. spretus segments were detected by analyzing the testis transcriptome
for chromosomes 1, 2 and 3. Chromosome 2 is represented as a negative control (no M. spretus segment). The graphs display the chromosomal
position (abscissa) against the number corresponding to the sum of the log
2
of the IRCS/B6 expression ratios in sliding windows of 50 genes
(see Materials and methods). The horizontal lines represent a 1% probability of random occurrence estimated by one thousand random per-
mutations of gene order, for each strain and each chromosome.
0
5
10
15
20
25
30
35
40
45
97C
137F
44H
MMU1
97C
137F
44H
MMU2
0
5
10
15
20
25
30
35
40
45
50
97C
137F
44H
MMU3
50,000,000 100,000,000 150,000,000 200,000,000
50,000,000 100,000,000 150,000,000
50,000,000 100,000,000 150,000,0000
0
0
0
5
10
15
20
25
Genome Biology 2008, Volume 9, Issue 8, Article R133 L'Hôte et al. R133.9
Genome Biology 2008, 9:R133
to class 0 (genes from M. spretus segments that are regulated
similarly, either in the B6 or SEG genomic background). This
enrichment could be due to the selection of non-dysregulated
genes that may be relevant for testis function. When the dif-
ferent classes of genes were compared with respect to their
testis-specific gene content, only classes 0 and 1 (encompass-
ing only 4% of testis-specific genes) were significantly differ-
ent (p < 0.0019). This suggests that genes differentially
expressed between SEG and B6, owing to differences in
trans-driven regulation, may be less prone to be testis-spe-
cific.
Expression alterations are associated with a high
number of SNPs in the promoter of genes located in
the M. spretus fragments
We wished to test whether differences in gene expression
between SEG and B6 were due to promoter evolutionary
divergence. For this, we amplified and sequenced the M. spre-
tus proximal promoters of 24 genes located inside IRCS M.
spretus fragments (500-1,500 bp upstream of the ATG, based
upon the outputs from the Genomatix portal [21]. We com-
pared a set of 19 promoters of genes modified at the expres-
sion level, irrespective of whether they were over-expressed
or down-regulated, with a set of 5 promoters corresponding
to genes with unaltered expression (Table 4). The 19 promot-
ers belonged to classes 2 (4 genes) and 3 (15 genes). The five
promoters corresponding to genes with unaltered expression
were from class 0, considered as the best possible control for
non-varying transcripts. Overall, we estimated the M. spre-
tus/M. musculus sequence divergence at 2.7% in the promot-
ers of dysregulated genes, versus 1.1% in the promoters of
unmodified genes. The number of differences, either absolute
or corrected for sequence length, were significantly different
(p = 0.008 or 0.016, respectively). Genomatix was then used
to compare the transcription factor binding site (TFBS) con-
tent between the B6 and SEG versions of the 24 promoters.
We calculated the number of differences in TFBS content
between the two versions of each promoter, in absolute terms
Sliding window representation of expression levels for chromosomes 4 and 6Figure 6
Sliding window representation of expression levels for chromosomes 4 and 6. The blue peak observed on chromosome 6 was not previously
detected by genetic mapping. The existence of the segment was confirmed by genotyping new markers (see text).
0
5
10
15
20
25
30
35
40
45
50
0
97C
137F
44H
MMU4
0
5
10
15
20
25
30
35
40
45
50
0
97C
137F
44H
MMU6
50,000,000 100,000,000 150,000,000
50,000,000 100,000,000
Genome Biology 2008, Volume 9, Issue 8, Article R133 L'Hôte et al. R133.10
Genome Biology 2008, 9:R133
and relative to the total number of TFBSs. We detected signif-
icant differences between the two groups of promoters (27.2
versus 12.2, p = 0.019, and 21.6% versus 10.5%, p = 0.023,
respectively). For each of these parameters, we did not
observe significant differences between over-expressed and
down-regulated genes; similarly, no difference was visible
between genes from classes 2 and 3.
These data suggest a mechanism explaining the difference in
gene expression characterizing the M. spretus fragments in a
B6 context. These may be due to differences in the promoter
sequences that alter their interaction with the relevant tran-
scription factor(s), either due to the modification of the bind-
ing sequence, or the number of binding sites, or abolishing
any possible interaction.
Conclusion
Up to now, most transcriptional studies aiming at under-
standing interactions between different genomes have been
carried out using inter- or intersub-specific hybrid animals
[5,9,12,22] and polyploid and hybrid plants [10,23,24]. In the
case of M. musculus, it is known that the genome harbors seg-
ments from various subspecies (M. musculus domesticus, M.
musculus molossinus, M. musculus musculus) [1,3]. In the
present study, we used an original mouse model to explore
genome-wide gene expression, in a context of interspecific
mosaicism. Specifically, homozygous segments of M. spretus
origin were introgressed in a M. musculus background. M.
spretus and M. musculus diverged about two million years
ago, accumulating an interspecific divergence estimated at 1%
[16,25].
The process to obtain the IRCSs involved an interspecific
cross followed by two backcrosses on a M. musculus back-
ground and finally consanguineous crosses over more than
20 generations. As a result of this process, it was expected an
average of about 12.5% of M. spretus material introgressed
within the final IRCS genomes. However, the actual propor-
tion is currently estimated at about 1.37% (range 0-3.79%,
according to detection with approximately 800 polymorphic
DNA markers). This observation, together with the fact that
during the process of strain establishment 55% of the strains
did not survive, indicates that there was strong selection act-
ing against the maintenance of the M. spretus fragments in
the M. musculus background. Such a counter-selection would
be consistent with the 'Muller-Dobzhansky' model, proposing
the existence of deleterious interactions between genes that
have evolved in separate populations, which constitutes the
genetic basis for speciation [26]. In molecular terms, it is now
acknowledged that 'genomic shock' occurs in various inter-
specific hybrids [27,28]; thus, in the present day IRCSs, the
retained segments are expected to be the least deleterious
fraction of M. spretus chromosomes that could go through
the interspecific barrier.
Despite the fact that about 50% of the initial strains survived,
we have shown in a previous study that they are often hypof-
ertile, and display various non-lethal anomalies of the male
function and genital tract (small testes, teratozoospermia,
partial Sertoli-cell-only phenotype, abnormalities in the
development and function of annex glands) [29]. We hypoth-
esize that genes dysregulated exclusively in the IRCSs
(defined as class 2 in the present study) are the basis of the
molecular alterations leading to reproductive defects. We
ruled out the hypothesis that the expression alterations could
be due to variations in the relative percentage of testis cell
types in the different strains. Indeed, this has been checked by
histology [29]. In addition, such modification would induce
gene expression modifications in all the genome (including
the pure B6 genetic background), which was not observed.
Even in the 137F strain where approximately 10% of seminif-
erous tubules are without germ cells, such an alteration was
not observed. More specifically, the expression of genes that
mark specific testis cell types (such as Ar, Amh for the Sertoli
cells, Cyp17a1 or Hsd17b1 for Leydig cells) and meiosis genes
for germ cells (such as Spo11, Sycp3) or spermatogenesis spe-
cific genes (such as Prm1 and
2 or H1t) was not altered in the
B6 background of the strains.
We observed that introgressed segments were enriched in
testis-specific genes of class 0 (10.0%, versus 6.3% for the
whole genome). This suggests that despite selection against
interspecific segments, the introgression of genes potentially
important for reproduction do occur, provided that they
undergo a similar regulation as in the two parent species. By
contrast, class 1 (that is, encompassing genes behaving like
B6 in the IRCSs) contains less testis-specific genes (<4%),
indicating that a selection process might have acted against
their retention. As a result of this selective stringency, about
95% of the introgressed genes are correctly regulated relative
to their M. musculus orthologs, either because M. spretus and
M. musculus regulation is similar, or because the M. muscu-
lus trans-factors govern and determine the expression level
(class 0 and 1, respectively).
Interestingly, Rottscheidt and colleagues [5] showed that, in
the case of interspecific hybrids, the vast majority of testicular
transcripts were expressed at an intermediate level between
the two parents (a property called 'additivity' in their study).
This was different in the cross M. m. domesticus × M. m. cas-
taneus, which was the most divergent one (approximately one
million years ([5] and references therein), for which a similar
proportion of 'additively' and 'non-additively' expressed tran-
scripts was found. In the present work, we observed that
within M. spretus segments in the IRCSs, approximately 95%
of the transcripts showed a M. musculus-like expression level
(belonging to classes 0 and 1). For such genes of class 0, the
minimal hypothesis is a satisfactory cis/trans match between
SEG and B6, resulting in 'additive' expression in the Rottsc-
heidt sense. In addition, for genes of class 1, B6 transcription
factor(s) dictate the expression level, and force it to a B6-like
Genome Biology 2008, Volume 9, Issue 8, Article R133 L'Hôte et al. R133.11
Genome Biology 2008, 9:R133
level (according to the Rottscheidt definition, this case is not
additive; we could call it 'B6-dominant'). Only approximately
3% of the genes presented a M. spretus expression level in the
IRCSs (genes belonging to class 3): in this case, the M. spretus
cis-element dictates a M. spretus-like expression level
(according to the Rottscheidt definition, this behavior is
'SEG-dominant'). Less than 1% of genes had an expression
level in the IRCSs that was significantly different from that of
both parent species (class 2). In this case, the Rottscheidt def-
inition of additivity or dominance does not fit. In this cate-
gory, we observed that about 80% of the transcripts were
under-expressed (often close to extinction) compared to both
B6 and SEG, indicating that cis- and trans-elements do not
match.
This relative abundance of genes presenting a 'non-additive'
behavior might be explained by the fact that M. musculus and
M. spretus split approximately two million years ago (and are
therefore more divergent than the most divergent cross per-
formed in the Rottscheidt study). Our study is in fact differ-
ent, since we observed effects for the comparison between M.
musculus and a species outside the 'house mouse species
complex'. Alternatively, and not exclusively, the relative
importance in 'non-additive' gene expression could also be
explained by the other peculiarity of our model: the homozy-
gosity of the M. spretus segments, which obliges trans-regu-
lators of one species to act on cis-elements of another species.
In the hybrid, by contrast, the co-existence of two 'hemige-
nomes' allows trans-factors to find their bona fide targets at
least in the 'right hemigenome'.
The relative simplicity of our model makes it possible to deci-
pher and classify regulation incompatibilities between M.
musculus and M. spretus, contrasting the effect of trans-
driven regulation (class 1), cis-driven regulation (class 3) and
cis × trans mismatches (class 2) (Figure 8). The genomic
incompatibilities that we observed are to be placed in an evo-
lutionary context in the establishment of an inter- or inter-
sub-specific mosaic genome. It is well-known that gene flow
across species is limited in the first generation by several
hybrid sterility loci, which constitutes a first barrier against
interspecific hybridization (for recent work, see [30]). Inter-
estingly, Oka and coworkers showed that fertility continues to
drop in successive backcrosses, following an interspecific
cross [31]. In this context, it is possible to map quantitative
trait loci (QTL) involved in this secondary frontier against
interspecific mingling, this phenomenon being called hybrid
breakdown. We observed that this decreased reproductive fit-
Sliding window representation of expression levels for chromosomes 11, 12, 13 and 19Figure 7
Sliding window representation of expression levels for chromosomes 11, 12, 13 and 19. Note the existence of a chromosome 19 fragment
shared by 44H and 137F. This M. spretus region is regulated in a very similar way in both strains (Figure 5). Note that the size of the segment
is apparently much larger than suggested by genotyping in 137F.
0
5
10
15
20
25
30
35
40
45
MMU11
0
5
10
15
20
25
30
35
MMU12
0
5
10
15
20
25
30
35
40
45
50
MMU13
0
10
20
30
40
50
97C
137F
44H
MMU19
50,000,000 100,000,000
50,000,000 100,000,000
50,000,000 100,000,000
50,000,000
00
00
Genome Biology 2008, Volume 9, Issue 8, Article R133 L'Hôte et al. R133.12
Genome Biology 2008, 9:R133
ness is still present when introgressed fragments are stabi-
lized in a mosaic genome. Such a phenomenon probably
maintains the fraction of introgressed interspecific genome
relatively low in IRCSs and also probably in natural popula-
tions. The proportion and the quality of this retained fraction
have been measured across a hybrid zone between M. m.
domesticus and M. m. musculus [32]. The authors found
genome segments spreading from one species to the other,
containing in some cases genes involved in the reproductive
process. In a recent study based on a M. musculus × M.
domesticus cross aiming at establishing consomic strains,
this phenomenon was encountered again [33,34].
In our previous study [29], we showed that these incompati-
bilities can readily be used to map QTL involved in male fer-
tility parameters. IRCSs are a very powerful tool to dissect the
genetic bases of various phenotypes since M. spretus seg-
ments introgressed in the M. musculus genome ensure access
to regions that were up to now 'blind' (non-polymorphic) and,
therefore, non-exploitable for QTL mapping [3]. From the
A summary of the modes of regulation encountered in the IRCSs and their parent strainsFigure 8
A summary of the modes of regulation encountered in the IRCSs and their parent strains. Blue marks the B6 chromosome segments while
yellow marks the SEG chromosome segments. The blue arrows represent a B6 expression level, while the yellow arrows represent a SEG expres-
sion level. Red arrows correspond to expression levels that are different from the parent strains. The white arrows symbolize the interaction of
trans-factors (octagons) on cis-regulatory elements, themselves located either on the same or on other chromosomes. (a, b) Parent strains B6
and SEG. (c) Representation of the interaction of an SEG trans-factor acting on the B6 genome. In the IRCSs, since the M. spretus segments
account for less than 2% of the genome, this case is supposed to occur relatively rarely, but can probably explain the dysregulation of genes
located in the B6 background. This dysregulation can be mediated either by an activating or inhibiting factor, the effect of these factors being
detectable if the expression level is different from B6. (d) Interaction of a trans-factor of B6 origin on a M. spretus segment, resulting in a B6-
like expression level. This type of regulation includes genes of class 1 (Figure 9). (e) Interaction of a trans-factor of B6 origin on a M. spretus
segment, resulting in a SEG-like expression level (that is, the expression level is dictated by the cis-elements of M. spretus origin). This type of
regulation includes genes of class 3 (Figures 9 and 10). (f) Interaction of a trans-factor of B6 origin on a M. spretus segment, resulting in a novel
expression level. This type of regulation includes genes of class 2 (Figure 9).
a
i
Trans domination:
B6 expression level
Cis domination:
SEG expression
level
Cis x Trans
Deregulation: a
novel expression
level
IRCS
SEG
B6
Trans
(SEG => B6)
Cis x Trans
co-evolution in the separate
species
(e)(a) (f)
?
(b) (c) (d)
Genome Biology 2008, Volume 9, Issue 8, Article R133 L'Hôte et al. R133.13
Genome Biology 2008, 9:R133
point of view of physical mapping, the dysregulation that we
observed can be used as a very powerful method to exhaus-
tively detect introgressed segments. Indeed, even if only 10%
of the genes are dysregulated, since approximately 45,000
transcripts are analyzed in the microarray, 4,500 expres-
sional markers will be informative for mapping and, thus,
ensure a very high resolution. Along with the IRCS set
described in [14] and analyzed here, there are other similar
tools [33,34] that might be exhaustively studied using the
expression mapping approach outlined here.
Materials and methods
Mouse strains
The parent strains were M. spretus (SEG/Pas strain: SEG)
and M. musculus (C57BL/6J strain: B6). To construct the
IRCSs, F1 females (B6 × SEG) were crossed with B6 males.
Fertile backcross males were mated with B6 females and their
progeny were brother-sister mated for over 20 generations to
produce inbred strains. At the time of the study, 43 out of the
53 strains investigated had more than 40 generations of
inbreeding. The animals were bred in Pasteur's animal facility
until weaning and then housed in a controlled environment
(light/dark cycle, temperature, free access to mouse food and
water) in the animal facility of the Cochin Institute. All mice
were raised under identical standard laboratory conditions
and were sacrificed at the age of 6-8 weeks. All the experi-
mental procedures were conducted in accordance with the
policies of the University and the Guidelines for Biomedical
Research Involving Animals.
RNA extraction
Total testis RNA was extracted using TRIzol Reagent (Invitro-
gen, Carlsbad, CA, USA) in accordance with the manufac-
Table 3
Partial correlations in expression levels for the different mice of this study
Correlation coefficients between expression levels, corrected for reciprocal parental effect
All transcripts (37,431) All transcripts in the 11 segments (2,319) Modifed transcripts in the M. spretus segments
(143)
Correlation coefficient p-value Correlation coefficient p-value Correlation coefficient p-value
B6 versus IRCSs 0.9561 <0.0001 0.8189 <0.0001 -0.1499 NS
SEG versus IRCSs 0.0155 NS 0.3639 <0.0001 0.5441 <0.0001
Partial correlations for the fluorescence levels of the various transcripts between the two parental species and the IRCSs taken as a whole. Three
classes are considered, either with all the genes detectable on the array, or only the genes present inside the M. spretus segments, or only genes
modified at the 4X threshold inside these segments. While even inside the M. spretus segments, most genes are not dysregulated, a class of genes
that are strictly driven by the M. spretus context appears, since the correlation between the IRCSs and SEG does not significantly decrease when the
B6 parental effect is removed (from 0.5963 to 0.5441; see Table 2). NS, not significant.
Table 2
Total correlations in expression levels for the different mice of this study
Correlation coefficients between expression levels
All transcripts (37,432) All transcripts in the 11 segments
(2,320)
Modifed transcripts in the M. spretus
segments (144)
Correlation
coefficient
p-value Correlation coefficient p-value Correlation
coefficient
p-value
B6 versus IRCSs 0.9905 <0.0001 0.9646 <0.0001 0.6899 <0.0001
SEG versus IRCSs 0.8846 <0.0001 0.9038 <0.0001 0.5963 <0.0001
B6 versus SEG 0.8921 <0.0001 0.8919 <0.0001 0.3243 0.002
Total correlations for the fluorescence levels of the various transcripts between the two parent species and the IRCSs taken as a whole. Three
classes are considered, either with all the genes detectable on the array, or only the genes present inside the M. spretus segments, or only genes
modified at the 4X threshold inside these segments. While even inside the M. spretus segments most genes are not dysregulated, a class of
genes that are strictly driven by the M. spretus context appears, since the correlation between the IRCSs and SEG does not significantly
decrease when the B6 parental effect is removed (from 0.5963 to 0.5441; see Table 3).
Genome Biology 2008, Volume 9, Issue 8, Article R133 L'Hôte et al. R133.14
Genome Biology 2008, 9:R133
turer's instructions. RNA extractions from the two testes of
six males of each strain were pooled before DNase I treatment
(Invitrogen, Carlsbad, CA, USA).
Gene expression arrays
Twenty micrograms of RNA from each strain (B6, SEG, and
the IRCSs 44H, 137F and 97C) were sent to the NimbleGen
expression array platform (Nimblegen, Reykjavik, Iceland).
cDNA syntheses, DNA end-labelling, hybridization, scanning,
and data normalization were performed at the NimbleGen
facility. Hybridizations were performed on the standard
expression design for mouse (mm8; NCBI Build 36, M. m.
domesticus) corresponding to 42,586 exemplar genes repre-
senting a total of 53,127 transcripts/variants with nine 60-
mer probes per gene. Nimblegen provided the final normal-
ized data files.
Chromosome-wide expression level visualization
The average fluorescence values for each transcript were
inserted in an Excel file, chromosome per chromosome for
each strain analyzed. These fluorescence levels, considered as
expression values, were divided gene per gene by the corre-
sponding ones from B6, taken as a reference. The logarithm
(base2) of these ratios was calculated. To evaluate gene mod-
ification along a portion of chromosome, the absolute values
of these log
2
(ratios) were calculated, and these values were
summed using a sliding window comprising 50 genes. The
results are presented in Figure 2.
The proportion of testis-specific genes in the different subgenomes studiedFigure 11
The proportion of testis-specific genes in the different subgenomes
studied. Significantly different values are represented by horizontal
brackets (at least significant at p < 0.01). On average, the segments are
enriched in testis-specific genes, essentially owing to the bulk of genes
from class 0 (75%). By contrast, class 1 is depleted in testis-specific genes,
suggesting that trans-driven dysregulation (forcing M. spretus genes to a B6
behavior) is strongly counter-selected. The increased number of testis-
specific genes in the segments could be due to a positive selection aiming
at compensating deleterious effects on reproductive parameters during
the process of strain establishment. **p-value < 0.01; ***p-value < 0.001.
80%
82%
84%
86%
88%
90%
92%
94%
96%
98%
100%
Pan genomic
Segments
Class 0
Class 1
Cla
s
s 2
Class 3
Testis-specific genes
Genes not specifically
expressed in the testis
***
** **
Triangles of correlations between the three groups of animals analyzed in the studyFigure 9
Triangles of correlations between the three groups of animals analyzed in
the study. The analysis was carried out on the genes that were located in
the M. spretus segments of the IRCSs, considered as a whole (n = 1,467).
Four categories appear: genes that are consistently regulated in the
parents and the IRCSs (class 0); genes that are differentially regulated
between the two parents but regulated like B6 in the IRCSs (class 1);
genes that are differentially regulated between the two parents but
regulated in a SEG-like fashion in the IRCSs (class 3) - in this case the
dysregulation between B6 and SEG on the one hand and B6 and the IRCSs
on the other hand is associated with a strong correlation between gene
expression in SEG and the IRCSs, meaning that the deregulation compared
to B6 is not random and cis-driven; and genes that are similarly regulated
between the parents but dysregulated (generally turned off) in the IRCSs
(class 2).
B6
SEG
IRCS
0
P
P
r : 0.1457
N : 1,095, p < 0.001
B6
SEG IRCS
1
≠
P
r : -0.0454
N : 316, p : 0.419
B6
SEG IRCS
3
r : 0.5340
N : 40, p < 0.001
≠≠
r : 0.0695
N : 16, p : 0.78
B6
SEG
IRCS
2
P
≠
Graph representing the expression of class 3 genes in the IRCSs compared with SEG, with B6 expression taken as a referenceFigure 10
Graph representing the expression of class 3 genes in the IRCSs compared
with SEG, with B6 expression taken as a reference. Specifically, we plotted
the expression ratio IRCS/B6 against SEG/B6. The two lines define a four-
fold variation threshold for the expression ratios. Most genes belonged to
the interval defined by the two lines. The expression of these genes was
presumably driven to a SEG expression level by their cis-elements of SEG
origin. Only six genes were really dysregulated (represented by asterisks
instead of diamonds).
-8
-6
-4
-2
0
2
4
6
8
-8 -6 -4 -2
SEG/B6
IRCS/B6
02468
Genome Biology 2008, Volume 9, Issue 8, Article R133 L'Hôte et al. R133.15
Genome Biology 2008, 9:R133
Table 4
Comparisons between M. spretus and M. musculus promoters
Gene name Induction ratio
IRCS/B6
Length of B6
promoter (bp)
Length of SEG
promoter (bp)
Number of
sequence
differences
Percentage of
sequence
divergence
Total number of
TFBSs detected
with Genomatix
Number of TFBSs
differing between
M. spretus and M.
musculus
Percentage of TFBS
differing between
M. spretus and M.
musculus
Genes with
modified mRNA
level between
SEG and B6
Pde7a 0.02 749 728 29 3.87 137 21 15.33
Aldh1a7 0.04 598 587 11 1.84 101 30 29.70
1810058I14rik 0.05 638 613 28 4.39 100 38 38.00
Plcz1 0.09 1,432 1,392 42 2.93 228 51 22.37
Itga2 0.10 769 749 21 2.73 94 14 14.89
Nol9 0.11 1,034 1,021 15 1.45 198 32 16.16
4833412L08Rik 0.12 601 583 18 3.00 106 20 18.87
4921521F21Rik 0.16 603 597 7 1.16 137 8 5.84
Plek 4.34 698 679 27 3.87 134 33 24.63
Cast 5.28 648 629 21 3.24 101 22 21.78
Slc6a3 5.94 657 650 7 1.07 90 16 17.78
Hnf4g 6.64 601 589 14 2.33 105 29 27.62
6130401L20Rik 7.22 758 743 26 3.43 138 53 38.41
Mbl2 7.45 629 615 14 2.23 101 24 23.76
E030010A14 10.06 622 600 33 5.31 143 63 44.06
Hebp1 10.19 604 596 9 1.49 83 11 13.25
Pcsk1 20.74 839 834 5 0.60 110 9 8.18
Slc6a19 23.39 667 648 22 3.30 96 22 22.92
Pdcd1lg2 38.40 662 647 17 2.57 88 20 22.73
Mean 726.8 710.5 19.3 2.7 120.5 27.2 21.6
Standard
deviation
201.9 197.4 9.9 1.2 37.9 15.2 11.1
Genome Biology 2008, Volume 9, Issue 8, Article R133 L'Hôte et al. R133.16
Genome Biology 2008, 9:R133
Genes with
unchanged
mRNA level
between SEG and
B6
Tle4 1.19 1,289 1,284 5 0.39 250 5 2.00
Bhlhb5 1.20 791 788 3 0.38 165 11 6.67
Cypt12 1.07 603 593 12 1.99 161 14 8.70
Spag16 0.81 511 506 6 1.17 87 13 14.94
Zmat5 0.94 619 610 9 1.45 90 18 20.00
Mean 762.6 756.2 7.0 1.1 150.6 12.2 10.5
Standard
deviation
311.2 312.3 3.5 0.7 66.9 4.8 7.1
p-value NS NS 0.008 0.016 NS 0.019 0.023
Sequence and comparative analysis of putative TFBSs between M. musculus and M. spretus. Genes with unchanged mRNA levels between SEG and B6 consist of M. spretus genes that were not
dysregulated when introgressed in the B6 genome. We observed (see text) that modified genes present half as much sequence variation and difference in putative TFBSs. Statistical values (mean and
standard deviations) are represented in bold, as well as the p-values showing statistically significant differences in sequence divergence and TFBSs between modified and unmodified genes (Mann-
Whitney non-parametric test). NS, not significant.
Table 4 (Continued)
Comparisons between M. spretus and M. musculus promoters
Genome Biology 2008, Volume 9, Issue 8, Article R133 L'Hôte et al. R133.17
Genome Biology 2008, 9:R133
Correlations and partial correlations
Normalized fluorescence levels for each transcript of each
strain were analyzed using SPSS software (V8.0.1F) (SPSS
Inc., Chicago, IL, USA). Correlation and partial correlation
coefficients, as well as p-values for significance were com-
puted using SPSS.
Testis specificity assignment
The dataset corresponding to the Mouse GNF1M (gcRMA-
condensed) GeneAtlas of the SymAtlas website [35] was
retrieved from the site [36]. We defined 'testis-specific' genes
as genes with testis expression at least 3-fold above the
median gene expression in the 63 tested tissues, and that
were expressed in less than 3 tissues out of the 63 tested. Dif-
ferences in the testis-specific gene proportion in each expres-
sion class (at the pan-genomic level, in the M. spretus
segments or in the four classes 0, 1, 2 and 3) were tested using
the 'significance of the difference between two independent
proportions' function of VassarStat [37].
M. spretus promoter sequencing
B6 proximal promoters corresponding to 500-1,500 bp
upstream of the ATG were retrieved from the Genomatix por-
tal [21] for 55 genes. PCR primers (primer sequences availa-
ble upon request from the authors) were designed based upon
the B6 sequence and used to sequence SEG promoter versions
on pooled genomic DNA extracted from tail tissues from six
animals. PCR was performed using dimethyl sulfoxide
(DMSO) enhancer, and Platinum™ Taq DNA polymerase
(Invitrogen). We obtained an amplification product for 24
promoters. PCR products were purified and sequenced. M.
spretus sequences were blasted against the B6 promoter
sequences, taken as reference. Differences in the number of
putative TFBSs between orthologous promoters were identi-
fied using the Genomatix GEMS launcher task function.
Sequence divergence, in absolute terms (percentage of simi-
larity) or relative to the length of the corresponding promot-
ers between B6 and SEG sequences were statistically tested
using Mann-Whitney tests. A similar approach was used for
estimating and statistically testing the number and differ-
ences in putative TFBSs. The accession numbers for M. spre-
tus promoters, which have been obtained from GenBank, are
available in Table S1 in Additional data file 1.
Transcriptome data
The transcriptome data have been deposited at Array express
(accession number E-TABM-444).
Abbreviations
IRCS, interspecific recombinant congenic strain; QTL, quan-
titative trait locus; SNP, single nucleotide polymorphism;
TFBS, transcription factor binding site.
Authors' contributions
DLH performed the experiments, made most of the correla-
tion analysis and contributed to the writing of the paper. CS
performed the experiments and brought expertise in testis
physiology. RAV contributed to the writing and editing of the
manuscript. XM produced and supervised the breeding of the
mouse strains. AO provided advice on the manuscript. DV
conceived the experimental design, participated in the data
analysis and interpretation, and contributed to the writing
and editing of the manuscript. All authors read and approved
the final manuscript.
Additional data files
The following additional data are available. Additional data
file 1 is a table listing accession numbers for M. spretus pro-
moters obtained from GenBank.
Additional data file 1Accession numbers for M. spretus promoters obtained from Gen-BankAccession numbers for M. spretus promoters obtained from Gen-Bank.Click here for file
Acknowledgements
We thank Isabelle Lanctin (Pasteur Institute) for her precious help in pro-
viding us with difficult to breed animals. This study was supported by grant
06-2005-MAMMIFERT-02 from the French Agence National pour la
Recherche. David L'Hôte is funded by grants from the Institut National de
la Santé et de la Recherche Médicale (INSERM) and Limoges University.
References
1. Wade CM, Kulbokas EJ 3rd, Kirby AW, Zody MC, Mullikin JC, Lander
ES, Lindblad-Toh K, Daly MJ: The mosaic structure of variation
in the laboratory mouse genome. Nature 2002, 420:574-578.
2. Frazer KA, Eskin E, Kang HM, Bogue MA, Hinds DA, Beilharz EJ,
Gupta RV, Montgomery J, Morenzoni MM, Nilsen GB, Pethiyagoda
CL, Stuve LL, Johnson FM, Daly MJ, Wade CM, Cox DR: A
sequence-based variation map of 8.27 million SNPs in inbred
mouse strains. Nature 2007, 448:1050-1053.
3. Yang H, Bell TA, Churchill GA, Pardo-Manuel de Villena F: On the
subspecific origin of the laboratory mouse. Nat Genet 2007,
39:1100-1107.
4. Voolstra C, Tautz D, Farbrother P, Eichinger L, Harr B: Contrasting
evolution of expression differences in the testis between spe-
cies and subspecies of the house mouse. Genome Res 2007,
17:42-49.
5. Rottscheidt R, Harr B: Extensive additivity of gene expression
differentiates subspecies of the house mouse. Genetics 2007,
177:1553-1567.
6. Cui X, Affourtit J, Shockley KR, Woo Y, Churchill GA: Inheritance
patterns of transcript levels in F1 hybrid mice. Genetics 2006,
174:627-637.
7. Gibson G, Riley-Berger R, Harshman L, Kopp A, Vacha S, Nuzhdin S,
Wayne M: Extensive sex-specific nonadditivity of gene expres-
sion in Drosophila melanogaster. Genetics 2004, 167:1791-1799.
8. Vuylsteke M, van Eeuwijk F, Van Hummelen P, Kuiper M, Zabeau M:
Genetic analysis of variation in gene expression in Arabidop-
sis thaliana. Genetics 2005, 171:1267-1275.
9. Landry CR, Wittkopp PJ, Taubes CH, Ranz JM, Clark AG, Hartl DL:
Compensatory cis-trans evolution and the dysregulation of
gene expression in interspecific hybrids of Drosophila. Genet-
ics 2005, 171:1813-1822.
10. Hegarty MJ, Barker GL, Wilson ID, Abbott RJ, Edwards KJ, Hiscock
SJ: Transcriptome shock after interspecific hybridization in
senecio is ameliorated by genome duplication. Curr Biol 2006,
16:1652-1659.
11. McClintock B: The significance of responses of the genome to
challenge. Science 1984, 226:792-801.
12. Wittkopp PJ, Haerum BK, Clark AG: Evolutionary changes in cis
and trans gene regulation. Nature 2004, 430:85-88.
13. Veitia RA: Exploring the molecular etiology of dominant-neg-
ative mutations. Plant Cell 2007, 19:3843-3851.
Genome Biology 2008, Volume 9, Issue 8, Article R133 L'Hôte et al. R133.18
Genome Biology 2008, 9:R133
14. Burgio G, Szatanik M, Guenet JL, Arnau MR, Panthier JJ, Montagutelli
X: Interspecific recombinant congenic strains between
C57BL/6 and mice of the Mus spretus species: a powerful tool
to dissect genetic control of complex traits. Genetics 2007,
177:2321-2333.
15. Orth A, Adama T, Din W, Bonhomme F: [Natural hybridization
between two subspecies of the house mouse, Mus musculus
domesticus and Mus musculus castaneus, near Lake Casitas,
California]. Genome 1998, 41:104-110.
16. Guenet JL, Bonhomme F: Wild mice: an ever-increasing contri-
bution to a popular mammalian model. Trends Genet 2003,
19:24-31.
17. DAVID [ />18. Khaitovich P, Weiss G, Lachmann M, Hellmann I, Enard W, Muetzel
B, Wirkner U, Ansorge W, Pääbo S: A neutral model of transcrip-
tome evolution. PLoS Biol 2004, 2:E132.
19. Cosseddu GM, Perez-Enciso M, Fellous M, Vaiman D: Interspecific
chromosome-wide transcription profiles reveal the exist-
ence of mammalian-specific and species-specific chromo-
some domains. J Mol Evol 2004, 59:317-328.
20. Veitia RA: Paralogs in polyploids: one for all and all for one?
Plant Cell 2005, 17:4-11.
21. Genomatix []
22. Ranz JM, Namgyal K, Gibson G, Hartl DL: Anomalies in the
expression profile of interspecific hybrids of Drosophila mela-
nogaster and Drosophila simulans. Genome Res 2004, 14:373-379.
23. Adams KL, Cronn R, Percifield R, Wendel JF: Genes duplicated by
polyploidy show unequal contributions to the transcriptome
and organ-specific reciprocal silencing. Proc Natl Acad Sci USA
2003, 100:
4649-4654.
24. Adams KL: Evolution of duplicate gene expression in polyploid
and hybrid plants. J Hered 2007, 98:136-141.
25. Chimpanzee Sequencing and Analysis Consortium: Initial sequence
of the chimpanzee genome and comparison with the human
genome. Nature 2005, 437:69-87.
26. Dobzhansky T: Studies on hybrid sterility. II. Localization of
sterility factors in Drosophila pseudoobscura hybrids. Genetics
1936, 21:113-135.
27. Madlung A, Tyagi AP, Watson B, Jiang H, Kagochi T, Doerge RW,
Martienssen R, Comai L: Genomic changes in synthetic Arabi-
dopsis polyploids. Plant J 2005, 41:221-230.
28. Shaked H, Kashkush K, Ozkan H, Feldman M, Levy AA: Sequence
elimination and cytosine methylation are rapid and repro-
ducible responses of the genome to wide hybridization and
allopolyploidy in wheat. Plant Cell 2001, 13:1749-1759.
29. L'Hôte D, Serres C, Laissue P, Oulmouden A, Rogel-Gaillard C, Mon-
tagutelli X, Vaiman D: Centimorgan-range one-step mapping of
fertility traits using interspecific recombinant congenic
mice. Genetics 2007, 176:1907-1921.
30. Good JM, Handel MA, Nachman MW: Asymmetry and polymor-
phism of hybrid male sterility during the early stages of spe-
ciation in house mice. Evolution 2008, 62:50-65.
31. Oka A, Mita A, Sakurai-Yamatani N, Yamamoto H, Takagi N, Takano-
Shimizu T, Toshimori K, Moriwaki K, Shiroishi T: Hybrid break-
down caused by substitution of the X chromosome between
two mouse subspecies. Genetics 2004, 166:913-924.
32. Teeter KC, Payseur BA, Harris LW, Bakewell MA, Thibodeau LM,
O'Brien JE, Krenz JG, Sans-Fuentes MA, Nachman MW, Tucker PK:
Genome-wide patterns of gene flow across a house mouse
hybrid zone. Genome Res 2008, 18:67-76.
33. Gregorová S, Divina P, Storchova R, Trachtulec Z, Fotopulosova V,
Svenson KL, Donahue LR, Paigen B, Forejt J: Mouse consomic
strains: exploiting genetic divergence between
Mus m. mus-
culus and Mus m. domesticus subspecies. Genome Res 2008,
18:509-515.
34. Takada T, Mita A, Maeno A, Sakai T, Shitara H, Kikkawa Y, Moriwaki
K, Yonekawa H, Shiroishi T: Mouse inter-subspecific consomic
strains for genetic dissection of quantitative complex traits.
Genome Res 2008, 18:500-508.
35. Su AI, Cooke MP, Ching KA, Hakak Y, Walker JR, Wiltshire T, Orth
AP, Vega RG, Sapinoso LM, Moqrich A, Patapoutian A, Hampton GM,
Schultz PG, Hogenesch JB: Large-scale analysis of the human
and mouse transcriptomes. Proc Natl Acad Sci USA 2002,
99:4465-4470.
36. SymAtlas [ />37. VassarStats [ />