Báo cáo y học: "A genome wide analysis of the response to uncapped telomeres in budding yeast reveals a novel role for the NAD+ biosynthetic gene BNA2 in chromosome end protection" doc
Bạn đang xem bản rút gọn của tài liệu. Xem và tải ngay bản đầy đủ của tài liệu tại đây (719.43 KB, 17 trang )
Genome Biology 2008, 9:R146
Open Access
2008Greenallet al.Volume 9, Issue 10, Article R146
Research
A genome wide analysis of the response to uncapped telomeres in
budding yeast reveals a novel role for the NAD
+
biosynthetic gene
BNA2 in chromosome end protection
Amanda Greenall
*†
, Guiyuan Lei
†‡
, Daniel C Swan
§
, Katherine James
†¶
,
Liming Wang
¥
, Heiko Peters
¥
, Anil Wipat
†¶
, Darren J Wilkinson
†‡
and
David Lydall
*†#
Addresses:
*
Aging Research Laboratories, Institute for Aging and Health, Newcastle University, Newcastle upon Tyne, NE4 5PL, UK.
†
Centre
for Integrated Systems Biology of Aging and Nutrition, Newcastle University, Newcastle upon Tyne, NE4 5PL, UK.
‡
School of Mathematics &
Statistics, Newcastle University, Newcastle upon Tyne, NE1 7RU, UK.
§
Bioinformatics Support Unit, Newcastle University, Newcastle upon
Tyne, NE2 4HH, UK.
¶
Institute of Human Genetics, International Centre for Life, Newcastle University, Newcastle upon Tyne, NE1 3BZ, UK.
¥
School of Computing Science, Newcastle University, Newcastle upon Tyne, NE1 7RU, UK.
#
Institute for Cell and Molecular Biosciences,
Newcastle University, Newcastle upon Tyne, NE2 4HH, UK.
Correspondence: David Lydall. Email:
© 2008 Greenall et al.; licensee BioMed Central Ltd.
This is an open access article distributed under the terms of the Creative Commons Attribution License ( which
permits unrestricted use, distribution, and reproduction in any medium, provided the original work is properly cited.
NAD+ synthesis and telomere uncapping<p>NAD+ metabolism may be linked to telomere end protection in yeast.</p>
Abstract
Background: Telomeres prevent the ends of eukaryotic chromosomes from being recognized as
damaged DNA and protect against cancer and ageing. When telomere structure is perturbed, a co-
ordinated series of events promote arrest of the cell cycle so that cells carrying damaged telomeres
do not divide. In order to better understand the eukaryotic response to telomere damage, budding
yeast strains harboring a temperature sensitive allele of an essential telomere capping gene (cdc13-
1) were subjected to a transcriptomic study.
Results: The genome-wide response to uncapped telomeres in yeast cdc13-1 strains, which have
telomere capping defects at temperatures above approximately 27°C, was determined. Telomere
uncapping in cdc13-1 strains is associated with the differential expression of over 600 transcripts.
Transcripts affecting responses to DNA damage and diverse environmental stresses were
statistically over-represented. BNA2, required for the biosynthesis of NAD
+
, is highly and
significantly up-regulated upon telomere uncapping in cdc13-1 strains. We find that deletion of
BNA2 and NPT1, which is also involved in NAD
+
synthesis, suppresses the temperature sensitivity
of cdc13-1 strains, indicating that NAD
+
metabolism may be linked to telomere end protection.
Conclusions: Our data support the hypothesis that the response to telomere uncapping is related
to, but distinct from, the response to non-telomeric double-strand breaks. The induction of
environmental stress responses may be a conserved feature of the eukaryotic response to
telomere damage. BNA2, which is involved in NAD
+
synthesis, plays previously unidentified roles in
the cellular response to telomere uncapping.
Published: 1 October 2008
Genome Biology 2008, 9:R146 (doi:10.1186/gb-2008-9-10-r146)
Received: 11 August 2008
Revised: 23 September 2008
Accepted: 1 October 2008
The electronic version of this article is the complete one and can be found online at http://
genomebiology.com/2008/9/10/R146
Genome Biology 2008, Volume 9, Issue 10, Article R146 Greenall et al. R146.2
Genome Biology 2008, 9:R146
Background
Telomeres are the specialized structures at the ends of linear
eukaryotic chromosomes [1,2]. Their fundamental configura-
tion is conserved in most eukaryotes and consists of repetitive
DNA elements with single-stranded (ss) 3' G-rich overhangs.
Telomeres are bound by numerous proteins with specificity
for both double-stranded DNA (dsDNA) and the ss overhangs
[3] and telomere 'capping' function is critical in preventing
the cell from recognizing the chromosome ends as double-
strand breaks (DSBs) [1,3]. Telomeres also need to circum-
vent the 'end replication problem', which is due to the inabil-
ity of DNA polymerases to fully replicate chromosome ends
[1]. In the presence of telomerase, a reverse transcriptase that
uses an RNA template to add telomeric DNA, chromosome
ends are maintained by the addition of DNA repeats [4]. In
budding yeast and mammalian cells not expressing telomer-
ase, telomeres get progressively shorter with every cell divi-
sion until they eventually reach a critically short length that is
sensed by the DNA-damage apparatus and promotes a cell
cycle arrest and replicative senescence [3,5-7]. Cell cycle
arrest also occurs when telomere damage is caused by
absence or loss of function of telomere capping proteins [3,8-
10].
Telomere degeneration is probably relevant to human cancer
and aging [11]. In many human somatic tissues, telomeres
become progressively shorter with increasing number of cell
divisions. Additionally, age related diseases and premature
aging syndromes have been characterized by short telomeres
and are associated with altered functioning of both telomer-
ase and telomere-interacting proteins. Regulation of tel-
omere length is also relevant to cancer since, in the majority
of human tumors and cancer cell lines thus far examined, tel-
omerase is inappropriately activated, permitting cells to
divide indefinitely.
Cdc13 is an essential telomere binding protein in Saccharo-
myces cerevisiae. Cdc13 is the functional homologue of
human Pot1 in that it binds the ss G-tail [12,13]. Cdc13 is
involved in telomere length homeostasis, due, at least in part,
to its role in the recruitment of the catalytic subunit of telom-
erase [14-16]. The critical role of Cdc13, however, appears to
be in telomere end protection. When Cdc13 is present, telom-
eres are capped and DNA-damage responses, which would be
elicited if telomeres were perceived as DSBs, are suppressed
[3]. In the absence of functional Cdc13, uncapping occurs and
the resulting dysfunctional telomeres become substrates of
the DNA damage response pathway, leading to accumulation
of ssDNA at telomeres [9,17], activation of a DNA damage
checkpoint [9,18] and eventually cell death [19,20].
CDC13 is an essential gene; however, temperature sensitive
alleles such as cdc13-1 allow telomeres to be conditionally
uncapped and the resulting cellular response to be studied in
detail. This has facilitated identification of the genes required
for checkpoint arrest of cdc13-1 strains [1,3,18,21]. Telomere
uncapping in cdc13-1 strains induces rapid and efficient cell
cycle arrest, like many types of DNA damage. Whether
uncapped telomeres elicit a different response to that to a
DSB elsewhere in the genome remains unknown. A genome-
wide analysis of the transcriptional response of yeast to dele-
tion of the telomerase RNA subunit revealed that when tel-
omeres become critically short, changes in gene expression
overlap with those associated with a number of cellular
responses, including the DNA damage response, but also pos-
sess unique features that suggest that shortened telomeres
invoke a specific cellular response [22]. Telomere damage
suffered by yeast cells that lack functional telomerase takes
several days to manifest and does so heterogeneously within
populations of cells [22]. In contrast, telomere uncapping in
cdc13-1 strains exposed to the restrictive temperature is rapid
and synchronous, with over 80% of cells within a population
exhibiting the G2-M cell cycle arrest indicative of telomere
uncapping within a single cell cycle [18]. We hypothesized
that, while the response to telomere uncapping in cdc13-1
strains was likely to overlap with the response to telomerase
deletion and DNA damage responses, rapid telomere uncap-
ping in cdc13-1 strains would induce an acute response to tel-
omere damage that would allow us to better dissect, and
therefore understand, the response to telomere uncapping.
In this paper, we used DNA microarray analyses to determine
the genome-wide response to telomere uncapping in cdc13-1
yeast strains. We show that genes differentially expressed
upon telomere uncapping show similarities to expression
programs induced by other conditions, such as exogenous
cellular stresses and the absence of telomerase. BNA2, encod-
ing an enzyme required for de novo NAD
+
synthesis, was one
of the most highly and significantly up-regulated genes upon
telomere uncapping in cdc13-1 strains and has no known
function in telomere metabolism. We show that deletion of
BNA2 suppresses the temperature sensitivity of cdc13-1
strains; thus, BNA2 plays a role in chromosome end
protection.
Results
Promoting telomere uncapping in cdc13-1 strains
In order to better understand the eukaryotic response to
uncapped telomeres, we examined the genome-wide expres-
sion changes associated with telomere uncapping in cdc13-1
yeast strains.
We first sought to determine appropriate conditions to
induce telomere uncapping in temperature-sensitive cdc13-1
mutants. The method commonly employed to promote
uncapping is to switch from growth at a permissive tempera-
ture of 23°C to a restrictive temperature of 36°C or 37°C [23],
close to the maximum temperature (38-39°C) at which wild-
type yeast can grow. Transcriptomic profiling of yeast lacking
functional telomerase [22] demonstrated that telomere dam-
age affects expression of heat shock genes [22,24]. Since a
Genome Biology 2008, Volume 9, Issue 10, Article R146 Greenall et al. R146.3
Genome Biology 2008, 9:R146
change of culture temperature from 23°C to 36-37°C would
also be sensed as a heat shock, and could potentially cause
similar changes in gene expression to those that occur specif-
ically as a result of telomere uncapping, we first tested
whether a lower restrictive temperature was able to induce
telomere uncapping without a strong heat shock response.
We compared restrictive temperatures of 30°C (the optimum
growth temperature for wild-type yeast) and 36°C in cdc13-1
strains.
We first compared the kinetics of cell cycle arrest in cdc13-1
cultures transferred from 23°C to 30°C or 36°C (Figure 1a).
cdc13-1 strains transferred to 30°C underwent a G2-M cell
cycle arrest with broadly similar kinetics to those transferred
to 36°C, with over 80% of cells in each culture arresting
within 2 hours of the temperature shift. Secondly, quantita-
tive RT-PCR was used to examine gene expression in cdc13-1
and CDC13
+
strains (Figure 1b,c; Additional data file 1). We
examined expression of HSP12, which is robustly induced in
response to heat stress [24] and also when telomeres are crit-
ically short in telomerase deletion mutants [22]. In the
CDC13
+
strain, elevating the culture temperature to 30°C
caused a mild heat shock, as indicated by 2.3-fold up-regula-
tion of HSP12 1 hour after altering the temperature (Figure
1b). For the remainder of the time course, HSP12 expression
returned to levels slightly below those that were observed
before the temperature shift. In the cdc13-1 strain after 1 hour
of incubation at 30°C, HSP12 was up-regulated 3.9-fold above
levels in the T = 0 sample. By 90 minutes, this induction was
reduced to 2.1-fold but then rose steadily at each subsequent
time point, presumably due to telomere uncapping, until 4
hours after the temperature shift, when HSP12 was 74-fold
up-regulated (Figure 1b).
As expected, switching from growth at 23°C to 36°C induced
a stronger heat shock response than switching to 30°C. In the
CDC13
+
strain, 1 hour of exposure to 36°C induced HSP12
expression 49-fold above levels in the T = 0 sample (Figure
1c). At later time points, HSP12 up-regulation in the CDC13
+
strain subsided, although expression was still elevated
between 6- and 15-fold above those measured pre-induction.
Expression of HSP12 in the cdc13-1 strain transferred to 36°C
was up-regulated 94-fold after 1 hour and this increased to
levels between 132- and 347-fold above the T = 0 sample for
the remainder of the time course (Figure 1c).
Additionally, we measured the expression of CTT1 and MSC1
in cdc13-1 and CDC13
+
strains that had been transferred from
23°C to 30°C or 36°C (Additional data file 1). Both of these
genes are also up-regulated in response to heat shock [24]
and the absence of telomerase [22]. For CTT1, a shift to 36°C
induced a stronger heat shock response in CDC13
+
strains
than a shift to 30°C. For MSC1, neither 30°C nor 36°C appre-
ciably induced gene expression in CDC13
+
strains. For both of
these genes (and also HSP12), differential expression in
cdc13-1 strains compared to CDC13
+
was readily detectible
after a shift to 30°C, indicating that this temperature induces
telomere uncapping. Both 30°C and 36°C can induce heat
shock but, as expected, this effect is also more appreciable at
36°C.
We decided that 30°C was a suitable restrictive temperature
for examination of the transcriptional response to telomere
uncapping as this temperature induces telomere uncapping
in cdc13-1 strains whilst causing minimal heat stress.
In order to generate a robust data set, a multi-time-point time
course and three biological replicates of each strain were used
(Figure 2a). To produce independent biological replicates, we
performed a genetic cross between a CDC13
+
and a cdc13-1
strain to generate three cdc13-1 and three CDC13
+
strains.
The resulting sets of strains demonstrated reproducible cell
cycle arrest, growth, viability and HSP12 expression upon
exposure to the 30°C restrictive temperature (Additional data
file 2). Strains were in the S288C genetic background since
the S. cerevisiae genome sequence was derived from an
S288C strain and oligonucleotides on microarray chips are
based upon the published genome sequence. Additionally,
other large scale genetic screens carried out in our and other
laboratories have used this strain background.
Overview of the genomic expression response to
telomere uncapping
cDNAs generated from the three cdc13-1 and three CDC13
+
strains treated as in Figure 2a were analyzed using Affymetrix
GeneChip
®
Yeast Genome 2.0 arrays. The entire dataset can
be downloaded from the ArrayExpress website, accession
number E-MEXP-1551. We used limma [25] to compare tran-
script levels between CDC13
+
and cdc13-1 strains at each time
point and identified 647 genes with at least two-fold changes
in expression levels between cdc13-1 and CDC13
+
strains and
where the differences between cdc13-1 and CDC13
+
strains
showed statistically significant p-values (≤ 0.05; Figure 2b;
Table A in Additional data file 3). Of these genes, 229 were
down-regulated upon telomere uncapping and 418 were up-
regulated. Analysis of the lists of up- and down-regulated
genes using GOstats [26], which identifies statistically over-
represented Gene Ontology (GO) terms, revealed that the up-
regulated list was enriched for genes involved in processes
including carbohydrate metabolism, energy generation and
the response to oxidative stress (Table A in Additional data
file 4) while the down-regulated list was enriched for genes
with roles in processes including amino acid and ribosome
biogenesis, RNA metabolism and chromatin modification
(Table B in Additional data file 4). Hierarchical clustering was
used to investigate the relationships between the differen-
tially expressed genes. This clustering algorithm groups genes
with similar expression profiles (Figure 2b). During the time
course, the number of differentially expressed genes
increased with time (Figure 2b) and almost all of the changes
occurring at early time points persisted for the duration of the
experiment (Table 1 and Figure 2b). There were no
Genome Biology 2008, Volume 9, Issue 10, Article R146 Greenall et al. R146.4
Genome Biology 2008, 9:R146
differences in gene expression between cdc13-1 and CDC13
+
strains before the temperature shift, indicating that in cdc13-
1 strains, telomeres are functionally capped at 23°C (Figure
2b). In CDC13
+
strains, the expression of 41 genes was altered
during the time course. Analysis of this gene list using GOs-
tats [26] demonstrated that genes with roles in cell division
and the cell cycle were over-represented in this list (Table C in
Additional data file 4).
In order to validate the microarray data, we used quantitative
RT-PCR to examine the expression of five of the up-regulated
genes in a set of RNA samples that had been used in the array
analysis (Figure 3a). This confirmed that all of the genes
examined were up-regulated in cdc13-1 relative to CDC13
+
.
Expression patterns of these same genes in cdc13-1 and
CDC13
+
strains throughout the microarray time course were
also examined (Figure 3b). Comparison between gene expres-
sion in the microarray experiments with quantitative RT-PCR
revealed that while the RT-PCR broadly agreed with the array
data, for UBI4 there were differences between gene expres-
sion levels quantified using these methods. This may be due
to the smaller dynamic range of arrays compared to quantita-
tive RT-PCR. As expected from our pre-array RT-PCR analy-
sis (Figure 1c,d; Additional data file 1), HSP12, CTT1 and
MSC1 were up-regulated in our microarray experiment. We
plotted the expression of these genes throughout the microar-
ray time course (Additional data file 5) and observed that
expression patterns were very similar to those that we had
observed by RT-PCR, although like UBI4, expression levels of
HSP12 measured in the array were lower than those quanti-
fied by RT-PCR.
Expression of genes involved in the response to
telomerase deletion
The transcriptomic response to telomere uncapping in cdc13-
1 strains was expected to overlap with the response to absence
of telomerase [22], since in both cases damaged telomeres
activate a checkpoint response. Telomerase deletion is associ-
ated with the differential expression of genes involved in
processes including the DNA-damage response (DDR)
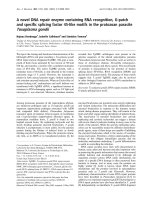
Comparison of 30°C and 36°C as restrictive temperaturesFigure 1
Comparison of 30°C and 36°C as restrictive temperatures. (a) Two independent cultures of a cdc13-1 strain (DLY1622) grown at 23°C, were sampled.
One culture was transferred to 30°C (filled triangles) and the other to 36°C (open triangles). Fractions of each culture arrested at medial nuclear division
(MND) are shown. (b) cdc13-1 (DLY1622; open circles) and CDC13
+
(DLY1584; filled circles) strains, grown at 23°C, were transferred to 30°C and
samples taken as indicated. RNA was prepared and HSP12 transcripts were quantified using one-step quantitative RT-PCR. Plotted values represent the
means of three independent measurements of each sample and error bars represent the standard deviations of the means. Correction factors to normalize
HSP12 RNA concentrations of each sample were generated by calculating the geometric means of three loading controls, ACT1, PAC2 and BUD6. A single
T = 0 sample from the CDC13
+
strain was assigned the value of 1 and all other values were corrected relative to this. (c) This experiment was carried out
as described in (c), except cdc13-1 and CDC13
+
strains were transferred to the restrictive temperature of 36°C.
HSP12 expression
Time at 30
º
C (hours)
Time at 36
º
C (hours)
cdc13-1 (DLY1622)
CDC13
+
(DLY1584)
12
3
450
123450
cdc13-1 (DLY1622)
CDC13
+
(DLY1584)
0.1
1
10
100
1000
(b)
(c)
Time at elevated temperature (hours)
MND (%)
20
0
40
60
80
100
12 3450
(a)
36ºC
30ºC
Genome Biology 2008, Volume 9, Issue 10, Article R146 Greenall et al. R146.5
Genome Biology 2008, 9:R146
[27,28] and the environmental stress response (ESR) [24]. A
significant proportion of the genes differentially expressed in
cdc13-1 strains were also involved in similar responses to
these (see below for further details), suggesting that different
types of telomere damage invoke common biological
processes.
Direct comparison of the cdc13-1 dataset with the 581 genes
altered in the absence of telomerase [22] showed that 244
genes were common to both (Table A in Additional data file
6). The overlap may encompass genes whose expression is
altered universally in response to telomere damage and
includes the DNA damage response genes RAD51, RNR2,
RNR3 and RNR4. There were 230 genes up-regulated in
cdc13-1 strains but not in the response to telomerase deletion
(Table B in Additional data file 6). These include the DNA
damage response genes DUN1, RAD16, MAG1, DDR2 and
HUG1, and MSN4, which encodes a key transcription factor
in the response to environmental stresses [29]. Under condi-
tions of stress, Msn4 and a related protein, Msn2, bind to
defined promoter elements called 'stress response elements'
(STREs); 36% of genes up-regulated in cdc13-1 strains pos-
sess STREs (p ≤ 10 e-15), while only 18% of genes down-regu-
lated in cdc13-1 strains possess such elements (p = 0.526).
Therefore, it is probable that up-regulation of MSN4 in the
response to telomere uncapping is responsible for the down-
stream induction of many genes.
Some of the genes differentially expressed in the cdc13-1
experiment but not in response to telomerase deletion may
respond specifically to acute telomere damage, while some
genes in the tlc1Δ data set but not cdc13-1 may be specific to
an adaptive response that occurs as cells gradually adapt to
telomere erosion over a number of days. We envisaged that
because cdc13-1 strains undergo a rapid cell cycle arrest when
telomeres are uncapped, use of this system may allow us to
identify genes that are involved in the acute response to tel-
omere uncapping. One hour after the temperature shift, the
DDR genes DUN1, HUG1, RAD51, RNR2 and RNR3 were
already up-regulated in cdc13-1 strains, indicating that dam-
aged telomeres had already been sensed, despite cell cycle
arrest not having yet reached maximum levels (Figure 2).
DUN1 and HUG1 were not identified as differentially
expressed in tlc1Δ strains [22].
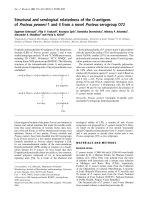
Genome wide expression changes in response to telomere uncappingFigure 2
Genome wide expression changes in response to telomere uncapping. (a)
Schematic representation of microarray time courses. For each of the
three separate time course experiments, one CDC13
+
and one cdc13-1
strain were inoculated into liquid culture and grown to early log phase at
23°C. Samples were taken (T = 0) and strains were transferred to 30°C
with further samples taken every 30 minutes from 1 to 4.5 hours
thereafter. Samples from 1, 2, 3 and 4 hours after the temperature shift (T
= 1 - T = 4) were used for the array experiment and the remaining
samples were stored. (b) Bioconductor was used to hierarchically cluster
the 647 differentially expressed genes (DEGs) such that genes whose
expression patterns are similar across the time course cluster together.
Pearson correlation was used as the similarity measure and average
linkage as the clustering algorithm. Expression levels are the averages of
the three biological replicates of each sample. Each row represents the
expression pattern of a single gene. Each column represents expression
levels at a single time point. CDC13
+
strains are on the left and cdc13-1
strains on the right. Gene names are on the right. Genes shown in yellow
are up-regulated, genes shown in blue are down-regulated, while those
shown in black are unchanged. All expression values are relative to the T
= 0 time point in CDC13
+
strains. Log
2
fold-change values are shown.
Maximum induction or repression is 2
(4)
-fold.
(a)
23
º
C30
º
C
CDC13
+
cdc13-1
T=1 T=2 T=3 T=4T=0
T=1 T=2 T=3 T=4T=0
Time (hours)
X3
(b)
repressed induced
1234012340
Gene expression
CDC13
+
cdc13-1
Time at 30
º
C (Hours)
Table 1
Numbers of differentially expressed genes at each timepoint
Time at 30°C (hours) Newly DEGs Total DEGs
000
16565
2 181 242
3 164 397
4 238 616
Total numbers of differentially expressed genes (DEGs) at each time
point and those that were not differentially expressed at the previous
time point are listed.
Genome Biology 2008, Volume 9, Issue 10, Article R146 Greenall et al. R146.6
Genome Biology 2008, 9:R146
Differences in gene expression between cdc13-1 strains and
those lacking telomerase are likely to be due to a number of
factors. Firstly, different genes may be altered due to
responses to distinct types of telomere damage. Secondly, in
a population of cells lacking telomerase, erosion of telomeres
and cell cycle arrest occur heterogeneously and over a period
of days rather than hours [22], making transcriptional differ-
ences less polarized (and thus more difficult to detect) than in
a population of rapidly and synchronously arrested cdc13-1
cells. Also, because of heterogeneity of entry into senescence
between cultures of telomerase deficient strains [22], results
from biological replicates cannot be readily combined to
allow statistical analyses such as the ones that we have
employed. Additionally, some differences between differen-
tially expressed genes identified in these two experiments are
likely because the studies were carried out using different
types of arrays and because different algorithms have been
used to identify altered gene expression.
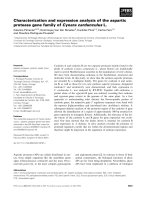
Validation of microarray dataFigure 3
Validation of microarray data. (a) RNA from a single set of time course samples (CDC13
+
(DLY3108; filled circles) and cdc13-1 (DLY3102; open circles))
was subjected to quantitative RT-PCR. Transcript levels of PNC1, UBI4, MAG1, RNR3, and YKL161C were analyzed in triplicate. Error bars represent the
standard deviations of the means. Correction factors to normalize RNA concentrations were generated by calculating the geometric means of ACT1 and
PAC2. A single T = 0 sample from the CDC13
+
strain was assigned the value of 1 and all other values were corrected relative to this. (b) Normalized
expression values from the microarray experiment of the five genes of interest quantified and plotted as in (a).
PNC1
UBI4
MAG1
RNR3
YKL161c
0.1
1
10
100
Relative expression
Time at 30
º
C (hours)
1
2
3
4
0
Time at 30
º
C (hours)
1
2
3
4
0
(a) Q RT-PCR (b) Microarray
cdc13-1
CDC13
+
cdc13-1
CDC13
+
cdc13-1
CDC13
+
cdc13-1
CDC13
+
cdc13-1
CDC13
+
cdc13-1
CDC13
+
cdc13-1
CDC13
+
cdc13-1
CDC13
+
cdc13-1
CDC13
+
Relative expression
0.1
1
10
100
cdc13-1
CDC13
+
Relative expression
0.1
1
10
100
Relative expression
0.1
1
10
100
Relative expression
0.1
1
10
100
Genome Biology 2008, Volume 9, Issue 10, Article R146 Greenall et al. R146.7
Genome Biology 2008, 9:R146
Expression of cell cycle regulated genes
cdc13-1 strains at the restrictive temperature arrest in the G2-
M phase of the cell cycle [18], while CDC13
+
cells continue to
divide. Therefore, the differential expression of many genes in
cdc13-1 strains is likely a result of enrichment/depletion of
cell cycle-regulated transcripts at the arrest point compared
to levels in asynchronous cycling controls. Of the 647 differ-
entially regulated genes in cdc13-1 strains, 256 were shown to
be periodically expressed during a recent, comprehensive
study of the cell division cycle [30]. A hypergeometric test
confirmed that periodically expressed transcripts were over-
represented in our data set (p ≤ 10e-15; Table 2). Changes in
gene expression in cdc13-1 strains displayed a distinct tempo-
ral pattern in that total numbers of differentially expressed
genes increased at each time point (Figures 2b and 4a), while
cell cycle regulated genes represented an increasingly smaller
proportion of the total numbers of differentially expressed
genes at each time point (Figure 4a,b). Over 50% of the genes
that are differentially expressed upon telomere uncapping in
cdc13-1 strains are not known to be cell cycle regulated; thus,
the majority of the observed changes do not seem to be attrib-
utable to the G2-M arrest. We subtracted the genes that are
known to be cell cycle regulated from our list of 647 differen-
tially expressed genes and subjected the remaining 391 to a
GOstats analysis (Table D in Additional data file 4). This list
is enriched for genes involved in energy generation and genes
involved in nicotinamide metabolism are also over-repre-
sented in it (p = 3.7e-4).
It has recently been shown that budding yeast cells disrupted
for all S-phase and mitotic cyclins still express nearly 70% of
periodic genes periodically and on schedule, despite being
arrested at the G1-S border [30]. Thus, it is possible that
despite cdc13-1 strains being arrested at G2-M, this may have
a relatively limited effect upon periodic gene expression.
Similarities to DNA-damage and stress responses
Uncapped telomeres are sensed by cells as if they were DSBs
[9,18]; thus, the response to telomere uncapping is expected
to share features in common with the DDR. Accordingly,
many of the genes differentially expressed in cdc13-1 strains
have previously been shown to respond to any one of three
types of DNA damaging event, namely exposure to ionizing
radiation [27], treatment with methyl methanesulfonate [27],
or induction of a single, unrepaired cut by HO endonuclease
[28]. A hypergeometric test confirmed that genes differen-
tially expressed in response to any of these types of DNA dam-
aging insult were over-represented in our data set (p ≤ 10 e-
15; Table 2). This could be due, at least in part, to the fact that
DSBs induce cell cycle arrest at G2-M similarly to uncapped
telomeres and, thus, the same sets of transcripts will be
enriched/depleted at the arrest point in all cases. In order to
account for this effect, we subtracted cell cycle regulated
genes [30] from the list of genes differentially expressed in
cdc13-1 strains and compared the remaining genes to those
that are expressed in response to DNA damage [27,28]. Of the
genes altered in cdc13-1 that are not cell cycle regulated, 35%
Table 2
Over-representation of ESR, DDR and CC genes in cdc13-1 dataset and QT clusters
Gene set (size) ESR DDR CC
QT1 (242) 33% 57% 35%
QT2 (160) 28% 51% 24%
QT3 (77) 51% 74% 49%
QT4 (28) 57% 71% 39%
QT5 (23) 22% 61% 26%
QT6 (21) 0% 57% 81%
QT7 (9) 44% 78% 11%
QT8 (8) 38% 63% 25%
QT9 (5) 0% 100% 100%
QT10 (8) 0% 25% 63%
QT11 (6) 50% 67% 50%
QT12 (8) 0% 38% 100%
QT13 (7) 0% 71% 100%
Altered in cdc13-1 (647) 41% (P ≤ 10e-15) 40% (P ≤ 10e-15) 31% (P ≤ 10e-15)
S. cerevisiae genome 14% 25% 22%
Table showing percentage of genes in the S. cerevisiae genome, cdc13-1 dataset and QT clusters 1-13 that have been shown to be differentially
expressed in response to environmental stress, DNA damage, and cell cycle progression. Hypergeometric tests were used to determine whether
each class of gene was over-represented in the QT clusters. Percent values shown in bold are statistically over-represented. Gene proportions in the
cdc13-1 dataset were compared to expression across the S. cerevisiae genome, while gene proportions in each QT set were compared to proportions
across the cdc13-1 experiment. ESR, all genes involved in the environmental stress response (868) [24]; DDR, all genes that are altered in response
to either methyl methanesulfonate, ionizing radiation or a single HO cut (1,529) [27,28]; CC, all genes known to be cell cycle regulated (1,271) [30]
Genome Biology 2008, Volume 9, Issue 10, Article R146 Greenall et al. R146.8
Genome Biology 2008, 9:R146
are also involved in responses to DNA damage, and a hyper-
geometric test confirmed that the over-representation of
DDR genes in this group was statistically significant (p ≤ 10e-
15). While genes whose expression is altered in response to
telomere uncapping in cdc13-1 strains overlap with those
whose expression changes in response to other types of DNA
damage, the majority of the altered genes have not been
implicated in the DDR, suggesting that uncapped telomeres
are not simply sensed as DSBs by cells.
Genome-wide responses to absence of telomerase and to
DNA damaging agents share features in common with the
ESR. The ESR involves approximately 900 genes whose
expression is stereotypically altered in response to diverse
environmental conditions [24]. A hypergeometric test con-
firmed that ESR genes were over-represented in our data set
(p ≤ 10e-15; Table 2). GOstats analysis also demonstrated that
significant numbers of genes involved in the response to oxi-
dative stress are present in the list of genes up-regulated in
cdc13-1 strains (Table A in Additional data file 4).
Differential expression of transcriptional regulators
during telomere uncapping
In order to identify transcriptional regulators whose expres-
sion is altered in cdc13-1 strains, we compared our list of
differentially expressed genes to a list of 203 known yeast
transcription factors [31]. Fourteen genes encoding tran-
scriptional regulators were up-regulated in cdc13-1 strains
(Table A in Additional data file 7). Some of the up-regulated
transcription factors are known to play roles in glucose
metabolism while MSN4 plays a key role in the ESR (see
above). Fourteen genes encoding transcriptional regulators
were also down-regulated in cdc13-1 strains (Table B in Addi-
tional data file 7). The down-regulated transcription factors
appeared to possess diverse roles and worthy of note is the
telomeric silencing role of RAP1.
Co-expression of functionally related genes in the
response to telomere uncapping
In order to identify groups of genes that may be co-regulated
and/or involved in the same pathways or processes, we sub-
jected genes differentially expressed in cdc13-1 strains to a
'quality threshold' (QT) clustering analysis [32] (Figure 5).
This analysis uses an algorithm that groups genes non-hierar-
chically into high quality clusters based upon similarity in
expression patterns. The QT clustering analysis revealed that
all but 45 of the genes differentially regulated in cdc13-1
strains can be grouped into 13 QT clusters (Figure 5; Tables B-
N in Additional data file 3). In order to identify common
properties of genes in each cluster, we used hypergeometric
tests to determine whether single clusters had higher than
expected numbers of genes that had been implicated in the
DDR, the ESR, or were known to be cell cycle regulated (Table
2). Additionally, we carried out a GOstats analysis [26] to
determine whether the lists were enriched for genes associ-
ated with particular GO terms (Figure 5; Tables E-Q in Addi-
tional data file 4). The majority of the QT clusters were
enriched for genes with specific GO terms and/or exhibited
over-representation of genes involved in the DDR, the ESR or
the cell cycle (Table 2). Thus, within some of the sets of co-
expressed genes there are significant proportions that clearly
share common functions and, as such, their co-ordinate
expression may be critical for the cell to mount its response to
uncapped telomeres.
Expression of genes linked to telomere function
Genes with direct roles in telomere function were scarce in
the cdc13-1 dataset and, accordingly, GOstats did not identify
genes whose products have telomeric roles as being over-rep-
resented. Three genes with established roles in telomere
maintenance were down-regulated in cdc13-1 strains (HEK2,
RAP1 and TBF1), while ESC8, which is involved in chromatin
silencing at telomeres, was up-regulated. Two separate large
scale screens have identified a total of 248 genes that contrib-
ute to maintenance of normal telomere length [33,34]. Direct
comparison of the cdc13-1 gene expression data set to these
showed that five of the up-regulated genes (DUN1, GUP2,
PPE1, YBR284W and YSP3) overlapped with these datasets
while six of the down-regulated genes (HTL1, LRP1, RPB9,
RRP8, BRE1 and NPL6) have been shown to play a role in tel-
omere length maintenance.
In a separate study, our laboratory has carried out a genome-
wide screen that has identified more than 240 gene deletions
that suppress the temperature sensitivity of cdc13-1 strains
and, thus, may play specific roles in telomere capping [35].
With the aim of identifying differentially expressed genes
with novel telomeric roles, we compared the list of cdc13-1
suppressors to genes differentially expressed in the cdc13-1
microarrays, and found that 22 genes were common to both
(Figure 6a and Table 3). In order to extend the comparison
between the two data sets, we used Biogrid [36,37] and
Osprey [38] to identify and visualize functional relationships
Expression of cell cycle-regulated genesFigure 4
Expression of cell cycle-regulated genes. (a) Total numbers of differentially
expressed genes (DEGs) at each time point (filled circles) and numbers of
genes at each time point that have been previously classified as cell cycle
regulated [30] (open circles) are shown. (b) Percentage of total number of
differentially regulated genes at each time point that have been classified as
cell cycle regulated [30] are shown.
DEGs
% CC-regulated DEGs
Time at 30
º
C (hours)
1234
Time at 30
º
C (hours)
123400
0
100
200
300
400
500
20
40
60
80
100
600
700
all genes
CC-regulated
(a) (b)
Genome Biology 2008, Volume 9, Issue 10, Article R146 Greenall et al. R146.9
Genome Biology 2008, 9:R146
between differentially expressed genes and those whose dele-
tion suppresses cdc13-1 temperature sensitivity. These func-
tional relationships are based upon protein-protein
interactions, co-lethality, co-expression across large numbers
of microarray experiments and co-citation in the literature.
We were particularly interested in a gene called BNA2,
because it was highly and significantly up-regulated in cdc13-
1 strains (Figure 6b). Differential expression of BNA2 was not
observed in the absence of telomerase [22], although it is
expressed in response to environmental stress [24]. Biogrid
analysis revealed that BNA2 interacts genetically with a
cdc13-1 suppressor, NPT1 [35], as co-deletion of these genes
is synthetically lethal (Figure 6c). NPT1 is not differentially
expressed when telomeres are uncapped in cdc3-1 strains.
BNA2 encodes a tryptophan 2,3-dioxygenase required for
biosynthesis of nicotinic acid (an NAD
+
precursor) from tryp-
tophan via the kynurenine pathway [39], while NPT1 encodes
a nicotinate phosphoribosyltransferase that acts in the sal-
vage pathway of NAD
+
biosynthesis and is required for telom-
eric silencing [40].
Quality threshold (QT) clustering analysis of genes differentially expressed upon telomere uncappingFigure 5
Quality threshold (QT) clustering analysis of genes differentially expressed upon telomere uncapping. Bioconductor was used to execute a QT clustering
analysis [32] of the 647 differentially expressed genes (DEGs). A Euclidean similarity measure was used. Minimum cluster size was 5 and maximum radius
of clusters was 1.0. Mean expression values of the genes in each cluster relative to the wild-type T = 0 samples were plotted with error bars representing
standard deviations from the mean. Over-represented GO terms for each cluster are indicated.
012340123401234
012340123401234
012340123401234
01234
01234
0123401234
-4
-2
0
2
4
-4
-2
0
2
4
-4
-2
0
2
4
-4
-2
0
2
4
-4
-2
0
2
4
Mean relative expressionMean relative expressionMean relative expressionMean relative expressionMean relative expression
QT cluster 1: 242 genes QT cluster 2: 160 genes QT cluster 3: 77 genes
QT cluster 4: 28 genes QT cluster 5: 23 genes QT cluster 6: 21 genes
QT cluster 7: 9 genes QT cluster 8: 8 genes QT cluster 9: 5 genes
QT cluster 10: 8 genes
QT cluster 13: 7 genes
QT cluster 11: 6 genes QT cluster 12: 8 genes
Time
(hours)
Time
(hours)
Time
(hours)
Time
(hours)
Time
(hours)
Energy generation Helicases + chromatin binding Catabolism
-ve regulation of
nucleotide metabolism N/A CDK regulation
Glycogen biosynthesis N/A Amino acid biosynthesis
N/A Stress responses Cell wall biogenesis
Cell cycle/cell division
cdc13-1
CDC13
+
Genome Biology 2008, Volume 9, Issue 10, Article R146 Greenall et al. R146.10
Genome Biology 2008, 9:R146
NAD
+
biosynthetic genes and telomere capping
In order to determine whether BNA2, like NPT1, interacts
genetically with cdc13-1, we deleted BNA2 and NPT1 in the
W303 strain background and compared the abilities of these
gene deletions to suppress the temperature sensitivity of
cdc13-1 strains. Deletion of BNA2 suppresses the tempera-
ture sensitivity of cdc13-1 strains to similar levels as deletion
of NPT1, allowing cells to grow at 26°C (Figure 7a).
NAD
+
is a ubiquitous biomolecule that is essential for life in
all organisms, both as a coenzyme for oxidoreductases and as
a source of ADP ribosyl groups [41]. We wondered whether
there may be a link between NAD
+
metabolism and telomere
uncapping. NPT1 and BNA2 are both involved in NAD
+
bio-
synthesis and deletion of both suppresses the temperature
sensitivity of cdc13-1 strains. Additionally, genes associated
with the GO term 'nicotinamide metabolic process' are over-
represented in a list of cdc13-1 differentially expressed genes
that are not cell cycle regulated (Table D in Additional data
file 4). 'Nicotinamide metabolic process' is a GO term that
encompasses genes involved in both the synthesis and the
consumption of NAD
+
and its derivatives [42]. The majority
of the differentially expressed genes associated with this GO
term are up-regulated. Three genes with direct roles in NAD
+
biosynthesis are differentially expressed when telomeres are
uncapped in cdc13-1 strains. BNA2 and PNC1, which is
involved in the NAD salvage pathway [40], are up-regulated,
while a down-regulated gene, NMA1 [43], plays roles in both
the salvage and the de novo pathways. Because a yeast cell
must be able to utilize at least one of these pathways to sur-
vive and NMA1 is not an essential gene, NMA1 is clearly not
vital for the synthesis of NAD
+
. This may be because there is
a second enzyme called Nma2 with the same biochemical
activity as Nma1. Thus, up-regulation of BNA2 and PNC1
could lead to increased NAD
+
synthesis when telomeres are
uncapped. Increased NAD
+
levels may be required for the
response to telomere uncapping because biological processes
that increase in cdc13-1 strains include energy production
and oxidative phosphorylation (Table A in Additional data file
4), which require NAD
+
and other up-regulated 'nicotinamide
metabolic process' genes that encode products that utilize
NAD
+
or its derivatives, including NDE1 and NDE2, which are
involved in NADH oxidation, and YEF1, GND2, and SOL4,
which are involved in the synthesis of NADP or NADPH.
NAD
+
is also required for the activity of Sirtuins, which are
deacetylases with conserved roles in DNA repair, heterochro-
matin formation and lifespan determination [44]. Telomere
maintenance appears to be a conserved function of Sirtuins
as, in yeast, they are known to play roles in telomeric silencing
Table 3
Genes differentially regulated in cdc13-1 strains that suppress temperature sensitivity of cdc13-1
Common name ID Function
CPA2 YJR109C Large subunit of carbamoyl phosphate synthetase
TPS1 YBR126C Synthase subunit of trehalose-6-phosphate synthase/phosphatase complex
YIL055C Hypothetical protein
YHR087W Protein involved in RNA metabolism
AIR1 YIL079C RING finger protein
ARX1 YDR101C Protein associated with the ribosomal export complex
ASH1 YKL185W Zinc-finger inhibitor of HO transcription
AYR1 YIL124W NADPH-dependent 1-acyl dihydroxyacetone phosphate reductase
CYT1 YOR065W Cytochrome c1, component of the mitochondrial respiratory chain
FYV10 YIL097W Protein of unknown function, required for survival upon exposure to K1 killer
toxin
HAP3 YBL021C Subunit of the heme-activated, glucose-repressed Hap2p/3p/4p/5p complex
IPK1 YDR315C Inositol 1,3,4,5,6-pentakisphosphate 2-kinase
LIA1 YJR070C Protein with a possible role in microtubule function
MSN4 YKL062W Transcriptional activator related to Msn2p
PET122 YER153C Specific translational activator for the COX3 mRNA
QCR2 YPR191W Subunit 2 of the ubiquinol cytochrome-c reductase complex
RNR3 YIL066C Ribonucleotide-diphosphate reductase (RNR), large subunit
XBP1 YIL101C Transcriptional repressor that binds to promoter sequences of the cyclin genes
YBR147W Hypothetical protein
YMC2 YBR104W Putative mitochondrial inner membrane transporter
ETR1 YBR026C 2-enoyl thioester reductase
TOS1 YBR162C Covalently-bound cell wall protein of unknown function
Twenty-two genes whose expression is altered in cdc13-1 strains and that are also suppressors of cdc13-1 temperature sensitivity [35].
Genome Biology 2008, Volume 9, Issue 10, Article R146 Greenall et al. R146.11
Genome Biology 2008, 9:R146
[44], and SIRT6, a human Sirtuin, is required for modulation
of telomeric chromatin [45].
We wondered whether deletion of BNA2 suppresses cdc13-1
temperature sensitivity via an effect upon Sirtuin function.
We hypothesized that bna2Δ strains may contain reduced
NAD
+
levels when telomeres are uncapped. This may cause
decreased Sirtuin activity, leading to reduction of telomeric
silencing and increasing accessibility of uncapped chromo-
somes to the DNA repair machinery. If deletion of BNA2 res-
cues the temperature sensitivity of cdc13-1 strains via a
reduction in Sirtuin function, deletion of Sirtuin genes should
also have positive effects upon the growth of cdc13-1 mutants
at high temperatures. To test this, we deleted SIR2, and the
functionally related SIR4 gene, in cdc13-1 strains. However,
in contrast to deletion of BNA2, deletion of SIR2 or SIR4
exacerbates the temperature sensitive phenotype of cdc13-1
strains (Figure 7b). Therefore, we conclude that because dele-
tion of BNA2 has opposite effects upon the temperature sen-
sitivity of cdc13-1 to deletions of SIR2 or SIR4, bna2
Δ
does
not suppress cdc13-1 by inhibiting Sirtuin function. To con-
firm this, we also grew cdc13-1 strains in the presence of nico-
tinamide, which inhibits Sirtuin function. Consistent with our
observation that abrogation of Sirtuin function is deleterious
to cdc13-1 strains, nicotinamide inhibited the growth of
cdc13-1 strains, while isonicotinamide, which stimulates Sir-
tuin function, enhanced the growth of cdc13-1 strains (Figure
7c).
To determine whether BNA2 is required to maintain NAD
+
levels upon telomere uncapping in cdc13-1 strains, we directly
quantified intracellular NAD
+
. Firstly, we measured NAD
+
in
wild type, npt1Δ, bna2Δ and cdc13-1 strains grown in rich
medium at 23°C (Figure 7d). Deletion of BNA2 did not reduce
NAD
+
levels under these growth conditions. This was
expected because deletion of BNA1, which is in the same lin-
ear NAD
+
biosynthetic pathway as BNA2, has no discernible
effects upon intracellular NAD
+
levels unless nicotinic acid is
limiting [40]. In contrast, and as previously observed [46],
deletion of NPT1 did lead to a reduction in intracellular NAD
+
levels. At 23°C, NAD
+
levels in cdc13-1 strains were compara-
ble to those recorded in wild-type strains. We also measured
NAD
+
levels after telomere uncapping in cdc13-1 strains 2 and
4 hours after a shift to 30°C, and showed that they did not
change notably (Figure 7d). In order to determine whether
BNA2 is required to augment NAD
+
consumed during the
response to telomere uncapping, we also examined NAD
+
lev-
els in cdc13-1 bna2Δ strains before and after telomere uncap-
ping (Figure 7e). Surprisingly, we did not observe any
reduction in intracellular NAD
+
levels upon telomere uncap-
ping in the absence of BNA2. Thus, BNA2 is not required for
NAD
+
homeostasis in response to telomere uncapping but our
data do not formally rule out that increased BNA2 expression
boosts NAD
+
. We attempted to over-express BNA2 from a
galactose-inducible plasmid to see if this increased intracellu-
lar NAD
+
levels, but found that simply growing cells in galac-
Differentially expressed genes that suppress the temperature sensitivity of cdc13-1Figure 6
Differentially expressed genes that suppress the temperature sensitivity of
cdc13-1. (a) Genes that were differentially expressed in cdc13-1 strains
and those that suppress cdc13-1 temperature sensitivity [35] were plotted
using a Venn diagram. (b) Normalized BNA2 expression values from the
microarray experiment are plotted as in Figure 3. (c) Functional
interactions between BNA2 and genes differentially expressed in cdc13-1
strains or whose deletion suppresses temperature sensitivity of cdc13-1
were identified and visualized using Biogrid and OSPREY. Nodes shown in
light grey represent genes from the cdc13-1 microarray data set, while
nodes shown in dark grey represent genes whose deletion suppresses
cdc13-1 temperature sensitivity. Edges represent functional interactions.
The edge connecting BNA2 and NPT1 represents a 'synthetic lethality'
interaction.
627 220cdc13-1 DEGs cdc13-1 suppressors20
(a)
(c)
(b)
01234
Time at 30
º
C (hours)
Relative expression
0.1
100
10
1
BNA2
CDC13
+
cdc13-1
Genome Biology 2008, Volume 9, Issue 10, Article R146 Greenall et al. R146.12
Genome Biology 2008, 9:R146
NAD
+
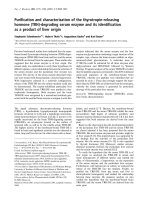
biosynthetic genes and Sirtuin functionFigure 7
NAD
+
biosynthetic genes and Sirtuin function. (a) Six-fold serial dilutions of the indicated strains were spotted onto YEPD plates and grown for 3 days at
the indicated temperatures before being photographed. WT, wild type. (b) Six-fold serial dilutions of the indicated strains were spotted onto YEPD plates
and grown for 3 days at the indicated temperatures before being photographed. (c) Six-fold serial dilutions of the indicated strains were spotted onto
YEPD plates, YEPD plates containing 7.5 mM nicotinamide and YEPD plates containing 20 mM isonicotinamide, and grown for 3 days at the indicated
temperatures before being photographed. (d) NAD
+
levels in indicated strains; values represent the mean of two measurements. (e) NAD
+
levels in
indicated strains; values represent the mean of two measurements.
(a)
23
º
C
26
º
C27
º
C
23
º
C
26
º
C
(b)
26
º
C
(c)
YEPD
7.5 mM NAM
20mM isoNAM
(d)
(e)
0
2
4
6
8
10
12
640 WT
3493 npt1Δ
3501 bna2Δ
1108 cdc13-1 T=0
1195 cdc13-1 T=0
1108 cdc13-1 T=2
1195 cdc13-1 T=2
1108 cdc13-1 T=4
1195 cdc13-1 T=4
NAD (μM)
0
2
4
6
8
10
12
3504 bna2Δ cdc13-1 T=0
1108 cdc13-1 T=0
1108 cdc13-1 T=2
1108 cdc13-1 T=4
NAD (μM)
3660 bna2Δ cdc13-1 T=0
3504 bna2Δ cdc13-1 T=2
3660 bna2Δ cdc13-1 T=2
3504 bna2Δ cdc13-1 T=4
3660 bna2Δ cdc13-1 T=4
cdc13-1sir2Δ 1944
cdc13-1sir4
Δ 1993
WT 640
cdc13-1 1108
cdc13-1 1195
WT 640
WT 640
WT 640
WT 640
cdc13-1 1108
cdc13-1 1108
cdc13-1 1108
cdc13-1 1108
cdc13-1 1195
cdc13-1 1195
cdc13-1 1195
cdc13-1 1195
cdc13-1 1195
cdc13-1 1195
bna2
Δ 3501
cdc13-1 bna2
Δ 3504
cdc13-1 bna2
Δ 3660
cdc13-1 npt1
Δ 3495
cdc13-1 npt1
Δ 3496
npt1
Δ 3493
Genome Biology 2008, Volume 9, Issue 10, Article R146 Greenall et al. R146.13
Genome Biology 2008, 9:R146
tose led to very high intracellular NAD
+
levels (data not
shown). Telomere uncapping in cdc13-1 strains induces
expression of genes involved in de novo NAD
+
synthesis and
also in NAD
+
salvage. Thus, when telomeres are uncapped in
the absence of BNA2, intracellular NAD
+
levels may be main-
tained by the NAD
+
salvage pathway. Further experiments are
required to determine the mechanism by which BNA2 affects
telomere capping and whether this is related to its role in
NAD
+
biosynthesis.
Discussion
The genome-wide response to telomere uncapping in
cdc13-1 strains
Uncapped telomeres are dangerous to unicellular and multi-
cellular organisms as they are precursors to genomic instabil-
ity [1]. Hence, conserved cellular responses to damaged
telomeres have evolved. Telomere damage in budding yeast
leads to a cell cycle arrest [1,6,22,47] that resembles replica-
tive senescence induced by uncapped telomeres in mamma-
lian cells [7,48]. Here we show that, in response to acute
telomere damage in cdc13-1 yeast strains, cells mount a tran-
scriptional response that exhibits distinct features and that
also encompasses aspects of the responses in yeast to the
absence of telomerase [22], the DDR [27] and the ESR [24].
Furthermore, the response to uncapped telomeres in cdc13-1
budding yeast strains has features in common with the
responses to telomere damage in Schizosaccharomyces
pombe [49] and in mammalian cells [50].
Telomere damage induces a response distinct from the
DDR
A major question is whether uncapped telomeres are recog-
nized simply as DSBs or whether the cell senses them as a dis-
tinct type of damage. The majority of genes altered in cdc13-1
strains have not thus far been implicated in the DDR, showing
that the response to uncapped telomeres is not identical to the
response to DSBs at non-telomeric loci. The response to tel-
omerase deletion was also sufficiently different to the DDR
for the same conclusion to be drawn [22]. Thus, we confirm
that the general cellular response to telomere damage is dis-
tinct from the response to DSBs. It is noteworthy that, while
telomere uncapping in cdc13-1 strains is associated with the
differential expression of many genes involved in the DDR,
absent are most of those that are known to be critical for the
checkpoint arrest, such as MEC1, DDC2, RAD9, RAD24,
DDC1, MEC3, RAD17, RAD53 and CHK1 [1,3]. Many of these
are kinases or kinase regulators and, therefore, may not be
expected to be transcriptionally regulated. In fact, differential
expression of checkpoint genes was not observed in response
to ionizing radiation in S. cerevisiae [27] or S. pombe [51],
suggesting that these genes are primarily regulated at the
post-translational level. One exception is the DDR kinase-
encoding gene DUN1, which is up-regulated in cdc13-1 strains
and in response to other cellular insults [27,51]. Interestingly,
DUN1 is also induced in senescent human retinal pigment
epithelial cells with shortened telomeres [52], suggesting that
its altered expression may be a common feature in response
to telomere damage.
Induction of a stress response may be a conserved
feature of the response to telomere damage
A major feature of the response to telomere damage in cdc13-
1 strains and to the absence of telomerase is the induction of
genes involved in the ESR. Telomerase deletion in S. pombe
is associated with the differential expression of many genes
that are also involved in the ESR [49]. A microarray analysis
of replicative senescence comparing young human fibroblasts
with senescent fibroblasts with shortened telomeres demon-
strated that genes involved in stress responses were altered
[50], suggesting that telomere damage in mammalian cells is
also perceived as a stress. Thus, it appears that the induction
of stress responses when telomeres are damaged may be
conserved.
NAD
+
synthetic genes have roles in telomere capping
BNA2 is highly and significantly up-regulated when telom-
eres are uncapped in cdc13-1 strains and is involved in de
novo NAD
+
synthesis [39]. Identification of a functional
interaction between BNA2 and a suppressor of cdc13-1 tem-
perature sensitivity, NPT1, suggested that a bna2Δ might also
suppress it (Figure 6c). This was confirmed as deletion of
BNA2 allowed growth of cdc13-1 strains at 26°C (Figure 7a).
That Bna2 inhibits the growth of yeast with telomere capping
defects indicates that Bna2 possesses a previously unknown
role in the cellular response to telomere uncapping. NPT1 is
also involved in the generation of NAD
+
[40]. Thus, NAD
+
metabolism may be linked to responses to telomere uncap-
ping. In support of this hypothesis, GOstats analysis of genes
altered in cdc13-1 strains but not periodically expressed dur-
ing the cell cycle revealed that genes involved in nicotinamide
metabolism were over-represented. It is also noteworthy that
genes involved in nicotinate and nicotinamide metabolism
were over-represented in the list of genes differentially
expressed in senescent human fibroblasts with shortened tel-
omeres [50]. Because NAD
+
is required for the activity of Sir-
tuins, we investigated whether deletion of BNA2 was exerting
its effects upon cdc13-1 via modulation of Sirtuin function.
Our experiments suggest that this is not the case (Figure
7b,c). It is likely that deletion of NPT1 reduces Sirtuin activity
[40,46]. Reduced Sirtuin function has adverse effects upon
cdc13-1 (Figure 7b,c), but despite this, npt1Δ suppresses the
temperature sensitivity of cdc13-1 (Figure 7a) [35]. Thus,
cdc13-1 suppression in npt1Δ strains is likely also independ-
ent of any role in modulation of Sirtuin function. NAD
+
is an
abundant biomolecule with many roles within the cell. Fur-
ther experiments will investigate whether the roles of BNA2
and NPT1 in telomere capping are related to other aspects of
NAD
+
regulation and, if so, how this affects telomere
function.
Genome Biology 2008, Volume 9, Issue 10, Article R146 Greenall et al. R146.14
Genome Biology 2008, 9:R146
Conclusions
Dysregulation of telomere capping is associated with aging
and carcinogenesis. To better understand eukaryotic
responses to telomere uncapping, we examined the genome-
wide transcriptional response to telomere uncapping in
cdc13-1 yeast strains. The response to uncapped telomeres in
cdc13-1 strains has features in common with responses to the
absence of telomerase, environmental stress, and to DNA
damage at non-telomeric loci. Induction of stress responses
appears to be a conserved feature of the eukaryotic response
to telomere damage. The BNA2 gene, involved in NAD
+
syn-
thesis, is highly and significantly induced when telomeres are
uncapped in yeast, and its gene product acts to inhibit growth
of cdc13-1 mutants. From this, and complementary experi-
ments, we conclude that genes involved in NAD
+
metabolism
play roles in telomere end protection, which has implications
for aging and carcinogenesis.
Materials and methods
Strains, media and growth conditions
All strains used in the microarray study were in the S288C
background (Table 4). All strains used for spot tests were in
the W303 genetic background (Table 4). Cultures were grown
in YEPD supplemented with 50 mg/l adenine. Strains for
microarray study were grown in medium derived from a sin-
gle batch. To construct strains, standard genetic procedures
of transformation and tetrad analysis were used [53].
Culture growth, sample collection, RNA isolation and
microarray processing
Cultures were grown overnight at 23°C to a density of 3-4 ×
10
6
cells/ml and diluted as described previously [23]. Cultures
were transferred to restrictive temperatures and no further
dilutions were made thereafter. Aliquots were taken at each
time point to assess cell cycle arrest, viability and cell num-
bers as described previously [23]. Samples were harvested by
spinning at 3,000 rpm for 2 minutes before being snap fro-
zen. RNA was isolated using a hot phenol method followed by
purification using Qiagen (Crawley, West Sussex, UK) RNe-
asy columns [54]. cDNA was prepared, labeled and hybrid-
ized to Affymetrix GeneChip Yeast Genome 2.0 arrays,
according to the manufacturer's instructions. Arrays were
scanned with an Affymetrix Genechip Scanner.
Quantitative RT-PCR
RNA was prepared as described above and treated with
DNAse I from Invitrogen (Paisley, Renfrewshire, UK),
according to the manufacturer's instructions. RT-PCRs were
carried out using the Invitrogen Superscript III Platinum
SYBR green one-step qRT-PCR kit, as prescribed by the man-
ufacturer, using an ABI (Warrington, Cheshire, UK) prism
Table 4
Strains used in this study
Name Genotype Background Reference
DLY3107 MAT
α
mfa::MFA1pr-HIS3 can1 ura3 leu2 his3 lys2 S288C This study
DLY3108 MAT
α
mfa::MFA1pr-HIS3 can1 ura3 leu2 his3 lys2 S288C This study
DLY1584 MAT
α
mfa::MFA1pr-HIS3 can1 ura3 leu2 his3 lys2 S288C Tong et al. [58]
DLY3100 MAT
α
cdc13-1-int mfa::MFA1pr-HIS3 can1 ura3 leu2 his3 lys2 S288C This study
DLY3102 MAT
α
cdc13-int mfa::MFA1pr-HIS3 can1 ura3 leu2 his3 lys2 S288C This study
DLY1622 MAT
α
cdc13-int mfa::MFA1pr-HIS3 can1 ura3 leu2 his3 lys2 S288C Downey et al[60]
DLY640 MATa ade2-1 trp1-1 can1-100 leu2-3,112 his3-11,15 ura3 GAL+ psi+ ssd1-d2 RAD5 W303 Zubko et al[61]
DLY1108 MATa ade2-1 trp1-1 can1-100 leu2-3,112 his3-11,15 ura3 GAL+ psi+ ssd1-d2 RAD5 cdc13-1-int W303 Zubko et al[61]
DLY1195 MAT
α
trp1-1 can1-100 leu2-3,112 his3-11,15 ura3 GAL+ psi+ ssd1-d2 RAD5 cdc13-1-int LYS+ ade2-1 W303 Zubko et al[61]
DLY1944 MATa cdc13-1::int RAD5 sir2::TRP1 hml::leu2::URA3 ade2-1 trp1-1 can1-100 leu2-3,112 his3-11,15 ura3-52
GAL+ psi+ ssd1-d2
W303 This study
DLY1993 MATa cdc13-1::int RAD5 sir4::HIS3 hml::leu2::URA3 RAD5 ade2-1 trp1-1 can1-100 leu2-3,112 his3-11,15
ura3-52 GAL+ psi+ ssd1-d2
W303 This study
DLY3501 MATa bna2::KANMX ade2-1 trp1-1 can1-100 leu2-3,112 his3-11,15 ura3 GAL+ psi+ ssd1-d2 RAD5 W303 This study
DLY3504 MATa bna2::KANMX cdc13-1-int ade2-1 trp1-1 can1-100 leu2-3,112 his3-11,15 ura3 GAL+ psi+ ssd1-d2
RAD5
W303 This study
DLY3660 MATa bna2::KANMX cdc13-1-int ade2-1 trp1-1 can1-100 leu2-3,112 his3-11,15 ura3 GAL+ psi+ ssd1-d2
RAD5
W303 This study
DLY3493 MATa npt1::KANMX ade2-1 trp1-1 can1-100 leu2-3,112 his3-11,15 ura3 GAL+ psi+ ssd1-d2 RAD5 W303 This study
DLY3495 MATa npt1::KANMX cdc13-1-int ade2-1 trp1-1 can1-100 leu2-3,112 his3-11,15 ura3 GAL+ psi+ ssd1-d2
RAD5
W303 This study
DLY3496 MAT
α
npt1::KANMX cdc13-1-int ade2-1 trp1-1 can1-100 leu2-3,112 his3-11,15 ura3 GAL+ psi+ ssd1-d2
RAD5
W303 This study
Genome Biology 2008, Volume 9, Issue 10, Article R146 Greenall et al. R146.15
Genome Biology 2008, 9:R146
7700 sequence detector. PCR primers (Table 5) were from
Sigma Genosys (Gillingham, Dorset, UK) and were designed
using the Invitrogen OligoPerfect designer. In all cases, each
measurement was performed in triplicate. Correction factors
to normalize RNA concentrations of each sample were gener-
ated by quantification of up to three loading controls (ACT1,
PAC2 and BUD6). Where indicated, the geometric means of
multiple loading controls were calculated [55].
Analysis of microarray data
CEL files and MIAME-compliant information for those files
were stored internally in the CISBAN SyMBA repository [56].
SyMBA is an open-source project that provides an archive
and web interface for multi-omics experimental data and
associated metadata. Raw data is publicly available from the
ArrayExpress website, accession number E-MEXP-1551. To
identify significant differentially expressed genes whose
expression was altered in cdc13-1 strains relative to CDC13
+
at
least two-fold during at least one time point in all three
replicates, CEL files were loaded into Bioconductor [57] and
the data normalized using RMA. The list of significantly dif-
ferentially expressed genes used for subsequent analysis was
based on the limma contrasts 'm1-w1', 'm2-w2', 'm3-w3', 'm4-
w4'. The probe sets with F-test p-value (adjusted using the
'Bonferroni' method for multiple testing) lower than 0.05 are
identified as significantly differentially expressed. GOstats
analyses [26] were carried out using GOstats version 2.6.0
and data were subjected to conditional hypergeometric tests
with a cut-off of 0.01.
Creation of W303 deletion strains
Deletion constructs were amplified by PCR from S288C gene
deletion library strains, in which genes have been replaced
with a KANMX cassette [58]. Primers are described in Table
6. PCR fragments were transformed into the diploid W303
strain DDY145 (cdc13-1/CDC13
+
rad9::HIS3/RAD9
+
) as
described previously [59], with an additional incubation for 2
hours at 23°C at the end of the protocol. Transformants were
selected based upon G418 resistance and gene deletions were
confirmed by PCR, using forward (5') primers (Table 6) and
reverse primer 1261 (TCAGCATCCATGTTGGAATT), which
anneals to the G418 cassette. Diploids were sporulated, tet-
rads dissected and progeny selected.
Spot tests
Cultures (2 ml) were grown overnight to saturation, diluted to
OD
600
= 1 and then subjected to a six-fold dilution series in a
96-well plate using sterile water. We spotted 3-5 μl onto spec-
ified plates using a 48-prong replica plating device and plates
were incubated at specified temperatures for 3 days before
being photographed.
NAD
+
measurements
NAD
+
measurements were made using a BioAssay Systems
(Hayward, CA, USA) EnzyChrom NAD
+
/NADH Assay kit.
Cultures (2 ml) were grown overnight to saturation, diluted to
OD
600
= 0.5 in 5 ml and allowed to double. OD
600
measure-
ments were taken before cultures were harvested and pellets
resuspended in 125 μl NAD
+
extraction buffer. Ice-cold acid-
washed glass beads (0.25 ml) were added. Lysis was achieved
by applying samples to a Stretton Scientific (Stretton, Derby-
shire, UK) Precellys 24 for 2 × 10 seconds at 6,500 rpm. Sam-
ples were recovered and assays were carried out according to
the kit manufacturer's instructions. NAD
+
levels in each sam-
ple were quantified in duplicate. Correction factors based
upon OD measurements were generated to account for
increases in cell size after cell cycle arrest and applied to cal-
culated NAD
+
concentrations.
Table 5
Primers for Q RT-PCR
Primer Alias Sequence
1082 ACT1F GCCTTCTACGTTTCCATCCA
1083 ACT1R GGCCAAATCGATTCTCAAAA
1367 PAC2F AATAACGAATTGAGCTATGACACCAA
1368 PAC2R AGCTTACTCATATCGATTTCATACGACTT
1172 BUD6F CAGACCGAACTCGGTGATTT
1173 BUD6R TTTTAGCGGGCTGAGACCTA
1163 HSP12F AAGGTCGCTGGTAAGGTTCA
1164 HSP12R GCTTGGTCTGCCAAAGATTC
1244 PNC1F T T G T G G T C A C C A G A G A T T G G
1245 PNC1R C T G G C C T T G G A G A G T G G T A G
1242 UBI4F G G T A T T C C T C C A G A C C A G C A
1243 UBI4R T A C C A C C C C T C A A C C T C A A G
1234 MAG1F T C A A C A G A T C A G T G G C C A A G
1235 MAG1R G C A C A T T T T G C T G G G T C T T T
1246 RNR3F C A G G G T T T G G C C G A T A C T T A
1247 RNR3R C T T C T T T T T G G G C C A A T T C A
1248 YKL161CF T G G C C G A A C T A C T T G G T A G G
1249 YKL161CR G C A A T G T T T C C T C A G G T G G T
1165 MSC1F TCTTCGGATCACCCAGTTTC
1166 MSC1R G AAGCCTTAGCGTCGTCAAC
1084 CTT1F AAAGAGTTCCGGAGCGTGTA
1085 CTT1R ACGGTGGAAAAACGAACAAG
Table 6
PCR primers for W303 deletion strains
Primer Alias Sequence
1280 BNA2 5' C T C G A C G C T G A T T G G C T A A
1281 BNA2 3' G T A A C C A G T A C G A A A A A A G A T A
C A T T T
1278 NPT1 5' C A T T G T G A T T T T A T T C A A T G T T T
C T T T
1279 NPT1 3' C A G G G T G T G G A A G A A C A G G T
Genome Biology 2008, Volume 9, Issue 10, Article R146 Greenall et al. R146.16
Genome Biology 2008, 9:R146
Abbreviations
DDR: DNA-damage response; ds: double stranded; DSB:
double-strand break; ESR: environmental stress response;
GO: Gene Ontology; QT: quality threshold; ss: single-
stranded; STRE: stress-response element.
Authors' contributions
AG designed and carried out the majority of the experiments,
analyzed the data and drafted and edited the manuscript. GL,
DCS, and DJW processed and analyzed array data. KJ and
AW carried out GOstats analysis. LW and HP carried out
experiments. DL designed experiments and drafted and
edited the manuscript.
Additional data files
The following additional data are available with the online
version of this paper. Additional data file 1 is a figure showing
RT-PCR analysis of heat shock gene expression. Additional
data file 2 is a figure showing quality control of microarray
strains and samples. Additional data file 3 includes tables list-
ing differentially expressed genes in cdc13-1 strains and genes
in QT clusters 1-13. Additional data file 4 includes tables list-
ing results from GOstats analyses. Additional data file 5 is a
figure showing expression of HSP12, MSC1 and CTT1 during
the microarray time course. Additional data file 6 includes
tables listing differentially expressed genes in both cdc13-1
and tlc1Δ and genes altered in cdc13-1 but not in tlc1Δ. Addi-
tional data file 7 includes tables listing transcription factor
genes up-regulated and down-regulated in cdc13-1 strains.
Additional data file 1RT-PCR analysis of heat shock gene expressionRT-PCR analysis of heat shock gene expression.Click here for fileAdditional data file 2Quality control of microarray strains and samplesQuality control of microarray strains and samples.Click here for fileAdditional data file 3Differentially expressed genes in cdc13-1 strains and genes in QT clusters 1-13Table A lists differentially expressed genes in cdc13-1 strains. Tables B-N list genes in QT clusters 1-13, respectively.Click here for fileAdditional data file 4Results from GOstats analysesTable A shows GOstats analysis of up-regulated genes. Table B shows GOstats analysis of down-regulated genes. Table C shows GOstats analysis of genes altered in CDC13
+
strains. Table D shows GOstats analysis of genes altered in cdc13-1 strains that are not cell cycle regulated. Tables E-Q show GOstats analysis of genes in QT clusters 1-13 respectively.Click here for fileAdditional data file 5Expression of HSP12, MSC1 and CTT1 during the microarray time courseExpression of HSP12, MSC1 and CTT1 during the microarray time course.Click here for fileAdditional data file 6Differentially expressed genes in both cdc13-1 and tlc1Δ and genes altered in cdc13-1 but not in tlc1ΔTable A lists differentially expressed genes in both cdc13-1 and tlc1Δ. Table B lists genes altered in cdc13-1 but not in tlc1Δ.Click here for fileAdditional data file 7Transcription factor genes up-regulated and down-regulated in cdc13-1 strainsTable A lists transcription factor genes up-regulated in cdc13-1 strains. Table B lists transcription factor genes down-regulated in cdc13-1 strains.Click here for file
Acknowledgements
We would like to thank Jürg Bähler for critical reading of the manuscript
and members of CISBAN for helpful discussions. We are grateful to
Stephen Addinall for help with BioGrid and to Allyson Lister for assistance
with the ArrayExpress submission. This work was supported by the BBSRC
CISBAN grant (BB/C008200/1).
References
1. Lydall D: Hiding at the ends of yeast chromosomes: telom-
eres, nucleases and checkpoint pathways. J Cell Sci 2003,
116:4057-4065.
2. Longhese MP, Foiani M, Muzi-Falconi M, Lucchini G, Plevani P: DNA
damage checkpoint in budding yeast. EMBO J 1998,
17:5525-5528.
3. Longhese MP: DNA damage response at functional and dys-
functional telomeres. Genes Dev 2008, 22:125-140.
4. Cech TR: Beginning to understand the end of the
chromosome. Cell 2004, 116:273-279.
5. Lundblad V, Blackburn EH: An alternative pathway for yeast tel-
omere maintenance rescues est1-senescence. Cell 1993,
73:347-360.
6. Lundblad V, Szostak JW: A mutant with a defect in telomere
elongation leads to senescence in yeast. Cell 1989, 57:633-643.
7. d'Adda di Fagagna F, Reaper PM, Clay-Farrace L, Fiegler H, Carr P,
Von Zglinicki T, Saretzki G, Carter NP, Jackson SP: A DNA damage
checkpoint response in telomere-initiated senescence.
Nature 2003, 426:194-198.
8. Zubko MK, Lydall D: Linear chromosome maintenance in the
absence of essential telomere-capping proteins. Nat Cell Biol
2006, 8:734-740.
9. Garvik B, Carson M, Hartwell L: Single-stranded DNA arising at
telomeres in cdc13 mutants may constitute a specific signal
for the RAD9 checkpoint. Mol Cell Biol 1995, 15:6128-6138.
10. Grandin N, Damon C, Charbonneau M: Cdc13 prevents telomere
uncapping and Rad50-dependent homologous
recombination. EMBO J 2001, 20:6127-6139.
11. Blasco MA: Telomeres and human disease: ageing, cancer and
beyond. Nat Rev Genet 2005, 6:611-622.
12. Lin JJ, Zakian VA: The Saccharomyces CDC13 protein is a single-
strand TG1-3 telomeric DNA-binding protein in vitro that
affects telomere behavior
in vivo. Proc Natl Acad Sci USA 1996,
93:13760-13765.
13. Nugent CI, Hughes TR, Lue NF, Lundblad V: Cdc13p: a single-
strand telomeric DNA-binding protein with a dual role in
yeast telomere maintenance. Science 1996, 274:249-252.
14. Evans SK, Lundblad V: Est1 and Cdc13 as comediators of telom-
erase access. Science 1999, 286:117-120.
15. Pennock E, Buckley K, Lundblad V: Cdc13 delivers separate com-
plexes to the telomere for end protection and replication.
Cell 2001, 104:387-396.
16. Bianchi A, Negrini S, Shore D: Delivery of yeast telomerase to a
DNA break depends on the recruitment functions of Cdc13
and Est1. Mol Cell 2004, 16:139-146.
17. Maringele L, Lydall D: EXO1-dependent single-stranded DNA
at telomeres activates subsets of DNA damage and spindle
checkpoint pathways in budding yeast yku70Delta mutants.
Genes Dev 2002, 16:1919-1933.
18. Lydall D, Weinert T: Yeast checkpoint genes in DNA damage
processing: implications for repair and arrest. Science 1995,
270:1488-1491.
19. Qi H, Li TK, Kuo D, Nur EKA, Liu LF: Inactivation of Cdc13p trig-
gers MEC1-dependent apoptotic signals in yeast. J Biol Chem
2003, 278:15136-15141.
20. Wysocki R, Kron SJ: Yeast cell death during DNA damage
arrest is independent of caspase or reactive oxygen species.
J Cell Biol 2004, 166:311-316.
21. Weinert TA, Kiser GL, Hartwell LH: Mitotic checkpoint genes in
budding yeast and the dependence of mitosis on DNA repli-
cation and repair. Genes Dev 1994, 8:652-665.
22. Nautiyal S, DeRisi JL, Blackburn EH: The genome-wide expres-
sion response to telomerase deletion in Saccharomyces
cerevisiae. Proc Natl Acad Sci USA 2002, 99:9316-9321.
23. Zubko MK, Maringele L, Foster SS, Lydall D:
Detecting repair
intermediates in vivo: effects of DNA damage response
genes on single-stranded DNA accumulation at uncapped
telomeres in budding yeast. Methods Enzymol 2006, 409:285-300.
24. Gasch AP, Spellman PT, Kao CM, Carmel-Harel O, Eisen MB, Storz
G, Botstein D, Brown PO: Genomic expression programs in the
response of yeast cells to environmental changes. Mol Biol Cell
2000, 11:4241-4257.
25. Smyth GK: Linear models and empirical bayes methods for
assessing differential expression in microarray experiments.
Stat Appl Genet Mol Biol 2004, 3:Article3.
26. Falcon S, Gentleman R: Using GOstats to test gene lists for GO
term association. Bioinformatics 2007, 23:257-258.
27. Gasch AP, Huang M, Metzner S, Botstein D, Elledge SJ, Brown PO:
Genomic expression responses to DNA-damaging agents
and the regulatory role of the yeast ATR homolog Mec1p.
Mol Biol Cell 2001, 12:2987-3003.
28. Lee SE, Pellecioli A, Demeter J, Vaze MP, Gasch AP, Malkova A,
Brown PO, Botstein D, Stearns T, Foiani M, Haber JE: Genomic
expression in yeast responding to HO endonuclease cleav-
age. In Biological Responses To DNA Damage Volume 65. Plainview,
New York: Cold Spring Harbour Laboratory Press; 2000:303-314.
29. Martinez-Pastor MT, Marchler G, Schuller C, Marchler-Bauer A, Ruis
H, Estruch F: The Saccharomyces cerevisiae zinc finger proteins
Msn2p and Msn4p are required for transcriptional induction
through the stress response element (STRE). EMBO J 1996,
15:2227-2235.
30. Orlando DA, Lin CY, Bernard A, Wang JY, Socolar JE, Iversen ES,
Hartemink AJ, Haase SB: Global control of cell-cycle transcrip-
tion by coupled CDK and network oscillators. Nature 2008,
453:944-947.
31. Harbison CT, Gordon DB, Lee TI, Rinaldi NJ, Macisaac KD, Danford
TW, Hannett NM, Tagne JB, Reynolds DB, Yoo J, Jennings EG, Zei-
tlinger J, Pokholok DK, Kellis M, Rolfe PA, Takusagawa KT, Lander ES,
Gifford DK, Fraenkel E, Young RA: Transcriptional regulatory
Genome Biology 2008, Volume 9, Issue 10, Article R146 Greenall et al. R146.17
Genome Biology 2008, 9:R146
code of a eukaryotic genome. Nature 2004, 431:99-104.
32. Heyer LJ, Kruglyak S, Yooseph S: Exploring expression data:
identification and analysis of coexpressed genes. Genome Res
1999, 9:1106-1115.
33. Askree SH, Yehuda T, Smolikov S, Gurevich R, Hawk J, Coker C,
Krauskopf A, Kupiec M, McEachern MJ: A genome-wide screen
for Saccharomyces cerevisiae deletion mutants that affect tel-
omere length. Proc Natl Acad Sci USA 2004, 101:8658-8663.
34. Gatbonton T, Imbesi M, Nelson M, Akey JM, Ruderfer DM, Kruglyak
L, Simon JA, Bedalov A: Telomere length as a quantitative trait:
genome-wide survey and genetic mapping of telomere
length-control genes in yeast. PLoS genetics 2006, 2:e35.
35. Addinall S, Downey M, Yu M, Zubko MK, Dewar J, Leake A, Hallinan
J, Shaw O, James K, Wilkinson DJ, Wipat A, Durocher D, Lydall D: A
genome-wide suppressor and enhancer analysis of cdc13-1
reveals varied cellular processes influencing telomere cap-
ping in Saccharomyces cerevisiae. Genetics 2008 in press.
36. Stark C, Breitkreutz BJ, Reguly T, Boucher L, Breitkreutz A, Tyers M:
BioGRID: a general repository for interaction datasets.
Nucleic Acids Res 2006, 34:D535-539.
37. Breitkreutz BJ, Stark C, Reguly T, Boucher L, Breitkreutz A, Livstone
M, Oughtred R, Lackner DH, Bahler J, Wood V, Dolinski K, Tyers M:
The BioGRID Interaction Database: 2008 update. Nucleic
Acids Res 2008, 36:D637-640.
38. Breitkreutz BJ, Stark C, Tyers M: Osprey: a network visualization
system. Genome Biol 2003, 4:R22.
39. Panozzo C, Nawara M, Suski C, Kucharczyka R, Skoneczny M, Becam
AM, Rytka J, Herbert CJ: Aerobic and anaerobic NAD+ metab-
olism in Saccharomyces cerevisiae. FEBS Lett 2002,
517:97-102.
40. Sandmeier JJ, Celic I, Boeke JD, Smith JS: Telomeric and rDNA
silencing in Saccharomyces cerevisiae are dependent on a
nuclear NAD(+) salvage pathway. Genetics 2002, 160:877-889.
41. Bieganowski P, Brenner C: Discoveries of nicotinamide riboside
as a nutrient and conserved NRK genes establish a Preiss-
Handler independent route to NAD+ in fungi and humans.
Cell 2004, 117:495-502.
42. Saccharomyces Genome Database [ />cgi-bin/GO/goTerm.pl?goid=6769]
43. Anderson RM, Bitterman KJ, Wood JG, Medvedik O, Cohen H, Lin
SS, Manchester JK, Gordon JI, Sinclair DA: Manipulation of a
nuclear NAD+ salvage pathway delays aging without altering
steady-state NAD+ levels. J Biol Chem 2002, 277:18881-18890.
44. Michan S, Sinclair D: Sirtuins in mammals: insights into their
biological function. Biochem J 2007, 404:1-13.
45. Michishita E, McCord RA, Berber E, Kioi M, Padilla-Nash H, Damian
M, Cheung P, Kusumoto R, Kawahara TL, Barrett JC, Chang HY, Bohr
VA, Ried T, Gozani O, Chua KF: SIRT6 is a histone H3 lysine 9
deacetylase that modulates telomeric chromatin. Nature
2008, 452:492-496.
46. Smith JS, Brachmann CB, Celic I, Kenna MA, Muhammad S, Starai VJ,
Avalos JL, Escalante-Semerena JC, Grubmeyer C, Wolberger C,
Boeke JD: A phylogenetically conserved NAD+-dependent
protein deacetylase activity in the Sir2 protein family. Proc
Natl Acad Sci USA 2000, 97:6658-6663.
47. Enomoto S, Glowczewski L, Lew-Smith J, Berman JG: Telomere cap
components influence the rate of senescence in telomerase-
deficient yeast cells. Mol Cell Biol 2004, 24:837-845.
48. Blackburn EH, Chan S, Chang J, Fulton TB, Krauskopf A, McEachern
M, Prescott J, Roy J, Smith C, Wang H: Molecular manifestations
and molecular determinants of telomere capping. Cold Spring
Harbor Symp Quant Biol 2000, 65:253-263.
49. Mandell JG, Bahler J, Volpe TA, Martienssen RA, Cech TR: Global
expression changes resulting from loss of telomeric DNA in
fission yeast. Genome Biol 2005, 6:R1.
50. Passos JF, Saretzki G, Ahmed S, Nelson G, Richter T, Peters H, Wap-
pler I, Birket MJ, Harold G, Schaeuble K, Birch-Machin MA, Kirkwood
TB, von Zglinicki T: Mitochondrial dysfunction accounts for the
stochastic heterogeneity in telomere-dependent
senescence. PLoS Biol 2007, 5:e110.
51. Watson A, Mata J, Bahler J, Carr A, Humphrey T: Global gene
expression responses of fission yeast to ionizing radiation.
Mol Biol Cell 2004, 15:851-860.
52. Shelton DN, Chang E, Whittier PS, Choi D, Funk WD: Microarray
analysis of replicative senescence. Curr Biol 1999, 9:939-945.
53. Adams A, Gottschling DE, Kaiser CA, Stearns T: Methods in Yeast
Genetics New York: Cold Spring Harbour Laboratory Press; 1997.
54. Lyne R, Burns G, Mata J, Penkett CJ, Rustici G, Chen D, Langford C,
Vetrie D, Bahler J: Whole-genome microarrays of fission yeast:
characteristics, accuracy, reproducibility, and processing of
array data. BMC genomics 2003, 4:27.
55. Vandesompele J, De Preter K, Pattyn F, Poppe B, Van Roy N, De
Paepe A, Speleman F: Accurate normalization of real-time
quantitative RT-PCR data by geometric averaging of multi-
ple internal control genes. Genome Biol 2002, 3:RESEARCH0034.
56. SyMBA []
57. Bioconductor []
58. Tong AH, Evangelista M, Parsons AB, Xu H, Bader GD, Page N, Rob-
inson M, Raghibizadeh S, Hogue CW, Bussey H, Andrews B, Tyers M,
Boone C: Systematic genetic analysis with ordered arrays of
yeast deletion mutants. Science 2001, 294:2364-2368.
59. Schiestl RH, Gietz RD: High efficiency transformation of intact
yeast cells using single stranded nucleic acids as a carrier.
Curr Genet 1989, 16:339-346.
60. Downey M, Houlsworth R, Maringele L, Rollie A, Brehme M, Galicia
S, Guillard S, Partington M, Zubko MK, Krogan NJ, Emili A, Greenblatt
JF, Harrington L, Lydall D, Durocher D: A genome-wide screen
identifies the evolutionarily conserved KEOPS complex as a
telomere regulator. Cell 2006, 124:1155-1168.
61. Zubko MK, Guillard S, Lydall D: Exo1 and Rad24 differetially reg-
ulate generation of ssDNA at telomeres of Saccharomyces
cerevisiae cdc13-1 mutants. Genetics 2004, 168:103-115.