Báo cáo y học: "Variations in the transcriptome of Alzheimer''''s disease reveal molecular networks involved in cardiovascular diseases" potx
Bạn đang xem bản rút gọn của tài liệu. Xem và tải ngay bản đầy đủ của tài liệu tại đây (1.02 MB, 14 trang )
Genome Biology 2008, 9:R148
Open Access
2008Rayet al.Volume 9, Issue 10, Article R148
Research
Variations in the transcriptome of Alzheimer's disease reveal
molecular networks involved in cardiovascular diseases
Monika Ray
¤
*
, Jianhua Ruan
¤
†
and Weixiong Zhang
*‡
Addresses:
*
Washington University School of Engineering, Department of Computer Science and Engineering, 1 Brookings Drive, Saint Louis,
Missouri 63130, USA.
†
University of Texas at San Antonio, Department of Computer Science, One UTSA Circle, San Antonio, Texas 78249, USA.
‡
Washington University School of Medicine, Department of Genetics, 660 S. Euclid Ave, Saint Louis, Missouri 63110, USA.
¤ These authors contributed equally to this work.
Correspondence: Weixiong Zhang. Email:
© 2008 Ray et al.; licensee BioMed Central Ltd.
This is an open access article distributed under the terms of the Creative Commons Attribution License ( which
permits unrestricted use, distribution, and reproduction in any medium, provided the original work is properly cited.
Alzheimer's link to cardiovascular disease<p>Analysis of microarray data reveals extensive links between Alzheimer’s disease and cardiovascular diseases.</p>
Abstract
Background: Because of its polygenic nature, Alzheimer's disease is believed to be caused not by
defects in single genes, but rather by variations in a large number of genes and their complex
interactions. A systems biology approach, such as the generation of a network of co-expressed
genes and the identification of functional modules and cis-regulatory elements, to extract insights
and knowledge from microarray data will lead to a better understanding of complex diseases such
as Alzheimer's disease. In this study, we perform a series of analyses using co-expression networks,
cis-regulatory elements, and functions of co-expressed gene modules to analyze single-cell gene
expression data from normal and Alzheimer's disease-affected subjects.
Results: We identified six co-expressed gene modules, each of which represented a biological
process perturbed in Alzheimer's disease. Alzheimer's disease-related genes, such as APOE, A2M,
PON2 and MAP4, and cardiovascular disease-associated genes, including COMT, CBS and WNK1, all
congregated in a single module. Some of the disease-related genes were hub genes while many of
them were directly connected to one or more hub genes. Further investigation of this disease-
associated module revealed cis-regulatory elements that match to the binding sites of transcription
factors involved in Alzheimer's disease and cardiovascular disease.
Conclusion: Our results show the extensive links between Alzheimer's disease and cardiovascular
disease at the co-expression and co-regulation levels, providing further evidence for the hypothesis
that cardiovascular disease and Alzheimer's disease are linked. Our results support the notion that
diseases in which the same set of biochemical pathways are affected may tend to co-occur with
each other.
Background
Late-onset Alzheimer's disease (AD) is a complex progressive
neurodegenerative disorder of the brain and is the most com-
mon form of dementia. Due to its polygenic nature, AD is
believed to be caused not by defects in single genes, but rather
by variations in a large number of genes and their complex
Published: 8 October 2008
Genome Biology 2008, 9:R148 (doi:10.1186/gb-2008-9-10-r148)
Received: 2 May 2008
Revised: 23 August 2008
Accepted: 8 October 2008
The electronic version of this article is the complete one and can be
found online at /> Genome Biology 2008, Volume 9, Issue 10, Article R148 Ray et al. R148.2
Genome Biology 2008, 9:R148
interactions that ultimately contribute to the broad spectrum
of disease phenotypes. Similar to other neurodegenerative
diseases, AD has not yielded to conventional strategies for
elucidating the genetic mechanisms and genetic risk factors.
Therefore, a systems biology approach, such as the one that
was successfully employed by Chen and colleagues [1], is an
effective alternative for analyzing complex diseases.
Most studies on AD first select a set of differentially expressed
genes on which further analysis is performed. However, com-
paring lists of genes from various AD studies is not efficient
without new methods being developed, which sometimes can
become data specific. Therefore, organizing genes into mod-
ules or a modular approach that is based on criteria such as
co-expression or co-regulation helps in comparing results
across studies and obtaining a global overview of the disease
pathogenesis. In this paper, we perform a transcriptome-
based study by combining the analysis of co-expressed gene
networks and the identification of functional modules and
cis-regulatory elements in differentially expressed genes to
elucidate the biological processes involved in AD [2-4]. We
first construct modules of highly correlated genes (that is,
those with high similarity in their expression profiles), and
then identify statistically significant regulatory cis-elements
(motifs) present in the genes. The analysis follows the proce-
dure shown in Figure 1.
The present work unveiled 1,663 genes that are differentially
expressed in AD. A co-expression network method [2,3] was
applied to these genes, resulting in 6 modules of co-expressed
genes with each module representing key biological processes
perturbed in AD. Within the 6 modules, we identified 107
highly connected ('hub') genes. Functional annotation of
these genes based on their association to human diseases
resulted in the identification of 18 disease-related cardiovas-
cular diseases (CVDs), AD/neurodegenerative diseases,
stroke and diabetes) transcripts aggregating in one module
(referred to as the disease associated module). While some of
these 18 genes were hub genes, many of them directly con-
nected to one or more hub genes. Furthermore, a genome-
wide motif analysis [4] of the genes in the disease-associated
module revealed several cis-regulatory elements that
matched to the binding sites of transcription factors involved
in diseases that are known to co-occur with AD. The final
result was a set of co-expressed and co-regulated modules
describing the higher level characteristics linking AD and
CVDs.
Recently, Miller et al. [5] used a systems biology approach to
identify the commonalities between AD and ageing. Our work
is significantly different from that by Miller et al. as we use a
different co-expression network building method to generate
modules of co-expressed genes and then identify cis-regula-
tory motifs within a module. Such a combination of
approaches has not been previously applied to study AD. Our
co-expression network method [2,3] is a spectral algorithm
that was designed to optimize a modularity function and
automatically identify the appropriate number of modules.
The cis-regulatory elements discovered in the promoter
regions of disease related genes provide further insights into
the possible transcriptional regulation of the genes involved
in AD and their connection to CVDs, stroke and diabetes.
Moreover, the single cell dataset [6] used in this study is less
noisy compared to the mixed cell microarray data that were
analyzed by Miller et al. Additionally, the single cell expres-
sion data are from the entorhinal cortex, a region of the brain
known to be the germinal site of AD and, therefore, represent
the early stage of AD (incipient AD). Most importantly, unlike
multiple studies comparing AD and ageing [5,7,8], to the best
of our knowledge, our study is the first that has identified
links between CVDs, AD/neurodegenerative diseases and
diabetes using a transcriptome-based systems biology
approach. However, despite the differences in objectives, data
and methods in the study by Miller et al. and in our study,
there was a significant overlap in the results obtained. This
indicates that the results reported here represent phenomena
that are generalizable. We have established interesting links
between the two studies, thereby highlighting the commonal-
ities between AD, ageing, and CVDs. We believe that analyses
such as ours and that by Miller et al. are the pieces of a puzzle
that illustrates the underlying mechanisms involved in AD
and the manner in which AD links to other conditions/dis-
eases.
Results and discussion
Significance analysis of microarrays (SAM) [9] identified
1,663 differentially expressed genes between AD samples and
controls at a false discovery rate of 0.1% (see Materials and
methods). The enriched biological processes for 1,663 genes
are shown in Additional data file 1. Many processes known to
be affected in AD were enriched in the list of 1,663 transcripts.
Principal components analysis [10] is an unsupervised classi-
fication method in which the data are segregated into classes.
When principal components analysis was applied to a matrix
consisting of the expression of 1,663 differentially expressed
genes and 33 subjects (10 normal and 20 AD affected), an
optimal separation of subjects into two groups was observed
(Figure 2). The axes in Figure 2 correspond to the principal
components (PCs), with the first PC accounting for 45.5% of
the variance and the second PC accounting for 14.9% of the
variance. This demonstrated that the samples are distin-
guishable based on the expression profiles of these 1,663
genes. This implies that the samples in this dataset are well
characterized and the information content in these differen-
tially expressed genes is high.
Modular organization of significant genes via co-
expression networks
The co-expression network method (CoExp) [2,3] was
applied to the set of 1,663 genes and resulted in 6 clusters/
modules (see Materials and methods; a figure showing the
Genome Biology 2008, Volume 9, Issue 10, Article R148 Ray et al. R148.3
Genome Biology 2008, 9:R148
entire network and modules is provided in Additional data
file 4). Figure 3 shows the adjacency matrix of the co-expres-
sion network and Figure 4 illustrates the Pearson correlation
coefficient (degree of similarity) between the 1,663 genes
organized into modules. The effect of CoExp applied to all
15,827 genes (that is, no differentially expressed gene selec-
tion performed) is shown in Additional data file 5.
The two big red blocks of genes in Figure 4 represent two
groups of anti-correlated expression patterns. The upper red
block refers to modules 1 and 2, while the lower red block rep-
resents modules 3, 4, 5 and 6. Transcripts in modules 3, 4, 5
and 6 were downregulated and those in modules 1 and 2 were
upregulated. Modules 1 and 2 contain transcripts involved in
cell differentiation, neuron development, immune response,
stress response, and so on, while the other modules consist of
genes involved in negative regulation of metabolism, protein
transport, sodium ion transport, and so on. Table 1 shows the
top enriched Gene Ontology biological processes (p < 0.05) in
all six modules.
As can be noted from Table 1, many processes linked to AD,
such as immune response, inflammatory response, cell devel-
opment and differentiation (due to a large number of cancer
related genes), and so on are upregulated in incipient AD
[11,12]. Processes related to actin are downregulated in AD
[13]. Table 2 shows the significant Kyoto Encyclopedia of
Genes and Genomes (KEGG) pathways represented by the
genes in each module. Although there was no over-repre-
sented KEGG pathway in module 5, several genes involved in
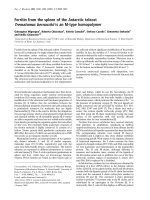
Steps taken to analyze Alzheimer's disease using laser capture microdissected microarray dataFigure 1
Steps taken to analyze Alzheimer's disease using laser capture microdissected microarray data. Sequence of steps taken to analyze incipient Alzheimer's
disease from single cell expression data. We apply co-expression network analysis, EASE and WordSpy (motif finding method) in an integrated manner to
study Alzheimer's disease and reveal connections to other conditions such as cardiovascular diseases and diabetes.
Single cell microarray
expression data
Use SAM to identify differentially expressed
genes
Build co-expression
networks
Identify functional
modules
Identify hub genes
Use EASE to
identify
enriched GO
categories
Co-expression network tool
WordSpy
Identify significant
cis-regulatory elements
in disease associated
genes
Check for genes associated
with Alzheimer’s disease and
other human diseases
Genome Biology 2008, Volume 9, Issue 10, Article R148 Ray et al. R148.4
Genome Biology 2008, 9:R148
the negative regulation of metabolism, actin filament depo-
lymerization, glucose metabolism, and lipid biosynthesis
were present. Modules 2, 3, 4, 5 and 6 represent processes
previously associated with AD in multiple studies [11-13].
Module 5 contains processes related to glucose metabolism
and recent work has shown decreased expression of energy
metabolism genes [14]. Our results further confirm this
observation. Based on the results obtained thus far, each
module is representative of some biological processes: mod-
ule 1 represents protein synthesis; module 2 is linked to phos-
pholipid degradation; module 3 is associated with signaling
systems; module 4 represents neuron development; and
modules 5 and 6 are associated with metabolism.
The modular organization of genes led to the following inves-
tigative steps: the identification of genes associated with
human diseases; the identification of hub/highly connected
genes; the examination of the expression level of brain
derived neurotrophic factor (BDNF) in the AD subjects; and
the identification of cis-regulatory elements from the promot-
ers of genes.
Module 1 is associated with cardiovascular diseases and
diabetes
EASE [15] uses the Genetic Association Database [16] and
Online Mendelian Inheritance in Man to determine the asso-
ciation of genes with various diseases/conditions [17-19] (see
Materials and methods). When EASE was used to perform
functional annotation clustering based on the genes' associa-
tion with human disorders/diseases, module 1 contained 18
disease-associated genes (Table 3). This prompted an in-
depth examination of module 1 for our downstream analysis.
Modules 2-6 did not have a significant enrichment for any
human disease.
These results provide new evidence supporting the hypothe-
sis that there may be a strong association between CVD and
the incidence of AD [20-22]. There also has been a growing
body of evidence for a link between AD and diabetes [23-25],
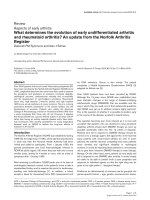
Unsupervised classification by principal component analysisFigure 2
Unsupervised classification by principal component analysis. Principal component analysis was used to classify the 33 samples. The blue spheres refer to
controls and the red correspond to affected subjects. This demonstrated that the samples were distinguishable based on the expression profiles of 1,663
differentially expressed genes.
Genome Biology 2008, Volume 9, Issue 10, Article R148 Ray et al. R148.5
Genome Biology 2008, 9:R148
with many research groups and news articles reporting that
AD may be another form of diabetes. While there are many
transcripts in Table 3 common to the different conditions,
there are a few that are unique to a specific disease/condition,
such as those encoding kinase deficient protein (WNK1),
timp metallopeptidase inhibitor 1 (TIMP1) and cystathio-
nine-beta-synthase (CBS), which are specific to CVD. Pterin-
4 alpha-carbinolamine dehydratase/dimerization cofactor
of hepatocyte nuclear factor 1 alpha (tcf1) 2 (or PCBD2),
timp metallopeptidase inhibitor 3 (TIMP3), solute carrier
family 2 member 1 (SLC2A1) and major histocompatibility
complex, class II, dq beta 1 (HLA-DQB1) are specific to diabe-
tes. Von willebrand factor (VWF), alpha-2-macroglobulin
(A2M), apolipoprotein e (APOE), paraoxonase 2 (PON2),
and serpin peptidase inhibitor, clade a (alpha-1 antiprotein-
ase, antitrypsin), member 3 (SERPINA3) are common to
most of the conditions. Archacki and colleagues have
reported a list of 56 genes that are associated with coronary
artery disease [26]. Many genes from this list were also
present in our list of 1,663 genes and present in module 1
(data not shown).
The hypothesis behind co-expression network analysis is that
genes that are co-expressed are also co-regulated. Therefore,
since the genes specific to certain diseases and those that are
common to all the diseases all resided in the same module,
they may be co-regulated. This could be the reason for the
clustering of these conditions in epidemiological studies. Fur-
thermore, as there are many transcripts common to these dis-
eases/conditions, it is plausible that similar/common
biochemical pathways are active in these seemingly different
conditions. Common pathogenetic mechanisms in AD and
CVD can suggest a causal link between CVD and AD [21,22],
a hypothesis that is still controversial and under a lot of
debate.
Transcripts in the modules are linked to each other based on
their expression similarity. 'Hub genes' are highly connected
nodes/transcripts in the network and are likely to play impor-
tant roles in biological processes. Hub genes tend to be con-
served across species and, hence, make excellent candidates
for disease association studies in humans [27].
We defined hub genes to be those with 40 or more links/con-
nections. Please refer to Additional data file 6 for the estima-
tion of hub genes. We identified 107 hub genes. The complete
list of hub genes, their module locations, and the number of
links is in Additional data file 2. The hub genes included those
encoding general transcription factor iiic, polypeptide 1,
alpha 220 kda (GTF3C1), which is involved in RNA polymer-
ase III-mediated transcription, microtubule-associated pro-
tein 4 (MAP4), which promotes microtubule stability and
affects cell growth [28], and proprotein convertase subtili-
sin/kexin type 2 (PC2), which is responsible for the process-
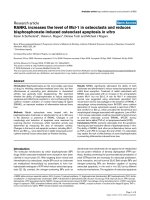
Adjacency matrix of co-expression networkFigure 3
Adjacency matrix of co-expression network. The adjacency matrix representation of the co-expression network. Modules are labeled c1, c2, c3, c4, c5 and
c6. The dots refer to the intra- and inter-module edges between the genes. The graphical representation of this matrix is in Additional data file 4.
Genome Biology 2008, Volume 9, Issue 10, Article R148 Ray et al. R148.6
Genome Biology 2008, 9:R148
ing of neuropeptide precursors. Some of these hub genes -
PC2, paraoxonase 2 (PON2) and peroxiredoxin 6 (PRDX6) -
have been implicated in late-onset AD [29-31].
Since module 1 has the disease associated genes, the hub
genes in this module may provide new information regarding
AD, CVD and diabetes. We identified 22 hub genes with a
number of links ranging from 42 to 63 in module 1 (for the
complete list of the 22 hub genes, see Additional data file 2).
The total number of hub genes in each module along with the
minimum and maximum number of links is shown in Table 4.
Module 1 had the maximum number of hub genes. The tran-
script with the largest number of links in module 1 is MAP4,
with 63 connections. MAP4 is directly linked to other disease/
condition associated genes such as VWF and WNK1.
Increased expression of semaphorin 3b (SEMA3B; sema-
phorin pathway) inhibits axonal elongation [32] and has been
implicated in AD [32]. MAP4 is also connected to SEMA3B.
Pearson correlation coefficient between 1,663 genesFigure 4
Pearson correlation coefficient between 1,663 genes. This figure shows the strength of correlation between pairs of genes. The genes are organized by
modules - c1, c2, c3, c4, c5 and c6. The top leftmost red block on the diagonal corresponds to module c1 and the bottom rightmost red block on the same
diagonal refers to module c6. Modules c1 and c2 contain upregulated genes and modules c3 through c6 comprise downregulated genes.
Gene ID
Gene ID
200 400 600 800 1000 1200 1400 1600
200
400
600
800
1000
1200
1400
1600
−1
−0.8
−0.6
−0.4
−0.2
0
0.2
0.4
0.6
0.8
1
c1
c2
c3 c4
c5
c6
Pearson
correlation
coefficient
Genome Biology 2008, Volume 9, Issue 10, Article R148 Ray et al. R148.7
Genome Biology 2008, 9:R148
Table 5 shows the number of links of the disease associated
genes and the number of hub genes they are linked with. Fig-
ure 5 is a sub-network in module 1 that shows the disease-
associated genes and all their links within module1. Although
not all the disease-associated genes were hub genes, most of
them were directly linked to one or more hub genes, which
implies that they may play a key role via hub genes.
PON2, MAP4 and atpase Na+/K+ transporting, alpha 2 (+)
polypeptide (ATP1A2) are encoded by disease-associated
genes that are also hub genes. The overexpression of MAP4
results in the inhibition of organelle motility and trafficking
[33] and can also lead to changes in cell growth [28]. ATP1A2
is a subunit of an integral membrane protein that is responsi-
ble for establishing and maintaining the electrochemical gra-
dients of sodium and potassium ions across the plasma
membrane [34]. These gradients are essential for osmoregu-
lation, for sodium-coupled transport of a variety of molecules,
and for electrical excitability of nerve and muscle [34]. While
the downregulation of ATP1A2 has been linked to migraine-
related conditions [35], the effects of its upregulation have
not been documented. PON2 has been implicated in AD [30]
and CVDs (Table 3).
Decreased levels of brain-derived neurotrophic factor
BDNF is well known for its trophic functions and has been
implicated in synaptic modulation, and the induction of long-
term potentiation [36,37]. Increased levels of BDNF are nec-
essary for the survival of neurons. Decreased levels of BDNF
have been linked to AD and depression [38-40]. Recently, low
levels of BDNF has also been associated with diabetes [41].
BDNF goes through post-translational modification, that is, it
is converted into mature BDNF, by plasminogen [42]. The
neurotrophic tyrosine kinase receptor type 2 (NTRK2/TrkB)
is a receptor for BDNF [43].
Table 1
Top Gene Ontology biological processes in each module
Module Activity Ease score
Module 1 Protein biosynthesis 7.14E-06
Cell development 2.37E-05
Cell differentiation 4.88E-05
Macromolecule biosynthesis 8.56E-05
Cellular nerve ensheathment 1.11E-04
Neuron development 2.22E-04
Regulation of action potential 4.37E-04
Module 2 Response to other organism 0.004
Immune response 0.014
Defense response 0.020
Response to stress 0.029
Protein kinase cascade 0.030
Integrin-mediated signalling pathway 0.030
Myeloid cell differentiation 0.040
JAK-STAT cascade 0.042
Module 3 Homophilic cell adhesion 2.58E-11
Cell-cell adhesion 2.74E-09
Nervous system development 3.44E-09
Ion transport 0.007
Gamma-aminobutyric acid signalling pathway 0.009
Secretory pathway 0.019
Small GTPase mediated signal transduction 0.028
Sodium ion transport 0.036
Module 4 Cellular physiological process 6.91E-05
Transcription from RNA polymerase II
promoter
0.008
Protein transport 0.014
Post-chaperonin tubulin folding pathway 0.019
Ubiquitin cycle 0.037
Module 5 Negative regulation of metabolism 0.011
Actin filament depolymerization 0.025
Barbed-end actin filament capping 0.025
Negative regulation of actin filament
depolymerization
0.025
Negative regulation of protein metabolism 0.025
Module 6 Protein transport 0.008
Cell organization and biogenesis 0.011
Membrane fusion 0.028
RNA processing 0.029
RNA splicing 0.042
Statistically significant (p < 0.05) biological processes present in each of
the six modules of the co-expression network.
Table 2
Statistically significant KEGG pathways
Module KEGG pathway Ease score
Module 1 Ribosome 8.16E-07
Translation 3.41E-14
Module 2 Phospholipid degradation 0.013
Module 3 Signal transduction 0.002
Phosphatidylinositol signaling system 0.005
Module 4 Neuron development 2.22E-04
Module 6 Nucleotide metabolism 0.036
Statistically significant (p < 0.05) KEGG pathways present in the
modules of the co-expression network.
Genome Biology 2008, Volume 9, Issue 10, Article R148 Ray et al. R148.8
Genome Biology 2008, 9:R148
BDNF was not present in our list of 1,663 significant genes.
However, TrkB and serpin peptidase inhibitor, clade e
(nexin, plasminogen activator inhibitor type 1), member 2
(SERPINE2) were present in the set of 1,663 genes and
located in module 1. Plasminogen activator inhibitor type 1
(PAI-1) proteins inhibit plasminogen activators [44]. There-
fore, if the level of PAI-1 is high in the AD affected samples,
plasminogen activators are being inhibited, resulting in
decreased levels of mature BDNF. Interestingly, the expres-
sion levels of TrkB and PAI-1 were elevated in the AD sam-
ples. However, TrkB is downregulated following the binding
of BDNF [45]. Therefore, due to an increased level of PAI-1,
mature BDNF could not be produced, which in turn could not
bind to TrkB. By this reasoning, it can be concluded that high
levels of TrkB and PAI-1 imply decreased levels of BDNF,
which is detrimental for the survival of neuronal populations.
This probably leads to neuronal death in this cohort of AD
affected subjects.
In order to verify our conclusion regarding the expression
level of BDNF in the AD patients in our dataset, we examined
the expression level of BDNF in the controls and AD affected
samples. We found BDNF to be decreased by 1.07 in the AD
affected samples. BDNF was not selected to be a significant
sion between controls and affected samples. Microarrays are
not sensitive enough to detect genes with low expression lev-
els, especially when the difference in expression is small
(which can be expected in subjects with incipient AD) [46-
49]. The fact that the selected significant genes, such as TrkB
and SERPINE2, could lead to the correct conclusion regard-
ing the level of BDNF expression in AD affected samples high-
lights the merits of this kind of analysis of the transcriptome
when handling genes with low expression levels. Although
modules 1 and 2 have upregulated genes, genes associated
with BDNF are located only in module 1. This further empha-
sizes the importance of module 1.
Comparison to the study by Miller et al. on ageing and
AD
Miller et al. [5] identified 558 transcripts that were common
to AD and ageing. We found more overlapping genes between
our study and their study than expected by chance (p = 3.3 ×
10
-10
). There were 94 genes overlapping between 1,663 signif-
icant genes from our study and 558 genes identified by Miller
et al. Of these 94 genes, 48 were present in module 1 (greater
than expected by chance; p = 9.2 × 10
-10
). This indicates that
module 1 contains the majority of genes that have been linked
to ageing and AD. Of the 48 genes that overlapped between
558 AD-ageing common genes and genes in module 1, WNK1
and MAP4 were present.
Table 3
Functional annotation clustering by disease of genes
Disease/condition Genes
Neurodegeneration VWF, A2M, APOE, FTL, PON2, COMT, MAP4, TF,
SERPINA3, ATP1A2, AGT
Myocardial infarction A2M, APOE, PON2, SERPINA3
Alzheimer's disease A2M, APOE, SERPINA3, PON2
Cardiovascular VWF, A2M, APOE, PON2, COMT, WNK1, CBS,
SERPINA3, TIMP1
Coronary artery
disease
APOE, PON2, COMT, SERPINA3
Type 2 diabetes VWF, A2M, APOE, PCBD2, HLA-DQB1(HLA-
DQB2), TIMP3, SLC2A1, AGT
Functional annotation clustering of genes in module 1 based on their
association to human conditions/diseases.
Table 4
Hub genes
Module Number of hubs Range of links
Module 1 22 42-63
Module 2 17 41-56
Module 3 15 40-68
Module 4 14 40-65
Module 5 20 40-73
Module 6 19 40-81
Number of hub genes and their range of connections/links in each
module.
Table 5
Number of links of the 18 disease-associated genes
Gene Number of links Number of hub genes it is connected to
VWF 16 2
A2M 17 3
APOE 18 3
FTL 18 3
PON2 51 8
COMT 17 0
MAP4 63 5
TF 16 3
SERPINA3 18 3
ATP1A2 45 7
AGT 27 5
TIMP1 14 3
WNK1 17 2
CBS 16 3
PCBD2 16 0
HLA-
DQB1/
HLA-
DQB1
15 2
SLC2A1 14 4
TIMP3 14 0
Number of links of the 18 disease associated genes from module 1 and
the number of connections they have with other hub genes.
Genome Biology 2008, Volume 9, Issue 10, Article R148 Ray et al. R148.9
Genome Biology 2008, 9:R148
Furthermore, 9 genes (DAAM2, EPM2AIP1, GFAP,
GORASP2, MAP4, NFKBIA, PRDX6, TSC22D4 and
UBE2D2) overlapped between 558 AD-ageing genes and the
107 hub genes identified in our study, 5 of which resided in
module 1. These results further highlight the significance of
module 1 and it can be concluded that module 1 represents
common biochemical pathways that may be affected in all
AD, ageing, and CVD.
Cis-regulatory elements and co-regulated genes
Cis-regulatory elements/motifs are regulatory elements in
the promoter region of genes to which transcription factors
bind, thus regulating transcription. If a group of genes shares
the same cis-regulatory motif, then the transcription factor
that binds to the motif may regulate the group of genes. Co-
expressed modules represent genes that may be co-expressed
in the cell and be a part of the same biochemical pathways.
From our analyses thus far, we concluded that the genes con-
tained in module 1 is of great importance. Therefore, we used
WordSpy [4] to identify the cis-regulatory elements/motifs
that may be enriched in the upstream promoter sequences of
the genes in module 1 (see Materials and methods). The group
of genes in module 1 that shares a motif will be a set that is co-
expressed and coregulated.
The complete set of cis-regulatory elements enriched in mod-
ule 1 is in Additional data file 3. A total of 89 motifs were
enriched in module 1 with a p-value < 0.001, and their target
genes were co-expressed with an average correlation coeffi-
cient >0.4 and Z-score >2 (see Materials and methods). Of
the 89 motifs, 36 matched to 26 known transcription factor
binding sites (TFBS) in JASPAR [50] with a matching score
≥0.8 (Table 6). Table 6 shows the number of genes within
module 1 whose promoter region contains a motif that
matched to the TFBS of a known transcription factor.
Transcription factors such as growth factor independent
(Gfi), peroxiredoxin 2 (Prx2/PRDX2), SP1, CAAT-enhancer
binding protein (C/EBP), RelA (p65), runt box 1 (Runx1),
ELK-1, upstream stimulatory factor 1 (USF1), Rel, and TATA
Sub-network in module 1 illustrating the 18 disease associated genes and their connectionsFigure 5
Sub-network in module 1 illustrating the 18 disease associated genes and their connections. This sub-network shows the 18 disease associated genes
(colored yellow) and the genes that they are connected to within module 1. The hub genes are represented as triangle nodes. Disease genes MAP4, PON2
and ATP1A2 were also hub genes. Only the hub genes that connect to disease genes are shown here. Module 1 consists of 22 hub genes in total.
Genome Biology 2008, Volume 9, Issue 10, Article R148 Ray et al. R148.10
Genome Biology 2008, 9:R148
box binding protein (TBP) have been implicated in neurode-
generative diseases (such as AD, Parkinson's, and Schizo-
phrenia) [51-64], diabetes [65], stroke and CVDs [66,67].
There are 139 genes in module 1 that contain motifs that
matched the TFBS of the known transcription factors associ-
ated with these diseases.
Arnt-Ahr dimer transcription factor activates genes crucial in
the response to hypoxia and hypoglycaemia [68,69].
Hypoglycaemia and hypoxia have been known to play patho-
physiological roles in the complications of diabetes and AD
[70-73]. It is well known that hypoxia has major effects on the
cardiovascular system [74]. In light of such knowledge, it
comes as no surprise that a large number of genes have cis-
regulatory motifs that match the binding site of the Arnt-Ahr
transcription factor.
Hand1-TCF3 and TAL1-TCF3 are components of the basic-
helix-loop-helix (bHLH) complexes. bHLH transcription fac-
tors are important in development [75,76]. An extremely high
number of genes were mapped to Hand1-TCF3 since cell
development and differentiation is upregulated in AD [11,12].
In summary, the fact that transcription factors that partici-
pate in other human conditions have their binding motifs
enriched in the set of significant genes associated with AD
adds significance to the hypothesis that many biochemical
pathways common to AD and CVD are active, resulting in
these diseases/conditions co-occurring.
Conclusion
In this study, we present an integrative systems biology
approach to study a complex disease such as AD. Along with
identifying modules that illuminate higher-order properties
of the transcriptome, we identified a module that contained
many genes known to play prominent roles in CVDs and AD.
We believe that this module highlights important pathophys-
iological properties that connect AD, CVD and ageing. We
identified several cis-regulatory elements, some of which
mapped to the binding sites of known transcription factors
involved in neurodegenerative and CVDs as well as diabetes
and stroke. Furthermore, since microarrays are not sensitive
to genes with very slight differences in expression from con-
trols, we illustrate how other genes can be used to deduce the
expression difference of such genes. This is especially critical
while comparing groups that are very similar to each other.
Although we highlight the contributions of a new module and
network building method to the field of AD, this paper also
illustrated the commonalities between the study by Miller et
al. [5] and our study in spite of the differences in methodology
and data. This suggests the reproducible and generalizable
quality of the results based on gene expression data from well
characterized samples. Additionally, a modular approach,
where genes are organized into modules based on co-expres-
sion or co-regulation, is an efficient method for studying
human diseases and comparing results from multiple studies.
The link between CVDs, diabetes and AD is a topic of growing
interest. The presence of perturbed genes and cis-regulatory
elements related to CVDs and AD in a single module provides
strong evidence to the hypotheses connecting these two con-
ditions. Interestingly, this module also contained the maxi-
mum number of genes (and hub genes) related to ageing. Our
results support the notion that diseases in which the same set
of biochemical pathways are affected may tend to co-occur
with each other. This could be the reason why CVDs and/or
diabetes co-occur with AD.
Small sample sizes are typical of clinical studies, especially
those involving human samples. The largest AD gene expres-
sion study at the time of writing included 33 samples (the
dataset analyzed in this paper). Since the results presented
here may be specific to the dataset, we are in the process of
Table 6
Twenty-six transcription factors with known functions whose cis-
regulatory elements were identified in the genes in the co-expres-
sion network
Transcription factors Number of target genes
ABI4 9
Arnt-Ahr 93
ARR10 6
Broad-complex 3 10
CEBP 20
Gfi 8
HAND1-TCF3 279
Mycn 11
Myf 8
Prx2/PRDX2 17
RELA, REL 10
RUNX1 4
Snail 49
SP1 47
TBP 6
E74A 16
ELK1 16
SPIB 16
Hunchback 6
MAX 11
USF1 11
ZNF42 5-13 27
NFIL3 5
Agamous 8
GAMYB 6
The 26 transcription factors and the number of target genes in module
1 that have a motif in their promoters that match to the binding sites of
the known transcription factor.
Genome Biology 2008, Volume 9, Issue 10, Article R148 Ray et al. R148.11
Genome Biology 2008, 9:R148
extending our analysis to larger datasets. A more robust
approach to studying AD would be to obtain well character-
ized large cohorts that are followed longitudinally for the best
chance of success. A comprehensive analysis incorporating
AD and CVD/diabetes patients along with information about
their disease progression will shed more light onto the patho-
physiology of, and the link between, AD and CVDs.
Materials and methods
Data
Pathologically, AD is characterized by the presence of neu-
rofibrillary tangles in the neurons. The dataset of Dunckley et
al. [6] consists of 13 normal controls (Braak stages 0-II; aver-
age age 80.1 years) and 20 AD affected (Braak stages III-IV;
average age 84.7 years) samples obtained by laser capture
microdissection from the entorhinal cortex. Braak stages III-
IV are considered 'incipient' AD [77,78]. In this dataset, 1,000
neurons were collected from each of the 33 samples via laser
capture microdissection.
Data were normalized using gcRMA [79]. Probesets were
mapped to genes using DAVID [34]. Probesets that did not
map to any gene and those that mapped to hypothetical pro-
teins, at the time of writing this manuscript, were removed.
When multiple probesets mapped to the same gene, only the
probeset with the highest mean was selected. This preproc-
essing resulted in 15,827 genes/transcripts. Differentially
expressed genes were identified using the two-class SAM pro-
cedure [9]. SAM is open-source software that uses a modified
t-statistics approach to identify differentially expressed
genes. ISI citation search [80] indicates that SAM is a highly
popular method used for microarray analysis (over 2,000
citations of the original publication in April 2001, as of July 9,
2008).
Construction of co-expression networks and
identification of functional modules
We used a network-based approach to identify modular
structures/clusters embedded in microarray gene expression
data. The CoExp [2,3] method constructs co-expression net-
works from microarray data and then uses a spectral based
clustering method to identify subgraphs within the network.
Nodes in the network correspond to genes and edges repre-
sent expression similarities between genes. The motivation is
that genes involved in the same functional pathway are
directly connected to each other or linked via short paths.
After network creation, the nodes are clustered into dense
subgraphs.
To create a network from gene expression data, pairwise
expression similarity between a pair of genes was measured.
In this study, we used the Pearson correlation coefficient for
the similarity measure. For two genes to be considered as co-
expressed, their expression profiles needed to satisfy at least
one of the following conditions: their correlation coefficient is
higher than 0.3, and one gene is ranked as the top-k most cor-
related gene of the other; the correlation coefficient between
them is higher than 0.9 and one gene is within the top 50
most correlated gene of the other. The parameter k was deter-
mined automatically and in conjunction with the Qcut algo-
rithm (discussed below), such that when k increased, the
number of modules of co-expressed genes remained
unchanged. The rationale behind using k best neighbors
instead of a cut-off threshold on gene expression similarity
for creating a network has been discussed in [2]. For the co-
expression network generated with differentially expressed
genes in this study, k = 14.
In order to identify dense subgraphs/modules in the co-
expression network, we applied a community discovery algo-
rithm - Qcut, developed by Ruan and Zhang [3]. Compared to
other clustering or graph partitioning algorithms, Qcut has
the advantage that it does not require a user-specified
number of clusters/modules. It is a spectral based graph par-
titioning algorithm that optimizes the modular function pro-
posed by Newman and Girvan [81] to automatically
determine the appropriate number of modules [2,3]. Further
evidence of its robustness can be found in [3,82].
EASE [15], a tool in DAVID, was used to identify overrepre-
sented biological processes in each module as well as perform
functional annotation clustering based on association to
human diseases [34]. DAVID derives its disease associations
from two main sources, Online Mendelian Inheritance in
Man and the Genetic Association Database. These sources
assign diseases to gene identifiers and then DAVID maps the
diseases to the DAVID database through the gene identifiers.
The most significant diseases associated with a set of genes
are determined by term enrichment analysis using a modified
Fisher Exact calculation [17-19].
Identification of regulatory cis-elements
The interaction of transcription factors and cis-acting DNA
elements determines the gene activity under various environ-
mental conditions. Identifying functional TFBS, however, is
not trivial, since they are usually short and degenerate, and
are often located several hundred to thousand bases
upstream of the translational starting sites. Here we com-
bined several datasets and a whole-genome analysis method,
WordSpy [4], to discover short DNA sequence motifs that are
statistically enriched in the promoters of genes in the same
co-expression module and are associated with gene co-
expression.
We first downloaded the promoter sequences for human open
reading frames from the DBTSS database [83]. Each pro-
moter included 1,000 bp upstream and 200 bp downstream
sequences relative to the transcription starting site, defined
from full length cDNA data. From this dataset we extracted n
sets of promoter sequences (referred to as experimental sets),
where n is the number of co-expression modules. The i-th
Genome Biology 2008, Volume 9, Issue 10, Article R148 Ray et al. R148.12
Genome Biology 2008, 9:R148
experimental set contains the promoter sequences of genes in
the i-th co-expression module. The complete set of human
gene promoters was used as the background set. We then
applied WordSpy, a steganalysis-based genome-wide motif-
finding method, on each experimental set to discover statisti-
cally significant k-mers (motifs; for k = 6, 7, 8, 9, 10) accord-
ing to a generative model of the promoter sequences.
Each k-mer that was identified by WordSpy was then sub-
jected to two filtering steps. In the first filtering step, motifs
that are specifically enriched in the experimental set were
selected. We counted the number of instances that a k-mer
appeared in the experimental set (denoted by x) and in the
background set (denoted by b). Then we computed the prob-
ability that we would expect by chance at least the same
number of occurrences in the experimental set, given the
number of occurrences in the background set. This probabil-
ity is computed using the cumulative hyper-geometric distri-
bution as:
where Ni and N are the sizes of the i-th experimental set and
the background set, respectively. We filtered out the k-mers
that had a p-value ≥ 0.01.
The second filter is used to select motifs that are associated
with strong and significant co-expression patterns. For each
motif that passed the first filtering phase, we obtained a set of
genes ('target set') in which each gene in this set contains the
motif in its promoter region. We computed the average pair-
wise Pearson correlation coefficients, denoted by pcc, from
the expression profiles of the genes in the target set. Further-
more, we randomly sampled 100 control sets of genes from
the background set that had the same size (that is, number of
genes) as the target set, and computed the pcc of each control
set. The mean and standard deviation (denoted by mpcc and
spcc, respectively) of the pcc values for the control sets are
then used to compute the Z-score of the pcc value for the tar-
get set as:
A motif is retained only if its pcc > 0.4, and its Z-score > 2.
Finally, the motifs that have passed both filters are compared
to the known TFBS in the JASPAR database [50]. We pre-fil-
tered the TFBSs in the database that have information con-
tent ≤6 bits, since these TFBSs are short and have high
degeneracy and, hence, may match to some known motifs
simply by chance. Then we computed the best un-gapped
alignment between the motifs (n-mers) and the known bind-
ing sites (position specific weight matrices) using a metric
called the information score, which is the metric used in
Matlnspector [84] in the TRANSFAC suite. If the information
score for a motif is ≥0.8, then it is considered as a motif
matching to the binding site of a transcription factor.
Abbreviations
AD: Alzheimer's disease; BDNF: brain-derived neurotrophic
factor; CoExp: co-expression network method; CVD: cardio-
vascular disease; KEGG: Kyoto Encyclopedia of Genes and
Genomes; MPCC: mean of the PCC values; PAI-1: plasmino-
gen activator inhibitor type 1; PC: principal component; SAM:
significance analysis of microarrays; SPCC: standard devia-
tion of the PCC values; TFBS: transcription factor binding
sites.
Authors' contributions
WZ conceived of the research. MR and WZ designed the
study. MR and JR carried out the computational analysis, and
MR performed the biological analysis as well as coordinated
the project. MR wrote the paper and WZ helped with the man-
uscript preparation. All authors read and approved the final
manuscript.
Additional data files
The following additional data are available with the online
version of this paper. Additional data file 1 lists the enriched
biological processes in the set of 1,663 genes (p < 0.05). Addi-
tional data file 2 shows the 107 hub genes with 40 or more
connections and the clusters in which they reside. Additional
data file 3 contains the 89 statistically significant motifs over-
represented in module 1 along with their p-values and Z-
scores. Additional data file 4 shows the graphical representa-
tion of the coexpression network with 1,663 differentially
expressed genes. Additional data file 5 shows the adjacency
matrix of the co-expression network analysis on 15,827 genes.
Additional data file 6 illustrates the distribution of co-expres-
sion network links and estimation of hub genes.
Additional data file 1Enriched biological processes in the set of 1,663 genes (p < 0.05)Enriched biological processes in the set of 1,663 genes (p < 0.05).Click here for fileAdditional data file 2The 107 hub genes with 40 or more connections and the clusters in which they resideThe 107 hub genes with 40 or more connections and the clusters in which they reside.Click here for fileAdditional data file 3The 89 statistically significant motifs over-represented in module 1 along with their p-values and Z-scoresThe 89 statistically significant motifs over-represented in module 1 along with their p-values and Z-scores.Click here for fileAdditional data file 4Coexpression network with 1,663 differentially expressed genesThis co-expression network shows six modules. A node refers to a gene and the weight of an edge is the Pearson correlation coefficient between expression profiles of a pair of genes scaled to within [0,1]. The two large groups are two sets of genes with anti-correlated expression patterns. The smaller group contains two modules (1 and 2) and consists of upregulated genes while the larger group (modules 3-6) consists of downregulated genes. The length of each edge and the position of each node/module does not have any bio-logical meaning and are arbitrarily chosen for proper visualization.Click here for fileAdditional data file 5Adjacency matrix of the co-expression network analysis on 15,827 genesThe CoExp was applied to the entire set of 15,827 genes and resulted in 13 clusters. Clusters/modules are labeled 1-13 and are shown at the top. The dots refer to the intra- and inter-module edges between the genes. Cluster 1 contains all the 18 disease-asso-ciated genes and genes involved with BDNF. The co-expression network does not need differentially expressed genes and can be used on any set of genes selected by some criterion. However, most studies on AD first select a set of differentially expressed genes on which further analysis is performed. We extracted differentially expressed genes since our goal was to study the underlying mecha-nisms involved in late onset AD and compare our results with other AD studies. The non-differentially expressed genes bear little sig-nificance in revealing the underlying biological processes affected in AD.Click here for fileAdditional data file 6Distribution of co-expression network links and estimation of hub genesThe graph plots the number of links for the differentially expressed genes within the co-expression network. The X-axis plots the genes (as gene ID) in ascending order of the number of links. Gene ID 1 refers to the first gene, gene ID 800 refers to the 800th gene. The Y-axis plots the number of links for each gene. The dashed line indi-cates the mean number of links, and the solid line indicates the hub gene cutoff. The average number of links = 22.06; median = 19; standard deviation = 9.32. Gene co-expression networks follow power-law distributions and are scale-free, small world networks. They are characterized by a small number of highly connected nodes. In order to find a conservatively small number of hub genes, we decided to use a cut-off value that is towards the right of the dis-tribution. Threshold for the number of links for hub genes = Mean + 2 × Standard deviation = 40.7. Genes with a number of links ≥40 were considered hub genes. This approach resulted in 6.4% being hub genes in the entire network.Click here for file
Acknowledgements
The research was supported in part by a grant from the Alzheimer's Asso-
ciation and two NSF grants (IIS-0535257 and DBI-0743797). JR was sup-
ported in part by a UTSA faculty research award. The authors would like
to thank Jeremy Miller at the Interdepartmental Program for Neuroscience
and Centre for Neurobehavioral Genetics, University of California, Los
Angeles, CA for his assistance in obtaining data from his AD-ageing paper.
References
1. Chen Y, Zhu J, Lum PY, Yang X, Pinto S, MacNeil DJ, Zhang C, Lamb
J, Edwards S, Sieberts SK, Leonardson A, Castellini LW, Wang S,
Champy MF, Zhang B, Emilsson V, Doss S, Ghazalpour A, Horvath S,
Drake TA, Lusis AJ, Schadt EE: Variations in DNA elucidate
molecular networks that cause disease. Nature 2008,
452:429-435.
2. Ruan J, Zhang W: Identification and evaluation of functional
PxbN N
N
i
k
NN
i
bk
N
b
i
kx
Nb
i
(,, , ) ,
min( , )
=
⎛
⎝
⎜
⎞
⎠
⎟
−
−
⎛
⎝
⎜
⎞
⎠
⎟
⎛
⎝
⎜
⎞
⎠
⎟
=
∑
Zscore
pcc mpcc
spcc
=
−
Genome Biology 2008, Volume 9, Issue 10, Article R148 Ray et al. R148.13
Genome Biology 2008, 9:R148
modules in gene co-expression networks. In Systems Biology and
Computational Proteomics Berlin/Heidelberg: Springer; 2007:57-76.
[Lecture Notes in Computer Science, volume 4532]
3. Ruan J, Zhang W: Identifying network communities with a high
resolution. Phys Rev E Stat Nonlin Soft Matter Phys 2008:016104.
4. Wang G, Zhang W: A steganalysis-based approach to compre-
hensive identification and characterization of functional reg-
ulatory elements. Genome Biol 2006, 7:R49.
5. Miller JA, Oldham MC, Geschwind DH: A systems level analysis of
transcriptional changes in alzheimer's disease and normal
aging. J Neurosci 2008, 28:1410-1420.
6. Dunckley T, Beach TG, Ramsey KE, Grover A, Mastroeni D, Walker
DG, LaFleur BJ, Coon KD, Brown KM, Caselli R, Kukull W, Higdon
R, McKeel D, Morris JC, Hulette C, Schmechel D, Reiman EM, Rogers
J, Stephan DA: Gene expression correlates of neurofibrillary
tangles in Alzheimer's disease. Neurobiol Aging 2006,
27:1359-1371.
7. Ricciarelli R, d'Abramo C, Massone S, Marinari U, Pronzato M, Taba-
ton M: Microarray analysis in Alzheimer's disease and normal
aging. IUBMB Life 2004, 56:349-354.
8. Pereira AC, Wu W, Small SA: Imaging-guided microarray: iso-
lating molecular profiles that dissociate Alzheimer's disease
from normal aging. Ann N Y Acad Sci 2007, 1097:225-238.
9. Tusher VG, Tibshirani R, Chu G: Significance analysis of micro-
arrays applied to the ionising radiation response. Proc Natl
Acad Sci USA 2001, 98:5116-5121.
10. Ringner M: What is principal component analysis? Nat
Biotechnol 2008, 26:303-304.
11. Norris CM, Kadish I, Blalock EM, Chen KC, Thibault V, Porter NM,
Landfield PW, Kraner SD: Calcineurin triggers reactive/inflam-
matory processes in astrocytes and is upregulated in aging
and Alzheimers models.
J Neurosci 2005, 25:4649-4658.
12. Matsuoka Y, Picciano M, Malester B, LaFrancois J, Zehr C, Daeschner
JM, Olschowka JA, Fonseca MI, O'Banion MK, Tenner AJ, Lemere CA,
Duff K: Inflammatory responses to amyloidosis in a trans-
genic mouse model of Alzheimers disease. Am J Pathol 2001,
158:1345-1354.
13. Kojima N, Shirao T: Synaptic dysfunction and disruption of
postsynaptic drebrinactin complex: A study of neurological
disorders accompanied by cognitive deficits. Neurosci Res
2007, 58:1-5.
14. Liang WS, Reiman EM, Valla J, Dunckley T, Beach TG, Grover A,
Niedzielko TL, Schneider LE, Mastroeni D, Caselli R, Kukull W, Mor-
ris JC, Hulette CM, Schmechel D, Rogers J, Stephan DA: Alzheimers
disease is associated with reduced expression of energy
metabolism genes in posterior cingulate neurons. Proc Natl
Acad Sci USA 2008, 105:4441-4446.
15. DAVID Bioinformatics Resources [ />home.jsp]
16. Genetic Association Database [http://geneticassocia
tiondb.nih.gov]
17. Sherman BT, Huang DW, Tan Q, Guo Y, Bour S, Liu D, Stephens R,
Baseler MW, Lane HC, Lempicki RA: DAVID Knowledgebase: a
gene-centered database integrating heterogeneous gene
annotation resources to facilitate high-throughput gene
functional analysis. BMC Bioinformatics 2007, 8:426.
18. Huang DW, Sherman BT, Tan Q, Collins JR, Alvord WG, Roayaei J,
Stephens R, Baseler MW, Lane HC, Lempicki RA: The DAVID
Gene Functional Classification Tool: a novel biological mod-
ule-centric algorithm to functionally analyze large gene lists.
Genome Biol 2007, 8:R183.
19. Huang DW, Sherman BT, Tan Q, Kir J, Liu D, Bryant D, Guo Y,
Stephens R, Baseler MW, Lane HC, Lempicki RA: DAVID Bioinfor-
matics Resources: expanded annotation database and novel
algorithms to better extract biology from large gene lists.
Nucleic Acids Res 2007:W169-175.
20. Stampfer MJ: Cardiovascular disease and Alzheimer's disease:
common links. J Internal Med 2006, 260:211-223.
21. Rosendorff C, Beeri MS, Silverman JM: Cardiovascular risk factors
for Alzheimer's disease. Am J Geriatr Cardiol 2007, 16:143-149.
22. Stewart R: Cardiovascular factors in Alzheimer's disease. J
Neurol Neurosurg Psychiatry
1998, 65:143-147.
23. Janson J, Laedtke T, Parisi JE, O'Brien P, Petersen RC, Butler PC:
Increased risk of type 2 diabetes in Alzheimer disease. Diabe-
tes 2004, 53:474-481.
24. MacKnight C, Rockwood K, Awalt E, McDowell I: Diabetes melli-
tus and the risk of dementia, Alzheimer's disease and vascu-
lar cognitive impairment in the Canadian Study of Health
and Aging. Dement Geriatr Cogn Disord 2002, 14:77-83.
25. Craft S, Watson GS: Insulin and neurodegenerative disease:
shared and specific mechanisms. Lancet Neurol 2004, 3:169-178.
26. Archacki SR, Angheloiu G, Tian XL, Tan FL, DiPaola N, Shen GQ,
Moravec C, Ellis S, Topol EJ, Wang Q: Identification of new genes
differentially expressed in coronary artery disease by expres-
sion profiling. Physiol Genomics 2003, 15:65-74.
27. Casci T: Systems biology: Network fundamentals, via hub
genes. Nat Rev Genet 2006, 7:664-665.
28. Nguyen HL, Gruber D, McGraw T, Sheetz MP, Bulinski JC: Stabiliza-
tion and functional modulation of microtubules by microtu-
bule-associated protein 4. Biol Bull 1998, 194:354-357.
29. Krapfenbauer K, Engidawork E, Cairns N, Fountoulakis M, Lubec G:
Aberrant expression of peroxiredoxin subtypes in neurode-
generative disorders. Brain Res 2003, 967:152-160.
30. Shi J, Zhang S, Tang M, Liu X, Li T, Han H, Wang Y, Guo Y, Zhao J, Li
H, Ma C: Possible association between Cys311Ser polymor-
phism of paraoxonase 2 gene and late-onset Alzheimer's dis-
ease in Chinese. Brain Res Mol Brain Res 2004, 120:201-204.
31. Winsky-Sommerer R, Grouselle D, Rougeot C, Laurent V, David JP,
Delacourte A, Dournaud P, Seidah NG, Lindberg I, Trottier S, Epel-
baum J: The proprotein convertase PC2 is involved in the
maturation of prosomatostatin to somatostatin-14 but not
in the somatostatin deficit in Alzheimer's disease. Neuro-
science 2003, 122:437-447.
32. Blalock EM, Geddes JW, Chen KC, Porter NM, Markesbery WR,
Landfield PW: Incipient Alzheimer's disease: Microarray cor-
relation analyses reveal major transcriptional and tumor
suppressor responses. Proc Natl Acad Sci U S A 2004,
101:2173-2178.
33. Bulinski JC, McGraw TE, Gruber D, Nguyen HL, Sheetz MP: Overex-
pression of MAP4 inhibits organelle motility and trafficking
in vivo. J Cell Sci 1997, 110:3055-3064.
34. Dennis G Jr, Sherman BT, Hosack DA, Yang J, Gao W, Lane HC, Lem-
picki RA: DAVID: Database for Annotation, Visualization, and
Integrated Discovery. Genome Biol 2003, 4:P3.
35. De Fusco M, Marconi R, Silvestri L, Atorino L, Rampoldi L, Morgante
L, Ballabio A, Aridon P, Casari G: Haploinsufficiency of ATP1A2
encoding the Na +/K + pump alpha 2 subunit associated with
familial hemiplegic migraine type 2. Nat Genet 2003,
33:192-196.
36. Yamada K, Mizuno M, Nabeshima T: Role for brain-derived neu-
rotrophic factor in learning and memory. Life Sci 2002,
70:735-744.
37. Tyler WJ, Alonso M, Bramham CR, Pozzo-Miller LD: From acquisi-
tion to consolidation: on the role of brain-derived
neurotrophic factor signaling in hippocampal-dependent
learning. Learn Mem 2002, 9:224-237.
38. Tsai SJ: Brain-derived neurotrophic factor: a bridge between
major depression and Alzheimer's disease? Med Hypotheses
2003, 61:110-113.
39. Laske C, Stransky E, Leyhe T, Eschweiler GW, Wittorf A, Richartz E,
Bartels M, Buchkremer G, Schott K: Stage-dependent BDNF
serum concentrations in Alzheimers disease. J Neural Transm
2006, 113:1217-1224.
40. Karege F, Perret G, Bondolfi G, Schwald M, Bertschy G, Aubry JM:
Decreased serum brain-derived neurotrophic factor levels in
major depressed patients. Psychiatry Res 2002, 109:143-148.
41. Krabbe K, Nielsen A, Krogh-Madsen R, Plomgaard P, Rasmussen P,
Erikstrup C, Fischer C, Lindegaard B, Petersen A, Taudorf S, Secher
N, Pilegaard H, Bruunsgaard H, Pedersen B: Brain-derived neuro-
trophic factor (BDNF) and type 2 diabetes. Diabetologia 2007,
50:431-438.
42. GeneCards []
43. Haapasalo A, Sipola I, Larsson K, Akerman K, Stoilov P, Stamm S,
Wong G, Castren E: Regulation of TRKB surface expression by
brain-derived neurotrophic factor and truncated TRKB
isoforms. J Biol Chem 2002, 277:43160-43167.
44. Huber K, Christ G, Wojta J, Gulba D: Plasminogen activator
inhibitor type-1 in cardiovascular disease. Thromb Res 2001,
103:S7-S19.
45. Sommerfeld MT, Schweigreiter R, Barde YA, Hoppe E: Down-regu-
lation of the neurotrophin receptor TrkB following ligand
binding. Evidence for an involvement of the proteasome and
differential regulation of TrkA and TrkB. J Biol Chem 2000,
275:8982-8990.
46. Bunney WE, Bunney BG, Vawter MP, Tomita H, Li J, Evans SJ, Chou-
dary PV, Myers RM, Jones EG, Watson SJ, Akil H: Microarray tech-
Genome Biology 2008, Volume 9, Issue 10, Article R148 Ray et al. R148.14
Genome Biology 2008, 9:R148
nology: a review of new strategies to discover candidate
vulnerability genes in psychiatric disorders. Am J Psychiatry
2003, 160:657-666.
47. Pan YS, Lee YS, Lee YL, Lee WC, Hsieh SY: Differentially profiling
the low-expression transcriptomes of human hepatoma
using a novel SSH/microarray approach. BMC Genomics 2006,
7:131.
48. Yue H, Eastman PS, Wang BB, Minor J, Doctolero MH, Nuttall RL,
Stack R, Becker JW, Montgomery JR, Vainer M, Johnston R: An eval-
uation of the performance of cDNA microarrays for detect-
ing changes in global mRNA expression. Nucleic Acids Res 2001,
29:E41-1.
49. Canales RD, Luo Y, Willey JC, Austermiller B, Barbacioru CC, Boysen
C, Hunkapiller K, Jensen RV, Knight CR, Lee KY, Ma Y, Maqsodi B,
Papallo A, Peters EH, Poulter K, Ruppel PL, Samaha RR, Shi L, Yang
W, Zhang L, Goodsaid FM: Evaluation of DNA microarray
results with quantitative gene expression platforms. Nat
Biotechnol 2006, 24:1115-1122.
50. Sandelin A, Alkema W, Engstrom P, Wasserman WW, Lenhard B:
JASPAR: an open-access database for eukaryotic transcrip-
tion factor binding profiles. Nucleic Acids Res 2004:D91-94.
51. Tsuda H, Jafar-Nejad H, Patel AJ, Sun Y, Chen HK, Rose MF, Venken
KJ, Botas J, Orr HT, Bellen HJ, Zoghbi HY: The AXH domain of
Ataxin-1 mediates neurodegeneration through its interac-
tion with Gfi-1/Senseless proteins. Cell 2005, 122:633-644.
52. Qu D, Rashidian J, Mount MP, Aleyasin H, Parsanejad M, Lira A, Haque
E, Zhang Y, Callaghan S, Daigle M, Rousseaux MW, Slack RS, Albert
PR, Vincent I, Woulfe JM, Park DS: Role of Cdk5-mediated phos-
phorylation of Prx2 in MPTP toxicity and Parkinson's
disease. Neuron 2007, 55:37-52.
53. Fang J, Nakamura T, Cho DH, Gu Z, Lipton SA: S-nitrosylation of
peroxiredoxin 2 promotes oxidative stress-induced neuronal
cell death in Parkinson's disease. Proc Natl Acad Sci USA 2007,
104:18742-18747.
54. Santpere G, Nieto M, Puig B, Ferrer I: Abnormal Sp1 transcrip-
tion factor expression in Alzheimer disease and tauopathies.
Neurosci Lett 2006, 397:30-34.
55. Christensen M, Zhou W, Qing H, Lehman A, Philipsen S, Song W:
Transcriptional regulation of BACE1, the amyloid precursor
protein beta-Secretase, by Sp1. Mol Cell Biol 2004, 24:865-874.
56. Li R, Strohmeyer R, Liang Z, Lue LF, Rogers J: CCAAT/enhancer
binding protein delta (C/EBPdelta) expression and elevation
in Alzheimer's disease. Neurobiol Aging 2004, 25:991-999.
57. Perez-Capote K, Saura J, Serratosa J, Sola C: Expression of C/
EBPalpha and C/EBPbeta in glial cells in vitro after inducing
glial activation by different stimuli. Neurosci Lett 2006,
410:25-30.
58. Barkett M, Gilmore TD: Control of apoptosis by Rel/NF-kappaB
transcription factors. Oncogene 1999, 18:6910-6924.
59. Tomita S, Fujita T, Kirino Y, Suzuki T: PDZ domain-dependent
suppression of NF-kappa B/p65-induced Abeta 42 produc-
tion by a neuron-specific X11-like protein. J Biol Chem 2000,
275:13056-13060.
60. Kimura R, Kamino K, Yamamoto M, Nuripa A, Kida T, Kazui H, Hash-
imoto R, Tanaka T, Kudo T, Yamagata H, Tabara Y, Miki T, Akatsu H,
Kosaka K, Funakoshi E, Nishitomi K, Sakaguchi G, Kato A, Hattori H,
Uema T, Takeda M: The DYRK1A gene, encoded in chromo-
some 21 Down syndrome critical region, bridges between
beta-amyloid production and tau phosphorylation in Alzhe-
imer disease. Hum Mol Genet 2007, 16:15-23.
61. Pastorcic M, Das HK: Ets transcription factors ER81 and Elk1
regulate the transcription of the human presenilin 1 gene
promoter. Brain Res Mol Brain Res 2003, 113:57-66.
62. Tong L, Balazs R, Thornton PL, Cotman CW: Beta-amyloid pep-
tide at sublethal concentrations downregulates brain-
derived neurotrophic factor functions in cultured cortical
neurons. J Neurosci 2004, 24:6799-6809.
63. Salero E, Giménez C, Zafra F: Identification of a non-canonical E-
box motif as a regulatory element in the proximal promoter
region of the apolipoprotein E gene. Biochem J 2003,
370:979-986.
64. Reid SJ, van Roon-Mom WM, Wood PC, Rees MI, Owen MJ, Faull RL,
Dragunow M, Snell RG: TBP, a polyglutamine tract containing
protein, accumulates in Alzheimer's disease. Brain Res Mol
Brain Res 2004,
125:120-128.
65. Ng MC, Miyake K, So WY, Poon EW, Lam VK, Li JK, Cox NJ, Bell GI,
Chan JC: The linkage and association of the gene encoding
upstream stimulatory factor 1 with type 2 diabetes and met-
abolic syndrome in the Chinese population. Diabetologia 2005,
48:2018-2024.
66. Choquette AC, Bouchard L, Houde A, Bouchard C, Psse L, Vohl MC:
Associations between USF1 gene variants and cardiovascu-
lar risk factors in the Quebec Family Study. Clin Genet 2007,
71:245-253.
67. Komulainen K, Alanne M, Auro K, Kilpikari R, Pajukanta P, Saarela J,
Ellonen P, Salminen K, Kulathinal S, Kuulasmaa K, Silander K, Salomaa
V, Perola M, Peltonen L: Risk alleles of USF1 gene predict cardi-
ovascular disease of women in two prospective studies. PLoS
Genet 2006, 2:e69.
68. Maltepe E, Schmidt JV, Baunoch D, Bradfield CA, Simon MC: Abnor-
mal angiogenesis and responses to glucose and oxygen dep-
rivation in mice lacking the protein ARNT. Nature 1997,
386:403-407.
69. Erbel PJ, Card PB, Karakuzu O, Bruick RK, Gardner KH: Structural
basis for PAS domain heterodimerization in the basic helix-
loophelix-PAS transcription factor hypoxia-inducible factor.
Proc Natl Acad Sci USA 2003, 100:15504-15509.
70. Catrina SB, Okamoto K, Pereira T, Brismar K, Poellinger L: Hyperg-
lycemia regulates hypoxia-inducible factor-1alpha protein
stability and function. Diabetes 2004, 53:3226-3232.
71. Shi J, Xiang Y, Simpkins JW: Hypoglycemia enhances the expres-
sion of mRNA encoding beta-amyloid precursor protein in
rat primary cortical astroglial cells. Brain Res 1997,
772:247-251.
72. Peers C, Pearson HA, Boyle JP: Hypoxia and Alzheimer's
disease. Essays Biochem 2007, 43:153-164.
73. Sun X, He G, Qing H, Zhou W, Dobie F, Cai F, Staufenbiel M, Huang
LE, Song W: Hypoxia facilitates Alzheimer's disease
pathogenesis by up-regulating BACE1 gene expression. Proc
Natl Acad Sci USA 2006, 103:18727-18732.
74. Germack R, Leon-Velarde F, Valdes De La Barra R, Farias J, Soto G,
Richalet JP: Effect of intermittent hypoxia on cardiovascular
function, adrenoceptors and muscarinic receptors in Wistar
rats. Exp Physiol 2002, 87:453-460.
75. Yelon D, Ticho B, Halpern ME, Ruvinsky I, Ho RK, Silver LM, Stainier
DY: The bHLH transcription factor hand2 plays parallel roles
in zebrafish heart and pectoral fin development. Development
2000, 127:2573-2582.
76. Firulli BA, Howard MJ, McDaid JR, McIlreavey L, Dionne KM, Cen-
tonze VE, Cserjesi P, Virshup DM, Firulli AB: PKA, PKC, and the
protein phosphatase 2A influence HAND factor function: a
mechanism for tissue-specific transcriptional regulation. Mol
Cell 2003, 12:1225-1237.
77. Rossler M, Zarski R, Bohl J, Ohm TG: Stage-dependent and sec-
tor-specific neuronal loss in hippocampus during Alzheimers
disease. Acta Neuropathol 2002, 103:363-369.
78. Braak H, Braak E: Neuropathological stageing of Alzheimer-
related changes. Acta Neuropathol 1991, 82:239-259.
79. Irizarry RA, Wu Z, Jaffee HA: Comparison of Affymetrix Gene-
Chip expression measures. Bioinformatics 2006, 22:789-794.
80. ISI [ />81. Newman M, Girvan M: Finding and evaluating community
structure in networks. Phys Rev E 2004, 69:026113.
82. Ruan J, Zhang W: Identification and evaluation of weak com-
munity structures in networks. In Proceedings of the Twenty-First
National Conference on Artificial Intelligence; July 16-20, 2006: Boston,
Massachusetts Edited by: Gil Y, Mooney RJ. Menlo Park, California:
The AAAI Press; 2006:470-475.
83. Wakaguri H, Yamashita R, Suzuki Y, Sugano S, Nakai K: DBTSS:
database of transcription start sites, progress report 2008.
Nucleic Acids Res 2008:D97-101.
84. Quandt K, Frech K, Karas H, Wingender E, Werner T: MatInd and
MatInspector: new fast and versatile tools for detection of
consensus matches in nucleotide sequence data. Nucleic Acids
Res 1995, 23:4878-4884.