Báo cáo y học: "Singular value decomposition-based regression identifies activation of endogenous signaling pathways in vivo" ppsx
Bạn đang xem bản rút gọn của tài liệu. Xem và tải ngay bản đầy đủ của tài liệu tại đây (2.57 MB, 11 trang )
Genome Biology 2008, 9:R180
Open Access
2008Liuet al.Volume 9, Issue 12, Article R180
Method
Singular value decomposition-based regression identifies activation
of endogenous signaling pathways in vivo
Zhandong Liu
*†
, Min Wang
*
, James V Alvarez
*
, Megan E Bonney
*
, Chien-
chung Chen
*
, Celina D'Cruz
*
, Tien-chi Pan
*
, Mahlet G Tadesse
‡
and
Lewis A Chodosh
*†
Addresses:
*
Department of Cancer Biology, Abramson Family Cancer Research Institute, University of Pennsylvania, 421 Curie Blvd, BRB II/
III 616, Philadelphia, PA 19104, USA.
†
Genomics and Computational Biology Graduate Group, University of Pennsylvania School of Medicine,
423 Guardian Drive, Philadelphia, PA 19104, USA.
‡
Department of Mathematics, Georgetown University, 2115 G Street NW, Washington, DC
20057, USA.
Correspondence: Lewis A Chodosh. Email:
© 2008 Liu et al.; licensee BioMed Central Ltd.
This is an open access article distributed under the terms of the Creative Commons Attribution License ( which
permits unrestricted use, distribution, and reproduction in any medium, provided the original work is properly cited.
SVD regression to study cross-talk<p>Singular value decomposition regression can detect the activation of endogenous signaling pathways, allowing the identification of pathway cross-talk.</p>
Abstract
The ability to detect activation of signaling pathways based solely on gene expression data
represents an important goal in biological research. We tested the sensitivity of singular value
decomposition-based regression by focusing on functional interactions between the Ras and
transforming growth factor beta signaling pathways. Our findings demonstrate that this approach
is sufficiently sensitive to detect the secondary activation of endogenous signaling pathways as it
occurs through crosstalk following ectopic activation of a primary pathway.
Background
Tumors arise following the accumulation of a diverse set of
genetic aberrations within a single cell [1]. This heterogeneity
makes prognostic and therapeutic decisions difficult, as
tumors arising from the same tissue type may harbor activa-
tion of distinct oncogenic pathways [2,3]. As a consequence,
tumors that are histologically similar may follow strikingly
different clinical courses and respond differently to conven-
tional and targeted therapies [4-6]. Indeed, as molecularly
targeted therapies increasingly enter the clinic, identifying
the spectrum of oncogenic pathways activated within a given
tumor will become even more critical for selecting effective
therapeutic approaches.
Currently, the clinical detection of oncogenic pathway activa-
tion is most commonly performed using methods that analyze
pathway activation at the protein level, such as immunohisto-
chemistry to detect oncogene overexpression, or at the DNA
level to detect oncogene amplification, with techniques such
as fluorescence in situ hybridization (FISH) and quantitative
PCR. For example, expression of human epidermal growth
factor receptor 2 (HER2) and estrogen receptor are routinely
assessed to guide treatment selection in breast cancer [7,8].
Unfortunately, many commonly activated oncogenic path-
ways do not lend themselves to this type of analysis. This is,
in part, due to the fact that most pathways can be activated at
multiple points in the pathway [3], thereby complicating
attempts to assess a pathway's overall activation status. Con-
sequently, a more robust and generalizable method for
detecting oncogenic pathway activation in tumors would be
valuable.
To date, a number of methods have been developed to infer
pathway activation from gene expression data. These
Published: 18 December 2008
Genome Biology 2008, 9:R180 (doi:10.1186/gb-2008-9-12-r180)
Received: 23 October 2008
Accepted: 18 December 2008
The electronic version of this article is the complete one and can be
found online at /> Genome Biology 2008, Volume 9, Issue 12, Article R180 Liu et al. R180.2
Genome Biology 2008, 9:R180
approaches have the advantage of being applicable to multi-
ple pathways simultaneously and of requiring only one tech-
nological modality. For example, gene set enrichment
analysis (GSEA) has been used to detect pathway activation
by comparing the extent of enrichment of a signature for a
given pathway between two groups of samples [9]. Using this
approach, Sweet-Cordero et al. [10] detected a K-Ras expres-
sion signature in human lung adenocarcinomas bearing K-
Ras mutations.
However, GSEA has several limitations. First, it cannot pro-
vide a quantitative measure of pathway activation. More
importantly, since GSEA relies on a comparison between two
groups, it cannot be used to identify the state of pathway acti-
vation for individual samples. This represents a major limita-
tion, since separating a sample set into two groups for the
purposes of comparison requires prior knowledge of some
relevant feature of the samples. Consequently, GSEA is most
useful for identifying pathways that are enriched in samples
with a known clinical parameter, such as a particular tumor
subtype. In contrast, GSEA is not well suited for identifying or
comparing pathway activity levels within a group of samples.
Other enrichment analysis methods, such as gene set analysis
[11], share these shortcomings.
An alternative approach to detecting pathway activation is
singular value decomposition-based Bayesian binary regres-
sion (SVD regression) [7,12]. In this approach, the gene
expression patterns of two training sample sets (for example,
pathway 'on' and pathway 'off') are compared and differen-
tially regulated genes are linearly combined into principal
components, thereby reducing the dimensionality of the fea-
ture space. Binary regression on the principal components is
then applied to an unknown test sample, resulting in a prob-
ability score describing the likelihood of pathway activation in
that sample. This approach has several advantages. First, the
output is, at least in theory, a quantitative measure of path-
way activity. Furthermore, SVD regression can be applied to
a single sample and does not require dividing the testing sam-
ples into two groups based upon a priori knowledge. Finally,
the use of reduced-dimension features and orthogonal com-
ponents reduces problems involving co-linearity during
regression analysis. For these reasons, SVD regression holds
promise as a mathematical tool for predicting pathway activ-
ity.
To date, SVD regression has been used to detect activation of
dominant oncogenic signaling pathways, such as Myc or Ras,
in MMTV-Myc and MMTV-Ras driven mouse breast cancer
models, respectively [4,5,12]. In these contexts, SVD regres-
sion was shown to be capable of detecting activation of the
pathway that was experimentally perturbed. While such
experiments provided proof-of-principle that SVD regression
can detect pathway activation, the critical question of whether
SVD regression is sensitive enough to detect activation of
endogenous pathways has not been fully addressed.
SVD regression has also been used to predict pathway activity
in human samples [4,5]. For example, Bild et al. [4] were able
to predict the activation status of five distinct oncogenic path-
ways (Myc, Ras, E2F, Src, and β-catenin) in primary lung can-
cers and to correlate these activities with patient survival.
Unfortunately, validation of the sensitivity and specificity of
this approach is limited by the difficulty in confirming predic-
tions made on human samples, as material for biochemical
analysis is often unavailable. Thus, the accuracy of predic-
tions made using SVD regression in these studies remains
undetermined.
We reasoned that SVD regression might be a powerful means
of detecting endogenous pathway activation, allowing for the
discovery of new biological relationships between signaling
pathways. To evaluate this possibility, we addressed whether
SVD regression is sufficiently sensitive to detect secondary
activation of an endogenous pathway in a model amenable to
experimental manipulation and validation. Specifically, we
focused on the relationship between the Ras and transform-
ing growth factor beta (TGFβ) signaling pathways. Although
a number of studies have documented crosstalk between
these pathways, a coherent model explaining their interaction
has remained elusive, and there exists no consensus on the
direction or underlying mechanism of this crosstalk, nor on
how these pathways interact during epithelial cell transfor-
mation.
In non-transformed cells, the Ras and TGFβ pathways exert
largely antagonistic effects: Ras can inhibit TGFβ-induced
growth suppression by inhibiting Smad nuclear translocation
[13], while TGFβ can potently inhibit cell proliferation
induced by mitogenic factors, such as epidermal growth fac-
tor, that signal through Ras [14]. In contrast, Ras and TGFβ
appear to cooperate in transformed cells to promote aspects
of tumor progression, including epithelial-to-mesenchymal
transition, invasion, and metastasis [15-17]. As such, cross-
talk between the Ras and TGFβ pathways is complex, may
occur at multiple nodes within each pathway, and is likely to
be dependent upon cellular context.
To detect crosstalk between the Ras and TGFβ pathways
using computational approaches, we generated gene expres-
sion signatures that allow for the quantitative prediction of
TGFβ and Ras pathway activity using SVD regression. Using
these signatures, we demonstrate that acute induction of
oncogenic Ras in the mouse mammary gland results in rapid
activation of the TGFβ pathway. Conversely, application of
SVD regression using a Ras pathway signature revealed rapid
Ras pathway activation following TGFβ treatment of normal
mammary epithelial cells. Biochemical studies confirmed
these computational findings, supporting the specificity of
these SVD regression-based predictions. Taken together, our
results indicate that SVD regression can detect activation of
endogenous pathways in vivo, thereby providing novel
insight into cell signaling in vivo.
Genome Biology 2008, Volume 9, Issue 12, Article R180 Liu et al. R180.3
Genome Biology 2008, 9:R180
Results
Generation of a TGFβ pathway signature using SVD
regression
To generate a gene expression signature for the TGFβ signal-
ing pathway in mammary epithelial cells, we used a non-
transformed murine mammary epithelial cell line (NMuMG).
NMuMG cells respond to TGFβ by undergoing epithelial-to-
mesenchymal transition and have commonly been used to
study signaling and transcriptional events downstream of this
cytokine. To identify a comprehensive list of genes altered by
TGF-β1 treatment, Affymetrix microarray analysis was per-
formed on untreated NMuMG cells and cells treated with
TGFβ for 24 h. SVD regression with Markov Chain Monte
Carlo (MCMC) fitting generated a TGF-β1 signature consist-
ing of 500 genes. Among the genes present in this signature
were several known TGFβ targets, including Serpine1/plas-
minogen activator inhibitor-1 (PAI-1), connective tissue
growth factor (Ctgf), Bhlhb2, cysteine rich protein 61(Cyr61)
and interleukin-11(IL-11) [18-21].
We next wished to compare the transcriptional changes
induced by TGF-β1 and TGF-β3. NMuMG cells were treated
with TGF-β3 for 24 h, Affymetrix microarray analysis was
performed, and a TGF-β3 signature was extracted in a man-
ner analogous to that used for TGF-β1. Principal component
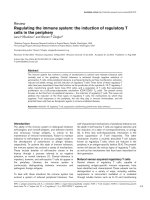
analysis (PCA) of the TGF-β1 signature revealed that 97.7% of
the gene expression variation could be represented in princi-
pal component 1 (Figure 1a). When the TGF-β3 signature was
projected in the PCA plot onto the space delineated by the
TGF-β1 signature, TGF-β3-treated samples fell closer to TGF-
β1 treated samples than to untreated NMuMG cells, indicat-
ing that TGF-β1 and TGF-β3 elicit similar transcriptional
changes (Figure 1a).
To further compare the transcriptional changes induced by
TGF-β1 and TGF-β3, the extent of overlap between genes dif-
ferentially regulated by these cytokines was assessed. Treat-
ment with TGF-β1 and TGF-β3 led to changes in 1,316 and
880 probes, respectively, with a minimum threshold of a 1.5-
fold change and a p
-value <0.01. There were 757 differentially
regulated genes common to these two treatments (p = 1.2 ×
10
-107
, hypergeometric test), indicating again that TGF-β1 and
TGF-β3 induce very similar transcriptional programs. Since
substantial overlap was identified between the TGF-β1 and
TGF-β3 transcriptional responses, we used the 500-gene
TGF-β1 signature as the TGFβ pathway signature for all sub-
sequent experiments and the TGF-β3 dataset was used as an
independent testing dataset (Additional data file 1).
Quantitative estimation of TGFβ pathway activity in
TGFβ-treated mammary epithelial cells using SVD
regression
While PCA permits untreated and TGFβ-treated samples to
be distinguished, it would be useful to have a quantitative
measure of TGFβ pathway activity in a given sample. Given
the limited sensitivity and specificity of microarrays [22-24],
this requires combining multiple probe sets and reducing the
dimensionality of data to construct a stable predictor with
limited training data.
Toward this end, SVD binary regression with MCMC fitting
was applied to obtain a quantitative measurement of TGFβ
pathway activity. First, the TGFβ pathway predictor was
trained by comparing TGF-β1 treated and untreated cells. The
predictor was then tested on TGF-β3 treated cells. Using
leave-one-out cross-validation to assess out-of-sample-error,
An NMuMG-derived TGFβ signature accurately and quantitatively predicts TGFβ pathway activationFigure 1
An NMuMG-derived TGFβ signature accurately and
quantitatively predicts TGFβ pathway activation. (a) Principal
component analysis (PCA) of untreated NMuMG cells (open circles), TGF-
β1 treated cells (training set, filled squares), and TGF-β3 treated cells
(testing set, filled circles). (b) SVD regression demonstrating quantitative
prediction of TGFβ pathway activity in both TGF-β1 and TGF-β3 treated
cells.
(a)
Untreated
TGF-β1
TGF-β3
Untreated
TGF-β1
TGF-β3
Probability of TGFβ pathway activity
PC2
PC1
(b)
Genome Biology 2008, Volume 9, Issue 12, Article R180 Liu et al. R180.4
Genome Biology 2008, 9:R180
the predictor was able to detect TGFβ pathway activity in both
the training (TGFβ-1) and the testing (TGFβ-3) sets (Figure
1b). Thus, this model appears to provide a sensitive and accu-
rate measure of TGFβ activity.
PCA identifies TGFβ pathway activation following
short-term Ras induction
Given the complex relationship between the Ras and TGFβ
pathways during epithelial cell transformation [14-17,25-29],
we sought to determine the status of the TGFβ pathway fol-
lowing Ras activation in vivo.
We previously described the generation of TetO-Ras (TRAS)
mice in which expression of an activated oncogenic Ras allele
(Hras
G12V
) is under the control of the tetracycline operator
[30]. TRAS mice were mated to MMTV-rtTA (MTB) trans-
genic mice that express the reverse tetracycline transactivator
(rtTA) under the control of the MMTV promoter. In the
resulting bitransgenic MTB/TRAS mice, doxycycline treat-
ment leads to oncogenic Ras expression in the mammary epi-
thelium, resulting in the acute activation of pathways
downstream of Ras [31].
To examine the relationship between Ras activation and
TGFβ pathway activity, we used microarray expression profil-
ing and SVD regression to assess TGFβ pathway activity in the
mammary glands of MTB/TRAS mice following doxycycline
treatment. MTB/TRAS mice were treated with doxycycline
for 24 h, 48 h, 96 h, 8 days or 14 days, and RNA was harvested
from mammary glands for global gene expression analysis
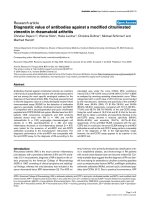
using Affymetrix microarrays. When mammary gland sam-
ples were projected onto the expression space delineated by
the TGFβ signature, as defined in NMuMG cells, mammary
samples in which Ras was acutely induced spanned the region
between untreated and TGFβ-treated NMuMG cells (Figure
2a). Mammary gland samples from uninduced MTB/TRAS
mice were most similar to untreated NMuMG cells, whereas
mammary gland samples from 14-day induced MTB/TRAS
mice were most similar to TGFβ-treated NMuMG cells. The
magnitude of TGFβ activation predicted based upon the
TGFβ signature increased with increasing duration of Ras
activation. These results indicate that Ras activation in the
mammary gland results in gene expression changes similar to
those induced by TGFβ in mammary epithelial cells in vitro.
This, in turn, suggests that oncogenic Ras is capable of
directly activating the TGFβ pathway in vivo.
SVD regression identifies TGFβ pathway activation
following short-term Ras-induction
We next wished to obtain a quantitative measure of changes
in TGFβ pathway activity following short-term Ras activation
in vivo. To achieve this, the SVD predictor was used to esti-
mate TGFβ activity at increasing times following Ras induc-
tion. This analysis revealed a time-dependent increase in
predicted TGFβ activity in the mammary gland following Ras
activation. An increased probability of TGFβ pathway activity
was observed as early as 24-48 h following Ras activation.
Increased TGFβ pathway activity reached statistical signifi-
cance at 96 h post-Ras-induction and remained elevated
through 14 days of Ras activation (Figure 2b). These results
indicate that Ras activation in the mammary gland leads to
the progressive, time-dependent induction of a TGFβ expres-
sion signature indicative of TGFβ pathway activity.
A TGFβ signature detects TGFβ pathway activation following short-term Ras induction in the mammary glandFigure 2
A TGFβ signature detects TGFβ pathway activation following
short-term Ras induction in the mammary gland. (a) Mapping of
mammary glands expressing activated Ras for increasing times (filled
triangles) or uninduced controls (open triangles) onto the principal
component space defined by the TGFβ signature in Figure 1a. (b) SVD
regression predicts TGFβ pathway activation in mammary glands
expressing activated Ras for 96 h, 8 days, and 14 days.
(a)
Probability of TGFβ pathway activity
(b)
Genome Biology 2008, Volume 9, Issue 12, Article R180 Liu et al. R180.5
Genome Biology 2008, 9:R180
Generation of a Ras pathway signature using SVD
regression
We next sought to construct a predictor that would permit
assessment of Ras pathway activity based on microarray data.
To generate an in vivo Ras signature, SVD regression analysis
with MCMC fitting was applied to expression data from the
mammary glands of MTB/TRAS mice induced for 0, 48 or 96
h (Additional data file 2). When other induction time-points
were projected onto this principal component space, early
time-points (t = 24 h) fell closest to uninduced samples,
whereas later time-points (t = 8 days and 14 days) fell closest
to the 48 h and 96 h samples (Figure 3a). This indicates that
the Ras signature generated from 48 h and 96 h induction
time-points also detects Ras activity following earlier as well
as later times of induction, thereby validating the utility of
this signature.
To obtain a quantitative measure of Ras pathway activity,
SVD binary regression was applied to expression data from
MTB/TRAS mice induced for 0, 48 or 96 h. The resulting pre-
dictor was then applied to the other induction time-points to
test its ability to quantitatively predict Ras activity. MTB/
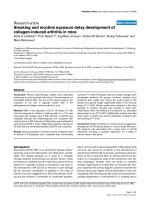
TRAS mice induced for 24 h exhibited a detectable increase in
Ras pathway activity that was higher than that observed for
MTB controls and lower than that observed for MTB/TRAS
mice induced for 48 h (Figure 3b). MTB/TRAS mice in which
Ras was induced for 8 or 14 days displayed pathway activation
higher than that observed at 48 h and comparable to that
observed following 96 h of Ras transgene induction (Figure
3b). These findings indicate that this gene predictor accu-
rately and quantitatively detects Ras pathway activation.
SVD regression identifies endogenous Ras pathway
activation following TGFβ treatment
In light of our computational prediction that acute Ras activa-
tion in the mammary gland resulted in secondary activation
of the TGFβ pathway, and in light of prior reports implicating
the mitogen-activated protein kinase (MAPK) pathway in
TGFβ-induced epithelial-to-mesenchymal transition [32], we
sought to determine whether acute TGFβ pathway activation
in mammary epithelial cells resulted in secondary activation
of the Ras pathway. First, gene expression data from
untreated, and TGF-β1- and TGF-β3-treated NMuMG cells
were mapped onto the principal component space defined by
the in vivo Ras signature. TGF-β1- and TGF-β3-treated cells
mapped closest to the 8- and 14-day Ras-induction samples,
whereas untreated cells mapped closer to uninduced samples
(Figure 3a) This suggests that TGF-β1 and TGF-β3 induce
transcriptional changes similar to those induced by Ras acti-
vation.
To quantitatively assess the level of Ras pathway activation
induced by TGFβ treatment, the Ras predictor was applied to
TGF-β1- and TGF-β3-treated NMuMG cells. Whereas
untreated NMuMG cells displayed no detectable increase in
Ras pathway activity, TGF-β1 and TGF-β3 treatment led to
the robust induction of signatures indicative of Ras pathway
activation (Figure 4). Together, both PCA and SVD regression
analyses predict that the Ras pathway is activated as a conse-
quence of TGFβ treatment in NMuMG cells.
Biochemical validation of pathway predictions
We considered several models to explain the pathway predic-
tions made by SVD. First, Ras and TGFβ might initiate similar
An in vivo-derived Ras signature accurately and quantitatively predicts Ras pathway activationFigure 3
An in vivo-derived Ras signature accurately and quantitatively
predicts Ras pathway activation. (a) PCA demonstrating separation
of mammary gland samples with Ras activation (MTB/TRAS 48 h, 96 h, 8
days and 14 days, filled triangles) from uninduced controls (MTB and MTB/
TRAS 0 hours, open triangles) across principal component 1 (PC1). MTB/
TRAS mice uninduced (open triangles) or induced (filled triangles) for 48
or 96 h were used for training, while the remaining MTB/TRAS time points
and MTB uninduced mice were used as the test set. (b) SVD regression
demonstrating quantitative prediction of Ras pathway activation following
short-term induction in the mammary gland.
PC2
PC1
MTB/TRAS
MTB
Probability of pathway activity
0hr
0hr 24hr 48hr 96hr 8d 14d
(a)
(b)
Genome Biology 2008, Volume 9, Issue 12, Article R180 Liu et al. R180.6
Genome Biology 2008, 9:R180
gene expression programs through distinct transcriptional
mediators. Alternatively, Ras might lead to activation of reg-
ulatory molecules downstream of TGFβ, such as those of the
Smad transcription factor family. Similarly, TGFβ might acti-
vate effector molecules downstream of Ras, such as Raf,
MEK, and MAPK. To evaluate these possibilities at the bio-
chemical level, we examined the Smad family of transcription
factors as well as the Raf-MEK-MAPK pathway as critical
mediators of TGFβ and Ras-induced signaling, respectively.
To determine whether the activation of the TGFβ pathway
that we detected computationally following short-term Ras
induction in the mammary gland was due to activation of
Smad transcription factors, we performed immunofluores-
cence on mammary gland sections to examine the subcellular
localization of Smad4. This analysis revealed that 96 h of Ras
activation in the mammary gland was sufficient to induce
nuclear translocation of Smad4, confirming activation of this
pathway (Figure 5a). We next examined Smad3 phosphoryla-
tion following Ras activation. Consistent with our prediction
that Ras activates this pathway, we found that acute induction
of activated Ras led to a marked increase in levels of phospho-
rylated Smad3 (Figure 5b,c). Thus, short-term Ras activation
directly induces Smad activation in vivo, which in turn results
in the induction of a TGFβ transcriptional response.
To test our prediction that TGFβ treatment results in Ras
pathway activation, the activation status of signaling compo-
nents of this pathway was evaluated in TGFβ-treated
NMuMG cells. As predicted, levels of Ras-GTP were higher in
TGFβ-treated NMuMG cells compared to untreated cells
(Figure 5d), indicating that TGFβ treatment resulted in Ras
activation. Similarly, while TGFβ treatment did not alter the
activation of RalA/B or Akt in NMuMG cells (data not
shown), significant increases in p-MEK levels were observed
in NMuMG cells following TGFβ treatment (Figure 5e). This
indicates that TGFβ treatment results in Ras-Raf-MAPK
pathway activation in NMuMG cells in vitro, thereby con-
firming our computational prediction.
Together, our results are consistent with a model in which
oncogenic Ras activation results in the induction of a TGFβ
transcriptional response through activation of Smads, and in
which activation of the TGFβ pathway can induce a Ras tran-
scriptional response by activating the Ras-Raf-MAPK path-
way.
SVD regression identifies TGFβ pathway activation in
Ras-induced mammary tumors
The results described above indicate that SVD regression can
detect endogenous activation of a secondary pathway in a
well-defined system. For SVD regression to be of broad util-
ity, however, it must also accurately predict pathway activa-
tion in a complex system, such as a tumor. Chronic Ras
activation in the mammary gland leads to the formation of
adenocarcinomas with a latency of 14 weeks. Given our find-
ing that short-term Ras activation in the mammary gland
results in TGFβ pathway activation, we next sought to assess
whether activation of the TGFβ pathway is also detectable in
Ras-induced tumors. To address this, global gene expression
profiles of Ras-induced tumors were assessed by Affymetrix
microarray analysis, and the above SVD predictor was used to
predict their TGFβ pathway activity. This analysis reveals that
the TGFβ pathway is indeed activated in Ras-induced tumors
(Figure 6a), suggesting that this putative tumor suppressor
TGFβ pathway is not shut off during the course of Ras-induce
tumorigenesis.
We next used biochemical approaches to test our computa-
tional prediction that the TGFβ pathway is activated in Ras-
induced tumors. Lysates from Ras-induced tumors were pre-
pared and levels of activated Smad1/3 were assessed by west-
ern blot. We observed prominent Smad1/3 phosphorylation
in Ras-induced mammary tumors (Figure 6b), confirming
our computational prediction that the TGFβ pathway remains
activated in Ras-induced tumors. This indicates that SVD can
detect signaling pathway activation within a complex system.
Discussion
The ability to detect activation of an oncogenic pathway based
upon patterns of gene expression would constitute a useful
tool to query tumor biology and aid in prognostic and thera-
peutic decision-making in cancer patients. Herein we
describe the use of SVD regression to accurately detect endog-
enous pathway activity in vivo in the context of a strong pri-
A Ras signature detects Ras pathway activation following TGFβ treatment of NMuMG cellsFigure 4
A Ras signature detects Ras pathway activation following TGFβ
treatment of NMuMG cells. SVD regression predicting activation of
the Ras pathway in TGF-β1- and TGF-β3-treated NMuMG cells, but not
untreated controls.
Control
TGF-β1 TGF-β3
Probability of Ras pathway activity
Genome Biology 2008, Volume 9, Issue 12, Article R180 Liu et al. R180.7
Genome Biology 2008, 9:R180
Ras and TGFβ exhibit positive reciprocal regulation in mammary epithelial cellsFigure 5
Ras and TGFβ exhibit positive reciprocal regulation in mammary epithelial cells. (a) Immunofluorescence showing Smad4 nuclear
translocation following short-term Ras expression in the mammary gland. Nuclei (blue), Smad4 (green), cytokeratin 8 (red). (b) Western blot analysis
demonstrating phosphorylation of Smad1/3 after 96 h of Ras activation in vivo. (c) Quantification of western analysis. (d) Western analysis showing
activated, GTP-bound Ras in NMuMG cells following TGFβ treatment. (e) Western analysis showing activated MEK in NMuMG cells following TGFβ
treatment.
MTB/TRAS 0hr
MTB/TRAS 96hr MTB 96hr
(a)
(b)
(c)
(d) (e)
Genome Biology 2008, Volume 9, Issue 12, Article R180 Liu et al. R180.8
Genome Biology 2008, 9:R180
mary oncogenic stimulus. Using an inducible transgenic
model expressing oncogenic Ras in the mammary gland, we
have demonstrated that a TGFβ transcriptional signature is
induced following short-term Ras activation and remains ele-
vated during a 2-week course of Ras induction in the mam-
mary gland. We have further demonstrated that this
signature can be attributed to Ras-induced activation of Smad
transcription factors, which provides a mechanistic basis for
our computational prediction. Finally, we have demonstrated
that TGFβ treatment of NMuMG cells results in the rapid
induction of a Ras pathway signature. Consistent with these
computational predictions, biochemical studies revealed that
TGFβ treatment resulted in MEK activation and increased
levels of Ras-GTP, suggesting that induction of the Ras-MEK-
ERK pathway is responsible for induction of the observed Ras
signature following TGFβ treatment.
Taken together, our results suggest a model in which Ras and
TGFβ induce reciprocal positive crosstalk in non-trans-
formed mammary epithelial cells. Since TGFβ has been
shown to inhibit epithelial cell transformation [33], our find-
ing that TGFβ activity is increased following activated Ras
expression in the mammary gland was unexpected, given that
Ras induces widespread hyperplasia in the mammary gland
at the time points tested and ultimately leads to tumor forma-
tion. However, these results are consistent with reports that
Ras and TGFβ can synergize in promoting some aspects of the
malignant phenotype [15,17]. Our findings provide important
confirmation of this hypothesis in an in vivo model for mam-
mary tumorigenesis and suggest that, at least in the context of
Ras activation, the TGFβ pathway could potentially contrib-
ute to early stages of transformation.
Using gene expression patterns to predict pathway activity
has several advantages over traditional biochemical methods.
Such signatures are based upon downstream transcriptional
targets of a pathway, and so function as an overall measure of
pathway activity. In contrast, biochemical approaches gener-
ally focus on one or several nodes in a pathway. Consequently,
these approaches risk missing pathway activation that occurs
at other points in the pathway, or that results from subtle,
coordinated changes in multiple pathway members. While
computational prediction of pathway activity does not
address the mechanism by which a given pathway is acti-
vated, it does generate testable predictions for subsequent
experiments.
Although linear regression is a popular tool in prediction, we
did not use it here to predict pathway activity for two reasons.
First, our training dataset only has two states, pathway 'on'
and 'off', and linear regression is not suitable in such cases.
Second, the number of training samples is much smaller than
the number of signature genes, a problem known as the 'curse
of dimensionality' in statistical learning. This makes estima-
tion of the linear regression coefficient unstable. To circum-
vent this problem, SVD has been used for dimensionality
reduction. For instance, SVD has been used to reduce the
dimensionality of expression data and integrate ChIP-chip
data with expression data [34,35]. It has also been employed
to reduce the expression data dimension prior to classifier
training using support vector machines [36,37]. Although
each of these approaches used SVD to reduce dimensionality,
the objectives of these studies were distinct from those of this
study, which focused on using expression data to predict sig-
naling pathway activity.
A TGFβ signature detects TGFβ pathway activation in Ras-induced mammary tumorsFigure 6
A TGFβ signature detects TGFβ pathway activation in Ras-
induced mammary tumors. (a) SVD regression predicts TGFβ
pathway activation in mammary glands expressing activated Ras for 96 h
and in mammary tumors induced by chronic Ras activation. (b) Western
analysis showing increased phosphorylation of Smad1/3 in Ras-induced
mammary tumors.
NMuMG
MTB/TRAS
0hr
96hr
tumorcontrol
TGFβ-1
Probability of TGFβ pathway activity
(a)
(b)
Genome Biology 2008, Volume 9, Issue 12, Article R180 Liu et al. R180.9
Genome Biology 2008, 9:R180
Until recently, SVD binary regression has primarily been used
to detect the activity of ectopically activated dominant onco-
genic pathways [4,12]. Whether it can also be used to detect
endogenously occurring activation of a secondary pathway
had not previously been assessed. We were able to detect
TGFβ pathway activity in the context of concurrent, strong
Ras pathway activation, and vice versa. Our findings, which
were unexpected, indicate that SVD regression can detect
crosstalk between endogenous signaling pathways and may
be useful for identifying previously unsuspected relationships
between signaling pathways. Furthermore, our results pro-
vide an important proof-of-principle that SVD regression is
sufficiently sensitive for this purpose, which is essential for
the utility of this technique in predicting pathway activity in
human cancers.
When analyzing gene expression data from human tumor
samples, lack of materials frequently renders biochemical
validation impossible. As such, validating signatures in
experimentally tractable systems is valuable. To this end, in
the study presented here we were able to validate our compu-
tational predictions with biochemical approaches. Given that
tumors typically result from the collaboration between multi-
ple signaling pathways, the ability to detect the activation sta-
tus of individual pathways within a complex network of other
pathways in the cell is of paramount importance. In this man-
ner, it should be possible to classify tumors according to the
molecular pathways that have been activated, thereby leading
to improvements in the selection of appropriate treatments.
Materials and methods
Inducible transgenic mice and cell culture
MTB and TRAS transgenic mice have previously been
described [30,38]. Bitransgenic MTB/TRAS mice in an FVB/
N background were generated by crossing MTB and TRAS
mice. To induce oncogenic v-H-Ras expression, 6-week-old
MTB/TRAS female mice were administered 2 mg/ml doxycy-
cline with 5% sucrose in their drinking water. Mammary tis-
sue was harvested at different post-induction time points and
snap frozen. To generate Ras-driven tumors, MTB/TRAS
mice were administered 0.012 mg/ml doxycycline in their
drinking water and monitored for tumor formation. Mice
were sacrificed when tumors reached approximately 1 cm and
tissue was snap frozen.
The non-transformed murine mammary epithelial cell line
NMuMG was cultured in Dulbecco's modified Eagle's
medium (DMEM) supplemented with 10% bovine calf serum,
1% penicillin/streptomycin, and 2 mM L-glutamine. For
TGFβ treatment, cells were cultured in low serum medium
(0.5%) overnight followed by treatment with 5 ng/ml TGF-β1
or TGF-β3 (Sigma, St. Louis, MO, USA). After 24 h, RNA and
protein were harvested for microarray hybridization or bio-
chemical analysis.
Microarray analysis
RNA was isolated from snap-frozen mammary tissue or
NMuMG cells as previously described [39]. The synthesis of
biotinylated cRNA and hybridization to high-density Affyme-
trix MG-U74Av2 microarrays were performed according to
manufacturer's instructions. The raw data can be accessed
through the GEO database [GEO:GSE13986]. Genechip
Robust Multichip Average (GCRMA) was used to extract sig-
nal values from CEL files [22,24]. Expression values were
log2 transformed. The arrays were normalized using quantile
normalization and a fold-change based filtration was applied
to all genes on the array. Genes whose expression changed by
less than 1.5-fold between the two perturbed states were fil-
tered out as non-changing genes.
SVD binary regression
The method we used for pathway activity prediction uses a
standard binary regression model in combination with SVDs.
Suppose a binary phenotype, such as disease class, and
expression levels for p genes are collected on n independent
samples. The n × 1 response vector y and the p × n gene
expression matrix X can be related using the probit regression
model, E [Y] = Φ(X'
β
), where
Φ
is the cumulative distribution
function of the standard normal distribution. In microarray
studies, we usually have p >> n and this makes inference of
the regression coefficients,
β
, unstable. To circumvent this
problem, a SVD is applied to X, X = ADF. The probit model
can then be written as E [Y] = Φ(F'DA'
β
) = Φ(F'
θ
), where F
is n × n matrix of metagenes and
θ
= DA'
β
. SVD therefore
reduces the dimensionality of the parameter space. The
parameter estimation on θ is implemented using MCMC sim-
ulation methods and Bayesian inference [7]. The software is
implemented in Matlab and is available for download [12].
Pathway signature analysis
To construct a pathway activity predictor for TGFβ, we first
performed a 1.5-fold change based filtration on TGFβ1-
treated versus untreated NMuMG microarray data. To obtain
a TGFβ pathway predictor, we trained SVD binary regression
using the differentially regulated genes. The parameters that
were used to train SVD binary regression were chosen accord-
ing to described guidelines [4]. For the MCMC procedure, we
used 5,000 iterations for burn-in and 5,000 iterations to esti-
mate regression coefficients. To predict TGFβ pathway activ-
ity on a new sample, we used the learned parameters to
project that sample onto the principal component space and
computed the probability of pathway activation. The same
parameters were used to construct a Ras pathway predictor.
The genes that are in common between TGFβ and Ras path-
way signatures are listed in Additional data file 3.
Immunofluorescence analysis
Mammary tissues embedded in Optimal cutting temperature
compound (OCT) (Torrance, CA, USA) were sectioned at 8
μm and fixed for 10 minutes in 4% neutral buffered parafor-
maldehyde. Following three 10-minute rinses in phosphate-
Genome Biology 2008, Volume 9, Issue 12, Article R180 Liu et al. R180.10
Genome Biology 2008, 9:R180
buffered saline (PBS), antigen retrieval was performed by
heating sections in pH 6.0 citrate buffer. Sections were then
rinsed in PBS and incubated in blocking buffer (5% bovine
serum albumin, 0.3% Triton X-100, 10% normal goat serum,
in PBS) for 1.5 h at ambient temperature. Primary antibodies
diluted in blocking buffer were applied to each section and
incubated at 4°C overnight. Unbound primary antibody was
removed with three 10-minute rinses in wash buffer (0.3%
Triton X-100 in PBS), and sections were subsequently stained
with Alexa Fluor
®
488 or 567 conjugated goat IgG serum
raised against the host of the primary antibodies (Molecular
Probes, Carlsbad, CA, USA). Stained sections were rinsed for
10 minutes in wash buffer and twice for 10 minutes each in
PBS. Nuclei were counterstained with 1 μg/ml Hoechst 33258
dye, mounted in Fluoromount-G (SouthernBiotech, Birming-
ham, AL, USA), and visualized using a Leica DMRXE micro-
scope.
Immunoprecipitation and western blot analysis
Tissue lysates were prepared from snap frozen mammary tis-
sues or NMuMG cells by Dounce homogenization using a
magnesium lysis buffer (Upstate Biologicals, Billerica, MA,
USA). The levels of Ras-GTP or RalA/B-GTP were detected
using Ras and RalA activation kits (Upstate Biologicals)
according to the manufacturer's instructions. Western blot
analysis was performed as described [40]. The following pri-
mary antibodies were used for western blot analysis: anti-
phospho-MEK1/2 (Ser217/221; Cell Signaling, Danvers, MA,
USA); anti-phospho-Smad1/3 (Ser423/425; Cell Signaling);
anti-Smad3 (Santa Cruz, CA, USA); anti-phospho-Akt
(Ser437; Cell Signaling); anti-Akt (Cell Signaling); and anti-β-
tubulin (Biogenex, San Ramon, CA, USA). Secondary anti-
bodies were horseradish peroxidase-conjugated goat anti-
mouse and horseradish peroxidase-conjugated goat anti-rab-
bit antibodies (Jackson ImmunoResearch, West Grove, PA,
USA). All primary antibodies were incubated at 4°C over-
night. Secondary antibodies were incubated for 1 h at room
temperature.
Abbreviations
GSEA: gene set enrichment analysis; MAPK: mitogen-acti-
vated protein kinase; MCMC: Markov Chain Monte Carlo;
PBS: phosphate-buffered saline; PCA: principal component
analysis; SVD: singular value decomposition; TGFβ: trans-
forming growth factor beta.
Authors' contributions
ZL, MGT, and LAC conceived the study. ZL and TCP per-
formed the computational studies. MW, JVA, MEB, and CCC
carried out the biochemical validation experiments. ZL, MW,
JVA, CD, MGT, and LAC drafted the manuscript. All authors
read and approved the final manuscript.
Additional data files
The following additional data are available with the online
version of this paper. Additional data file 1 is a spreadsheet of
the gene signature for TGFβ pathway, including probe set ID,
log fold change, gene name, Entrez ID, and gene symbol.
Additional data file 2 is a spreadsheet of the Gene signature
for Ras pathway, including probe set ID, log fold change, gene
name, Entrez ID, and gene symbol. Additional data file 3 is a
spreadsheet of the genes in common between TGFβ signature
and Ras signature.
Additional data file 1Gene signature for TGFβ pathway, including probe set ID, log fold change, gene name, Entrez ID, and gene symbolGene signature for TGFβ pathway, including probe set ID, log fold change, gene name, Entrez ID, and gene symbol.Click here for fileAdditional data file 2Gene signature for Ras pathway, including probe set ID, log fold change, gene name, Entrez ID, and gene symbolGene signature for Ras pathway, including probe set ID, log fold change, gene name, Entrez ID, and gene symbol.Click here for fileAdditional data file 3Genes in common between TGFβ signature and Ras signatureGenes in common between TGFβ signature and Ras signature.Click here for file
Acknowledgements
We thank Kate Dugan for performing the Affymetrix hybridization, Dhruv
Pant for helpful discussions, and the reviewers for providing helpful com-
ments on the experiments and manuscript. This work was supported by
grants W81-XWH-06-1-0771 (ZL), W81-XWH-07-1-0420 (JVA), W81-
XWH-04-1-0431 (MW), and W81-XWH-05-1-0405 from the US Army
Breast Cancer Research Program and grants CA98371, and CA105490
from the National Cancer Institute.
References
1. Hanahan D, Weinberg RA: The hallmarks of cancer. Cell 2000,
100:57-70.
2. Golub TR, Slonim DK, Tamayo P, Huard C, Gaasenbeek M, Mesirov
JP, Coller H, Loh ML, Downing JR, Caligiuri MA, Bloomfield CD,
Lander ES: Molecular classification of cancer: class discovery
and class prediction by gene expression monitoring. Science
1999, 286:531-537.
3. Wood LD, Parsons DW, Jones S, Lin J, Sjoblom T, Leary RJ, Shen D,
Boca SM, Barber T, Ptak J, Silliman N, Szabo S, Dezso Z, Ustyanksky
V, Nikolskaya T, Nikolsky Y, Karchin R, Wilson PA, Kaminker JS,
Zhang Z, Croshaw R, Willis J, Dawson D, Shipitsin M, Willson JK,
Sukumar S, Polyak K, Park BH, Pethiyagoda CL, Pant PV, et al.: The
genomic landscapes of human breast and colorectal cancers.
Science 2007, 318:1108-1113.
4. Bild AH, Yao G, Chang JT, Wang Q, Potti A, Chasse D, Joshi MB, Har-
pole D, Lancaster JM, Berchuck A, Olson JA Jr, Marks JR, Dressman
HK, West M, Nevins JR: Oncogenic pathway signatures in
human cancers as a guide to targeted therapies. Nature 2006,
439:353-357.
5. Potti A, Dressman HK, Bild A, Riedel RF, Chan G, Sayer R, Cragun J,
Cottrill H, Kelley MJ, Petersen R, Harpole D, Marks J, Berchuck A,
Ginsburg GS, Febbo P, Lancaster J, Nevins JR: Genomic signatures
to guide the use of chemotherapeutics. Nat Med 2006,
12:1294-1300.
6. Potti A, Mukherjee S, Petersen R, Dressman HK, Bild A, Koontz J,
Kratzke R, Watson MA, Kelley M, Ginsburg GS, West M, Harpole DH
Jr, Nevins JR: A genomic strategy to refine prognosis in early-
stage non-small-cell lung cancer. New Engl J Med 2006,
355:570-580.
7. West M, Blanchette C, Dressman H, Huang E, Ishida S, Spang R, Zuzan
H, Olson JA Jr, Marks JR, Nevins JR: Predicting the clinical status
of human breast cancer by using gene expression profiles.
Proc Natl Acad Sci USA 2001, 98:11462-11467.
8. Sneige N: Utility of cytologic specimens in the evaluation of
prognostic and predictive factors of breast cancer: current
issues and future directions. Diagn Cytopathol 2004, 30:158-165.
9. Subramanian A, Tamayo P, Mootha VK, Mukherjee S, Ebert BL, Gil-
lette MA, Paulovich A, Pomeroy SL, Golub TR, Lander ES, Mesirov JP:
Gene set enrichment analysis: a knowledge-based approach
for interpreting genome-wide expression profiles. Proc Natl
Acad Sci USA 2005, 102:15545-15550.
10. Sweet-Cordero A, Mukherjee S, Subramanian A, You H, Roix JJ, Ladd-
Acosta C, Mesirov J, Golub TR, Jacks T: An oncogenic KRAS2
expression signature identified by cross-species gene-
expression analysis.
Nat Genet 2005, 37:48-55.
11. Efron B, Tibshirani R: On testing the significance of sets of
genes. Ann Appl Stat 2007, 1:107-129.
12. Huang E, Ishida S, Pittman J, Dressman H, Bild A, Kloos M, D'Amico
Genome Biology 2008, Volume 9, Issue 12, Article R180 Liu et al. R180.11
Genome Biology 2008, 9:R180
M, Pestell RG, West M, Nevins JR: Gene expression phenotypic
models that predict the activity of oncogenic pathways. Nat
Genet 2003, 34:226-230.
13. Kretzschmar M, Doody J, Timokhina I, Massague J: A mechanism of
repression of TGFbeta/Smad signaling by oncogenic Ras.
Genes Dev 1999, 13:804-816.
14. Alexandrow MG, Moses HL: Transforming growth factor beta
and cell cycle regulation. Cancer Res 1995, 55:1452-1457.
15. Oft M, Peli J, Rudaz C, Schwarz H, Beug H, Reichmann E: TGF-beta1
and Ha-Ras collaborate in modulating the phenotypic plas-
ticity and invasiveness of epithelial tumor cells. Genes Dev
1996, 10:2462-2477.
16. Janda E, Lehmann K, Killisch I, Jechlinger M, Herzig M, Downward J,
Beug H, Grunert S: Ras and TGF[beta] cooperatively regulate
epithelial cell plasticity and metastasis: dissection of Ras sig-
naling pathways. J Cell Biol 2002, 156:299-313.
17. Lehmann K, Janda E, Pierreux CE, Rytomaa M, Schulze A, McMahon
M, Hill CS, Beug H, Downward J: Raf induces TGFbeta produc-
tion while blocking its apoptotic but not invasive responses:
a mechanism leading to increased malignancy in epithelial
cells. Genes Dev 2000, 14:2610-2622.
18. Luo X, Ding L, Xu J, Chegini N: Gene expression profiling of lei-
omyoma and myometrial smooth muscle cells in response
to transforming growth factor-beta. Endocrinology 2005,
146:1097-1118.
19. Zawel L, Yu J, Torrance CJ, Markowitz S, Kinzler KW, Vogelstein B,
Zhou S: DEC1 is a downstream target of TGF-beta with
sequence-specific transcriptional repressor activities. Proc
Natl Acad Sci USA 2002, 99:2848-2853.
20. Kutz SM, Higgins CE, Samarakoon R, Higgins SP, Allen RR, Qi L, Hig-
gins PJ: TGF-beta 1-induced PAI-1 expression is E box/USF-
dependent and requires EGFR signaling. Exp Cell Res 2006,
312:1093-1105.
21. Bartholin L, Wessner LL, Chirgwin JM, Guise TA: The human
Cyr61 gene is a transcriptional target of transforming
growth factor beta in cancer cells. Cancer Lett 2007,
246:230-236.
22. Irizarry RA, Hobbs B, Collin F, Beazer-Barclay YD, Antonellis KJ,
Scherf U, Speed TP: Exploration, normalization, and summa-
ries of high density oligonucleotide array probe level data.
Biostatistics 2003, 4:249-264.
23. Tusher VG, Tibshirani R, Chu G: Significance analysis of micro-
arrays applied to the ionizing radiation response. Proc Natl
Acad Sci USA 2001, 98:5116-5121.
24. Irizarry RA, Bolstad BM, Collin F, Cope LM, Hobbs B, Speed TP:
Summaries of Affymetrix GeneChip probe level data. Nucleic
Acids Res 2003, 31:e15.
25. Yue J, Mulder KM: Requirement of Ras/MAPK pathway activa-
tion by transforming growth factor beta for transforming
growth factor beta 1 production in a Smad-dependent path-
way. J Biol Chem 2000, 275:30765-30773.
26. Wakefield LM, Piek E, Bottinger EP: TGF-beta signaling in mam-
mary gland development and tumorigenesis. J Mammary Gland
Biol Neoplasia 2001, 6:67-82.
27. Kim ES, Kim MS, Moon A: Transforming growth factor (TGF)-
beta in conjunction with H-ras activation promotes malig-
nant progression of MCF10A breast epithelial cells. Cytokine
2005, 29:84-91.
28. Valcourt U, Kowanetz M, Niimi H, Heldin CH, Moustakas A: TGF-
beta and the Smad signaling pathway support transcrip-
tomic reprogramming during epithelial-mesenchymal cell
transition. Mol Biol Cell 2005, 16:1987-2002.
29. Wisdom R, Huynh L, Hsia D, Kim S: RAS and TGF-beta exert
antagonistic effects on extracellular matrix gene expression
and fibroblast transformation. Oncogene 2005, 24:7043-7054.
30. Sarkisian CJ, Keister BA, Stairs DB, Boxer RB, Moody SE, Chodosh
LA: Dose-dependent oncogene-induced senescence in vivo
and its evasion during mammary tumorigenesis. Nat Cell Biol
2007, 9:
493-505.
31. Wang M, Master SR, Chodosh LA: Computational expression
deconvolution in a complex mammalian organ. BMC Bioinfor-
matics 2006, 7:328.
32. Davies M, Robinson M, Smith E, Huntley S, Prime S, Paterson I:
Induction of an epithelial to mesenchymal transition in
human immortal and malignant keratinocytes by TGF-beta1
involves MAPK, Smad and AP-1 signalling pathways. J Cell Bio-
chem 2005, 95:918-931.
33. Pierce DF Jr, Gorska AE, Chytil A, Meise KS, Page DL, Coffey RJ Jr,
Moses HL: Mammary tumor suppression by transforming
growth factor beta 1 transgene expression. Proc Natl Acad Sci
USA 1995, 92:4254-4258.
34. Alter O, Golub GH: Integrative analysis of genome-scale data
by using pseudoinverse projection predicts novel correlation
between DNA replication and RNA transcription. Proc Natl
Acad Sci USA 2004, 101:16577-16582.
35. Alter O, Golub GH: Reconstructing the pathways of a cellular
system from genome-scale signals by using matrix and ten-
sor computations. Proc Natl Acad Sci USA 2005, 102:17559-17564.
36. Daily JP, Scanfeld D, Pochet N, Le Roch K, Plouffe D, Kamal M, Sarr
O, Mboup S, Ndir O, Wypij D, Levasseur K, Thomas E, Tamayo P,
Dong C, Zhou Y, Lander ES, Ndiaye D, Wirth D, Winzeler EA,
Mesirov JP, Regev A: Distinct physiological states of Plasmodium
falciparum in malaria-infected patients. Nature 2007,
450:1091-1095.
37. Tamayo P, Scanfeld D, Ebert BL, Gillette MA, Roberts CW, Mesirov
JP: Metagene projection for cross-platform, cross-species
characterization of global transcriptional states. Proc Natl
Acad Sci USA 2007, 104:5959-5964.
38. Gunther EJ, Belka GK, Wertheim GB, Wang J, Hartman JL, Boxer RB,
Chodosh LA: A novel doxycycline-inducible system for the
transgenic analysis of mammary gland biology. Faseb J 2002,
16:283-292.
39. Marquis ST, Rajan JV, Wynshaw-Boris A, Xu J, Yin GY, Abel KJ,
Weber BL, Chodosh LA: The developmental pattern of Brca1
expression implies a role in differentiation of the breast and
other tissues. Nat Genet
1995, 11:17-26.
40. Jang JW, Boxer RB, Chodosh LA: Isoform-specific ras activation
and oncogene dependence during MYC- and Wnt-induced
mammary tumorigenesis. Mol Cell Biol 2006, 26:8109-8121.