Báo cáo y học: " Analysis of the platypus genome suggests a transposon origin for mammalian imprinting" ppt
Bạn đang xem bản rút gọn của tài liệu. Xem và tải ngay bản đầy đủ của tài liệu tại đây (448.91 KB, 8 trang )
Genome Biology 2009, 10:R1
Open Access
2009Pasket al.Volume 10, Issue 1, Article R1
Research
Analysis of the platypus genome suggests a transposon origin for
mammalian imprinting
Andrew J Pask
¤
*†
, Anthony T Papenfuss
¤
‡
, EleanorIAger
*
,
Kaighin A McColl
‡
, Terence P Speed
‡
and Marilyn B Renfree
*
Addresses:
*
Department of Zoology, The University of Melbourne, Melbourne, Victoria 3010, Australia.
†
Department of Molecular and Cellular
Biology, The University of Connecticut, Storrs, CT 06269, USA.
‡
Bioinformatics Division, The Walter and Eliza Hall Institute, 1G Royal Parade,
Parkville, Victoria 3050, Australia.
¤ These authors contributed equally to this work.
Correspondence: Andrew J Pask. Email:
© 2009 Pask et al.; licensee BioMed Central Ltd.
This is an open access article distributed under the terms of the Creative Commons Attribution License ( which
permits unrestricted use, distribution, and reproduction in any medium, provided the original work is properly cited.
The evolution of imprinting<p>Comparisons between the platypus and eutherian mammalian genomes provides new insights into how epigenetic imprinting may have evolved in mammalian genomes.</p>
Abstract
Background: Genomic imprinting is an epigenetic phenomenon that results in monoallelic gene
expression. Many hypotheses have been advanced to explain why genomic imprinting evolved in
mammals, but few have examined how it arose. The host defence hypothesis suggests that
imprinting evolved from existing mechanisms within the cell that act to silence foreign DNA
elements that insert into the genome. However, the changes to the mammalian genome that
accompanied the evolution of imprinting have been hard to define due to the absence of large scale
genomic resources between all extant classes. The recent release of the platypus genome has
provided the first opportunity to perform comparisons between prototherian (monotreme; which
appear to lack imprinting) and therian (marsupial and eutherian; which have imprinting) mammals.
Results: We compared the distribution of repeat elements known to attract epigenetic silencing
across the entire genome from monotremes and therian mammals, particularly focusing on the
orthologous imprinted regions. There is a significant accumulation of certain repeat elements
within imprinted regions of therian mammals compared to the platypus.
Conclusions: Our analyses show that the platypus has significantly fewer repeats of certain classes
in the regions of the genome that have become imprinted in therian mammals. The accumulation
of repeats, especially long terminal repeats and DNA elements, in therian imprinted genes and gene
clusters is coincident with, and may have been a potential driving force in, the development of
mammalian genomic imprinting. These data provide strong support for the host defence
hypothesis.
Published: 2 January 2009
Genome Biology 2009, 10:R1 (doi:10.1186/gb-2009-10-1-r1)
Received: 21 November 2008
Accepted: 2 January 2009
The electronic version of this article is the complete one and can be
found online at /> Genome Biology 2009, Volume 10, Issue 1, Article R1 Pask et al. R1.2
Genome Biology 2009, 10:R1
Background
Genomic imprinting is an epigenetic phenomenon that
results in monoallelic gene expression. Amongst mammals, it
has only been identified in the therians (marsupials and euth-
erians). Many hypotheses have been advanced to explain why
genomic imprinting evolved in mammals, but few have exam-
ined how it arose [1]. The retention of genomic imprinting
must confer an evolutionary advantage since the resulting
haploinsufficiency is frequently associated with increased
susceptibility to disease [2]. The most widely accepted
hypothesis to explain why mammalian imprinting may have
been retained is the 'kinship hypothesis' [3,4]. This suggests
that imprinting evolved to regulate nutrient exchange
between the mother and the developing fetus [4]. Indeed,
almost all the imprinted genes identified thus far are widely
expressed in the eutherian placenta [5], a primary site of
nutrient exchange. Genomic imprinting is, therefore, thought
to be absent in the egg-laying monotremes, as it is in other egg
laying, non-mammalian amniotes [6], where maternal-fetal
nutrient exchange is minimal. Furthermore, investigations of
four imprinted therian genes have failed to detect any evi-
dence for genomic imprinting in the monotremes: IGF2 [6],
IGF2R [7] and UBE3A [8] are biallelically expressed in the
platypus while PEG10 [9] is absent.
Until now, no one has been able to examine at the genome
level how imprinting may have evolved due to the absence of
large scale genomic resources available for all classes of mam-
mals. Genomic imprinting may have evolved from the same
mechanisms that silence transposable elements and invading
foreign DNA within the genome. This is referred to as the host
defence hypothesis [10] and is supported by the observation
that most imprinted genes in eutherians are associated with
repeat sequences and endogenous retroviruses [11,12]. The
recently sequenced platypus genome [13] provides the key
resource to examine how imprinting evolved, since it is
thought to have arisen after the divergence of this group from
the therian mammals. While a number of imprinted gene
orthologues have now been mapped in the platypus [14], with
the exception of the DLK1 locus [15], there has been limited
detailed analyses of their surrounding genomic context.
Comparative analyses of the PEG10 locus between therian
mammals, the platypus and chicken provided the first evi-
dence that retrotransposition is directly involved in the acqui-
sition of genomic imprinting [9]. Insertion of PEG10 in the
therian genome was coincident with its differential methyla-
tion, established by host defence mechanisms. This was then
selected for and maintained in the therian genome [9]. The
host defence hypothesis predicts that an accumulation of for-
eign DNA elements would have occurred in all imprinted
regions in therians. To gain a greater understanding of how
imprinted regions have evolved and to comprehensively test
the host defence hypothesis, we have examined, on a genome
scale, the conservation of synteny and accumulation of
repeats and retrotransposed elements within therian-
imprinted regions by comparison with the entire platypus
genome.
Results
Imprinted region conservation
To determine imprinted gene conservation, we identified
orthologous regions for all known eutherian imprinted genes
across several mammalian species (n = 19 regions, encom-
passing 131 genes; Additional data file 4). We then examined
orthologous sequences for all therian imprinted genes or
regions that could be identified in the platypus genome (a
subset is graphically represented in Figure 1, representing
eutherian imprinted genes that are isolated (a single
imprinted gene within a non-imprinted region) or in small or
large imprinted clusters (two or more imprinted genes in
close association)). We then determined the gene arrange-
ment and sequence conservation of each orthologous region
(Figure 1). In cases where the platypus was uninformative,
due to incomplete assembly, the ancestral gene arrangement
was confirmed by comparisons to the chicken genome.
Orthologous sequences of the regions examined from human
(NCBI 36), mouse (NCBI m36), dog (CanFam 2.0), opossum
(MonDom5), platypus (OrnAna 5.0.1) and chicken
(WASHUC2) were identified using gene orthology relation-
ships from Ensembl (Release 44) [16]. Multiple alignments of
each region were constructed using MLAGAN with translated
anchoring [17]. Where syntenic regions in opossum or platy-
pus were not contiguous or not assembled into a single
sequence, the fragments were concatenated (with 60 'N's
inserted between regions) for the purpose of alignment. This
analysis confirmed that eutherian imprinted clusters are not
recent assemblages, but instead reside in ancient syntenic
mammalian groups. In some cases, these platypus regions
lacked genes that have arisen specifically in the therians by
mechanisms such as gene duplication or retrotransposition.
Across all regions and species examined, sequence conserva-
tion was highest within the protein coding portions. The
majority of intronic sequences showed little to no conserva-
tion across all species. However, there were some intronic
regions that had high levels of sequence conservation, which
may reflect non-coding RNAs, unannotated coding regions,
or gene regulatory or enhancer elements (Figure 1).
Repeat distribution across the entire genome and in
orthologous imprinted regions
We then examined the distribution of repeat elements known
to attract silencing by host defence mechanisms (long inter-
spersed nuclear element, short interspersed nuclear elements
(SINEs), long terminal repeats (LTRs), low complexity and
simple repeats and small non-coding RNAs) across the entire
genome and within regions that are orthologous to eutherian
imprinted regions (n = 19 regions, encompassing 131 genes;
Figure 2; Additional data file 4) [13]. A summary of the repeat
analysis across the orthologous gene clusters is presented in
Figure 3a, and across the entire genome in Figure 3b (the pro-
Genome Biology 2009, Volume 10, Issue 1, Article R1 Pask et al. R1.3
Genome Biology 2009, 10:R1
portion of repeats for each individual gene cluster is shown in
detail in Additional data file 2a, b; the statistical analysis of
these data is shown in Additional data file 5a, b). In the
orthologous imprinted regions examined, the total propor-
tion of sequence located in repeats of all types was not signif-
icantly different between platypus and other species (Figure
3a). However, the proportion of some specific repeat ele-
ments differed significantly between the monotremes and
therian mammals (Additional data file 5). There were signifi-
cantly fewer LTR elements (p ≤ 0.002) and DNA elements (p
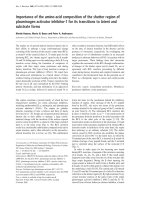
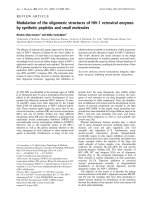
Sequence conservation for seven of the investigated platypus regions orthologous to imprinted regions in humanFigure 1
Sequence conservation for seven of the investigated platypus regions orthologous to imprinted regions in human. Each region shown is
syntenic in the platypus. The top line shows the gene structure of the region (exons represented by boxes, introns by connecting lines). Human imprint
status for the genes is indicated, with paternally imprinted genes shown in blue, maternally imprinted genes shown in red and non-imprinted genes or
unknown status shown in black. The percentage identity (%ID) plot over the region for human compared to dog (top panel) and platypus (bottom panel)
is shown beneath the gene structure for each region. As expected, conservation is higher between human and dog than human and platypus, reflecting
their divergence times. The gene coding sequences are the most highly conserved, with little or no conservation found within intronic sequences. While
most regions show a high degree of conservation, there is little seen throughout the DIO3/DLK cluster.
0 36409 72819 109229 145639 182049
100
0
100
0
%ID
WT1 WIT1
100
0
100
0
%ID
GNAS
0 93016 186033 279049 372066 465083
0 264646 529293 793940 1058587 1323234
100
0
100
0
%ID
IGF2R
SLC22A1
SLC22A2
SLC22A3
0 26478 52956 79434 105912 132390
100
0
100
0
%ID
PLAGL1
0 105020 210041 315061 420082 525103
100
0
100
0
%ID
GRB10
MESTCPA1
CPA4 CPA5 TSGA14 MESTIT1
COPG2
0 147980 295960 443940 591920 739901
%ID
100
0
100
0
100
0
100
0
%ID
DLK1 RTL1 NP_001004332.1 DIO3
0 680068 1360136 2040204 2720272 3400340
Genome Biology 2009, Volume 10, Issue 1, Article R1 Pask et al. R1.4
Genome Biology 2009, 10:R1
≤ 0.02) in the platypus compared to all therian species. Long
interspersed nuclear elements (p ≤ 1), small RNAs (p ≤ 1) and
low complexity repeats (p ≤ 1) were not significantly different
across all regions in the platypus compared to other species.
The proportion of SINEs in the platypus was significantly
higher when compared to orthologous regions in eutherians
(p ≤ 0.02), but not with opossum (p = 0.06). However, this
SINE increase is not unique to imprinted regions, but the
result of the higher average SINE content of the platypus
genome (20%) compared to eutherian mammals (8-13%)
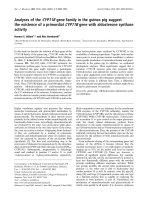
Comparison of the spatial distribution of repeats for (a) an imprinted gene that is not in a cluster (WT1) and (b) an imprinted cluster (IGF2R) across the species examined in our analysisFigure 2
Comparison of the spatial distribution of repeats for (a) an imprinted gene that is not in a cluster (WT1) and (b) an imprinted cluster
(IGF2R) across the species examined in our analysis. The repeat element distribution is shown as color-coded vertical lines in tracks for each
species. There is a dramatic change in the number and spatial distribution of repeats between eutherians and platypus. There is also an increase in the
number and size of CpG islands throughout the regions examined. Large-scale accumulation of repeats appears to have occurred after the bird-mammal
divergence, with significantly fewer repeats of all classes seen in the chicken. The repeat distribution across an additional five regions of various sizes can
be viewed in Additional data file 1. LINE, long interspersed nuclear element.
SINEs LINEs LTRs DNA elements
Small RNAs Simple repeats Low complexity CpGs
Human
Mouse
Dog
Opossum
Platypus
Chicken
0 264646 529293 793940 1058587 1323234
IGF2R
SLC22A1
SLC22A2
SLC22A3
Human
Mouse
Dog
Opossum
Platypus
Chicken
0 36409 72819 109229 145639 182049
WT1
WIT1
(a)
(b)
Genome Biology 2009, Volume 10, Issue 1, Article R1 Pask et al. R1.5
Genome Biology 2009, 10:R1
[13,18]. In contrast, the chicken had noticeably fewer total
repeats and no SINEs or small RNAs, suggesting that the
accumulation of these elements is a feature of the mammalian
genome (Figure 3a). Repeat distribution analyses throughout
the entire genomes of the species examined (Figure 3b; Addi-
tional data file 5a, b) demonstrate that the repeat accumula-
tion is not restricted to the orthologous regions examined, but
is a feature of the genomes as a whole. However, this analysis
is at too coarse a level to identify specific and possibly small
changes that can result in the acquisition of imprinting, such
as the insertion of a single retrotransposon at the PEG10
locus [9].
CpG island distribution
In the eutherians, the predominant mechanism of gene
silencing is due to differential methylation of CpG islands,
located in or near imprinted genes [19-21]. Therefore, we also
examined the distribution of CpG islands within the ortholo-
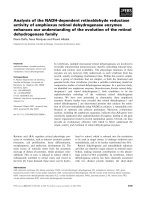
Box-and-whiskers plot of the percent of sequence in each class of repeat element in (a) imprinted clusters (n = 19 covering 131 genes) and (b) the entire genome of each speciesFigure 3
Box-and-whiskers plot of the percent of sequence in each class of repeat element in (a) imprinted clusters (n = 19 covering 131 genes)
and (b) the entire genome of each species. Repeat sequences that had significantly different proportions in the platypus from all therian genomes are
marked by double asterisks. Boxes indicate the interquartile range with whiskers showing the full range for each data set. Black lines within boxes indicate
the median value. There are significantly fewer LTR and DNA elements across the platypus orthologous imprinted regions compared to all other
mammalian species. Chicken has noticeably fewer total repeats and no SINEs or small RNAs. C, chicken; D, dog; H, human; M, mouse; O, opossum; P,
platypus. LINE, long interspersed nuclear element.
0
10
20
30
40
% repeat sequence
SINEs
0
20
40
60
0.0
0.2
0.4
0.6
0.8
1.0
1.2
1.4
% repeat sequence
Small RNAs
0
20
40
60
80
HMDOPC HMDOPC
HMDOPCHMDOPC
0
10
20
30
40
% repeat sequence
LTRs
0
1
2
3
4
5
6
7
% repeat sequence
DNA elements
0
2
4
6
8
% repeat sequence
Simple repeats
0.0
0.5
1.0
1.5
2.0
2.5
3.0
3.5
% repeat sequence
Low complexity regions
HMDOPCHMDOPC
HMDOPCHMDOPC
% repeat sequence% repeat sequence
LINEs
Total Repeats
(b)
HMDOPC
0
5
10
15
% repeat sequence
LTRs
0
2
4
6
8
% repeat sequence
DNA elements
0
1
2
3
4
5
% repeat sequence
Simple repeats
0.0
0.5
1.0
1.5
2.0
% repeat sequence
Low complexity regions
0
5
10
15
20
25
30
35
% repeat sequence
SINEs
0
10
20
30
40
% repeat sequence
LINEs
0.0
0.1
0.2
0.3
0.4
% repeat sequence
Small RNAs
0
10
20
30
40
50
60
% repeat sequence
Total repeats
HMDOPC
HMDOPC
HMDOPCHMDOPC
HMDOPC
HMDOPCHMDOPC
****
****
(a)
Genome Biology 2009, Volume 10, Issue 1, Article R1 Pask et al. R1.6
Genome Biology 2009, 10:R1
gous imprinted clusters from all species (Figure 2; Additional
data file 1). Given the overall high G-C content of the platypus
genome compared to that of other mammals (45.5% in platy-
pus versus 40% in eutherians [13]), it is surprising that the
platypus gene clusters have relatively few CpG islands com-
pared to all other mammalian species. This suggests that, in
addition to an increase in repeat elements, the accumulation
of CpG islands was also coincident with the acquisition of
imprinting in the therian mammals and may have evolved as
a secondary mechanism to stabilize the silencing mechanism.
Discussion
Our platypus genome analyses have confirmed that eutherian
imprinted clusters are not recent assemblages, but instead
reside in ancient syntenic mammalian groups, as previously
suggested (based on analysis of orthologues of eight
imprinted genes in the platypus) [14]. In fact, the arrange-
ment of most clusters appears to predate the divergence of
birds and mammals as shown by the analysis of 61 genes over
12 clusters in non-mammalian vertebrate genomes [22].
Despite the conservation of gene arrangement within most
orthologous imprinted gene clusters between all species
examined, the regions have expanded greatly in the therian
mammals compared to the platypus and chicken (Additional
data file 3). This is particularly noticeable in the IGF2 and
SDHD imprinted regions (Additional data file 2a, b), which
show a rapid expansion in the therian mammals after diver-
gence from the monotremes. The IGF2 region is the best-
characterised imprinted domain among the mammals and is
imprinted in both marsupials and eutherian mammals [1],
but not in the monotremes [6]. The expansion of repeat
classes within this cluster unequivocally coincides with the
acquisition of imprinting to this region.
Analysis of the change in copy number of specific repeat
classes showed that the platypus genome has significantly
fewer LTRs and DNA elements within the gene clusters that
became imprinted in the therian mammals. We suggest that
the accumulation of LTRs and DNA elements in the therian
genome is coincident with, and may have been the driving
force in, the development of mammalian genomic imprinting.
LTRs comprise a particularly interesting class of repeat, as
they are almost entirely absent from the platypus genome.
Likewise, DNA elements are substantially lower in most, but
not all, orthologous imprinted regions in the platypus and
throughout the entire genome.
While the change in the incidence of repeats between platy-
pus and therian mammals is only significant for LTRs and
DNA elements across all regions combined, examination of
each region individually indicates significant changes in other
repeat classes within several specific regions. For example,
the GNAS locus in eutherians has levels of DNA elements that
are well below those in the platypus. However, the proportion
of simple repeats for this region is dramatically higher in
eutherians than in platypus. Similarly, low-complexity
repeats are almost absent from the RASGRF1 locus in platy-
pus, but increase rapidly in all other mammalian groups
(Additional data file 2). This suggests that genomic imprint-
ing may not be induced by a single class of repeat elements in
all regions but rather an increase in any repeat type at a given
locus.
Host defence mechanisms would also be attracted to repeats
that move within the genome. However, our statistical analy-
ses are limited to the detection of accumulation (insertion
and expansion) of repeats but not their movement within
clusters or the genome. The comparative spatial distribution
of repeats (Additional data file 1) clearly demonstrates the dif-
ferent distribution of repeats within orthologous regions.
Again, using the GNAS locus as an example, while the total
percentage of SINEs is identical for both the platypus and
human locus, in human the SINEs are distributed mainly
within the GNAS gene, while in platypus they are found
mainly within the 5' intergenic region. This could result from
the movement of repeats or independent insertions in differ-
ent lineages. Since our analyses are unable to discriminate
between these events, our statistics are an underestimate of
the changes occurring in the genome that may have attracted
host defence silencing. A more detailed spatial examination of
repeats could also help to explain the acquisition imprinting
at some loci.
Whole genome repeat distribution analyses were also per-
formed to determine if repeat expansion was a general feature
of the mammalian genome or specific to just the orthologous
imprinted regions. Our findings show that, as expected,
repeat expansion is not restricted to certain regions, but a
general feature of the mammalian genome. The random inva-
sion and expansion of LTRs and DNA elements would have
attracted host defence silencing mechanisms to many regions
throughout the entire therian genome. This phenomenon
would occasionally lead to the silencing of surrounding genes,
resulting in a phenotypic effect. Only where this effect con-
ferred an evolutionary advantage (in genes such as those that
control fetal growth and maternal nutrient supply) would it
have been selected for and maintained, creating an imprinted
allele. This imprint can then spread to neighbouring genes,
resulting in the characteristic clusters of silenced (or
imprinted) genes in the genome. This suggestion is supported
by the spread of imprinting observed in the PEG10 locus [9]
and the rapid accumulation of repeat elements within the
IGF2 imprinted gene cluster in therian mammals compared
to the repeat deprived, non-imprinted orthologous domain in
the platypus.
Conclusion
This is the first complete analysis of the repeat distribution in
the entire genome and imprinted clusters across all extant
Genome Biology 2009, Volume 10, Issue 1, Article R1 Pask et al. R1.7
Genome Biology 2009, 10:R1
mammalian lineages. Since imprinting arose only in the
viviparous (therian) mammals and is suggested to have
occurred through the cooption of host defence mechanisms,
comparisons of eutherian and marsupials with the newly
available platypus genome provide the first opportunity for
testing this hypothesis. Our findings provide strong, genome-
wide support for the host defence hypothesis to explain the
evolution of genomic imprinting in therian mammals. Our
analyses show that the platypus has significantly fewer
repeats of certain classes in the regions of the genome that
have become imprinted in therian mammals. The accumula-
tion of repeats, especially LTRs and DNA elements, is not spe-
cific to the orthologous imprinted regions but has occurred
throughout the therian genome. Host defence mechanisms
such as DNA methylation would have been attracted to
silence newly inserted foreign elements. This occasionally led
to the silencing (imprinting) of adjacent genes. This 'imprint'
was selected for, and maintained where it conferred an evolu-
tionary advantage - for example, in genes that had functions
in fetal growth, placentation or nutrient exchange - leading to
the evolution of mammalian genomic imprinting.
Materials and methods
Repeat annotations were obtained for the human, mouse,
dog, opossum, platypus and chicken genomes from the UCSC
genome browser. The proportion of sequence in repetitive
elements in imprinted gene clusters (including 20 kb flanking
sequences) was then calculated. The proportion of sequence
in repetitive elements was also calculated in 700 kb blocks
across all genomes (this was the average size of imprinted
clusters in human).
The repeats shown in Figure 2 were identified using Repeat-
Masker [23] for all species except platypus, where the whole-
genome repeat analysis [13] was used. CpG islands (defined
as more than 200 bp of continuous sequence with a C-G per-
centage greater than 60%) that attract methylation in
imprinted regions in eutherian mammals were identified
using a modified version of the CpGLH program by G Miklem
and L Hillier [19].
Statistical analyses were performed using R [24]. For each
repeat family, the proportion of sequence was transformed
using:
To test for differences between the proportions of each repeat
family in each species, all pairwise two-tailed t-tests were per-
formed. The Holm method of correction for multiple testing
was applied [25]. In all tests, n = 19 (gene clusters) and the
significance level was α = 0.05. For comparisons between
platypus and therians or eutherians, the p-values quoted in
the text are the largest of the adjusted p-values for all tests
between platypus and those species considered (therian or
eutherian). Complete results are provided in Additional data
file 5.
Abbreviations
LTR: long terminal repeat; SINE: short interspersed nuclear
element.
Authors' contributions
AJP, ATP and MBR designed the study. ATP, KAM, TPS and
EIA carried out the analyses, calculations and performed the
statistical analyses. AJP, ATP and MBR prepared the manu-
script. All authors read and approved the final manuscript.
Additional data files
The following additional data are available with the online
version of this paper. Additional data file 1 shows the compar-
ison of the spatial distribution of repeats for seven of the
regions examined in our analysis. Additional data file 2 shows
the analysis of percent sequence comprised by each class of
repeat element separated by each region. Additional data file
3 shows a comparative gene map of the IGF2R imprinted
region. Additional data file 4 shows the conservation of
imprinted gene orthologues and regions within the human,
mouse, dog, opossum, platypus and chicken genomes. Addi-
tional data file 5 shows the adjusted p-values from all pairwise
t-tests comparing the transformed proportion of sequence in
each repeat class between each species for the 19 genes and
regions shown in Additional data file 4 and throughout the
entire genome.
Additional data file 1Comparison of the spatial distribution of repeats for seven of the regions examined in our analysisComparison of the spatial distribution of repeats for seven of the regions examined in our analysis.Click here for fileAdditional data file 2Analysis of percent sequence comprised by each class of repeat ele-ment separated by each regionAnalysis of percent sequence comprised by each class of repeat ele-ment separated by each region.Click here for fileAdditional data file 3Comparative gene map of the IGF2R imprinted regionComparative gene map of the IGF2R imprinted region.Click here for fileAdditional data file 4Conservation of imprinted gene orthologues and regions within the human, mouse, dog, opossum, platypus and chicken genomesConservation of imprinted gene orthologues and regions within the human, mouse, dog, opossum, platypus and chicken genomes.Click here for fileAdditional data file 5Adjusted p-values from all pairwise t-tests comparing the trans-formed proportion of sequence in each repeat class between each speciesAdjusted p-values from all pairwise t-tests comparing the trans-formed proportion of sequence in each repeat class between each species for (a) the 19 genes and regions shown in Additional data file 4 and (b) throughout the entire genome. The Holm method of correction for multiple testing was used [25]. Significant results are underlined.Click here for file
Acknowledgements
AJP is supported by a National Health and Medical Research Council RD
Wright Fellowship, and MBR is supported by an Australian Research Coun-
cil Federation Fellowship. ATP, TPS and KMcC are supported by the
National Health and Medical Research Council of Australia.
References
1. O'Neill MJ, Ingram RS, Vrana PB, Tilghman SM: Allelic expression
of IGF2 in marsupials and birds. Dev Genes Evol 2000, 210:18-20.
2. Jiang YH, Bressler J, Beaudet AL: Epigenetics and human disease.
Annu Rev Genomics Hum Genet 2004, 5:479-510.
3. Wilkins JF, Haig D: Parental modifiers, antisense transcripts
and loss of imprinting. Proc Biol Sci 2002, 269:1841-1846.
4. Wilkins JF, Haig D: What good is genomic imprinting: the func-
tion of parent-specific gene expression. Nat Rev Genet 2003,
4:359-368.
5. Fowden AL, Sibley C, Reik W, Constancia M: Imprinted genes, pla-
cental development and fetal growth. Horm Res 2006,
65:50-58.
6. Killian JK, Nolan CM, Stewart N, Munday BL, Andersen NA, Nicol S,
Jirtle RL: Monotreme IGF2 expression and ancestral origin of
genomic imprinting. J Exp Zool 2001, 291:205-212.
7. Killian JK, Byrd JC, Jirtle JV, Munday BL, Stoskopf MK, MacDonald RG,
Jirtle RL: M6P/IGF2R imprinting evolution in mammals. Mol
Cell 2000, 5:707-716.
8. Rapkins RW, Hore T, Smithwick M, Ager E, Pask AJ, Renfree MB,
Kohn M, Hameister H, Nicholls RD, Deakin JE, Graves JA: Recent
assembly of an imprinted domain from non-imprinted com-
′
=
()
pparcsin
Genome Biology 2009, Volume 10, Issue 1, Article R1 Pask et al. R1.8
Genome Biology 2009, 10:R1
ponents. PLoS Genet 2006, 2:e182.
9. Suzuki S, Ono R, Narita T, Pask AJ, Shaw G, Wang C, Kohda T, Alsop
AE, Marshall Graves JA, Kohara Y, Ishino F, Renfree MB, Kaneko-
Ishino T: Retrotransposon silencing by DNA methylation can
drive mammalian genomic imprinting. PLoS Genet 2007, 3:e55.
10. Barlow DP: Methylation and imprinting: from host defense to
gene regulation? Science 1993, 260:309-310.
11. McDonald JF, Matzke MA, Matzke AJ: Host defenses to transpos-
able elements and the evolution of genomic imprinting.
Cytogenet Genome Res 2005, 110:242-249.
12. Hore TA, Rapkins RW, Graves JA: Construction and evolution of
imprinted loci in mammals. Trends Genet 2007, 23:440-448.
13. Warren WC, Hillier LW, Marshall Graves JA, Birney E, Ponting CP,
Grützner F, Belov K, Miller W, Clarke L, Chinwalla AT, Yang SP,
Heger A, Locke DP, Miethke P, Waters PD, Veyrunes F, Fulton L, Ful-
ton B, Graves T, Wallis J, Puente XS, López-Otín C, Ordóñez GR,
Eichler EE, Chen L, Cheng Z, Deakin JE, Alsop A, Thompson K, Kirby
P, et al.: Genome analysis of the platypus reveals unique signa-
tures of evolution. Nature 2008, 453:175-183.
14. Edwards CA, Rens W, Clarke O, Mungall AJ, Hore T, Graves JA, Dun-
ham I, Ferguson-Smith AC, Ferguson-Smith MA: The evolution of
imprinting: chromosomal mapping of orthologues of mam-
malian imprinted domains in monotreme and marsupial
mammals. BMC Evol Biol 2007, 7:157.
15. Edwards CA, Mungall AJ, Matthews L, Ryder E, Gray DJ, Pask AJ, Shaw
G, Graves JA, Rogers J, SAVOIR consortium, Dunham I, Renfree MB,
Ferguson-Smith AC: The evolution of the DLK1-DIO3
imprinted domain in mammals. PLoS Biol 2008, 6:e135.
16. Hubbard TJ, Aken BL, Beal K, Ballester B, Caccamo M, Chen Y, Clarke
L, Coates G, Cunningham F, Cutts T, Down T, Dyer SC, Fitzgerald S,
Fernandez-Banet J, Graf S, Haider S, Hammond M, Herrero J, Holland
R, Howe K, Howe K, Johnson N, Kahari A, Keefe D, Kokocinski F,
Kulesha E, Lawson D, Longden I, Melsopp C, Megy K, et al.:
ENSEMBL 2007. Nucleic Acids Res
2007, 35:D610-617.
17. Brudno M, Do CB, Cooper GM, Kim MF, Davydov E, NISC Compar-
ative Sequencing Program, Green ED, Sidow A, Batzoglou S: LAGAN
and Multi-LAGAN: efficient tools for large-scale multiple
alignment of genomic DNA. Genome Res 2003, 13:721-731.
18. Margulies EH, NISC Comparative Sequencing Program, Maduro VV,
Thomas PJ, Tomkins JP, Amemiya CT, Luo M, Green ED: Compara-
tive sequencing provides insights about the structure and
conservation of marsupial and monotreme genomes. Proc
Natl Acad Sci USA 2005, 102:3354-3359.
19. Gardiner-Garden M, Frommer M: CpG islands in vertebrate
genomes. J Mol Biol 1987, 196:261-282.
20. Rakyan VK, Preis J, Morgan HD, Whitelaw E: The marks, mecha-
nisms and memory of epigenetic states in mammals. Biochem
J 2001, 356:1-10.
21. Reik W, Dean W: DNA methylation and mammalian epigenet-
ics. Electrophoresis 2001, 22:2838-2843.
22. Dünzinger U, Haaf T, Zechner U: Conserved synteny of mamma-
lian imprinted genes in chicken, frog, and fish genomes.
Cytogenet Genome Res 2007, 117:78-85.
23. Repeat Masker [ />24. R [ />25. Holm S: Simple sequentially rejective multiple test proce-
dure. Scandinavian J Stat 1979, 6:65-70.